qpc customer meeting 2012 - march s report on gas and power industry interdependence ... clay basin...
TRANSCRIPT

®
Welcome/Overview
Allan Bradley President and CEO March 2012
®
2011 Highlights
2
Overthrust loop expansion completed in February
ML-104 expansion to Fidlar completed in November
Clay Basin storage capacity expanded by 2.7 Bcf in October
ML-3 (Phase III) replacement project completed in October
®
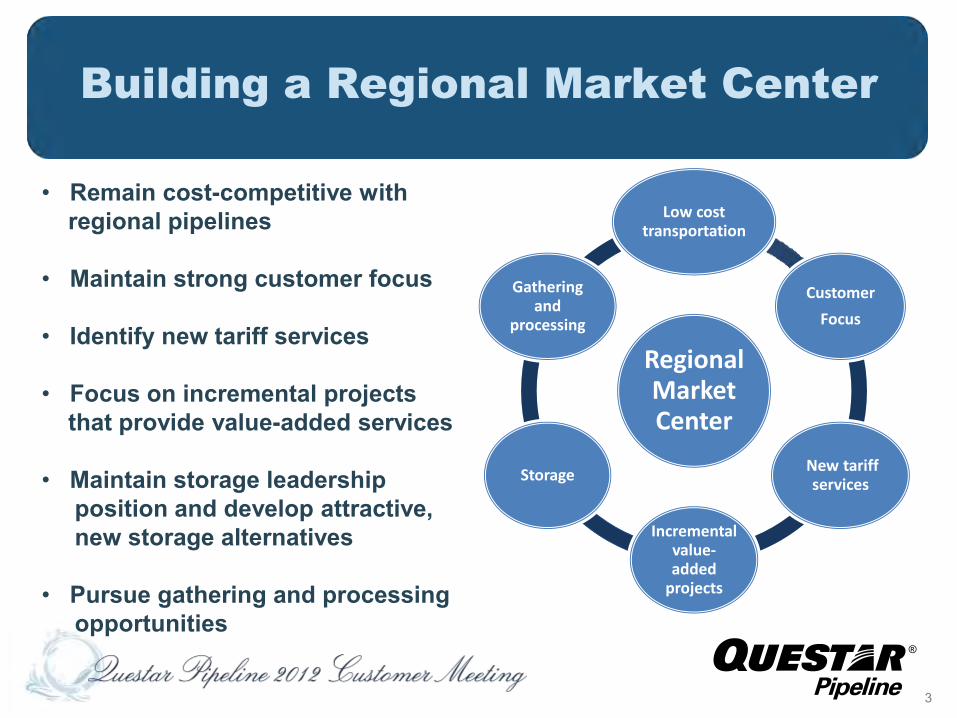
Building a Regional Market Center
3
Regional Market Center
Low cost transportation
Customer
Focus
New tariff services
Incremental value-added
projects
Storage
Gathering and
processing
• Remain cost-competitive with regional pipelines
• Maintain strong customer focus
• Identify new tariff services • Focus on incremental projects that provide value-added services
• Maintain storage leadership position and develop attractive, new storage alternatives
• Pursue gathering and processing opportunities

®
QPC Growth & Efficiency
4
O&M/dth includes Storage and 50% of WRH without QPC Contract
$0.00
$5.00
$10.00
$15.00
$20.00
$25.00
0
1,000,000
2,000,000
3,000,000
4,000,000
5,000,000
6,000,000
2006 2007 2008 2009 2010 2011
Contract Demand Dth/day O&M/dth
®
2012 Goals
Uinta Basin transportation to processing project complete by August
ML-103 extension project complete by December
JL-47 loop project filed with FERC
Complete technical evaluation of Clay Basin 8 Bcf storage capacity expansion

® 5.005.506.006.507.007.508.008.509.009.50
10.0010.5011.0011.5012.0012.5013.0013.5014.0014.5015.0015.50
2006
2007
2008
2009
2010
2011
2012
2013
2014
2015
2016
2017
2018
2019
2020
2021
2022
2023
2024
2025
2026
2027
Bcf/d
Ruby & Bison Pipelines In-
Service
Forecasted Production
REX In-Service
Rockies Production vs. Pipeline
Capacity
6
®
Increasing Focus on Pipeline Safety More PHMSA audits New regulations = higher integrity management costs
Integrating the Gas and Electric Generation Industries NERC’s report on gas and power industry interdependence (Dec. 2011) INGAA FERC filing – Pipelines can support new gas-fired generation plants
(Jan. 2012) Evolving Pipeline Risk Factors
Transportation devaluation due to supply reconfiguration Increased maintenance, safety and environmental costs New project risks
Improving Industry Communications President Obama’s State of the Union Address INGAA Midstream Jobs Study (Feb. 2012) Pipeline safety outreach programs
Issues for the Future

®
QUESTIONS
Thank You!
8

®
Operational Issues
Greg Paige Director, Gas Control and Scheduling

®
Transmission Services
10
2012 PROJECTED LINE WORK

®
11
2012 Projected Line Work:
Questar Pipeline
OPAL
GOSHEN
WAMSUTTER
WHITE RIVER HUB
Overthrust Pipeline
Questar Pipeline
Other Pipelines
Clay Basin Withdrawal Test: •Feb 22 : OFO’s issued to FFS customers for required WD Volumes •Mar 30 – Apr 3: Field limited to physical withdrawal only; no injection nominations accepted •April 3: Reservoir Conditioning •April 4: Reservoir Testing •April 5-18 Reservoir Shut-in •April 19: Return to normal operation
Oak Spring Control System Upgrade •April 5 – 25 ML 104 Capacity limited to approximately 330 Mdth/d during this time.
JL47 / ML40 Tie-In •April 24 – 26 Receipt Points on JL46 and JL47 will be shut in to accommodate this work.

®
12
2012 Projected Line Work:
Questar Pipeline & Overthrust Pipeline
OPAL
GOSHEN
WAMSUTTER
WHITE RIVER HUB
Overthrust Pipeline
Questar Pipeline
Other Pipelines
Overthrust Pipeline System wide maintenance: •September 11, 2012 •Impact to nominations TBD on September flow conditions •Coordinating with REX and KRGT to minimize impact to shippers
Oak Spring DOT’s & Water Wash •August 28 – 29 Reduced ML104 capacity •August 30 ML104 flow reduced to zero
Main Lines 68/103 Tie-In •July 24 – 25 Net east/west nominations in ML68 to zero

®
OVERTHRUST PIPELINE
Transmission Services
13

®
Capacity Scheduling
System operation, and scheduling changed dramatically on November 1, 2011 when the markets shifted to the west, changing the Overthrust direction of flow.
Currently scheduling delivery volumes at Hamm’s Fork and Roberson Creek using KRGT meter capacity limitations.
14
®
Capacity Scheduling Continued
Currently scheduling receipt volumes at the REX interconnect at Wamsutter.
15

®
QUESTIONS
Thank You!
16

®
FERC Regulatory
Brad Burton General Manager, Regulatory Affairs
®
Clay Basin
Liquid Revenue & Conditioning
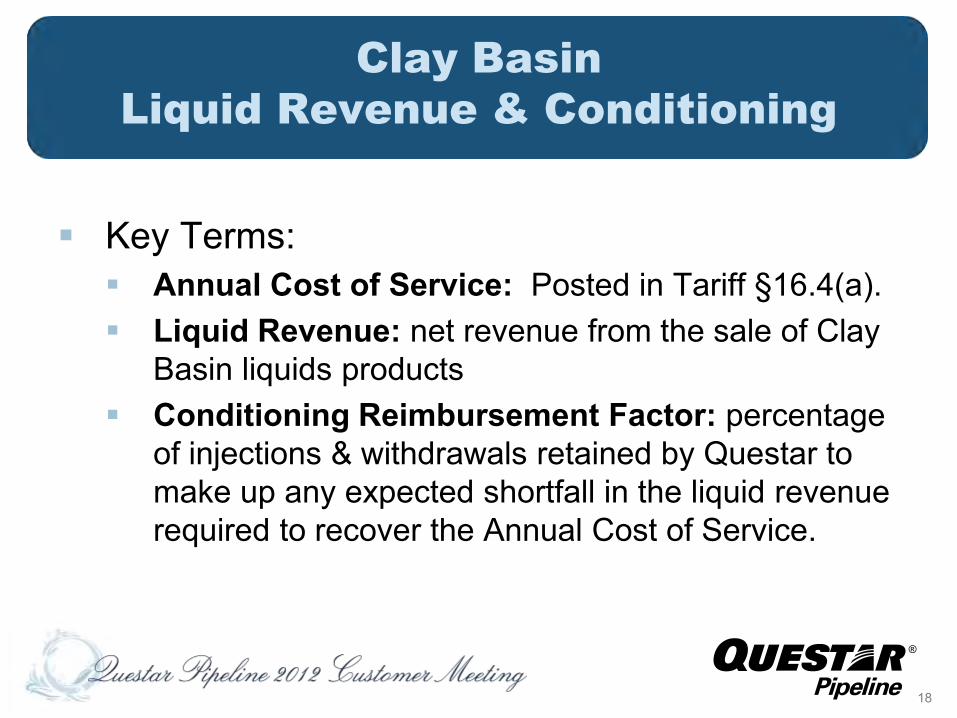
Key Terms: Annual Cost of Service: Posted in Tariff §16.4(a). Liquid Revenue: net revenue from the sale of Clay
Basin liquids products Conditioning Reimbursement Factor: percentage
of injections & withdrawals retained by Questar to make up any expected shortfall in the liquid revenue required to recover the Annual Cost of Service.
18

®
Clay Basin
Liquid Revenue & Conditioning
Key Terms: (cont.) Annual Reimbursement Adjustment: Quantity of
gas that is either transferred from Shipper accounts to Questar Pipeline or from Questar Pipeline to Shipper accounts at the end of July each year. The purpose of this transfer is to true-up revenue to the Annual Cost of Service.
19
®
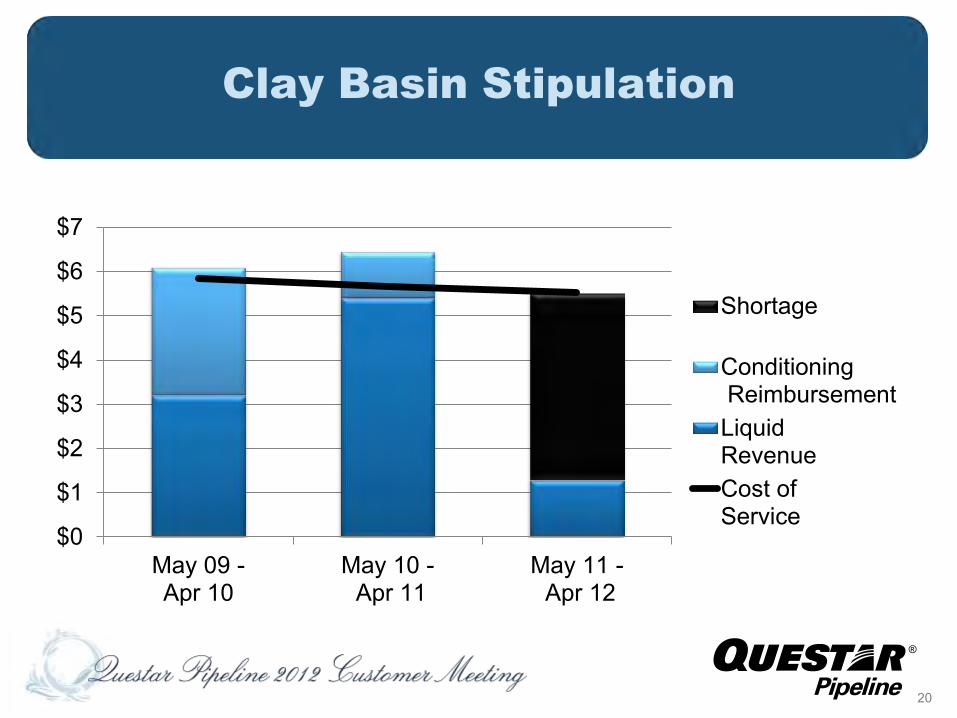
$0
$1
$2
$3
$4
$5
$6
$7
May 09 -Apr 10
May 10 - Apr 11
May 11 - Apr 12
Shortage
Conditioning ReimbursementLiquidRevenueCost ofService
Clay Basin Stipulation
20

®
Company Injections Withdrawals INJ / WD % Dth Owed Company 1 15,000,000 15,000,000 26.78% 267,800 Company 2 5,000,000 5,000,000 8.93% 89,300 Company 3 1,000,000 1,000,000 1.79% 17,900 All Others 35,000,000 35,000,000 62.50% 625,000
Total 56,000,000 56,000,000 100.00% 1,000,000
Cost of Service Shortage $3,000,000 Inside FERC Northwest Pipeline July 1, 2012 $3.00 Estimated Dth from Shippers 1,000,000
Annual Reimbursement Amount
Sample Calculation
21
®
WIC/Overthrust 2% CO2 Filing
Overthrust Filing Within 60 days of WIC settling with Shippers Changes Overthrust CO2 level to 2%
Impact on QPC
22

®
QUESTIONS
Thank You!
23

®
Pipeline Integrity
Ron Jorgensen General Manager - Engineering & Project Mgmt.

®
Background
Mandated for HCAs in 2002 P/S Law Initial “Baseline Assessments” due 12/17/12
25
20 or more people 20 or more structures
®
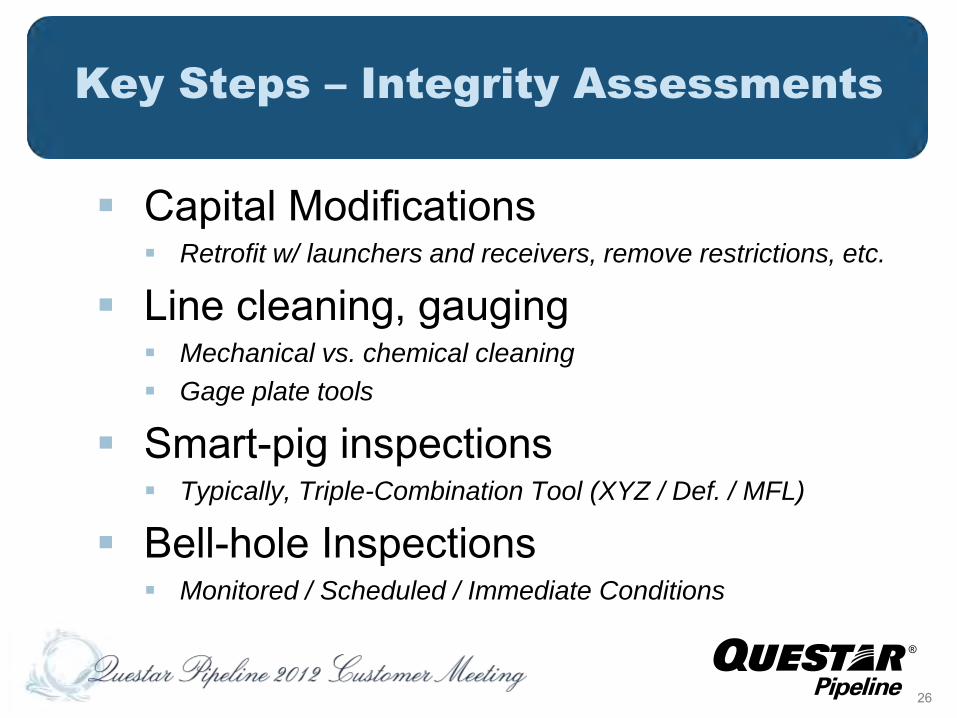
Key Steps – Integrity Assessments
Capital Modifications Retrofit w/ launchers and receivers, remove restrictions, etc.
Line cleaning, gauging Mechanical vs. chemical cleaning
Gage plate tools
Smart-pig inspections Typically, Triple-Combination Tool (XYZ / Def. / MFL)
Bell-hole Inspections Monitored / Scheduled / Immediate Conditions
26

®
Ensuring Safety & Reliability
27
®
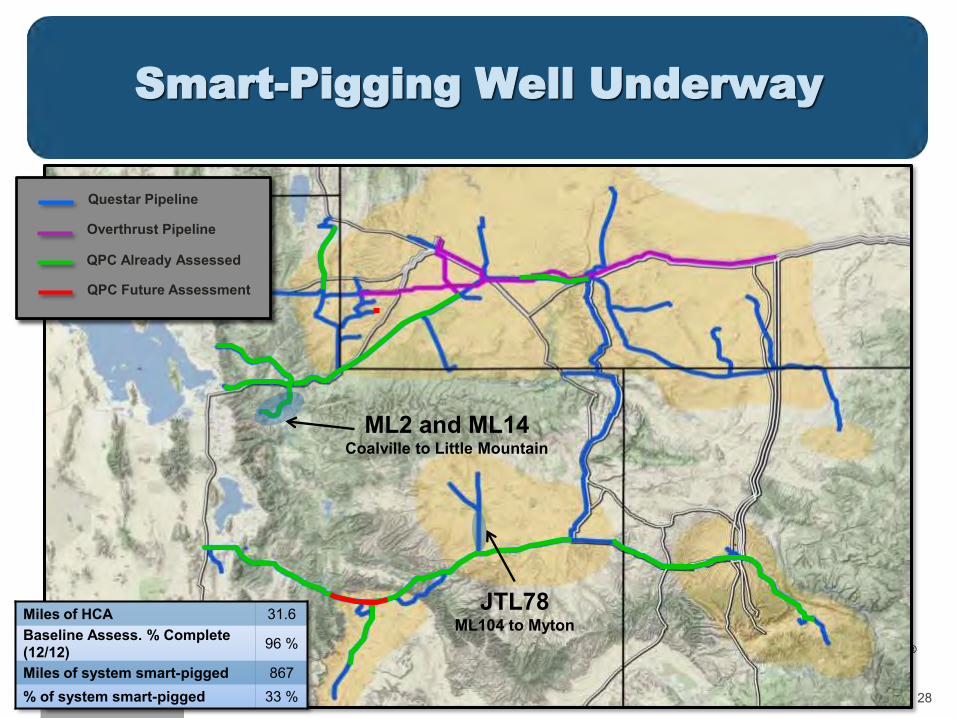
Smart-Pigging Well Underway
28
Miles of HCA 31.6
Baseline Assess. % Complete (12/12) 96 %
Miles of system smart-pigged 867
% of system smart-pigged 33 %
QPC Already Assessed
Questar Pipeline
QPC Future Assessment
Overthrust Pipeline
JTL78 ML104 to Myton
ML2 and ML14 Coalville to Little Mountain
®
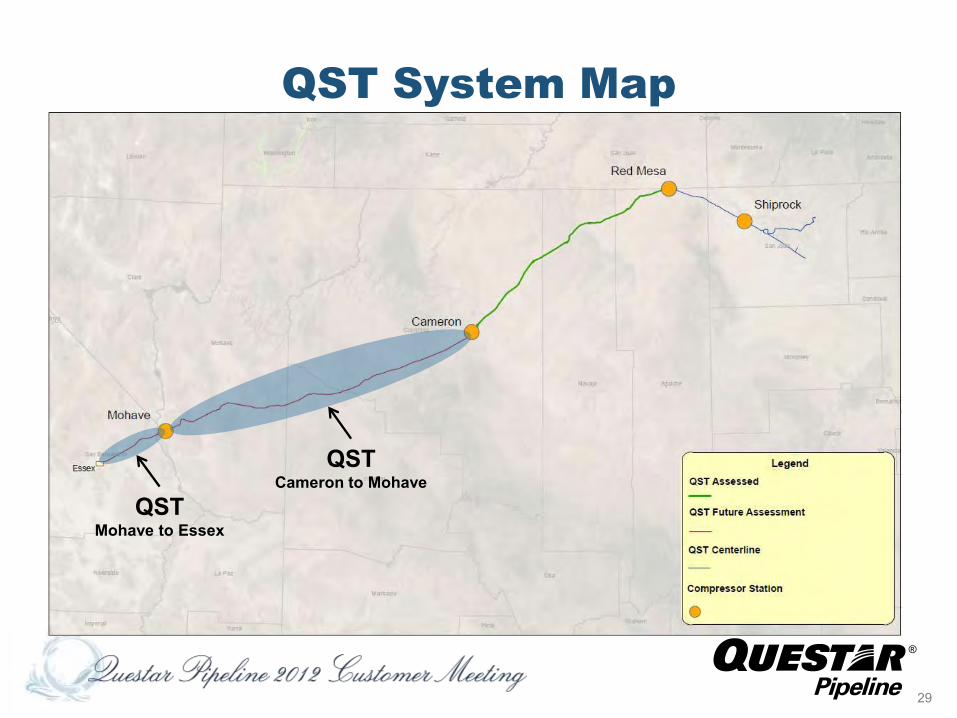
QST System Map
29
QST Cameron to Mohave
QST Mohave to Essex
®
INGAA Integrity Mgmt. Initiative
Our goal is zero incidents – a perfect record of safety and reliability.
30
“The members of INGAA, which represents the interstate gas transmission industry, already have undertaken comprehensive efforts to achieve greater pipeline safety. Through our IMCI initiative, INGAA members are embracing organizational safety culture; using coverage of population as the basis for extending integrity management principles beyond HCAs; applying risk management principles to assess and mitigate threats, thereby reducing the likelihood of an incident; developing and applying guidance for their pre-regulation pipelines in HCAs; and improving engagement with emergency responders and setting a response-time goal for isolation procedures.” - Don Santa, CEO of INGAA

®
QUESTIONS
Thank You!
31

®
Business Development
Lori Creer Director, Business Development

®
Developing Business
2011 Re-cap Open Season Updates Projects Underway Un-Sold Capacity
33

®
2011 Re-Cap
34
Clay Basin Working Gas Expansion – October 2011
0
10
20
30
40
50
60
APR MAY JUN JUL AUG SEP OCT NOV DEC JAN FEB MAR
Min/Max Range AVG 01-11 '07-08 '08-09 '09-10 '10-11 '11-12
MMDth
2011-2012 2010-2011
Re-certified total reservoir capacity to 120.2 Bcf
Incremental 2.7 Bcf
Expanded interruptible Park and Loan service

®
Phase IV Green River to Fidlar - 24.6 miles of 24” pipe
Completes 165 miles to loop ML 40/41 from Payson to Fidlar
Allows supply receipt to shift East towards Fidlar area processing plants
2011 Re-Cap
ML 104 Extension In Service November 2011
35
MDth/d ML 104 Volume Growth
0
100
200
300
400
500
600
2004 2005 2006 2007 2008 2009 2010 2011 2012
ML 104 Capacity
®
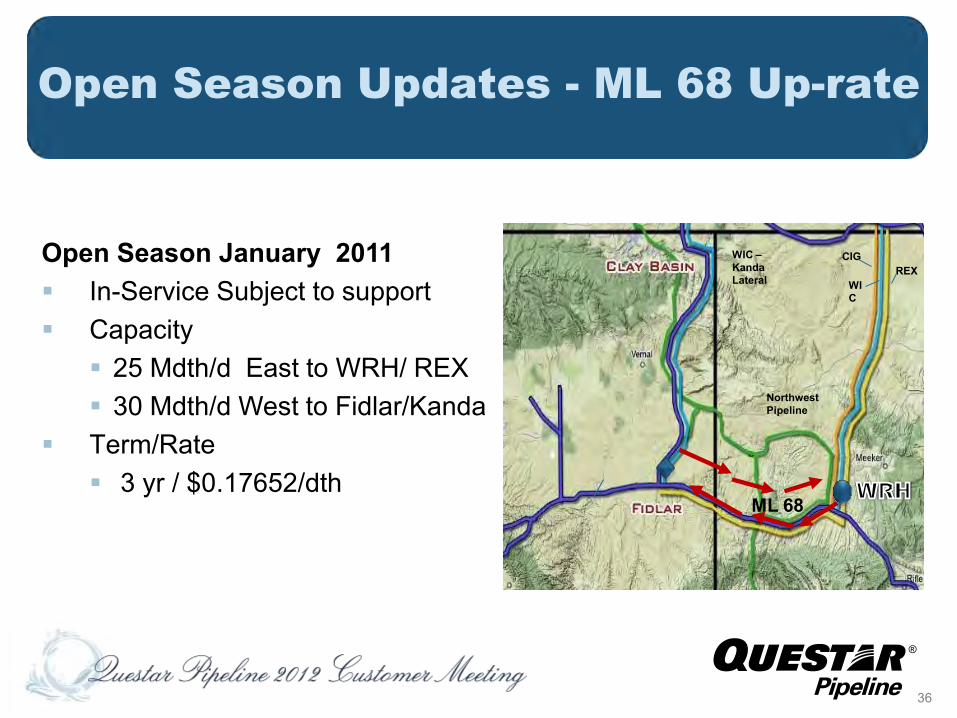
Open Season Updates - ML 68 Up-rate
36
NWP
ML 40
ML 68
Northwest Pipeline
WIC – Kanda Lateral
CIG REX
WIC
Open Season January 2011 In-Service Subject to support Capacity
25 Mdth/d East to WRH/ REX 30 Mdth/d West to Fidlar/Kanda
Term/Rate 3 yr / $0.17652/dth
®
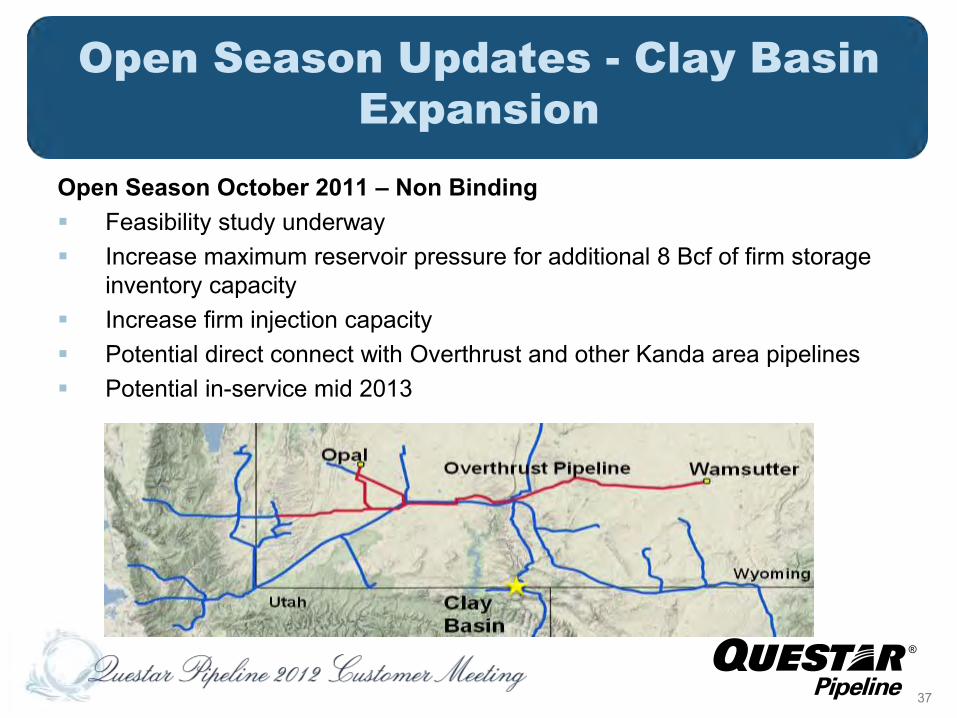
Open Season Updates - Clay Basin
Expansion
37
Open Season October 2011 – Non Binding Feasibility study underway Increase maximum reservoir pressure for additional 8 Bcf of firm storage
inventory capacity Increase firm injection capacity Potential direct connect with Overthrust and other Kanda area pipelines Potential in-service mid 2013
®
Open Season Updates - Southern
System Expansion
Open Season December 2011 Additional high-pressure deliveries to Questar Gas
Company (QGC) at Payson New compression - increased operating pressure ML41 Increased measurement capacity at Payson Gate Stn. PAs have been executed Will require FERC 7(c) application Anticipated in-service Q1 2014
38
®
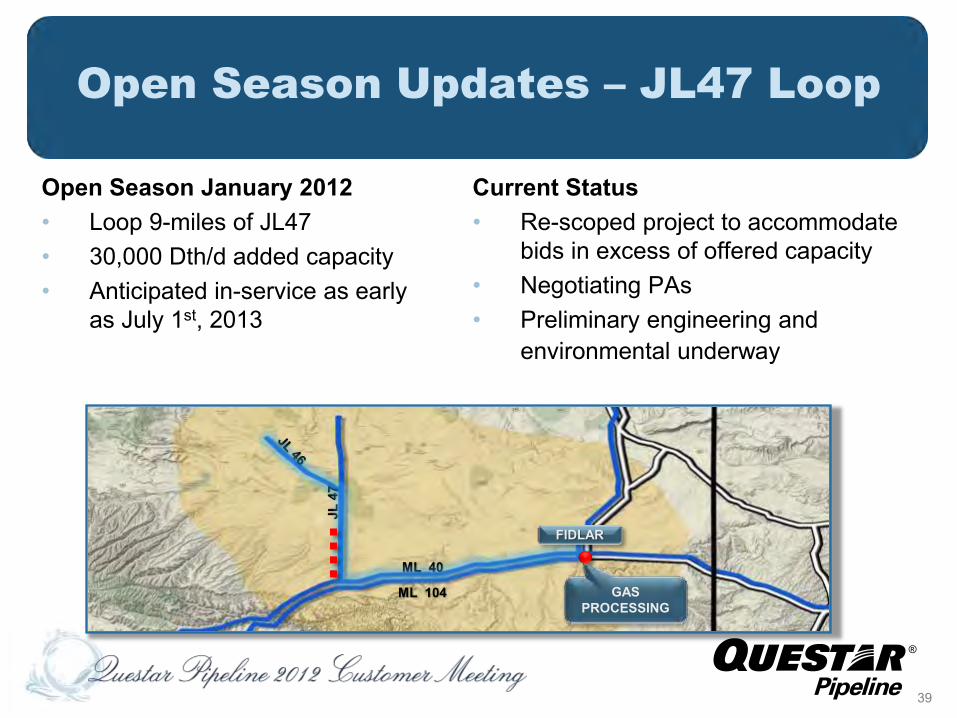
Open Season Updates – JL47 Loop
Open Season January 2012 • Loop 9-miles of JL47 • 30,000 Dth/d added capacity • Anticipated in-service as early
as July 1st, 2013
39
ML 104
ML 40
JL 4
7
FIDLAR
GAS PROCESSING
Current Status • Re-scoped project to accommodate
bids in excess of offered capacity • Negotiating PAs • Preliminary engineering and
environmental underway
®
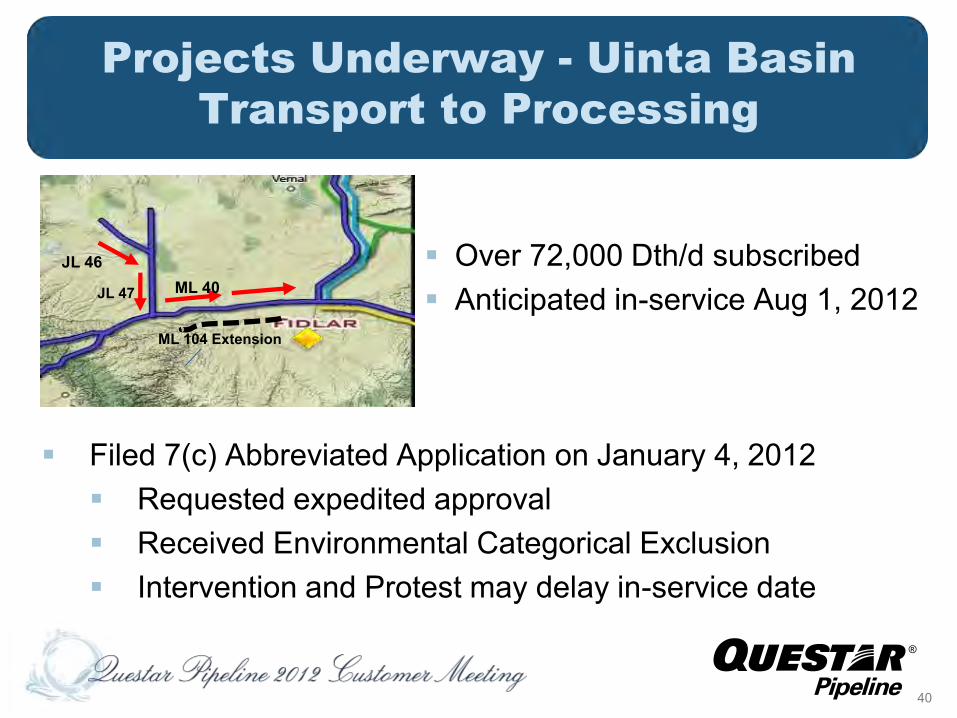
Projects Underway - Uinta Basin
Transport to Processing
40
ML 40
ML 40
ML 104 Extension
JL 46
JL 47
Over 72,000 Dth/d subscribed Anticipated in-service Aug 1, 2012
Filed 7(c) Abbreviated Application on January 4, 2012 Requested expedited approval Received Environmental Categorical Exclusion Intervention and Protest may delay in-service date

®
Projects Underway – ML103 Extension
Filed FERC 7(c) application November 2011 8.5 miles of 20-inch pipeline and related
facilities to replace 8.3 mile section of 14-inch diameter ML 68
To maintain pipeline integrity and reliability Incremental capacity 7,500 Dth/d No open season to support project Anticipated in-service November 2012
41

KANDA/COLEMAN SUMMARY
NITCHIE GULCH to WIC, CIG & QOPC
WEST of NIGHTINGALE to WIC, CIG & QOPC
EAST of NIGHTINGALE to WIC, CIG & QOPC
PIPELINE ABBREVIATIONS LEGEND
CIG - Colorado Interstate Gas Co
KRGT - Kern River Gas Transmission Co.
QOPC - Questar Overthrust Pipeline Co.
QGC - Questar Gas Company
TCGT - TransColorado Gas Transmission
NPC - Northwest Pipeline Corp.
RMNG - Rocky Mountain Natural Gas
WIC - Wyoming Interstate Co., Ltd.
WGPC - Williams Gas Pipeline Central.
WRH- White River Hub, LLC.
Volume in Dth/d
Delivery Point Meter Station
Main Line Compressor Station
S
M
C
0
Storage Facilities
Connecting Pipelines S:\Engineering - QPC\SystemEngineering\Unsold_Long Term... Updated: 2/21/2012 7:48:14 AM
C
C TCGT
FIDLAR
NATURAL
BUTTES
C RMNG
RIFLE
23,370
M.L
.80
52,370
S
CLAY
BASIN
ATMOS
ENERGY
C
14,200
DRIPPING
ROCK
STATE
LINE
M SKULL
CREEK
C
SIMON
0
M
C NIGHTINGALE
M.L
.58
M M
QOPC
M ROBERSON CREEK
WHITNEY
CANYON QOPC
S
LEROY 27,350 EAKIN 16,540
CIG
WIC
M.L.40
48,130
OAK
SPRING
M
M
M
M
M
M
M
QGC INDIANOLA
NEPHI
CITY
PAYSON
GATE
S CHALK CREEK
S
COALVILLE
LITTLE
MOUNTAIN
PORTERS
LANE
SUNSET
GATE
HYRUM
GATE
QGC
QGC
QGC
QGC
QGC
IDAHO WYOMING
UTAH
COLORADO
NPC
SOUTH
LAKE
M C
KANDA/COLEMAN
PRICE 0 M
DRAGON TRAIL
36,030
NPC
XO-16
171,990
C
8,860
CO2 PLT
C M
GOSHEN
M 39,120
31,470
85,910
0
Long Term
Unsold Firm Capacity
M
M HAMMS FORK
C
THISTLE
C
M.L.104
J.L
.47
BLIND
CANYON
116,800
34,170
M M WRH
11,050
M
3,100
April 2012
7,500
78,160
0
0

®
Salt Lake City Office Relocation
Effective March 19, 2012
43

®
QUESTIONS
Thank You!
44