qosfor isp-aug-2000
TRANSCRIPT

Quality of Service Parametersfor Internet Service Provision
Final Reportprepared for:
European Commission, DG InformationSociety
August 2000

- i –
Table of Contents
1. Introduction ...................................................................................1
PART I - BACKGROUND ........................................................... 22. What do users want from the Internet?.......................................33. Aspects of QoS .............................................................................7
3.1. Downstream performance – communicating with your ISP ................................................................................... 73.2. Upstream performance – how does the ISP connect to the Internet? .................................................................... 103.3. The cost of Internet access ................................................................................................................................. 153.4. Can Quality of Service be guaranteed and does it matter? ................................................................................... 17
PART II - QOS PARAMETERS................................................. 194. Background to the Parameters ..................................................20
4.1. Developing QoS Parameters .............................................................................................................................. 204.2. Choice and development of parameters.............................................................................................................. 21
5. Ability to connect ........................................................................22Parameter 1: Number of attempts required to achieve connection..................................................................................... 22Parameter 2: Time to connect.......................................................................................................................................... 23Parameter 3: Time to connect during the busiest hour of the week. ................................................................................... 24Parameter 4: Frequency of connection termination........................................................................................................... 24Parameter 5: Frequency and duration of ISP ‘outages’....................................................................................................... 25
6. Downstream connectivity...........................................................26Parameter 6: Theoretical maximum speed of connection. ................................................................................................. 27Parameter 7: Connection speed achieved......................................................................................................................... 27Parameter 8: Latency, jitter and packet loss statistics communicating with the ISP.............................................................. 28Parameter 9: Speed of download from ISP’s server(s) ........................................................................................................ 29Parameter 10: Speed of download from ISP’s mail-server.................................................................................................. 29
7. Upstream connectivity................................................................30Parameter 11: Ratio of ISPs’ bandwidth to product of number of customers able to achieve simultaneous
connection and the maximum bandwidth of those connections. .......................................................................... 31Parameter 12: Proportion of packets travelling through the ISP’s routers which are lost. ..................................................... 32Parameter 13: Proportion of designated sites connected to: (a) the ISP’s own backbone/backbone provider(s);
(b) to the ISP through private peering arrangements; and (c) through public NAPs/IXPs......................................... 32Parameter 14: Proportion of time which designated sites are unreachable. ....................................................................... 33Parameter 15: Latency, jitter and packet loss statistics for designated sites ......................................................................... 34Parameter 16: Number of NAPs connected to and the bandwidth of the connections ........................................................ 34Parameter 17: What are the bandwidth utilisation figures for the ISPs NAP connections and how congested
are the NAPs at which the ISP peers?.................................................................................................................. 35
8. Cost ..............................................................................................36Parameter 18: Cost of Internet access............................................................................................................................... 36Parameter 19: Additional cost of website hosting ............................................................................................................. 37Parameter 20: Annual supplemental cost for domain management.................................................................................... 38Parameter 21: Cost of technical support ........................................................................................................................... 39
9. Others ..........................................................................................4010. The parameters in use ................................................................41
10.1. Measuring the parameters, and using them for comparisons ................................................................................ 42
PART III - CONCLUSIONS ....................................................... 45
APPENDICES............................................................................ 48Appendix 1. Interview Methodology ...................................................49Appendix 2. People interviewed..........................................................50

- ii –
Table of Figures and Boxes
1 Introduction ...................................................................................1
PART I - BACKGROUND ........................................................... 22 What do users want from the Internet?.......................................3
What are the user’s needs in terms of speed and reliability of data transfer? ......................... 4Sample Users ....................................................................................................................... 6
3 Aspects of QoS .............................................................................7Internet connection speeds................................................................................................... 8Figure 3: Oléane’s network in France ............................................................................... 11Figure 4: FORTHnet’s network in Greece ......................................................................... 11Figure 5: Xlink’s network in Germany............................................................................... 12Latency, jitter and reliability ............................................................................................... 13Adaptive transmission rates ................................................................................................ 14Figure 6: Causes of delays accessing popular web servers................................................. 15Figure 7: Online penetration compared to off-peak telephone charges.............................. 16Figure 8: Some Free ISPs in Europe................................................................................... 16
PART II - QOS PARAMETERS................................................. 194 Background to the Parameters ..................................................205 Ability to connect ........................................................................226 Downstream connectivity...........................................................267 Upstream connectivity................................................................308 Cost ..............................................................................................369 Others ..........................................................................................4010 Sample users and the parameters .............................................41
PART III - CONCLUSION.......................................................... 45
PART IV - APPENDICES .......................................................... 48

- 1 –
1. Introduction
This is the final report of Bannock Consulting’s project for the European Commission’sDG Information Society, Quality of Service Parameters for Internet Service Provision.
The purpose of the project is to propose and discuss some parameters which individualsand SMEs can use to measure the Quality of Service they receive from the Internet, inparticular – though not limited to – from their Internet Service Provider. The parameterswill be discussed with regard to their meaning and relevance to particular types of user.This will be done in light of conversations with several of the key players in this market– telecommunications companies, Internet service providers, and consumer and smallbusiness representative organisations.
Part I of this report sets out some background to the study – what users want from theInternet, how it works, some of the factors affecting the speed and reliability of theusers’ connection, and some of the issues relating to the cost of Internet access. Wealso discuss whether or not quality of service can be guaranteed – and if this matters –and some of the guiding principles behind our parameter selection.
Part II presents some background to the selection of our proposed parameters tomeasure Internet Quality of Service, as well as the list of parameters themselves, whichwere developed and refined in the course of interviews with Internet Service Providers,Network Access Points and telecommunications companies. We also discuss in generalterms some possible practical applications for the parameters.
Part III presents our conclusions.
We have striven to make this report readable and understandable to the layman, as wellas being informative for people who are already familiar with the Internet. It isimpossible to do this without some discussion of technical issues, though we have triedto keep these to a minimum.
This report was written by David Turnbull, Olivia Jensen and Peter Smith of BannockConsulting, with contributions from Alan Doran, Stuart Berman and Kevin Carter, forwhich the authors are grateful.
Bannock ConsultingLondon, July 2000

- 2 –
PART I - Background

- 3 –
2. What do users want from the Internet?
Before a user can decide how to spend histime online, he needs to be able to connect.A business with a permanent connection tothe Internet will have few worries about be-ing able to connect, but the user dialling upfrom home cannot take this for granted. Itis more than just a matter of deciding whichISP (Internet Service Provider) to use andsigning up to it, as some ISPs limit thenumber of subscribers they accept concur-rently, and not every ISP has a swift andeasy process for becoming a subscriber.Even the right ISP will not necessarily guar-antee access all day everyday.
For the individual user, not being able toget online is inconvenient and disappoint-ing, but this is not always the fault of the ISP– the telephone company (telco), for exam-ple, also plays a role. The telephone con-nection is certainly of relevance to theuser’s QoS, though, so there must be pa-rameters to reflect this. There are severalpossible measures of inconvenience: howmany times the user tries to get a connec-tion and can’t, how long he is not able toget a connection for on any particular occa-sion, and how often and after how long thecall gets terminated after an initially suc-cessful connection. Even if it only occursvery rarely, one long period during whichhe is unable to get online may be more ofan inconvenience to the user than some-times not being able to get online at the firsttry, or without a brief delay. The worst caseis when a telephone connection is madebut the ISP fails to establish routing. This isbecause the consumer is charged and yetgets no service.
Much more is at stake for the SME that isunable to get online. Many SMEs in Europeare hoping to take advantage of the lowertransaction costs and communication coststhat the Internet offers to raise the efficiencyof their business and to reach more custom-ers. If customers and suppliers are used todealing with the SME over the Internet, thennot being able to get online will be a seri-
ous disruption to business. At this earlystage in the development of the Internet forB2B and B2C transactions, companies areconscious of building their online reputa-tions in the face of stiff competition. Revert-ing to faxes and phone calls could be a dis-aster for a SME trying to build a webpresence. Care must also be given to thechoice of a web-hosting service for an SMEwanting to publish content on the web –the best ISP for this may be different fromthe best ISP for Internet access.
Once online, though, what are the servicesthat people want to access through theInternet? We can identify five broad catego-ries:
! Information
! Entertainment
! Communication
! Presence
! Commerce
2.1.1 InformationFor the household or individual privateuser, and also for companies wanting tocarry out research, the Internet can be animpressive source of information.
How does the user want to access the in-formation on the Internet?
! Surfing the web
! Downloading data files
! Access to proprietary content
! A friendly, customisable interface
! Filtering of information
To surf the web, all that the user needs fromthe ISP is a point of connection to the net-work beyond the ISP – the Internet. In the-ory, he would then be able to reach anywebsite anywhere in the world through themesh of pipes and junctions that makes up

- 4 –
the Internet. This doesn’t mean that theuser will in fact always be able to accessevery site all of the time – there may betemporary problems with a particular part ofthe Internet, or the site may be overloaded.However, a connection to the Internet pro-vides the user with a reasonable expectationthat he can browse most websites.
The most important aspect of QoS for surf-ing the web and downloading data files isthe speed of the connection. If the connec-tion is too slow, video or audio streaming,surfing and downloading can become frus-trating and costly.
What are the user’s needs interms of speed and reliability
of data transfer?
It may be obvious to the user what too slowmeans when they are trying to surf the web,but this needs to be quantified before it canbe used as a measurement of QoS. Therelevant measures are round-trip delay,measured in milliseconds, and packet loss,measured as a percentage.
An industry expert has suggested, for exam-ple, that web surfing is bearable with round-trip delay of up to 250ms and packet lossrates up to 5%. Real-time interactive appli-cations (voice, video etc.) need less than1% loss rates and no more than 100ms de-lay. Some audio applications can performreasonably well with delay of up to 250msas long as packet loss stays beneath 1%.1
Measures of Internet congestion often clas-sify packet loss of 5-6% as ‘good enough’for Internet access, although this may not bea high enough level of QoS to support someapplications (see box above). A recentcomparison of ISPs in the US showed thebest performing ISP delivering 73ms latency(the time taken for a packet to make around-trip) and 0.9% packet loss, the worstperforming ISP delivering 241ms latencyand 12.4% packet loss. UUNET, the host ofmany of the most popular sites, delivered120ms latency and packet loss just above4%.2
Despite the amount of material available onthe web, some users like to have the extraproprietary content that is provided by thelarger ISPs. Whether this will continue tobe the case is debatable. As users becomemore familiar with using the web, they arelikely to discover sites that offer more spe-cialised information or more effective toolsthan those offered by the ISP. Also, most ofthe content provided by ISPs is not proprie-tary – even if you use another ISP for Inter-net access you can still get to the informa-tion on the site. Most of the contentavailable to AOL subscribers, for example,is available to anyone with web accessthrough AOL’s website. Despite this, manyISPs are developing a marketing strategythat involves providing more rather thanless content to attract and retain subscribers.
Similarly, with regard to the interface of-fered by the ISP, some users would like it tobe as simple and straightforward as possi-ble, seeing it as a jumping off point for theweb, where as other users would like to beable to create a personalised, information-rich interface. It is therefore difficult to saya priori which approach constitutes superiorQoS. ISPs are likely to gradually distinguishthemselves along these lines, in which casethe user will be able to get the appropriateQoS in this regard.
A filtering system for information may be animportant issue in households where chil-dren may be using the web. The content onthe web itself is generally unregulated, soparents may wish to restrict the material thattheir children can access by using an ISPthat has a filtering system, or software pack-ages which claim to filter out offensive ma-terial. For an individual, however, restric-tions on the information he can get accessto might reflect a decline in QoS. Filteringmay be useful to all email users if it protectsthem from unsolicited email, known as‘spam’, though filtering is not always totallyeffective.
The information needs of an SME are likelyto be similar to those of the individual orfamily user in terms of reach, although themotives might well be business-orientedrather than surfing for leisure purposes.

- 5 –
Their requirements in terms of speed maybe more stringent, for example, in a busi-ness that uses any kind of time critical in-formation, and the loss of a few extra sec-onds in the receipt of information mightmean the loss of a deal or a miscalculation.
2.1.2 EntertainmentFor the moment, televisions, videos, musiccentres and video games consoles providehousehold entertainment. This may allchange with the Internet. Using the Internetis not only a form of entertainment in itself,it is also a distribution channel for otherforms of entertainment.
! Audio: music can be downloaded fromthe Internet for future enjoyment. It isalso a way to access radio stations fromall over the world.
! Video: there is huge potential for visualentertainment to be provided over theInternet. Once broadband access isavailable, people will be able to enjoyvideo-on-demand, a huge range of pro-gramming and real-time broadcasts fromother parts of the world (for example ofa live concert or sports event) allthrough access to the Internet.
! Games: users can download game soft-ware from the Internet, and play againstothers anywhere in the world over theInternet.
These activities are typically much moredemanding in terms of bandwidth3 thansimple web-surfing. They also requirehigher speeds and lower packet-loss to beenjoyable for the user. For the ISP, thismeans much more stringent requirements inQoS, and probably the expansion of theirupstream bandwidth to keep customers sat-isfied, as well as other QoS enhancements.
2.1.3 CommunicationThe Internet offers a fast, cheap method ofcommunication over long distances. Itmakes it possible to transmit large amountsof data, and to reach a wide audience.
For the individual, the main method ofInternet communication at the moment is
email. Of all the Internet’s uses, email isthe least demanding in terms of QoS. A de-lay of several seconds in data transmissionis unlikely to be noticed by the user. How-ever, the reliability of the ISP’s mail server isimportant as lost messages or long delays inaccessing them would be noticed by theuser and could have harmful effects on anSME’s relations with its customers.
Email is not the only form of communica-tion offered over the Internet; it can also beused for voice telephony, although this re-quires a faster and more reliable connectionthan email, and video-conferencing. Video-conferencing is particularly demanding interms of bandwidth – it requires more datato be sent than telephony (both pictures andsound) – as well as potentially allowingmore than two participants to be connected.
The Internet also constitutes a way to accessa company’s proprietary network from a dis-tance, a development that makes possible arevolution in working habits. An employeeworking at home could have access to allthe information on his company’s networkover the Internet, and communicate just aseffectively from a distance as in the office.
2.1.4 PresenceFor SMEs, the most important use of theInternet may be to attract potential custom-ers and to deal with established customers.The website is the company’s face on theweb and therefore crucial in its Internetstrategy.
For the business setting up a website, thereare multiple considerations.
! How much webspace is needed, andhow much does the ISP provide? An in-dividual may have modest requirementsfor webspace, but a business mightneed substantially more in order to pub-lish catalogues, user guides and so on.
! How reliable are the ISP’s webservers?Uptime is crucial here, as any unavail-ability of a website might have veryharmful effects on business. What con-stitutes acceptable levels of availability

- 6 –
varies depending on the type of busi-ness, and can be difficult to measure.
! How many established or potential cus-tomers are on the ISP’s network? As wewill see below, the Internet is really awhole series of ISPs’ networks con-nected together. The connections be-tween the various networks are thoughtto add to delays and unreliability, so animportant consideration when choosingan ISP is the number of users connect-ing to the Internet through the ISP’snetwork. In the survey mentionedabove on the ISPs used by popular web-sites, it was revealed that UUNET wasthe most popular even though it did nothave the highest levels of speed and re-liability. The explanation for this can befound in the reach of UUNET’s net-work. UUNET at the time was the car-rier for AOL, the ISP with the largestnumber of dial-up customers in theworld and so a website on UUNET hasthe potential to reach a greater numberof people reliably and quickly.
! Is it possible to have a dedicated serverwith the ISP? What about uninterrupti-ble power supplies, diesel generators,and so on.
! Does the ISP offer e-commerce housing,secure servers, support for credit cardtransactions, and so on? These are obvi-ously crucial if the business hopes touse its website for transactions with cus-tomers.
The importance of the access speed and re-liability of its website to a business will de-pend on its nature. Real-time informationproviders, for example, have to be sure thattheir ISP delivers the speeds that the busi-ness needs to keep its customers satisfied.SMEs publishing sales catalogues only onthe Internet may be more worried about re-liability, and for the individual publishinginformation for his own pleasure, cost maybe the most important consideration.
2.1.5 CommerceFor the individual, e-commerce is one ofthe most exciting things about the Internet.
For SoHos (small office or home officebusinesses) and other SMEs, e-commerceand, more broadly, e-business, has the po-tential to revolutionise the organisation andoperation of businesses. While the impactof e-commerce is likely to be very far-reaching, the requirements from the ISP forthe customer and the business to engage ine-commerce are not very different from theQoS level that is necessary for the otherInternet-based activities discussed above.Communication times and reliability willagain be the primary considerations, as wellas security and confidence.
Sample Users
! FamilyThey use the Internet for shopping andentertainment in the evenings and atweekends. They have two young chil-dren who want to use the Internet fordownloads, games etc.
! TeleworkerUser works for a large company andwants to work from home and also usesthe Internet for general surfing and in-formation access
! Start-up SMEWants to use the Internet to establish acustomer base, and to facilitate internalprocesses.
! Established SMEUses the Internet to deal with their sup-pliers and their customers
Making sense of the technical terms used indiscussions of QoS and interpreting theseaccording to their own QoS requirementsmay be difficult for individuals, SoHos andSMEs. Some sample Internet users (see box)may help to illuminate how the QoS pa-rameters actually relate to the ways thatpeople want to use the Internet. We will re-turn to these sample users after our exposi-tion of suggested QoS parameters, to seewhat might be important for each.

- 7 –
3. Aspects of QoS
3.1. Downstream performance – communicating with your ISP
In order to use the Internet, the user mustestablish an interconnection with the back-bone, one of the high speed data pipes thatmakes up part of the network of networksthat is the Internet (a concept explained fur-ther below). A very large business mightconsider having its own dedicated link tothe Internet, which would be very fast butvery expensive. Instead, most users have aconnection to an ISP, which then consoli-dates the upstream traffic to the backbonein a single connection for many users.
The connection between the user and theISP is known as the ‘last leg’ as it is the finalstage in the journey taken by the data whenthe user is downloading information from asite on the Internet. The data pipes thatmake up the core of the Internet tend to beof a very high capacity and are thereforecapable of transmitting vast amounts of dataat very high speeds. The last leg is likely tobe the narrowest data pipe and so is thelikely determinant of the maximum speed atwhich the user can receive (or transmit)data.
It will be seen below that the nature of theInternet makes it impossible for the user, oreven the ISP, to control the speed and reli-ability of the entire journey as data travelsover the Internet, and so it is impossible tohave an absolute guarantee of performance.However, the type of connection betweenthe user and the ISP will make a significantdifference to latency and reliability. It willalso be the main contributory factor in thecost of their Internet connection, and, un-like much of the rest of the data’s journey, itis within the control of the user and ISP.This section looks at the alternative waysthat the home user or SME can connect totheir ISP and the implications of this choiceon QoS.
At the moment, most home users dial-up totheir ISP using a modem over a standardPSTN connection (public switching tele-phone network).4 This uses traditional twincopper wires to carry data in analogueform. Because of the limit on the speed atwhich data that can be sent via this me-dium, it is known as ‘narrowband.’ The useremploys a modem to convert the digitaldata from their own computer to an ana-logue signal that can be carried over thetelephone network. The data is then recon-verted to digital data by the ISP’s modem. Itis also possible that the telephone companyconverts the data to digital and then back toanalogue if, for example, it uses optical fi-bre for part of the connection.
Standard modem speeds have increasedrapidly, but the conversions back and forthbetween analogue and digital mean thatmodem connections still have much higherlatency – or delay – than purely digitalInternet connections, even when the formerare compared to data travelling throughseveral routers. A ping test – the time that ittakes 32bytes of data to travel to and from apoint – may be used for this comparison. Asample test shows a time of 160ms for aping between two modems, and 120ms fora ping between two machines connectedvia digital links through eight routers.5 Fur-thermore, the switches in the telephone sys-tem tend to have a maximum speed of64kbps so improvements in modem speedscannot augment dial-up PSTN connectionspeeds much further.
There are a number of alternatives to thenarrowband dial-up connection, technolo-gies collectively known as broadband.There is a fairly straightforward trade-off be-tween speed and cost, although this maychange as a result of the rapid change intechnology.

- 8 –
The box on ‘Internet connection speeds’shows the vast improvements in speed ofthe various broadband platforms over tradi-tional connections; and due to their digitalnature they will tend to have lower laten-cies associated with them, as the data donot need to be transferred back and forthbetween analogue and digital forms. Thefollowing sections describe these technolo-gies in more detail.
Sample Internet connectionspeeds
Connection type Max speed
Fast Ethernet 100Mbps
T-3 (standard US b-bone) 45Mbps
E-3 (Europe b-bone) 34Mbps
4-cable 20Mbps
Cable modem 10Mbps
ADSL download 2-5Mbps
ISDN 128kbps
Standard modem 56kbps
Note: bps=bits per second, k=1,000, M=1,000,000
3.1.1 ISDN: Integrated Services DigitalNetwork
ISDN is, in essence, a purely digital phoneline, replacing the more traditional ana-logue system. ISDN is the connection cur-rently being used by many smaller busi-nesses for their permanent Internetconnections but the speeds are not as highas xDSL, particularly for downloading in-formation. In fact, isdn is often consideredto be narrowband rather than broadband,even though it can offer superior speeds toPSTN dial-up. The future of ISDN – at leastfor Internet access; it is, for example, the de-fault technology for all new lines, includingresidential ones, in some countries such asGermany – is unsure in the face of competi-tion from the other forms of broadband ac-cess because it cannot compete on speed,although it has had a head start in establish-ing itself in much of Europe, as it is an oldertechnology.
Pricing has also been a factor affecting take-up in Europe and accounts for some dis-crepancies in ISDN adoption between dif-ferent countries.
3.1.2 DSL: Digital Subscriber Line tech-nologies
xDSL upgrades the existing copper lines,extending their data-carrying capacity byoccupying parts of the bandwidth unoccu-pied by the voice signal. xDSL can deliverdata at speeds ranging from 512kbps to13Mbps, over 230 times the rate over a56kbps modem on a traditional copperphone line. In its first trials, xDSL was usedfor video-on-demand, but the trials were notcommercially successful and the technologyis now targeted towards Internet access.
As well as speed, another advantage to thistechnology is that voice and data are carriedat different frequencies, so phone calls andInternet access can take place simultane-ously and a separate Internet connection isnot necessary. The xDSL connection is ‘al-ways open’, meaning that users should havefewer connection problems. However, inpractice, its speed depends on the length ofthe local loop (in telecommunications ter-minology, the connection between the tele-phone exchange and the final user), possi-bly making it inappropriate for suburbanand rural areas where this distance could belong.
There are a number of variants of xDSL, ofwhich ADSL (Asymmetric DSL) will proba-bly have the widest rollout. It is ‘asymmet-ric’ because it offers faster speeds when re-ceiving data (downloading) than when it issending data (uploading) – up to 40 timesnormal copper wire speeds. Internet usemainly involves downloading informationfrom websites – at least for individuals andSoHos – so it is the down-link that is moreimportant to most users. Another variant ofxDSL, VDSL (Very high speed DSL), offersdata transmission speeds of up to 13Mbps.
For the moment, it remains to be seen ifxDSL will be taken up quickly by consum-ers and SMEs, as its roll-out may be slowand limited and the cost for use may be

- 9 –
high. There are some grounds for optimismthough – in the UK, BT took on 100,000customers for its ADSL service in the firstmonth and charge 39 pounds per month,which for heavy users may be less expen-sive than narrowband . Areas with highconcentrations of businesses will be the firstto benefit from access. The long-term po-tential of xDSL has been called into ques-tion by those who doubt that traditionalcopper wires can be continuously upgradedas bandwidth requirements grow and grow.However, the speeds it offers are very im-pressive, and the additional infrastructurerequirements are low which makes it an at-tractive option for telcos and consumers.There are some issues with contention ra-tios, though, as some ISPs are contendingthe service at ratios of up to 50:1 which candegrade the customer experience rightdown to narrowband speeds.
3.1.3 CableFibre-optic cable transmits voice and datatraffic over fibre using light streams. It pro-vides huge amounts of bandwidth and ef-fectively eliminates networking delays. Thisis mainly used at the moment for the longdistance backbones (particularly undersea),and also within cities, but it is likely to berolled out to end-users in the future. Thesecables may be capable of carrying up to 6.4terabytes per second on a single fibrestrand.
At the level of the consumer connection,cable has been used mainly for one-waydata transfer for television programming.The potential of using cable for interactiveapplications such as Internet use is nowcoming into its own, providing ‘always on’access at speeds up to 100 times thoseachieved by PSTN dial-ups.
Cable networks have not spread that exten-sively in Europe, where their poor reputa-tion for service and/or their cost of use haslimited their spread to 25% of the marketfor television access.6 At the moment, cableaccess is limited and fragmentary. Manycompanies are now in the process of ex-tending their cable networks in order to
take advantage of the increase in demandfor cable that the Internet is causing.
Not all cable networks are capable of han-dling two-way traffic, and delivering thebroadband speeds that users will come toexpect. This is especially the case in conti-nental Europe where cable networks wereoften laid by local authorities with the lim-ited purpose of television broadcasting.This means that they will need to be up-graded before they can be used forbroadband Internet access.
Cable seems an attractive form ofbroadband access for the home user, as itcombines high speed Internet access withother services, and it is well-suited to roll-out in suburban areas. However, it requiressignificant investment in infrastructure andit may not reach all rural areas as the costsof installation (bringing the connection fromthe main cable right up to the user’s door)are high. It is also possible that cable willnot be able to deliver the kinds of speedspromised as all the users in a neighbour-hood will connect to the same main areacable. As more and more homes in a par-ticular neighbourhood connect, the databurden on the shared cable will increaseand will slow the speed of the individualconnections, particularly at peak times. Asa result, the QoS of cable is less reliablethan a leased line where only the lineowner uses the connection. Density of opti-cal nodes is therefore a key QoS determi-nant for cable users.
3.1.4 Wireless technologiesThere are two aspects to the phenomenaldevelopment being seen at the moment inwireless technologies. One is making ac-cess to the web possible on mobile phonesover the mobile networks that are alreadyoperable. This is made possible throughWAP technology (wireless application pro-tocol) which adapts the content of a websiteto make it displayable on the screen of acertain types of mobile phones that have re-cently been introduced to the market, aswell as providing stripped down contentmore suitable for low-speed connections.At the moment, this provides a useful way

- 10 –
of accessing time sensitive information onthe Internet while on the move, but is likelyto be seen as a complement to fixed accessto the Internet, rather than a replacement.
Accessing the Internet through a mobilephone may have positive implications for e-commerce. Currently Internet purchasesare mostly settled using credit cards andthere has not been a way to handle micro-payments. The mobile phone companycould make these possible by adding thecosts of purchases to the user’s mobilephone bill, even for very small amounts – atechnology already on trial in Europe.
3-G, or high performance mobile data sys-tems, is a burgeoning area in the field ofInternet technologies and it should makewireless Internet access possible. At themoment, using a mobile phone for Internetaccess is only possible at speeds of around9,600bps. 3-G uses higher and wider fre-quency bands to allow higher data trans-mission rates and could in theory allowspeeds of up to 2Mbps, some 35 times thebandwidth of traditional copper wire tech-nologies. In practice, these speeds may notbe available for many years, and coveragemay be ‘spotty,’ with gaps between the ar-eas that are covered by 3-G transmission.
There have also been some interesting de-velopments in the field of so-called ‘FixedWireless’, or WLL (wireless local loop). Us-
ing line-of-sight technology between trans-ceivers and rooftop aerials (hence ‘fixed’),speeds of up to 384kbps have beenachieved. While this has the advantage ofnot needing cables to be laid, the technol-ogy is still relatively new.
3.1.5 Other technological developmentsSatellite technology has so far been used forlong distance connections between majorISPs, but the development of technologythat will allow two-way communicationrather than just downloading may make itpossible for satellite to be used for con-sumer access. A satellite could be used bya local ISP in places where the distances aretoo great or the population too sparse forcable or other broadband technologies.
The development of digital TV may make iteasier for those without a computer in theirhousehold to access the Internet. This mayreduce the ‘digital divide’ between thosewho have Internet access and those who donot, as TV penetration is close to 100% ofthe population.
Both of these developments mean that theservices offered over the Internet will be in-creasingly widely accessed.
3.2. Upstream performance – how does the ISP connect to theInternet?
We saw in the previous section that thereare many ways of connecting to an ISP.The speed – or width – of your connectionwill place an effective upper limit on thespeed at which you can communicate overthe Internet. However, it is rare that theconnection to your ISP is used at full capac-ity. In practice, a number of other consid-erations will affect the effective speed atwhich you can communicate with theInternet. This section will explore some ofthese factors.
3.2.1 How do the data get from A to B?The physical hardware that makes up theInternet can be compared to a road net-work. Just as one does not build a roadfrom every single conceivable origin toevery conceivable destination, but ratherbuilds lots of small roads which feed into aseries of networks of progressively fewerbut larger roads joined at junctions, so toowith the Internet. In terms of tangibles, theInternet is made up of a series of routers

- 11 –
(junctions) connected to each other by datapipes or bandwidth (roads).
An Internet ‘journey’ – i.e. data travellingfrom one computer to another over theInternet – will pass through several routersor junctions. Just to give an order of magni-tude for the number of hops, to get from theauthors’ network in London to the EuropeanCommission’s Cordis website in Luxem-bourg requires around 19 hops (i.e. travelsthrough 19 routers), and the data travels viaVirginia in the United States. To get to thesite of an ISP in Zambia takes 14 hops(again crossing the Atlantic twice), and toget to Toyota’s site in Japan takes about 17.7
There is no a priori reason why any particu-lar number of routers is optimal, either intoto or for a particular journey. As with anysimilar network, there is a trade-off betweenthe number of junctions, the complexityand congestion of each of the junctions,and the time taken to travel to the junctions.
However, to add to the complexity of theInternet, the data pipes and routers are notcommunal; companies own them. In thecase of data pipes, the owners are typicallyeither telcos or Internet service providers(ISPs). Routers are more complex. Theycan be roughly divided into internal and ex-ternal – internal routers send data aroundthe ISP’s network, and external routersshare data with other networks. The former– internal routers – are owned by ISPs, andtogether with their data pipes form the ISP’snetwork.
There are many terms for external routers,and they are often used interchangeably –NAP (Network Access Point), IXP (InternetExchange Point) and sometimes MAE (Met-ropolitan Area Ethernet). As there do notseem to be standard definitions for theseterms, we will use the acronym NAP tomean any point where two or more ISPnetworks exchange traffic. There is a rangeof arrangements that the term covers, from apoint where two bandwidth owners swapdata with each other – typically using pri-vate peering8 – to ‘public’ NAPs where alarge number of ISPs meet. A good exam-ple of the latter would be LINX (LondonInternet Exchange), where some 100 ISPs
peer; though not all peer with each other.9
The ownership structure and businessmodel varies from NAP to NAP.
The figures below show some examples ofnetworks owned by national, EuropeanISPs. Figure 3, for example, shows the ma-jor nodes of Oléane’s domestic network inFrance; Figure 4 shows FORTHnet’s net-work in Greece and Figure 5 shows nodesand principal links for Xlink in Germany.
Figure 3: Oléane’s network in France
Source: http://www.oleane.com/english/Oleane/meteo/national.html
Figure 4: FORTHnet’s network in Greece
Source: http://www.forthnet.gr/en/network/index.html

- 12 –
Figure 5: Xlink’s network in Germany
Source: http://www.xlink.de/english/js/home/index.html
A popular misconception is that all data canuse the whole Internet: any data flowingfrom Cologne to London, for example, willfollow the same route. This is not the case,due to the non-communal ownership of theInternet data-pipes and routers. An ISPneeds to agree a deal with another ISP be-fore using its data-pipes, even if both aremembers of the same NAP. If one thinks ofthe Internet as a road system, not all trafficmay use all the roads or even all the junc-tions, as not all ISPs have reached data ex-change deals with all others, or even havebandwidth to the same routers as all otherISPs. The source and the destination ISPs,and the structure of the deals between theseISPs and any intermediary ISPs will deter-mine the spectrum of possible routes thatthe data can take.
This can have apparently perverse results.For example, if two individuals in Mar-seilles are video-conferencing over theInternet, the data may well be travellingthrough Paris, if this is the nearest spotwhere their respective ISPs share a NAP. Inthe above examples of data travelling be-tween London and Luxembourg, and be-tween London and Zambia, the journey wasvia the States, which was the location of aNAP where ISPs exchanged data.10 Moresubtly, if the two ISPs do not have a traffic-sharing arrangement, the data may have to
travel through the networks of one or moreother ISPs in order to reach its destination.
For example, the journey from the authors’network in London to the European Com-mission’s Cordis website in Luxembourgstarts off with the authors’ ISP in the UK, U-Net. The data is then transferred to Above-Net’s network in the States, before beingrouted back to LINX in London, where it istransferred to the European Users GroupNetwork through the Netherlands to Lux-embourg, where it is transferred to IntrasoftInternational, who host the Cordis website.
The journey from the authors’ network toToyota’s website in Japan again starts withU-Net in London, before being handed offto AboveNet in the USA, which takes thedata as far as Palo Alto in California. Thedata is then transferred to IIJ’s network,which transfers the data to Japan, beforehanding it off to Toyota’s network.
The task of deciding which route the datatakes across the Internet is a very complexone. The routers – or junctions in the net-work – act as combined traffic lights andtraffic police. When data reaches them,they examine the destination of the data,and decide which is the most appropriatenext router to which the data should besent. This depends on their routing tables –which are ‘programmed in’ and reportwhich ISPs talk to which, i.e. have peeringor transit arrangements with each other. Italso depends on which routers are deemedto be ‘available’ – i.e. functioning. Routerscommunicate with each other, over theInternet bandwidth, and tell each otherabout routers that they have had difficultiescommunicating with, thus keeping otherrouters up-to-date about which routers arehaving technical difficulties and should beavoided. The role of the router is thereforecomplicated but key to the efficient opera-tion of the Internet.
3.2.2 How does the route taken by thedata affect the user?
Of primary interest, in terms of quality ofservice, is not the route taken by the data –which is broadly transparent to the user –

- 13 –
but rather how this affects the speed and re-liability of the data transfer process. Thereare some key terms when measuring overallInternet performance –latency, jitter and re-liability (see box).
Latency, jitter and reliability
If you ‘ping’ an Internet host (i.e. measurethe duration of a round-trip for a smallamount of data – a packet – to anothercomputer):
! latency refers to how long the trip takes
! jitter refers to how much the latencyvaries, generally between specificsource and destination computers
! reliability refers to how often the datamakes it back – it is the converse of‘packet loss’, which measures howmany packets sent out get lost. Packetsare deemed to be lost once they havepassed through a certain number ofrouters – typically 255 – without reach-ing their destination.
Latency – the time taken for data to travelacross the Internet – can be broken downinto three constituent parts:
! the time taken for the first bit of data totravel down the data pipes from sourceto destination;
! the time taken for the whole of the mes-sage to arrive; and
! the time spent at routers (i.e. queuing atthe junctions of the Internet).
These times cannot be measured accurately,but they can be estimated.
On a particular day in March, the quickest‘ping’ speed between the authors’ networkin London and TF1’s website in France –taking a geographically direct route, with nodetours across the Atlantic – was about20ms for a round trip. The same trip wouldtake light about 2ms,11 so we can estimatethe time taken for the first bit of data tomake the journey to be about 2ms. Thesize of the data packet was 32 bytes, and
travelled down 11 data pipes. If we assume(conservatively) that each data pipe wasonly a T112, then the time taken for the en-tire message to make the journey would beabout 2ms as well.13 This would make thetime spent at routers about 16ms, or about80% of the time taken. Even if our esti-mates of the time not spent at routers weredoubled, to be more conservative and allowfor some congestion on the data pipes, thenthe time spent at routers would still bearound 60% of the journey time.
If we consider again the journey betweenthe authors’ network and the Cordis websitein Luxembourg, the typical ‘ping’ speed isabout 300ms. To travel from London toVirginia and back is about 7,400 miles, sodoing it twice will be about 14,800 miles.This will take light about 80ms, or about25% of the journey time. Because of thevery high speeds at which data travels downdata-pipes, the fact that the journey canseem full of detours is not particularly sig-nificant to the latency.
Jitter and reliability are more difficult togeneralise about. Other things being equal– which they rarely are – it seems common-sensical that the more hops data makes, themore chances there are for delays and out-ages to occur. Clearly, this is not a hardand fast rule, as a two-hop journey may besubject to all sorts of problems if the band-widths to the intermediary router are con-gested or if the router is not performing.Equally, a 20-hop journey may be very reli-able and suffer from little jitter if all thebandwidths and routers used are operatingbelow capacity and are well maintained.
So how do latency, jitter and reliabilitymanifest themselves to the user? We willconsider three sample web-based activities:downloading, video-conferencing andemail.
! Downloading
A sizeable download, one taking 10 min-utes, for example, is not going to be over-sensitive to latency, which is effectively a‘one-off’ increment to the download time.The difference between latencies of 100msand 1,000ms in a ten-minute download is

- 14 –
about 0.0015% of the download time. The40ms taken to travel across the Atlantic andback would be about 0.01% of the samedownload.
Adaptive transmission rates
A server transmitting data over the Internet– e.g. when someone downloads a file fromit – splits the data into chunks, or packets,which are sent out separately.
Typically, not all the packets are despatchedat once. The server will dynamically adaptthe rate at which it sends out data, depend-ing on the rate at which it receives acknow-ledgements for packets already sent (orACKs) from the recipient of data. The ulti-mate goal of this adaptive rate of transmis-sion is to send new packets out over theInternet at the same rate as the receiverdownloads them.
High levels of jitter can cause the server tomake very conservative estimates of thespeed at which the recipient can downloadthe data, leading to non-efficient use of thenetwork.
Equally, jitter may not be a large problem –the file being downloaded is cut up intosmall ‘packets’ of data, which are sent indi-vidually. With moderate levels of jitter, thepackets may be received in a different orderthan they were despatched, but they aresimply reassembled into the correct orderby the destination computer. This processis transparent to the user and has no effecton the download, which is not deemedcomplete until the final packet has been re-ceived. See, though, the box on ‘adaptivetransmission rates’ for details of how highlevels of jitter could be problematic.
Reliability could be a significant factor. Ifpackets are lost, they need to be resent.Typically, packets are lost on busy stretchesof bandwidth, and download speed may beunaffected if the congestion is sufficientlyupstream that even the resent packets arearriving quicker than the source computercan download them. However, congestioncan be a vicious cycle – packet loss tends to
occur on congested bandwidth, requiringpacket resends, and hence more conges-tion. Reliability could therefore affectdownload speed considerably.
! Video-conferencing
Video-conferencing, on the other hand, hasdifferent characteristics. Latency is key –the difference between 100ms and 1,000msis noticeable if you are waiting for someoneto reply to a question you have asked.Equally, jitter will cause jerky pictures ormuffled sound, as to interpret video andaudio, one pretty much needs the data inthe right order. Reliability, on the otherhand, could be less of a problem. If you re-ceive 99% of the packets quickly and in theright order, and 1% simply never make it,one probably has enough data to recon-struct useable video and audio streams.
For email, there is typically a three-stepjourney – the sender uploads the messageto their ISP’s mail-server, which then routesthe message to the recipient’s ISP’s mail-server, and the recipient then downloads itfrom their ISP’s mail-server. Each journeywill have separate latency, jitter and reliabil-ity statistics associated with it. However,general norms of service render most ofthese measures trivial given the compara-tively small size of email messages. Thecommunication that the users pay for iswith a computer on their ISP’s network, andtherefore not many router hops away fromtheir own computer, and generally lower la-tency, jitter and packet loss.
3.2.3 Causes of delay on the InternetSo what are the current causes of delays onthe Internet? It seems unlikely that band-width is the major cause of delays. In manyarticles, Andrew Odlyzko at AT&T arguesthat bandwidth utilisation is low – using acombination of several empirical sources –and that this may actually be economicallyoptimal. He produces estimates of band-width utilisation of around 10-15% forInternet backbones.14 This does, of course,mask a lot of variation but suggests that de-

- 15 –
lays are generally not caused by a lack ofbandwidth.
Figure 6: Causes of delays accessing popu-lar web servers
Network trans-
mission42%
DNS13%
Server outages
45%
Source: see text.
An unpublished study15 carried out in 1997examined whether or not popular serverswere reachable. For those that were reach-able, the causes of delays in accessing themare cited below in Figure 6.
! 45% of the delays were caused byserver outages, i.e. the computer one
was trying to communicate with wastoo busy to send information over theInternet in a timely fashion.
! 42% of the delays were caused by net-work transmission errors – possibly dueto router congestion or bandwidth con-gestion – unfortunately the report is un-published, so it is difficult to be sure.
! 13% of the delays were caused by DNSproblems – i.e. a failure to convert thename of the website into a network ad-dress. This is most likely the ISP’s DNSservers being either down or busy.
These findings, albeit unpublished and pos-sibly out of date, reinforce the point thatsome delays are outside the control of theISP – server outages, for example. How-ever, problems with DNS servers are withinthe ISP’s purview, and network transmissionproblems, as well as the relatively high fig-ure for server unavailability (20%) may bedue to poor upstream connectivity on thepart of the ISP.
3.3. The cost of accessing the Internet
It is possible to get very fast and very reli-able Internet access if you are willing to payfor it - the jump in price from dial-up PSTNto ISDN or xDSL reflects the big improve-ments in speed and reliability that are asso-ciated with these types of connections. Formost consumers and small businesses,though, cost is a high priority.
Broadband technologies are not equallyavailable throughout Europe, and pricingregimes have not yet settled down. To givean idea of the magnitudes in pricingbroadband, in the UK, ISDN access at128kbps is available for around £100 amonth. A 2Mbps ADSL line is availablefrom around £200 a month – though this of-fers a permanent connection.
The trade-off between speed and cost ismost clear-cut for consumers, as they can
compare the cost of finding information orentertainment online with the cost of gettingit from other sources. For business, the de-cision is more complicated, as it may be dif-ficult to estimate the increase in efficiencyor customer reach that an Internet strategymight bring. But for either group, cost isundeniably important.
Studies suggest that many home-users inEurope are put off using the Internet by theamount that it costs. This is demonstratedby the differences in usage between Europeand the US. In the US, the average timespent online each day is 55 minutes, com-pared to users in Europe who spend 17minutes a day online on average.16 Onlyone quarter of European Internet users areonline for more than half an hour each day.Another survey of Internet use in Europe re-
- 16 –
vealed that Europeans tend to be more fo-cused in their web-surfing than Americanusers, visiting certain sites of interest ratherthan surfing indiscriminately.
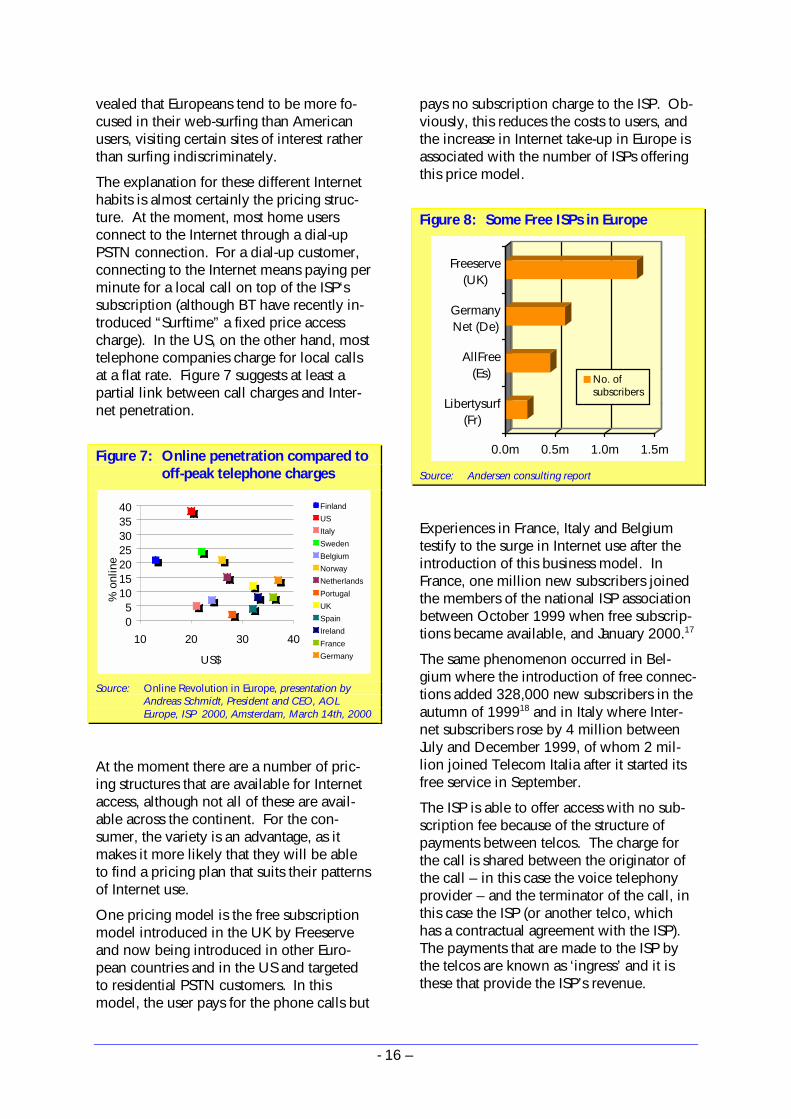
The explanation for these different Internethabits is almost certainly the pricing struc-ture. At the moment, most home usersconnect to the Internet through a dial-upPSTN connection. For a dial-up customer,connecting to the Internet means paying perminute for a local call on top of the ISP‘ssubscription (although BT have recently in-troduced “Surftime” a fixed price accesscharge). In the US, on the other hand, mosttelephone companies charge for local callsat a flat rate. Figure 7 suggests at least apartial link between call charges and Inter-net penetration.
Figure 7: Online penetration compared tooff-peak telephone charges
05
10152025303540
10 20 30 40
US$
% o
nlin
e
FinlandUSItalySwedenBelgiumNorwayNetherlandsPortugalUKSpainIrelandFranceGermany
Source: Online Revolution in Europe, presentation byAndreas Schmidt, President and CEO, AOLEurope, ISP 2000, Amsterdam, March 14th, 2000
At the moment there are a number of pric-ing structures that are available for Internetaccess, although not all of these are avail-able across the continent. For the con-sumer, the variety is an advantage, as itmakes it more likely that they will be ableto find a pricing plan that suits their patternsof Internet use.
One pricing model is the free subscriptionmodel introduced in the UK by Freeserveand now being introduced in other Euro-pean countries and in the US and targetedto residential PSTN customers. In thismodel, the user pays for the phone calls but
pays no subscription charge to the ISP. Ob-viously, this reduces the costs to users, andthe increase in Internet take-up in Europe isassociated with the number of ISPs offeringthis price model.
Figure 8: Some Free ISPs in Europe
0.0m 0.5m 1.0m 1.5m
Freeserve(UK)
GermanyNet (De)
AllFree(Es)
Libertysurf(Fr)
No. ofsubscribers
Source: Andersen consulting report
Experiences in France, Italy and Belgiumtestify to the surge in Internet use after theintroduction of this business model. InFrance, one million new subscribers joinedthe members of the national ISP associationbetween October 1999 when free subscrip-tions became available, and January 2000.17
The same phenomenon occurred in Bel-gium where the introduction of free connec-tions added 328,000 new subscribers in theautumn of 199918 and in Italy where Inter-net subscribers rose by 4 million betweenJuly and December 1999, of whom 2 mil-lion joined Telecom Italia after it started itsfree service in September.
The ISP is able to offer access with no sub-scription fee because of the structure ofpayments between telcos. The charge forthe call is shared between the originator ofthe call – in this case the voice telephonyprovider – and the terminator of the call, inthis case the ISP (or another telco, whichhas a contractual agreement with the ISP).The payments that are made to the ISP bythe telcos are known as ‘ingress’ and it isthese that provide the ISP’s revenue.

- 17 –
This is not an easy arrangement for the ISPto sustain, and in some cases it may bethought of as a temporary scheme to attractsubscribers. Many ISPs operate in highlycompetitive environments with slim profitmargins and relying on ingress can be arisky but necessary strategy. It is especiallydifficult to sustain in countries where tele-coms liberalisation was concurrent with, orjust preceded, the explosion in Internet use.In many of these countries, the dominantex-monopoly telco was able to take advan-tage of its market position to become thedominant ISP. Their reach and infrastruc-ture allows the telco to provide a free serv-ice more profitably than ISP competitorsand to charge other ISPs rates for leasedlines and network access that make the freesubscription model unprofitable.
The introduction of flat-rate Internet accesspricing models undermines the economiclogic of the ingress model. ISPs are there-fore trying to diversify their revenuesources. They are looking to commissionson e-commerce transactions conductedthrough their sites and to advertising as fu-ture sources of revenue.
Another model that has recently been intro-duced is the flat-rate connection fee. Thishas been the predominant model in the US.In the UK, some ISPs are offering what al-most amounts to a ‘free-free’ model, inwhich the user pays a one-off connectioncharge and makes no, or minimal, furtherpayments. ISPs are trying to restrict thisservice to home users and have introducedconditions to discourage business use suchas only allowing flat rate access in the eve-
nings or at weekends, 10 minute time-outs(automatic disconnection after 10 minutesof inactivity) and compulsory session termi-nation after two hours.
In the US, subscription-free broadband ac-cess has recently been introduced by theBDG (broadband digital group) in Califor-nia. It offers ADSL service at 144kbps. Theuser has a bar across the bottom of theirbrowser that displays targeted advertisingand the company collects data on the user’sInternet habits for marketing purposes. Thebusiness model depends on the amount ofmoney that they can make from advertisersand marketing companies and may not turnout to be sustainable.
Earlier pricing structures with subscriptionfees and call charges may not disappear en-tirely. People who only want to use theInternet for short periods of time may findthat the flat-rate structure is not advanta-geous to them and the costs of supplyingbroadband access means that consumerswill almost certainly have to continue topay for the higher QoS levels.
As the Internet becomes more and morecentral to personal and business life, thedemand for broadband is certain to grow.Unfortunately, it is not just a matter of beingwilling to pay for the higher level of serviceas the roll-out of broadband has been slowin many places, and it may be months oryears before these high speed services be-come available to businesses across thewhole of Europe.
3.4. Can Quality of Service be guaranteed and does it matter?
The primary function of the Internet is to al-low computers to communicate with eachother. By definition, communication in-volves two or more parties. It remains diffi-cult, therefore, for any single player to uni-laterally determine the speed ofcommunication with all other parties. Themost any individual – or any ISP – can
achieve is obtaining dedicated bandwidthto a particular router or series of routers.The speed at which data is communicatedwill also depend upon the congestion at therouter, the bandwidth of the other party tothe communication to the router and alsothe speed at which the other party can senddata down their bandwidth to their router.

- 18 –
Guaranteeing a certain data communicationspeed with, say, AltaVista would requirededicated bandwidth between oneself andAltaVista. Guaranteeing a certain datacommunication speed with everyone on theInternet would require dedicated bandwidthbetween oneself and everybody else on theInternet. This would not only be totally im-practical; it would also obviate the econo-mies achieved by bundling people’s varyingbandwidth requirements.
There are compromises possible betweenthe two extremes of dedicated bandwidthbetween two particular computers or net-works, and the global but non-guaranteednature of the Internet. One example of thiswould be the service offered by Anx.19 Thisin, effect, a private network which guaran-tees quality of service between members ofthe network. This is not the same thing asthe Internet – in fact their website states that“The public Internet and ANX service arecompletely separate and distinct entities.”[emphasis added] However, it demon-strates neatly the point that there is a trade-off between guaranteed QoS and the uni-versality of the Internet, and that points inthe middle of the spectrum are possible andachievable. However, given the desire for a‘global’, or ‘public’, Internet the possibilityfor completely guaranteed QoS is non-existent.
It is initially disconcerting to know thatthere cannot be guaranteed levels of datacommunication speed over the Internet – itwould appear to limit its use for business-critical applications, and reduce the scopefor ISPs to differentiate themselves. How-ever, this is not the case.
The lack of guaranteed service does notnecessarily render the Internet unusable forbusiness-critical purposes. Of course, totalguarantees of service do not exist with anytechnology; in practice, businesses will usea technology provided it is cost-effective todo so – where there is a high risk that atechnology will fail, they will adopt a back-up technology.
Consider the telephone system, for exam-ple. Businesses have a reasonable expecta-
tion that the telephone system will operateround the clock, every day of the week. In-deed, for many businesses, the telephonecould be defined as a business-critical tech-nology. And yet, failures do occur. On 25February 2000, network outages hit the UKtelephone system meaning that local-ratenumbers, used by call-centres, ISPs and thelike, were unobtainable for many customersfor much of the day.20 Electricity is anotherexample. For most businesses, some busi-ness-critical applications will be dependenton electricity. And yet, power cuts do oc-cur – the level of service is not guaranteed.Businesses can develop strategies such askeeping diesel generators for key systems orinvesting in ‘uninterruptible’ power suppliesfor computers.
Differentiation is also possible in the ab-sence of guaranteed QoS. Consider, for ex-ample, airline travel. On most flights thereare two or three distinct service levels, withvery different fare structures. However,there can be no guarantee that one servicelevel will be superior to another. Travelfirst class, and there may be a crying babysitting behind you. Travel economy and itmay be empty, allowing you to stretch outover four seats and get a full night’s sleep.The airline cannot explicitly guarantee QoS.Instead, passengers pay for the reasonableexpectation that the QoS will be higher infirst class, as indeed it is most of the time.
The same is true of most good or servicesconsumed. Holidaymakers will pay a pre-mium to go to a generally sunnier destina-tion in the reasonable expectation that itwill be sunny, but it may not be while theyare on holiday. People will pay a premiumto send mail first class, where it is available,in the reasonable expectation that it will ar-rive sooner than second class mail, but thisis not guaranteed.
So the lack of absolute guarantees does notnecessarily prevent a market for differenti-ated service levels – they have merely to besufficiently separate that customers can formreasonable expectations of the differentservice levels, and be willing to pay a pre-mium for a higher expectation of service.

- 19 –
PART II - QOS PARAMETERS

- 20 –
4. Background to the Parameters
4.1. Developing QoS Parameters
Useful parameters must have certain quali-ties. Their purpose is to allow the user tomake an informed decision of how to con-nect to the Internet. To make this possible,the selected parameters must be:
! Relevant. In section 2.3 above, we es-tablished that Internet needs can besummed up as speed and reliability bal-anced against cost. A parameter is onlyuseful, therefore, in so far as it reflectsthe actual experience of the end user inthese respects. The relevance of anyupstream measure will need to be justi-fied in its relation to the end-user’s ex-perience.
! Comprehensible. Home and SMEInternet users are faced with a gulf be-tween their vocabulary and experienceand that of the ISPs. The meaning of theparameter and the method of the calcu-lation must be clear enough to the userthat they can define and defend theirQoS needs.
! Quantifiable. While anecdotal evi-dence or opinion can be useful in takinga decision, it is not a systematic way tocompare the level of service, and so theparameter should preferably be ex-pressible as a number to assist compari-son. Of course, not every aspect of QoScan be boiled down to a number, andsome important considerations could belost were this criterion to be applied toostrictly.
! Measurable. If a parameter cannot bereliably and accurately measured for atechnical reason then it is not going tobe possible to use it for fair comparisonsbetween ISPs or technologies. Themeasurement process itself should notaffect the performance of the system orthe values generated, and the techniqueshould preferably be auditable, i.e. veri-
fiable by an independent actor, even ifthe ISP normally makes the measure-ments. One of our interview respon-dents noted that many exaggeratedclaims for reliability were currently be-ing made by networks which were sim-ply unverifiable.21
! Comparable, in the sense of being ap-plicable to different technologies. If theuser is trying to decide between a low-cost/low-service scenario and a high-cost/high-service scenario, then theymust have some parameters that can beapplied to all possible technologies onwhich to base their decision.
! Revealing. While a general parametermeasuring speed, for example, has clearrelevance for the end user, it does nothelp to identify the area in which theproblem is occurring and thus whosearea of responsibility it falls in.
! Available. Finally, the parameters mustbe available in the public domain to beuseful. This does not necessarily affectthe choice and design of the parame-ters, but will affect their usefulness. Wediscuss how they may be made avail-able after our exposition of the parame-ters themselves.
The discussions above have shown that theneeds of the user are multifarious and thecomplex organic nature of the Internet issuch that it is necessary to identify a rangeof parameters for QoS. The actual experi-ence of using the Internet and the level ofsatisfaction that the user experiences is nota measurable commodity, nor would it bepossible to use such a measure as the basisfor a QoS agreement between the user andtheir ISP. Instead, a package of technicalmeasurements may be used which together

- 21 –
build into a picture of the user’s QoS expe-rience.
Trying to limit the number of parametersmay be counter-productive as it gives theISP an incentive to focus on a particularmeasure, perhaps at the expense of generalQoS. There will also be trade-offs between
certain measures – for example betweencost and reliability of service.
Against these considerations the followingsection will consider various parameters forQoS, seeking to identify a set of measuresthat may most usefully form the basis forjudging the performance of the ISP from thepoint of view of the consumer or SME.
4.2. Choice and development of parameters
Based on our discussion above, we haveidentified five broad areas of QoS which theparameters should measure. These are:
! Ability to connect, that is how quickand easy it is to connect to the ISP;
! Downstream connectivity, that is howquick and reliable the connection be-tween the user and their ISP is;
! Upstream connectivity, that is howquick and reliable the connection be-tween their ISP and the rest of the Inter-net is;
! Cost, that is the cost of Internet connec-tivity and presence; and
! Others, that is a selection of other crite-ria on which the individual or SMEs ex-perience of the Internet can be judged.
Within each of these broad headings, wedeveloped some initial parameters to try tocapture important and measurable aspectsof the users’ experience.
We then discussed these parameters with aselection of key industry players – ISPs,NAPs and telcos. As part of this process,our list of parameters was somewhat re-vised, but we also gained some depth in ourinsights as to what these parameters meas-ured, how they could be refined, and whatvarious values meant for the user’s experi-ence. Appendices 1 and 2 present somemore detail, as well as a list of the peopleinterviewed.
For the sake of clarity of exposition, we willonly present here the final set of parame-ters, as well as some discussion of whatthey mean and how they could be meas-ured.
Finally, it is important to remember that notevery parameter will be relevant to everyuser – the final chapter in this section willrevisit our sample users described in Chap-ter 2, and consider which parameters willbe important for which users. It will alsodiscuss how the parameters could be meas-ured and how they could be used as a basisfor various comparisons.

- 22 –
5. Ability to connect
The first step in using the Internet is – bydefinition – connecting to the Internet. Asdiscussed above, there is a wide variety ofmeans of doing this and even within thesame technology – such as using a modemfor a dial-up connection – there are a num-ber of different types of ISPs with whomone can connect. These include ISPs whocharge a subscription fee, those who rely onsplitting the cost of the phone call with thetelco in order to derive a revenue stream,and those who rely on advertising and donot charge the user for Internet access at all.These different business models for ISPsmay well offer different levels of QoS totheir customers.
In addition to the main parameters below,the ease of setting up an account with theISP could be considered. This includes suchfactors as how quickly the software to sub-
scribe arrived, if it was possible to sign uponline, if installing the software was trou-ble-free and if support was available. Sincethese factors are difficult to measure objec-tively and are likely to constitute a ‘one-off’experience they have not been included asgeneral measures of quality of service. Theease with which the user can switch be-tween ISPs is also not explicitly consideredfor the same reason.
The parameters described below are de-signed to be reasonably comprehensive –not every parameter will be relevant toevery user and to every technology. Themost striking example of this is the devel-opment of new ‘always on’ technologiessuch as xDSL and cable modems, where theachieving of a connection is rendered al-most irrelevant, though connection interrup-tion may remain a problem.
Parameter 1: Number of attempts required to achieve connection
DefinitionThe average of and variation in the numberof attempts the user has to make before suc-cessfully connecting to the ISP.
DiscussionIdeally, connection would be achieved firsttime, every time, so both the average andthe variation should be low.
Dial-up customers who consistently findthey receive two or three ‘busy’ signals arelikely to become frustrated with the service,blame the ISP for the problem and ulti-mately switch providers.
In fact the responsibility for the busy signalmay not lie with the ISP and actually becaused by congestion on the telephone ex-change into which the user is dialling, orsome other telephone network problem,
such as ‘flaky’ lines or connections. An-drew Bonar, founder of Surflondon, and IanRobertson from Fastnet International bothsuggest that this is more often than not thecase. We would note, though, that wherean ISP has contracted with a telco to pro-vide free or local-call rate numbers and thetelco is not able to meet the resulting net-work requirements, this is, in a sense, theresponsibility of the ISP.
To appreciate the likelihood of a dial-upcustomer getting a busy signal due to theISP having a large number of users online,considering the modem contention ratio isuseful. This is the ratio of subscribers toports (modems). In general the higher thisfigure is, the harder it will be to connectfirst time (you can only have as many cus-tomers online as you have modem portsavailable). A contention ratio of roughly8:1 or lower is considered good.22

- 23 –
The measure is however, at best, a guide.Potential problems with the measure lie inthe fact that while an ISP may have an at-tractive sounding contention ratio, its usersmay nonetheless have difficulty connectingfirst time. Conversely, the customers of anISP with a relatively poor sounding conten-tion ratio, say 30:1, may be able to connectfirst time more often. This must be under-stood within the context of the distinctionbetween ‘user’ and ‘subscriber’ as well as aconsideration of the call tariff structure forthe particular ISP.
Consider two ISPs, one of which has a toll-free access number and one without.While they may have the same contentionratio, it is likely that the customer of the freecall ISP would be less likely to connect onthe first attempt, as at any given time moreof the free call ISP subscribers are probablygoing to be users (i.e. actually online) asthey will tend to connect more often andspend more time online per connection.
Thus, the contention ratio needs to be con-sidered in the light of the subscribers’ actualInternet usage. The measure is less relevantfor large ISPs (i.e. those with 500,000 ormore subscribers) as their users’ aggregatedbehaviour becomes more predictable.23
Steve Rawlinson of ClaraNet argues that in-stead of focussing on maintaining an attrac-tive sounding contention ratio, ISPs shouldinstead ensure they have enough modemsto cater for their peak concurrent usage.
While being unable to connect first timeevery time may simply be an inconveniencefor an individual wanting to check email, orview sports results, for the business userwho may need to connect to the Interneturgently, this problem could prove costly.
This parameter is largely irrelevant to userswith ‘always on’ connections, such as xDSLor a permanent ISDN connection, as theywill always have a connection to their ISP.
Parameter 2: Time to connect.
Definition:The average of and variation in the timetaken for the user to establish a connectionwith the ISP server.
DiscussionThis measures the time from when theuser’s computer dials the ISPs server untilgetting logged on. It includes the time takenby unsuccessful dial up attempts and thetime taken to log on – the time the modemstake to negotiate with each other, and forthe ISP to verify the user name and pass-word. In practice, this parameter is affectedby the termination hardware used by the
ISP, the speed of connection and the qualityof the phone line.
As well as the factors described above,which may mean that several attempts aretaken to connect, the time will vary accord-ing to the compatibility of the user and ISPmodems. This time taken for the hardwareto negotiate decreases with the widespreadadoption of successive standards for mo-dems (currently the V90 standard). Sinceno two modems are ever perfectly compati-ble, to be generally applicable, this parame-ter would need to be tested using severaldifferent devices at several different connec-tion speeds.
This parameter is largely irrelevant to userswith ‘always on’ connections.

- 24 –
Parameter 3: Time to connect during the busiest hour of the week.
Definition:The average of and variation in the timetaken to establish a connection and log onto the ISP server during their busiest hour(i.e. that when the most users are online).
DiscussionThis measures the time from when theuser’s computer dials the ISPs server untilgetting logged on during the ISPs busiesthour of the week. Ian Robertson of Fastnetcommented that the latter stage shouldn’tbe any different irrespective of how busythe ISP was.
Since by definition this is when most userswill be trying to log on it is an importantmeasure. For business ISPs it is likely to bethe start of business hours on weekdays
while for home-user-based ISPs it may beweekday evenings and weekends.
This parameter may be more important forSMEs – who may need to connect at spe-cific times during the week in order to con-duct business – than for individuals whobrowse the Internet for recreational pur-poses and may object less to there beingbusy periods during which it is more diffi-cult to get online.
This is a very difficult parameter to measureas it is impossible for an outsider to knowthe busiest hour of the ISP.
Once again, this parameter will be largelyirrelevant for those with an ‘always-on’connection.
Parameter 4: Frequency of connection termination.
DefinitionNumber of times per month the user’s con-nection is terminated for reasons other thantheir choosing to disconnect.
DiscussionFor dial-up connections, connection termi-nation, or line drops, will occur due to de-fects in the telephone system in the vast ma-jority of cases, according to the ISPs weinterviewed. The reasons may also lie inthe user’s PC trying to multitask beyond itscapability causing it to become overloadedand simply give up on the connection, ordue to line interference resulting from an-other person trying to use the same line,24
or due to certain Intelligent Network (IN)features, such as call waiting.
There tends to be a consensus amongst ISPstaff interviewed that connection termina-tion is generally not ISP-based but causedby a ‘user error’ such as a problem withtheir hardware or a problem arising fromthe telco.25 However, if a user is able toconnect to a different ISP without such ter-mination problems, it is reasonable for themto conclude the problem was down to theISP, or at least associated with the ISP’s par-ticular set-up.
While they may not be willing to admit itpublicly to their customers or potential cus-tomers, it is highly likely that some networkmanagers disconnect so-called ‘hogs’ –

- 25 –
people who leave their connection idle forlong periods.
Also it is known that upgrading or mainte-nance of terminating hardware necessitatesdisconnections. There have also been caseswhere immature software on the modemshas caused many user disconnections.
In the case of users with an ‘always on’connection, termination may be caused byproblems with the telecommunications in-frastructure – such as a workman cuttingthrough a cable accidentally, or a hardwarefault either with the user or the ISP.
In practice it is extremely difficult to identifythe reason for connection termination, andthis parameter may identify ISPs with moreproblems than others but may not be able
to help in identifying the source of the prob-lem.
In addition to being inconvenient, and re-quiring reconnection, termination can frus-trate the user’s e-commerce experiences inparticular. It is particularly disconcerting tolose connection while an online financialtransaction is being processed. This resultsin uncertainty as to whether orders weresuccessfully placed. Connection termina-tion is more of a problem for those users forwhom a continuous connection is particu-larly important for their online activities.Amongst personal users this would be thecase for online gaming enthusiasts and forpeople accessing real-time streaming mediasuch as news bulletins.
Parameter 5: Frequency and duration of ISP ‘outages’.
DefinitionOccurrence and duration of ISP server be-ing unobtainable.
DiscussionThis is a situation in which the ISP server isunavailable or unobtainable. Software orhardware bugs, server upgrades takingplace, a loss of power supply or other tech-nical problems with the server, can causethis. During these generally brief periodsthe ISP is in effect ‘off-air’.
Ian Robertson, Manager of Fastnet Interna-tional, commented that ‘outages’ shouldonly occur due to power failure, and thatISPs ought to have back-up or alternative
power supplies available to get their servicerunning as quickly as possible. It was sug-gested to us that it is good practice for theISP to inform their customers of forthcomingserver maintenance resulting in temporaryunavailability. Outages can also occur ifthe backbone provider is undertaking main-tenance.
We note, though, that in the authors’ expe-rience, ISP outages occur for many reasonsother than power outages, such as a smallISP losing its link to the bigger ISP that theyuse for their connection to the backbone.
In order to test this parameter comprehen-sively, one would need to test the HTTP,FTP and mail servers separately to get anaccurate reflection of the situation.

- 26 –
6. Downstream connectivity
Once connected to the ISP, an importantelement of the user’s QoS is the speed ofcommunication with the ISP itself as the ISPis the focal point through which all com-munication with other computers con-nected to the Internet will occur.
This section will discuss some parameterswhich can be used to measure the speed ofthe connection between the user and theISP. Again, not all the parameters will be asimportant to every user – each parameterwill need to be judged for its relevance toeach particular situation.
One subtlety which emerged during our in-terviews was that most interest is currentlybeing paid to download speeds – howquickly users can retrieve information fromthe Internet – rather than to upload speeds– how quickly users can send informationto other computers on the Internet. At pre-sent, upload speeds have very little impacton the majority of users’ experience. Formost of the time, users’ uploads will consistprimarily of email, inputting data such astext on a form, and mouse actions such asclicking icons and links. Since these ac-tions for the most part require very littlebandwidth, upload speed is not really a sig-nificant factor when considering the Internetexperience for most users. In the near fu-ture, however, upload speed may become afar more significant factor. Although emaildoesn’t require high upload speeds, videoconferencing, video mail, unified messagingsome e-business applications, online gam-ing and uploading MP3 files do.
We raise this point as upload and downloadspeeds are often asymmetric -- we were toldthat the maximum upload speed of standardtwin copper wires remains at 33.6kbps,even for the now standard 56kbps modems.ADSL is another example of a technologywhere the upload speed is a mere fractionof the download speeds achievable.
Inevitably, these measures will capture – aswith the previous section on the ability to
connect – an element of the QoS providedby the telecommunications infrastructure.Many of the ISPs we talked to emphasisedproblems with this infrastructure, and werekeen that not all ‘blame’ be attached to theISP. We would stress again that thesemeasures are meant to be merely passive –they may reveal particular problems withoutnecessarily revealing the precise cause ofthe problem. This, we feel, is entirely ap-propriate, as it is unrealistic to expect usersto develop sufficient technical expertise tobe able to pinpoint exactly particularlytroublesome features of their Internet con-nection – the vast majority will only be in-terested in ‘headline’ performance figures,which is what our parameters try to capture.
We would emphasise that while there maybe a general assumption that the user’sspeed of connection to the ISP determinesthe speed with which the user can browsethe Internet, this is not strictly true. Themeasure looks only at the rate of downloaddownstream of the ISP. As such it ignoresthe quality of the ISP’s (upstream) backboneconnection. This measures the ISP’s con-nectivity to the rest of the Internet and isconsequently extremely important whenconsidering the speed at which the user canbrowse the Internet. The downstreamspeed of connection will by itself determinehow fast sites either stored in the ISP’scache or hosted on their server may be ac-cessed. One ISP commented that the actualconnection speed bears surprisingly little re-lation to how fast the user’s browsing expe-rience is while conceding that at presentpeople do tend to attach a lot of importanceto the headline number of the speed ofconnection to the ISP, which appears on auser’s screen once they have connected.Considered in conjunction with the qualityof an ISP’s upstream connectivity however,the speed of connection will have a majorimpact on the user’s experience.
We consider the quality of the ISP’s up-stream connectivity in the next section.

- 27 –
Parameter 6: Theoretical maximum speed of connection.
DefinitionMaximum possible data transfer rate, meas-ured in kilobits per second (Kbps) or mega-bits per second (Mbps), between the ISPand the user.
DiscussionThe most obvious limitation on the maxi-mum speed of connection is the hardwarebeing used.
In almost all cases, there is a single headlinefigure which determines this. A user dial-ling into their ISP where both sides have
compatible 33.6kbps modems, for example,will have a maximum connection speed of33.6kpbs. With a two channel ISDN con-nection, the maximum speed is 128kpb.These maximums are, however, theoretical– in practice, lower speeds may beachieved and, in some limited cases, higherspeeds may be achieved through the use ofsoftware compression.
The actual speed achieved is the subject ofour next parameter.
Parameter 7: Connection speed achieved.
DefinitionAverage and standard deviation of datatransfer rates actually achieved.
DiscussionAs mentioned above, the theoretical maxi-mum connection speed may not beachieved in practice.
We were told by one ISP that we spoke to26
that for dial-up connections, the most likelylimiting factor lies with the capacity of thetelephony infrastructure, in particular by thecustomer’s local loop telephone exchange.If an ISP supports the V.90 standard and us-ers dialling in with this technology are un-able to connect at speeds above, for exam-ple, 43kbps the reason almost certainly lieswith the quality of the local loop. Oldertelephone exchanges simply cannot supportthe rates of data transfer now being de-manded by Internet usage. ‘Maxing out’ the
capacity of standard twin copper telephonewires leads to ‘flaky’ connections in whichthe connection is more likely to be lost.
For some newer connection technologies –such as xDSL or cable – the maximum con-nection speed is high but because of con-tention ratios further upstream, the ‘full’connection speed may not always be avail-able. This issue will arise, for example,with cable connections where bandwidth toa neighbourhood is shared between all us-ers in that neighbourhood. In the case ofxDSL, there are issues about how much‘upstream’ bandwidth is shared betweenusers – in the case of British Telecom in theUK, we were told that the ratio of upstreambandwidth to the number of users was50:127. Although, therefore, the maximumachievable speed is high, the actual band-width delivered may be substantially lower.This phenomenon should be most reliablycaptured by our parameter 9 below.

- 28 –
We were told that it is virtually impossibleto know in any individual case why some-body is connected at a certain speed.28 Itmay be possible, though, with a large num-
ber of data points to be able to use suchdata to assist in the diagnosis of problem ar-eas.
Parameter 8: Latency, jitter and packet loss statistics
communicating with the ISP.
DefinitionAverage and variation in latency, jitter andpacket loss (as defined in Chapter 3) whencommunicating with ISP servers.
DiscussionAll Internet traffic passes, by definition,through the ISP. When browsing, for ex-ample, or video-conferencing, data will passthrough one or more routers belonging tothe ISP before being passed on to the Inter-net ‘proper’ – or possibly a cache if brows-ing. When using email, the user’s commu-nication will probably be exclusively withtheir ISP’s mail-server.29 Therefore, if thereare systemic problems connecting with theISP’s routers or mail-servers, the user’sInternet experience will suffer.
This parameter should be able to measurethe reliability of the ISP’s internal network,and should be tested for several points onthe ISP’s network. Suggestions include theISP’s mail-server, the first of the ISP’s routersused,30 and the ISP’s DNS servers.
It is true that latency, jitter and packet lossare by no means the only factors of interestwhen considering network performance(see Chapter 3 for more discussion of thispoint). It is also true that the results are notnecessarily fully transparent – a point rein-forced by some of our interviews. A par-ticular computer or router, for example,may give a relatively low priority to re-sponding to ‘pings’, artificially increasingthe latency of that particular node. It maybe, then, that latency statistics for individualnodes are relatively insignificant.
However, latency may well be interesting ifcompeting connection technologies areconsidered. A key factor affecting latencyfor dial-up connections is the fact that, fornon-digital telephone lines, the data aresent in analogue form. This means that theoriginating modem must first convert thedata into analogue form before sendingthem. The recipient modem must then re-convert the analogue signal into a digitalmessage. The time taken to perform theseoperations is increased further by the some-time practice by telcos of themselves recon-verting the analogue signal received into adigital signal to be transmitted, before it isswitched back to an analogue signal prior toits destination (where it will be again con-verted into a digital signal to be understoodby the destination computer). This can addsignificantly to latency for PSTN dial-upconnections when compared to, for exam-ple, ISDN connections.
Jitter and packet loss can be far more reveal-ing than latency when considering the ISP’sinternal network. High levels of jitter sug-gest a busy internal network, which will ad-versely affect the user’s Internet experienceif they are using time-critical Internet appli-cations such as on-line gaming or video-conferencing. High levels of packet lossmay reveal, for example, reliability prob-lems with the ISP’s mail-server or its DNSservers, which will be highly detrimental toInternet usage. One of our intervieweessaid that packet loss in particular is criticalto the service the customer’s receive.

- 29 –
Parameter 9: Speed of download from ISP’s server(s)
DefinitionAverage and standard deviation of time todownload files from websites hosted by theISP.
DiscussionAs discussed under the above parameter,measuring jitter, latency and packet loss canbe indicative of overall performance as wellas revealing of particular problems, but do
not necessarily affect the user’s experience.This parameter therefore will measure theaverage and standard deviation of the timetaken to download a standard-sized file (e.g.1 megabyte) from a website hosted by thesame ISP as used to connect to the Internet.This single parameter will provide a guide –together with the previous parameter – tothe efficiency of the ISP’s internal network.
Parameter 10: Speed of download from ISP’s mail-server.
DefinitionAverage and standard deviation of time todownload files from the ISP’s mail-server.
DiscussionThis parameter is similar to the previousone, except that it measures the time takento download a standard-sized attachment
(e.g. 1 megabyte) from the ISP’s mail-server.The purpose of this is to measure how longit takes to retrieve sizeable email messages.The time taken to achieve the downloadwill include the time taken to re-try if thedownload is unsuccessful and will thereforeinclude problems such as the mail-servergoing down during a download, or exces-sive packet loss causing the download toabort.

- 30 –
7. Upstream connectivity
This section considers the ISP’s connectivityto the Internet ‘proper’ – i.e. beyond theconfines of the ISP’s internal network. Thisis clearly important for the end user sincethe vast majority of Internet activity willdemand the retrieval of data from beyondtheir particular ISP’s network. It is, as dis-cussed in the first part of this report, theInternet’s global reach that renders it useful– a world-wide web which is not world-wide has considerably less value.
The customer’s ISP has to retrieve the re-quired data through the Internet before theindividual user can access it. In terms ofthe overall Internet experience, the ‘better’the ISP’s upstream links are, other thingsequal, the faster and more reliable theuser’s Internet experience will be. This sec-tion aims to identify what exactly consti-tutes a better or worse upstream connec-tion. This area is less straightforward thanthe downstream connection considered inthe previous section where, for exampleyou can be connected at 56kbps, 128kbpsor greater depending on the user and ISPhardware. It initially appears logical topropose a corollary between this and theISP bandwidth to a NAP – which, as wasdiscussed earlier in the report, is a connec-tion point between ISPs – but, as will beseen, many more factors need to be takeninto consideration. The quality of the ISP’supstream connection depends on an evenlarger number of variables, many of whichare not explicitly under the control, or re-sponsibility of, the ISP. However, the ISP isresponsible for establishing these arrange-ments, most notably peering, and ultimatelythe subscriber won’t care why their connec-tion is better or worse, merely that it is.
Steve Rawlinson from ClaraNet commentsthat: “Some ISPs have resorted to the excusethat a troubled route is off their network andtherefore there is nothing they can do aboutthe problem, and this has led people to theconclusion that it might be better to connectto an ISP with a large network so that theyhave less of an opportunity to use this ex-cuse. The truth is that this excuse is com-
pletely bogus and it is the ISP's responsibil-ity to make sure they have diverse routingwhether they achieve that by building anetwork of their own or using others makesno difference.”
It appears that in setting up NAPs, Europehas benefited and learned from the earlierUS experience. We were told by a Euro-pean NAP we spoke to that whereas someUS NAPs, such as MAE West and MAE Eastare frequently congested, this is, in general,not the case in Europe where NAPs are byand large well-managed and non-congested.31 Walter Van Dijk commentedthat AMSIX has been better able to predictgrowth of Dutch Internet traffic by lookingat the US experience. Denis Curran fromInex, an Irish NAP, commented that privatepeering is used a lot in the US becausesome of the public peering points are badlyrun and can be congested. Since the peer-ing parties control private peering arrange-ments, they can ensure that links are ofadequate capacity.
From the perspective of the end user’sInternet experience – though not necessar-ily for the end users themselves -- it is vitalto consider not just how congested individ-ual NAPs become, but how congested indi-vidual ISP bandwidth connections to theNAPs become. This is because latencytends to increase markedly when band-width utilisation exceeds 70%. It is irrele-vant to know that an ISP has peering ar-rangements at a non-congested NAP if theISP they subscribe to has a congested con-nection to the NAP.
The issue of ISPs’ upstream connectivity isvery complex, and many factors can affectthe actual quality of service which the end-user experiences. The parameters outlinedbelow reflect a first rather than definitive at-tempt to try and measure the most tractableof these factors in a way which is not tootechnically complex for users to understand,and yet at the same time permits meaning-ful and objective measurement of the usersquality of service.

- 31 –
Parameter 11: Ratio of ISPs’ bandwidth to product of number of
customers able to achieve simultaneous connection and the maximum
bandwidth of those connections.
DefinitionThe ratio of the ISP’s upstream bandwidthto the product of the number of users ableto achieve simultaneous connection (in asimple scenario, the number of modems theISP has) and the maximum bandwidth ofthose connections (in the same simple sce-nario, the speed of these modems).
DiscussionThe intuition behind this parameter is rea-sonably simple – what happens if everyonetries to log on and download a huge file atthe same time? Does the ISP have enoughupstream capacity to handle this?
In practice, such a scenario is relatively un-likely – most people do not log on and use100 per cent of the theoretical maximum oftheir bandwidth at the same time. How-ever, such events can happen, and the ratioshould at least show how often a user’sspeed will be inhibited by a lack of up-stream bandwidth.
The number of customers able to achievesimultaneous connection is determined bythe number of ports the ISP has, and themaximum bandwidth of the connections isdetermined by the type of hardware usedfor the connections – if the ISP merely offersdial-up access, the calculation is merely thenumber of modems the ISP has multipliedby the speed of these modems (for example,56kbps). A similar calculation can be made
for other technologies, such as ISDN orxDSL.
However, our interviews suggested that itwould be very difficult to obtain an accu-rate assessment of an ISP’s upstream band-width – this could be defined as any or allof: their link to the NAP; the bandwidth oftheir own network; and the bandwidthwhich their upstream provider has avail-able.
We were told that upstream bandwidthneeds to be measured using the bandwidththe ISP can utilise, which is dependent ontheir upstream contract provision, ratherthan the amount they physically have.These figures may differ since although anISP may have a 2Mbps link to a NAP, theirport connection at that NAP may be limited(in their service agreement with the NAP) to1Mbps. This cannot be externally verified.This scenario can arise because the cost ofNAP connection is relatively expensivecompared with the cost of the actual cables.
Keith Mitchell of LINX suggested that this isa key measure of ISP Quality of Service, butthat measuring it would be difficult.
There is an element of possible discrimina-tion against larger ISPs in using this parame-ter, as with more users, the more predict-able are traffic patterns and the less likelythat all users will want to use their maxi-mum bandwidth at any one time. This pa-rameter may need some more detailed con-sideration before use.

- 32 –
Parameter 12: Proportion of packets travelling through the ISP’s
routers which are lost.
DefinitionThe percentage of packets that the ISP sendswhich are unable to find their destination(are dropped).
DiscussionIndividual packets of data queue at routers,waiting to be sent to their destination. If thebandwidth that the data is waiting to use isfull the router queues the waiting packets.When this queue is full the router discardspackets, and these become lost packets. Inaddition packets which cannot find theirdestination after a given number of router‘hops’ are dropped.
Steve Rawlinson from ClaraNet suggestedthat packet loss on the ISP’s own networkcould be used as a proxy -- “any ISP withnon negligible packet loss on its own net-work is going to [have] miserable connec-tions.” He suggests that in general it is par-ticular routes that cause problems. Othershave suggested that anything above 5% isunacceptable.32
These statistics are available from Internetmonitoring companies. For example, MIDSprovide a service called Matrix InternetQuality in which latency, packet loss andreachability statistics are gathered for ISPsworldwide.
Parameter 13: Proportion of designated sites connected to: (a) the
ISP’s own backbone/backbone provider(s); (b) to the ISP through
private peering arrangements; and (c) through public NAPs/IXPs.
DefinitionProportion of designated sites (e.g. for abusiness its most demanded or business-critical websites – such as its suppliers’websites, or websites used for research, andfor indiscriminate users, this could be thetop 50 visited websites)33 which are con-nected (a) to the ISP backbone/backboneprovider, (b) via private peering and (c) viapublic NAPs.
DiscussionThese data can be obtained from peeringregistries from the RIPE NCC document
store.34 LINX also maintains a database ofmembers’ peering details.
We were told that there shouldn’t be anydifference for the end user according to themethod of connection, whether it be (a), (b)or (c). An ISP with several well connectedupstream providers and a very small net-work of its own will be better serving its us-ers than an ISP with an enormous reach butclogged pipes.35
In practice, the user’s experience dependson such factors as the congestion of thepeering partners’ networks, the quality ofthe backbone connected to, and the conges-tion of the NAPs peered at. As long as theISP peers at non-congested NAPs and those

- 33 –
ISPs’ networks with which it has private ar-rangements are non-congested, thisshouldn’t be an issue. There is no a priorireason why either method of connectionshould be preferable to another.
Denis Curran from INEX commented that ifthe NAP is well-managed, as most EuropeanNAPs are, a public peering point can be asgood as a private peering. Private peeringyields more control over the ISPs connec-tions but is difficult to establish – large ISPswill generally only peer with other largeISPs in order that the volume of traffic be-tween the ISPs is broadly symmetric –though we have heard it suggested thatsome larger ISPs are starting to offer privatepeering for a fee. These private arrange-
ments are based on trust and are not adver-tised.36
Private peering is used a lot in the US assome of the public peering points are badlyrun and can be congested.
Assuming that the congestion of the routestaken by the data under the various scenar-ios – (a), (b), or (c) – is similar, the mostlikely difference between them will be thephysical distance over which the data trav-els. As described previously, this, in itself,is unlikely to have a noticeable impact onthe time taken for users to download data.The consensus among the ISPs and NAPswe interviewed was that this parameter willhave little use in Europe.
Parameter 14: Proportion of time which designated sites
are unreachable.
DefinitionProportion of time that designated sites (asdefined under parameter 13) are unavail-able.
DiscussionA website can be unavailable for many rea-sons. This can happen if a site has toomany concurrent users, if the server onwhich the site is hosted is down, if powersupply is terminated and for many otherreasons. Although most of the reasons arebeyond the control of the user’s ISP, in-stances of websites being unavailable willadversely affect the quality of service thatusers receive from the Internet. This can berelevant, for example, if comparing thequality of service received by users in dif-ferent countries – if the top 50 websites inFrance are more prone to being unavailable
than those in Germany, it could be arguedthat the Germans are receiving, in this par-ticular regard, superior quality of service tothe French.
Although many instances of unavailabilityare beyond the control of the ISP, there maybe specific instances where there is a prob-lem specific to an ISP – if for example, ithas a private peering arrangement with theISP hosting a specific website, but the peer-ing occurs through a private IXP which isprone to power failure, this could cause aspecific ISP to be able to offer less reliableconnectivity to that specific website thananother. In practice our interviews sug-gested that this was comparatively rare.However, we have maintained this parame-ter as even small differences between ISPscould affect users who want very reliableservices considerably.
- 34 –
Parameter 15: Latency, jitter and packet loss statistics
for designated sites
DefinitionAverage and variation of latency, jitter andpacket loss statistics for the designated sitesas defined under parameter 13.
DiscussionThis parameter is similar to parameter 8,except that it measures latency, jitter andpacket loss for the most commonly visitedexternal sites.
As with parameter 8, this is quite a techni-cal parameter that may not be particularly
relevant to most users. In particular latencywill not be of relevance to users who mostlybrowse the web or use email. However, itwill be very relevant for users who wish toplay games online or videoconference.
Jitter and packet loss statistics will be morerelevant, even for users who just browse theweb and download an occasional file. Bothjitter and packet loss can adversely affectdownload, and indeed upload, speeds be-cause of adaptive transmission rates (seeChapter 3). In practice, though, relativelysmall differences in these statistics will beunnoticeable to the user.
Parameter 16: Number of NAPs connected to
and the bandwidth of the connections
DefinitionNumber of NAPs at which the ISP peers andthe bandwidth of the connections to theseNAPs.
DiscussionOther things being equal, the more NAPsan ISP is present at and the more peering ar-rangements in place, the more likely it isthat data will be carried more directly to thecustomer, reducing the likelihood of datatravelling on a congested or troublesomeroute.
The more NAPs an ISP is connected to, thegreater their redundancy (i.e. ‘spare’ capac-ity) and hence resilience to problems willbe. If an ISP were present at only one NAPand there was a problem with that connec-
tion, they would lose all connectivity. Thiscould happen, for example, if a workmanputs a pneumatic drill through the data pipeconnecting the ISP to the NAP. Greater re-dundancy (in this case, having direct con-nections to more than one NAP) also allowsalternative routing arrangements in case ofcongestion at any one exchange.
However, it is also important that the ISP es-tablishes peering arrangements at well-managed, and hence non-congested NAPs.One interviewee commented that while thiswas important in terms of allowing in-creased redundancy and diverse routing,the user’s experience ultimately depends onhow well the ISP manages its internal net-work.37 This re-emphasises the point thatnone of these parameters should be consid-ered in isolation.

- 35 –
We were also told that having relativelypoor bandwidth to a large number of NAPsis an inferior solution to having high capac-ity robust connections to a small number ofNAPs. Therefore, the number of NAPs
connected to, the bandwidth of the connec-tions and some consideration of the conges-tion of both the NAPs and the bandwidthsshould be taken into account. This is con-sidered in the next parameter.
Parameter 17: What are the bandwidth utilisation figures
for the ISPs NAP connections
and how congested are the NAPs at which the ISP peers?
DefinitionAverage and standard deviation of band-width utilisation for ISPs’ connections to itsNAPs and the utilisation of the NAPs towhich it connects
DiscussionAs discussed with regard to the above pa-rameter, it is not just the number of NAPswith which an ISP peers which affects an
ISP’s connectivity to the rest of the Internet,but also how congested these links become.
Over the course of our interviews, we weretold that both the congestion of the link tothe NAP and congestion at the NAP itselfwere important. Denis Curran, for exam-ple, commented that while INEX has neverbeen congested, individual links to INEX dobecome congested. This is outside the con-trol of INEX and under the control of theISP.

- 36 –
8. Cost
At present the cost of Internet service provi-sion seems to be the most visible area inwhich ISPs compete, and cost is often theeasiest way for newcomers to comparevarious providers. With more familiar andeasily defined products, such as clothes or ameal in a restaurant, consumers are betteracquainted with the price/quality trade-offsthat exist in these markets and are able tomake sensible decisions about what theywant to buy. In the field of Internet serviceprovision, not only is the service relativelynew, so that many consumers are still learn-ing to judge the service they receive, but itis also complex and dependent on manydifferent factors. This makes it very difficultto judge the quality of service one receives.It is at least partly due to this difficulty thatthe cheapest ISPs have the largest sub-scriber base.
It is however difficult to know exactly whatis being paid for, and there are numerouscosts which a complete newcomer to theInternet might not consider, such as domainname registration. Outlining the variouscost parameters enables customers to knowhow various ISPs match their specific re-quirements and appreciate that the ISP thatinitially appears the cheapest may not proveto be so.
Considering dial-up Internet access, the in-troduction of ‘free’ ISPs has led to a changein the way ISPs hope to make profits. Ini-tially, in the UK, this model worked by theISP receiving a proportion of the callcharges, known as ingress. As such, the
service is not really free. The model allowsISPs to tap into the revenue stream gener-ated for the telcos by Internet usage. TheISP charge is, however, invisible to the enduser. The viability of this model clearly de-pends on the telecom pricing structurecharging per unit of telephone call.
While this pricing structure has been preva-lent in Europe, it is not so in the US or Aus-tralia. In the US users pay a monthly sub-scription fee, for which they receiveunlimited Internet calls. In Australia, a localphone call costs 25¢ irrespective of dura-tion. The ISPs are therefore unable to gen-erate sufficient revenues by tapping into thecall charges revenue to make the freemodel a viable option. Another factor ofAustralian Internet provision which pro-vides an interesting counterpoint to thegeneral European experience is the practiceof charging customers per unit of data de-livered. To recoup the costs of retrievingdata internationally some Australian ISPscharge their customers according to theamount of data downloaded. Others setmaximum limits on the number of mega-bytes which may be downloaded in a cer-tain time period.
Our parameter regarding the cost of Internetaccess presumes that there is a time-basedcharge for being online rather than a traffic-based charge. This is because this is stillthe prevalent charging structure for Euro-pean ISPs for dial-up access where there is avariable cost.
Parameter 18: Cost of Internet access
DefinitionMonthly cost of Internet access (includingcall charges) for (a) 10 hours usage, (b) 20
hours usage, (c) 50 hours usage, and (d)permanent connection. Separate measuresto be given for working day and non-working access.

- 37 –
DiscussionPresently, there are many pricing optionsavailable. Dial-up users can choose a ‘free’(in so far as there is no monthly subscriptionfee) ISP and pay local call charges, can paya monthly subscription to get free Internetcalls or pay a relatively small subscriptioncharge which entitles them to permanentlyoff-peak call charges. There are some ISPswhich offer a ‘free-free’ service, in whichthere is no subscription charge and the callsare free, and there are also hybrid packages,such as subscription-based services whichoffer free calls during parts of the day andlocal call charges for the remainder. Per-manent connections, such as ADSL, dedi-cated ISDN and cable, have no call chargesbut a relatively high monthly subscriptionfee.
Clearly the type of package that the userchooses depends on whether they are morelikely to access the Internet during peak oroff-peak periods, and the amount of timethey expect to be online each month.
One difficulty in trying to measure the costof Internet access is the prevalence of pro-viders bundling their various services to-gether.38 By subscribing to an ISP, the usermay automatically receive a certain size ofallocation for a web page and the option ofmultiple email accounts in addition to theirdial-up service. This means that in manycases it may be difficult to isolate the cost ofdial-up access from the general ISP sub-
scription charge. Furthermore, the avail-ability of a large number of packages, eachoffering different combinations of freepeak/off-peak calls, means that ISP pricingstructures are becoming so differentiatedthat comparing the monthly cost of accessbetween them is difficult. This makes it dif-ficult for individuals, or businesses to com-pare the exact cost of getting the same serv-ice from different providers.
Our proposed parameter, therefore, com-pares the costs of various levels of usageduring both peak and off-peak times. Al-though this may lose some of the detail of afinely differentiated pricing structure, itshould prove sufficient to give some broadideas of the general costs.
We were also told that the cost of web host-ing is mostly bandwidth and not the actualstorage cost. It might therefore, be better touse bandwidth restrictions as a guide ratherthan size of space. This will depend on thetype of service the user is opting for.
We note that for the bundled services, suchas email and website hosting, there are anumber of organisations providing suchservices for free – Hotmail is a clear exam-ple for email, and for website hosting ex-amples include Geocities, Tripod or Home-stead. These services are by no means idealfor all users but will generally be acceptablesubstitutes for the free services offered by anISP, making the offer of such services froman ISP largely irrelevant.
Parameter 19: Additional cost of website hosting
DefinitionAnnual cost, over and above the cost ofconnectivity, of hosting (a) 10Mb, (b)100Mb and (c) 1Gb of webspace, with se-cure/non-secure differentiation.
DiscussionThis parameter measures – over and abovethe cost of connectivity covered in the pre-vious parameter – the cost of hosting vari-ous sizes of website, for both non-secureand secure sites. Secure sites tend to begenerally more expensive, but can be essen-

- 38 –
tial if the user is planning to adopt an e-commerce strategy or some other businessplan which requires people to submit con-fidential information over the web.
Like Internet access, web page hosting islikely to be bundled with other Internetservices making it difficult to pinpoint theexact cost of individual services. MartinMaguire, from Connect Ireland, suggestedthat people should be made more aware ofthe fact that they don’t necessarily need touse the same provider for access and host-ing.39
It is because services are frequently bundledthat our parameter measures the cost ofwebsite hosting over and above the cost ofInternet access – for users who are alreadypaying an ISP for their Internet access, andthat ISP offers free website hosting as a jointproduct with the Internet access, the addi-tional cost of the website hosting is zero.
Of course, website hosting is a more com-plex service than can be captured in onesingle parameter. For example, some ISPs
charge for traffic rather than actual diskspace used, or there may be various charg-ing levels for megabytes both stored and de-livered.40 In addition, the website host mayoffer an SLA (Service Level Agreement) con-taining guarantees of Quality of Service,such as ‘uptime guarantees’. Website host-ing may also offer mirrored sites.41 Theseare replicas of the original site hosted on adifferent server. The advantages of this arethat it reduces access time for the users byputting a copy close to their geographicallocation, it provides a backup of informa-tion, and enables load-sharing.42
To fully reflect the richness of the differentoptions would be the subject of a separatestudy in and of itself, and probably of littleinterest to the vast majority of users. Ourparameter, therefore, gives an idea of thebasic cost of website hosting – users withspecialist needs will doubtless want to ex-plore the area in more detail before reach-ing any decision or assessing Quality ofService.
Parameter 20: Annual supplemental cost for domain management
DefinitionAnnual supplemental cost, in addition toboth Internet connectivity and website host-ing, to register and manage a domain namesuch as ‘something.com’, ‘something.org’,‘etwas.de’, and so on. By managing thedomain name, we mean providing web andmail forwarding – i.e. ensuring that if youregister ‘domain.com’ with your ISP, peoplebrowsing ‘www.domain.com’ will be re-directed to the company’s website (hostedby the ISP) and mail sent to ‘[email protected]’ will get forwarded tothe appropriate mailbox (again, hosted bythe ISP).
DiscussionDomain names are seen as a measure ofcompany prestige and also of the credibilityof their web presence.
The cost of a domain name is actually two-fold – one element of the cost is actuallyregistering the name with a domain nameregistry, and some ISPs are able to get a dis-counted fee for their customers by makingbulk registrations. The second cost is theactual management of the domain name.For the purpose of this exercise, we are as-suming that the user will want the ISP tophysically host the user’s website and pro-vide one or several mailboxes for the userand will handle web and mail forwarding.The alternative is for the user to host the

- 39 –
website and mailboxes themselves on oneof their own PCs with a permanent Internetconnection. We will ignore this option, asit implies that the user is sufficiently familiarwith the minutiae of Internet service provi-sion as to not need these parameters tojudge their QoS.
This parameter, therefore, will measure theannual cost of registering and managing, asdefined above, the highest level domain
name specific to the country of the ISP so,for example, ‘algo.es’, ‘qualcosa.it’ or‘something.co.uk’. We were told that thesetend generally to be cheaper than register-ing a ‘.com’ or ‘.org’ address, so we havechosen to specify a country specific domainname in order to ensure that the costs arecomparable.
Parameter 21: Cost of technical support
DefinitionThe additional cost – over and above thecost of Internet access – of one hour’s tele-phone technical support, including the costof the telephone call.
DiscussionTechnical support can be very important fornewcomers to the Internet, or those withlimited technical skills. Equally, it can beimportant for users who are very IT-literate,and are trying to implement complex Inter-net-based services.
Some providers are now offering differentsupport line call charges depending uponwhich package the user chooses. Whilesome free ISPs may charge comparativelyhigh rates for technical support -- suchcharges can provide ‘free’ ISPs with an im-portant revenue stream -- providers with
high monthly subscription rates may pro-vide the service free of charge.
We have included the cost of the telephonecall in the parameter, as some ISPs will de-rive revenue from sharing the cost of thecall with the telco. In the case of a tele-phone number with a premium charge,these costs can be quite substantial for aone hour call.
As a caveat to this parameter, not all hoursof technical support are equal. However,there is no easy way to objectively measurethe quality of the technical support on offer,and this may even vary widely for an indi-vidual ISP depending on the quality of thestaff manning the help line. We would em-phasise that this parameter will merelymeasure the cost of an hour of technicalsupport, and does not provide any guidanceas to the quality of the support on offer.

- 40 –
9. Others
Initially we proposed to produce a list ofparameters relating to ‘other factors’. Theseincluded areas such as:
! reliability of billing;
! ease of payment;
! content control;
! spam control; and
! security.
From discussions with ISP staff, however, itbecame clear that although these are impor-tant areas to consider when measuring qual-ity of service, they are largely subjective. Atpresent it would be very difficult to mean-ingfully measure the service offered by ISPson these grounds.
For example, while security is clearly a veryimportant issue,43 it is not possible to pro-
duce a single parameter that objectivelymeasures, in numerical terms, the level ofsecurity offered. Similarly, although ISPscan choose from a variety of billing soft-ware, no consensus was found as to howthey could be judged on the basis of reli-ability of billing, in order to state that, forexample, ISP A has twice as reliable billingas ISP B.
While such issues are largely subjective,and are therefore not being included in thelist of parameters – which are explicitly ob-jective at least in their definition if not al-ways in their interpretation and measurablein numerical terms – they are nonethelessimportant factors in determining ISP qualityof service. They should therefore be bornein mind when considering an holistic pic-ture of quality of service.

- 41 –
10. The parameters in use
This chapter of the report has two parts. Inthe first, we will re-visit our sample usersmentioned originally in Chapter 2, andshow how important they might considereach parameter to be. The purpose of thisis to demonstrate that not all parameters areimportant to every user, and some care will
be needed in their interpretation dependingon the audience.
The second part will look at how the pa-rameters can be measured, and how theycan be used to provide the basis for variouscomparisons other than the choice betweendifferent ISPs implicit in the first part of thischapter.
10.1. Sample users and the importance of the parameters
The table below shows some estimates ofthe relative importance of the QoS parame-ters to four different ‘typical’ users:
! A family, using their Internet connectionfrom home for entertainment and pur-chases. This type of user would typicallyhave a dial-up connection over tradi-tional telephone lines to an ISP.
! An employee working from home, us-ing his internet connection primarily togain access to his company’s intranetand to stay up to date with develop-ments in his enterprise sector.
! A start-up company, using the Internetas a marketing and sales tool.
! A well-established SME managing rela-tions with suppliers and clients over theInternet. This type of user is assumedfor the purposes of this discussion tohave a permanent Internet connection.
Unsurprisingly, the table demonstrates thatmany of the measures are important to alltypes of users. This applies to the simpleand readily apparent measures of QoS suchas the number of tries and the time it takesto get a connection. It also applies to thoseparameters that together reflect the per-formance of the ISP’s internal network (P7,P8, P9 and P10) and the performance of theISP’s upstream network (P14, P16 and P17).
Among the other parameters, the tableshows that the different users have different
priorities and require more or less stringentstandards in their QoS. For the family, abil-ity to connect is obviously important butnot crucial in the way it is for the other us-ers who need to conduct business over theInternet (comparing the scores for P1through P5). They are not as constrained asother users in terms of the times during theday/week that they use the Internet. Thefamily is less demanding than other types ofusers in terms of speed and quality of con-nection except when they engage in onlinegaming when P8 will be important.
For the home-worker, speed and reliabilityare important as his/her ability to do the jobdepends on the Internet connection. How-ever, the quality of the connection is lessimportant, unless they engage in video-conferencing (P8). The ability to connect tocertain websites, notably that of the com-pany for which they work, is crucial (P14).
For both the start-up and the establishedSME, the health and success of the businesscan depend on the quality of their Internetconnection. Slow or disrupted access canmean the loss of favourable deals. Thisgreater reliance on the Internet will usuallymean that they are willing to pay more for abetter connection. For the start-up, thewebsite is a key to building the customerbase, so parameters affecting its perform-ance will be central (P16 and P17).
The greatest differences in importance areto be found in the section relating to cost.

- 42 –
For the family, the cost of using the Internetwill be compared to the cost of other rec-reational activities. The start-up has to bal-ance the cost of Internet access with thecompany’s other essential set-up costs by
assessing its contribution to marketing andsales. For the tele-worker and the well-established business, there is no satisfactoryalternative to the Internet so cost is less im-portant.
Family T-Worker Start-up Est. SME
P1: Number of attempts required to achieve connection **** ***** ***** N/A
P2: Time to connect **** ***** ***** N/A
P3: Time to connect during the busiest hour of theweek
** ***** ***** N/A
P4: Frequency of connection termination **** ***** ***** *****
P5: Frequency and duration of ISP ‘outages’ ** ***** ***** *****
P6: Theoretical maximum speed of connection * * * *
P7: Connection speed achieved **** **** **** ****
P8: Latency, jitter and packet loss statistics communi-cating with the ISP
*** ** ** ***
P9: Speed of download from ISP’s server(s) **** **** **** ****
P10: Speed of download from ISP’s mail-server ** *** *** ***
P11: Ratio of ISPs’ bandwidth to product of number ofcustomers able to achieve simultaneous connectionand the maximum bandwidth of those connections
**** **** **** ****
P12: Proportion of packets travelling through the ISP’srouters which are lost
**** **** **** ****
P13: Proportion of designated sites connected to: (a)the ISP’s own backbone/backbone provider(s); (b) tothe ISP through private peering arrangements; and (c)through public NAPs/IXPs
* * * *
P14: Proportion of time which designated sites are un-reachable
*** ***** **** ****
P15: Latency, jitter and packet loss statistics for desig-nated sites
** * * **
P16: Number of NAPs connected to and the bandwidthof the connections
**** **** ***** ****
P17: What are the bandwidth utilization figures for theISPs NAP connections and how congested are theNAPs at which the ISP peers?
**** **** ***** ****
P18: Cost of Internet access **** * **** ***
P19: Cost of website hosting * * *** ****
P20: Annual supplemental cost for domain manage-ment
* * ** **
P21: Cost of tech support *** * **** *

- 43 –
10.2. Measuring the parameters, and using them for comparisons
10.2.1 Comparing ISPsThe previous section illustrated, for sampleusers, some likely importance weightingsfor the various parameters. In the most ob-vious use for these parameters – comparingvarious ISPs – the mechanics of using theparameters is relatively straightforward. Anindependent and trusted source, such as aconsumer association or magazine, couldscore the various ISPs on a scale of zero toten, with zero for the worst-performing andten for the best-performing, against each ofthe parameters. A user could then derivethe importance of each of the parametersfor themselves on a scale of zero to five, asillustrated in the previous section. By mul-tiplying the performance of each ISP againsteach parameter by the importance attachedto that parameter and summing the results,a user could attribute to each ISP a totalscore to enable them to rank various ISPsaccording to their needs.
Some parameters may also be consideredtoo technical for some users – such as thelatency, jitter and reliability statistics. Inthese cases, average and variation in down-load speeds should prove broadly accept-able proxies, and the more technical pa-rameters could be assigned weightings ofzero.
In the case of parameters where there aremultiple values – such as Parameters seventhrough nine where both the average andvariation are measured, or Parameter 15which measures jitter, latency and packetloss – the process will need further refine-ment. It is conceivable that the user will at-tach importance to each sub-parameter, orthat the user may decide that one particularsub-parameter is the one that is most impor-tant, for example jitter is important but la-tency is not.
The actual measurement of the parameters– which would need, as mentioned, to beundertaken by an independent, trusted andtransparent organisation – would require avariety of techniques depending on the pa-rameter. Some are reasonably straightfor-
ward, such as the cost of Internet access,and would require simple desk research to-gether with some basic verification. Others,for example the number of NAPs the ISPwas connected to, would require pollingthe ISP and more rigorous verification – inthe case of the number of NAPs this wouldinvolve verification with the NAPs to whichconnections were claimed. There wouldalso be a requirement for some primary re-search – for example Parameter 7, the con-nection speed actually achieved – wouldrequire repeated dialling into the ISP in or-der to gain sufficient data points to accu-rately measure the parameter. While thiscould be readily automated and the meas-urement could take place largely unat-tended, it nonetheless does require an in-vestment which is probably beyond theresources of an individual wanting to com-pare different ISPs.
Care must also be taken to ensure that themeasurements are carried out in a consis-tent and fair fashion – for example using anumber of different telcos in order to con-nect to an ISP if one is testing dial-up PSTNservices in order to give an accurate reflec-tion of all users’ experiences. Also, a num-ber of technical issues, such as the ISP’s useof proxies or caches impacting on latencyfigures, must also be considered. A full dis-cussion of all of these points is without thescope of this study.
The parameters could also be used, though,for comparisons other than between ISPs fora particular user, though in a reasonablysimilar way. We will consider two such ex-amples below, which are intended to be il-lustrative rather than exhaustive.
10.2.2 Comparing different connectiontechnologies
Another scenario in which these parametersmay prove useful is in comparing connec-tion technologies. If a user is, for example,considering changing from a dial-up con-nection to, say, ADSL then the cost willchange, as well as the QoS received. In or-der to try and analyse the cost/quality trade-

- 44 –
off in a systemic way, the user could gothrough the same process of attaching vari-ous weights to the parameters and scoringthe two different technologies according tothese parameters.
For example, the ability to connect parame-ters, 1 to 5, may be considered important tothe user, the speed parameters, 6 to 17, lessimportant and the cost parameters, 18 to21, very important.
Each parameter could then be scored for theaverage – or even specific – dial-up setupand an average or a specific ADSL setup,and the same process of multiplication andsumming to derive total scores for bothtechnologies in order to clarify the decision-making process.
This procedure may seem overly elaborate,particularly for an individual consumer fac-ing a decision where the cost difference isnot considerable. However, it is not incon-ceivable that an SME would undertake sucha process, particularly if it is comparing apermanent ISDN connection to a dial-upPSTN connection, where the costs involvedcould be substantial, or if a serious web
presence was an integral part of their busi-ness plan.
10.2.3 Comparing Internet QoS acrosscountries
The parameters derived in this report couldbe used to measure the QoS received byusers in different countries.
The top 5 ISPs in each member state, forexample, could be scored using the parame-ters and the results averaged for each coun-try. These scores could then be weightedaccording to the derived weights of somesample users to show that, for example,small business users are better served incountry A than in country B.
The above examples are merely supposedto show that the above parameters can beused in a variety of ways in order to com-pare Internet QoS, and not just used to as-sist users in assessing the price/qualitytrade-off faced when choosing an ISP.

- 45 –
PART III - CONCLUSIONS

- 46 –
11. Conclusion
In this report we have tried to suggest and place in context some parameters that willenable meaningful, objective and transparent assessment of the quality of service whichInternet users receive. Our interviews revealed a view that the ISP industry was con-solidating as ISPs which were unable to invest in the infrastructure needed to improveQoS, such as bandwidth, peering arrangements and connection hardware (e.g. mo-dems) were delivering poor QoS and going bust.44 The hope was expressed that QoSwould become more important to users, and that the resultant pressure on ISPs wouldmean that Internet access would come to be taken for granted, like “water out of atap.”45
These parameters can be used to compare the services offered by different ISPs – and inparticular to inform a price/quality trade-off decision for a consumer – but may also helpto inform decisions about technology upgrades, for example, or permit cross-countrycomparisons of Internet QoS.
The parameters are designed to be of interest to individuals and to SMEs – largebusinesses are likely to have or be able to afford dedicated Internet expertise in order toinform their choice of Internet Service Provider. The parameters are also designed to besufficiently flexible to be used across a mixture of connection technologies, from dial-upmodem access to new xDSL technologies. We have also tried to make them sufficientlyinclusive to capture the recent increased richness in pricing structures, includingdifferentiated pricing for peak and off-peak usage and bundled internet servicesincluded with the cost of internet access – though we were unable to developparameters which were meaningful but also sufficiently generic to capture the value ofother services which are also sometimes bundled with Internet access, such as voicetelephone call discounts.
We found that not all elements of QoS were readily measurable in a numerical andobjective fashion. Some examples include security, reliability and ease of billing andthe filtering out of objectionable material. These can only really be measuredsubjectively, and may also not ever be part of a price/quality trade-off – for example, aparent may consider technology to filter out objectionable material in order to stop theirchild seeing pornography on the Internet to be an absolute necessity, rather than adesirable feature but one that might be overlooked if it costs too much.
The purpose of this work was to come up with some suggested parameters to allow themeasurement of Internet QoS. As such, this report has not come up with anymeasurements as such of QoS – this would clearly be impossible without data. As thedata collection tasks required to sensibly use these parameters are sizeable, there areclear economies of scale to be reaped by the promotion of a single, trusted andindependent body to collect and disseminate these statistics.
Finally, we have briefly discussed a methodology for allowing users to rank theimportance of these parameters to themselves and hence to derive total scores forvarious ISPs in order to better inform their decision-making. We have also discussedsome illustrative sample users, together with some suggested weightings for each of theparameters, and also some possible applications of the parameters beyond comparingISPs for particular users.

- 47 –
The main content of this report is the list of parameters themselves and our discussion ofthem – these are not easy to summarise and we therefore shall not attempt to do so.

- 48 –
APPENDICES

- 49 –
Appendix 1. Interview Methodology
Discussions amongst the project team led tothe development of an initial list of parame-ters for measuring ISP quality of service. Itincluded four main sections:
! ability to connect;
! speed of connection (upstream anddownstream);
! cost; and
! other factors.
The list consisted of measures expected tobe relevant to the end user, measurable andobjective. They were designed to be rele-vant irrespective of the type of user, and thevarying needs of those users. As such, theywere designed to be applicable to both do-mestic and business users. In addition, theywere designed to be relevant irrespective ofthe method of Internet connection used e.g.whether it be broadband or narrowband,via a PC, a digital TV, a WAP enabled cellphone, or indeed any of the growing num-ber of alternative methods continually ap-pearing.
Contacts were then made by email or tele-phone with ISPs, telcos and NAPs in orderthat the list could eventually be modified orimproved on the basis of their feedback. Toencourage participation each potential in-terviewee was asked to comment on onlyone of the four sections. Following confir-mation that they were interested in partak-ing in the study, they were sent a list of pa-rameters. In the subsequent telephoneinterviews three main questions were ad-dressed. These were if each of the parame-ters would be easy to measure, relevant tothe quality of the user’s Internet experience,and if there were any other measures(within the specific area under considera-tion) which ought to be included. Whereappropriate, interviewees were specificallyasked to comment on a particular section ofthe list according to their own expertise. Inaddition to the questions regarding ISPs up-stream connectivity, staff from NAPs wereasked broader questions such as what theyconsidered to be the main cause of delayson the Internet.
The list of parameters was then improvedon the basis of the feedback.

- 50 –
Appendix 2. People interviewed
NAPsDenis Curran, INEX Operator
Walter van Dijk, AMSIX Operator, Head of Accounts Management and marketing at Surfnet.
Keith Mitchell, Executive Chairman, LINX.
ISPsAndrew Bonar, Founder of Cheapnet and Surf London.
Fredrik Engval, Managing Director, Professional Internet.
Johan Helsingius, Chief Technology Officer, Senior Vice President, KPNQ West Belgium.
Siegfried Langenbach, President of EuroInternet.
Martin Maguire, Project Director, Connect Ireland.
Miguel Perez, President of the Spanish Internet Users Association.
Daniel Pope, IP Manager, Telia UK.
Steve Rawlinson, Systems Manger, clara.net.
Ian Robertson, Manager, Fastnet International.
Lee Wade, Director of Internet Strategy, CIX Internet.
TelcosNigel Pitcher, Group Marketing Director, Fibernet Group plc.
Wayne Vinton, Director of Marketing Strategy, IP Division, Global Telesystems (Europe) Ltd.

- 51 –
NOTES
1 “Why we can’t compare ISP performance –yet”, Business Communications Review, Sandra Borthick,vol. 28 no. 9, Sept 98
2 Top 25 ISPs, Data Communications survey, June 1999.3 Bandwidth refers to the theoretical maximum speed of a network connection, typically measured in
thousands or millions of bits per second. The higher the number of bits per second, the quicker datacan be transferred over the line and, typically, the higher the cost of the connection.
4 tele.com report, 25 October 1999.5 Web Performance Tuning, Patrick Killela. (www.patrick.net/wpt/) For another discussion of this
point, see http://www.frag.com/help/quake/wtq3a.html, which discusses some of the issues relatingto modem-induced latency from the perspective of the user wanting to play games over the Internet –something which requires high QoS.
6 Financial Times, Telecoms survey, October 19997 The first hop is the link between the individual’s computer and their ISP. This leg of the journey is
the most transparent to the end user, and can be over the phone network for a typical dial-up cus-tomer, over cable, via satellite, and so on. Whatever medium is used to connect to the ISP, this isalways the first stage of the journey.
8 Peering denotes an arrangement whereby two ISPs agree to swap data for free. Typically, these willoccur between ISPs of roughly equal size. Where there is a substantial size discrepancy, and hence adata-flow asymmetry, there may be charges for data flow, called transit charges.
9 See http://www.linx.net/membinfo/peer.html10 In practice, the data may travel via the States for short periods of time if, for example, NAPs in Europe
are busy. However, for the journeys cited, the journey patterns were consistent at different timesover a number of days, suggesting that this was the ‘permanent’ route.
11 The distance (round-trip) is 426 miles, so time taken is s002.0000,186
426 ≈
12 A dedicated Internet connection supporting data rates of 1.544Mbps. T1 lines are a popular leasedline option for Internet Service Providers (ISPs) connecting to the Internet backbone. The Internetbackbone itself generally consists of faster T3 (43 Mbps) connections.
13 s002.0000,544,1
81132 ≈××. This is a rough estimate only.
14 See, for example, Data networks are lightly utilized, and will stay that way, available along withmany other relevant papers at www.research.att.com/~amo.
15 The required steps towards high quality Internet Services, C. Huitema, unpublished Bellcore report,1997. Cited in The Internet and other networks: Utilization rates and their implications, AndrewOdlyzko, AT&T, 12 September 1998.
16 Tornado-Insider.com interview with Andreas Schmidt, July 199917 Association des Fournisseurs d’Acces et de Services Internet, March 2000.18 Belgian Internet Service Providers Association, January 2000.19 See www.anxo.net for more details.20 See “BT network crash leaves business in turmoil”, Financial Times, 26/27 February 2000, page 2.21 Nigel Pitcher, Fibernet.

- 52 –
22 Suggested by Lee Wade, Director of Internet Strategy at CIX Internet.23 Suggested by Daniel Pope, IP Manager at Telia UK.24 Cheaper modems in general are less able to tolerate line noise without losing the connection. Up-
grading to a higher quality modem supporting the V.90 standard may reduce this problem.25 Andrew Bonar of Surflondon and Ian Robertson of Fastnet.26 Steve Rawlinson of ClaraNet27 Nigel Pitcher, Fibernet.28 Fredrik Engval from pi.se (corporate ISP with emphasis on hosting and leased line services)29 Provided, of course, they are using the same ISP for their email services as they are for their connec-
tivity services.30 This can be identified by using Traceroute, or a similar utility.31 Denis Curran from Inex.32 Daniel Pope from TeliaUK.33 These need not actually be websites – for example, it could be a business partner’s mail-server, or a
printer used by a graphics house which is connected to the Internet. We will use the term websites,though, for convenience.
34 www.ripe.net35 Steve Rawlinson from ClaraNet36 Daniel Pope, IP Manager, Telia UK.37 Steve Rawlinson, Systems Manager of ClaraNet International.38 Miguel Perez, President of the Spanish Internet Users Association.39 He also commented that ISPs are intent on tying people in by such measures as combining voice
phone and Internet services.40 Johan Helslingius, Senior Vice president of KPNQ West, Belgium.41 Johan Helslingius.42 “Mirror sites are useful when the original site generates too much traffic for a single server to support.
Mirror sites also increase the speed with which files or Web sites can be accessed: users can down-load files more quickly from a server that is geographically closer to them.” fromhttp://webopedia.Internet.com/TERM/m/mirror_site.html
43 This was stressed by Wayne Vinton, Global Telesystems.44 Wayne Vinton, Global Telesystems.45 Nigel Pitcher, Fibernet.