qatar exoplanet survey: qatar-8b, 9b, and 10b—a hot saturn and … · 2019-08-01 · 10b, the...
TRANSCRIPT

Qatar Exoplanet Survey: Qatar-8b, 9b, and 10b—A Hot Saturn and Two Hot Jupiters
Khalid Alsubai1 , Zlatan I. Tsvetanov1 , Stylianos Pyrzas1, David W. Latham2 , Allyson Bieryla2 , Jason Eastman2 ,Dimitris Mislis1 , Gilbert A. Esquerdo2, John Southworth3, Luigi Mancini4,5,6,7 , Ali Esamdin8, Jinzhong Liu8, Lu Ma8,
Marc Bretton9, Enric Pallé10,11, Felipe Murgas10,11, Nicolas P. E. Vilchez1, Hannu Parviainien10,11,Pilar Montañes-Rodriguez10,11 , Norio Narita10,12,13,14,15 , Akihiko Fukui10,16 , Nobuhiko Kusakabe13,
Motohide Tamura12,13 , Khalid Barkaoui17,18, Francisco Pozuelos17 , Michael Gillon17 , Emmanuel Jehin17,Zouhair Benkhaldoun18, and Ahmed Daassou18
1 Hamad bin Khalifa University (HBKU), Qatar Foundation, P.O. Box 5825, Doha, Qatar; [email protected] Harvard-Smitsonian Center for Astrophysics, 60 Garden Street, Cambridge, MA 02138, USA
3 Astrophysics Group, Keele University, Staffordshire ST5 5BG, UK4 Department of Physics, University of Rome Tor Vergata, Via della Ricerca Scientifica 1, I-00133 Roma, Italy
5 Max Planck Institute for Astronomy, Königstuhl 17, D-69117 Heidelberg, Germany6 INAF-Osservatorio Astrofisico di Torino, Via Osservatorio 20, I-10025 Pino Torinese, Italy
7 International Institute for Advanced Scientific Studies (IIASS), Via G. Pellegrino 19, I-84019 Vietri sul Mare (SA), Italy8 Xinjiang Astronomical Observatory (XAO), Chinese Academy of Sciences, 150 Science 1-Street, Urumqi, Xinjiang 830011, People’s Republic of China
9 Observatoire des Baronnies Provençales (OBP), Le Mas des Grés, Route de Nyons, F-05150 Moydans, France10 Instituo de Astrofísica da Canarias (IAC), E-38205 La Laguna, Tenerife, Spain
11 Departamento de Astrofísica, Universidad de La Laguna (ULL), E-38206 La Laguna, Tenerife, Spain12 Department of Astronomy, Graduate School of Science, The University of Tokyo, 7-3-1 Hongo, Bunkyo-ku, Tokyo 113-0033, Japan
13 Astrobiology Center, National Institutes of Natural Sciences, 2-21-1 Osawa, Mitaka, Tokyo 181-8588, Japan14 JST, PRESTO, 7-3-1 Hongo, Bunkyo-ku, Tokyo 113-0033, Japan
15 National Astronomical Observatory of Japan, 2-21-1 Osawa, Mitaka, Tokyo 181-8588, Japan16 Department of Earth and Planetary Science, Graduate School of Science, The University of Tokyo, 7-3-1 Hongo, Bunkyo-ku, Tokyo 113-0033, Japan
17 Space sciences, Technologies and Astrophysics Research (STAR) Institute, Université de Liège, Allée du 6 Août 17, Bat. B5C, B-4000, Liège, Belgium18 Oukaimeden Observatory, High Energy Physics and Astrophysics Laboratory, Cadi Ayyad University, Marrakech, Morocco
Received 2018 October 18; revised 2019 April 14; accepted 2019 April 14; published 2019 May 10
Abstract
In this paper we present three new extrasolar planets from the Qatar Exoplanet Survey. Qatar-8b is a hot Saturn,with MP=0.37MJand RP=1.3 RJ, orbiting a solar-like star every Porb=3.7 days. Qatar-9b is a hot Jupiter witha mass ofMP=1.2MJand a radius of RP=1 RJ, in an orbit of Porb=1.5 days around a low mass,Må=0.7Me,mid-K main-sequence star. Finally, Qatar-10b is a hot, Teq∼2000 K, sub-Jupiter mass planet, MP=0.7MJ, witha radius of RP=1.54 RJand an orbital period of Porb=1.6 days, placing it on the edge of the sub-Jupiter desert.
Key words: planetary systems – planets and satellites: detection – planets and satellites: fundamental parameters –techniques: photometric
1. Introduction
Since Mayor & Queloz (1995) announced 51 Peg, the firstextrasolar planet around a main-sequence star, the number ofextrasolar planets has been rising steadily, revealing the largediversity in physical properties and configurations of the under-lying extrasolar planets population. In order to properly understandthis diversity, a large sample of well-characterized, in terms ofphysical properties, planets and their respective host stars isrequired.
Large-scale, ground-based surveys for transiting extrasolarplanets, such as Optical Gravitational Lensing Experiment(OGLE-III; Udalski et al. 2002), Trans-Atlantic Exoplanet Survey(TrES; Alonso et al. 2004), Hungarian Automated TelescopeNetwork (HATNet; Bakos et al. 2004), XO (McCullough et al.2005), Wide Angle Search for Planets (WASP; Pollacco et al.2006), Kilodegree Extremely Little Telescope (KELT; Pepperet al. 2007), and Qatar Exoplanet Survey (QES; Alsubai et al.2013), have played a pivotal role both in significantly increasingthe numbers of known planets and in providing prime targets tofulfill the well-characterized requirement. By design, these surveysoffer certain advantages: (i) the very fact that the planets aretransiting implies that, generally, both the actual mass (MP, notonly MPsin i) and the planet radius (and by extension, the bulkdensity) can be determined; (ii) ground-based surveys are more
sensitive to brighter host stars and larger planets, which (usually)allows for the physical properties of the planet to be determinedwith good precision (better than 10%) and offers the possibility ofindividual systems suitable for intensive follow-up studies.In this paper we present three new transiting extrasolar planets
discovered by QES: Qatar-8b—a hot Saturn around a solar-likestar, Qatar-9b—a hot Jupiter orbiting a mid-K main-sequence star,and Qatar-10b—a hot Jupiter around a late-F main-sequence star.The paper is organized as follows. In Section 2 we present thesurvey photometry and describe the follow-up photometry andspectroscopy used to confirm the planetary nature of the transits. InSection 3 we present the analysis of the data and the global systemsolutions using simultaneous fits to the available radial velocities(RVs) and follow-up photometric light curves, and in Section 4 wesummarize our results and put the three new planets in the broadercontext of the exoplanets field.
2. Observations
2.1. Discovery Photometry
The survey data were collected with QES, hosted by theNew Mexico Skies Observatory19 located in Mayhill, NM,
The Astronomical Journal, 157:224 (10pp), 2019 June https://doi.org/10.3847/1538-3881/ab19bc© 2019. The American Astronomical Society. All rights reserved.
19 http://www.nmskies.com
1

USA. A full description of QES can be found in our previouspublications, e.g., Alsubai et al. (2013, 2017).
The discovery light curves of Qatar-8b and Qatar-9b contain2959 and 2755 data points, respectively, obtained duringobservations from 2016 December 5 to 2017 May 9. For Qatar-10b, the discovery light curve has 2077 data points collected inthe time period 2017 March 21–November 1. The surveyimages are run through the QES pipeline, which extracts thephotometric measurements using the image subtraction algo-rithm by Bramich (2008). A full description of the pipeline canbe found in Alsubai et al. (2013).
The output light curves are ingested into the QES archiveand are detrended using a combination of the TrendFiltering Algorithm (TFA; Kovács et al. 2005), whichconstructs a filter function from a set of field stars considered tobe a representative template for systematics in the field, and theDOHA algorithm (Mislis et al. 2017), a co-trending algorithmused to eliminate lingering, quasi-systematic patterns identifiedfrom groups of stars that are highly correlated to each other.The light curves are then further processed with the TSARDIalgorithm (Mislis et al. 2018), a machine learning pointsrejection algorithm that deals with any residual data irregula-rities. Qatar-8b, 9b, and 10b were identified as strongcandidates during a search for transit-like events using theBox Least Squares algorithm (BLS) of Kovács et al.(2002), following a procedure similar to that described inCollier Cameron et al. (2006). Note that, although the initialcandidate selection is an automatic procedure, the final vettingis done by eye.
Figure 1 shows the discovery light curves for the threeexoplanets discussed in this paper.
2.2. Follow-up Photometry
Follow-up photometric observations of a number of transitsof Qatar-8b, 9b, and 10b were collected at five differentobservatories with the following combination of telescopes andinstruments:FLWO: the 1.5 m telescope at the Fred L. Whipple
Observatory (Mount Hopkins, Arizona, USA) in combinationwith KeplerCam, equipped with a single 4k×4k FairchildCCD with a 0 37 pixel−1 and a 23 1×23 1 on-sky field ofview (FOV).QFT: the 0.5 m Qatar Follow-up Telescope (New Mexico
Skies Observatory, Mayhill, New Mexico, USA), equippedwith a 1k×1k Andor iKon-M 934 CCD, yielding a FOVof 13′×13′.OBP: the 0.82 m telescope at the Observatoire des Baronnies
Provençales20 (Provence-Alpes-Côte d’Azur, France) equippedwith a FLI ProLine PL230 camera with a 2k×2k e2v CCDdetector resulting in a 23′×23′ FOV.CAHA: the 1.23 m Zeiss telescope at the Centro Astronóm-
ico Hispano-Alemán (Calar Alto, Spain) in combination with
Figure 1. Discovery light curves for Qatar-8b (top), Qatar-9b (middle), andQatar-10b (bottom) folded to the period identified by the BLS analysis andplotted with an arbitrary vertical offset for clarity. The gray points represent theoriginal observations, and the black points are the binned values to better guidethe eye.
Table 1Log of Follow-up Photometric Observations for Qatar-8b, 9b, and 10b
ID Date Telescope Filter Cadence, (s)Rms,
(mmag)
Qatar-8b1 2018 Apr 2 QFT g 35 2.32 2018 Apr 2 FLWO i 30 0.63 2018 Apr 5 OBP I 125 1.6Qatar-9b1 2018
Apr 19QFT i 204 4.2
2 2018Apr 26
TCS g 30 2.9
3 2018Apr 26
TCS r 30 1.9
4 2018Apr 26
TCS i 30 1.9
5 2018Apr 26
TCS z 30 2.2
6 2018 May 6 FLWO g 35 1.57 2018 May 6 QFT g 204 6.0Qatar-10b1 2018 May 9 QFT i 204 3.02 2018
May 14QFT g 204 2.6
3 2018May 19
QFT z 204 5.1
4 2018May 19
FLWO g 28 0.9
5 2018 Jul 23 CAHA R 116 1.06 2018 Sep 2 OBP I 124 1.17 2018 Sep 6 QFT i 204 3.28 2018 Sep 14 TRAPPIST-N I 32 1.7
Note. See the text for details on telescopes and instruments. The last columnsgives the mean error in two-minute bins.
20 http://www.obs-bp.fr
2
The Astronomical Journal, 157:224 (10pp), 2019 June Alsubai et al.
the DLR-MKIII camera with a 4k×4k, e2v CCD resulting ina 21 5×21 5 FOV.
TCS: the 1.52 m Telescopio Carlos Sanchez at the TeideObservatory (Tenerife, Canary Islands, Spain) with theMuSCAT2 instrument, which takes images in four filterssimultaneously. Each channel is equipped with a 1k×1kCCD, resulting in a 7 4×7 4 on-sky FOV. For a detaileddescription of MuSCAT2 and its dedicated photometricpipeline see Narita et al. (2019).
TRAPPIST-North: the 0.6 m robotic Transiting Planets andPlanetesimals Small Telescope21 is located at OukaimedenObservatory, Morocco. It is equipped with a 2k×2k deep-depletion Andor IKONL BEX2 DD CCD camera with a pixelscale of 0 60 and an on-sky FOV of 19 8×19 8.
All of the follow-up light curves were generated throughdifferential aperture photometry performed on the sequence ofimages for each observing run. In each case a number ofcomparison stars were selected and those with excessive noiseor suspected variability were excluded from the final analysis.For the CAHA observations, the telescope was defocused anddata reduction was carried out using the DEFOT pipeline(Southworth et al. 2009, 2014). For observations taken at
FLWO, OBP, and with QFT the telescope was kept onlyapproximately in focus and we used the AstroImageJ (AIJ)software package (Choi et al. 2016) to extract the light curves.The MuSCAT2 instrument on TCS has a dedicated pipeline forextracting the light curves. The extraction of the fluxes for theTRAPPIST-North observations was done by aperture photo-metry on selected stars with the IRAF/DAOPHOT softwarepackage (Stetson 1987). Final transit light curves wereproduced by normalizing to a low order polynomial (maximumorder 2 in one case, a straight line for all other cases) fitted tothe flat part of the light curves that also removes small residualtrends if present. The uncertainties in the CAHA andMuSCAT2 light curves are estimated from the point-to-pointdispersion of the points out of transit and for all other cases arethe combination of the photon noise and the background noise(see the AIJ package; Choi et al. 2016). Nevertheless, as themain source of uncertainties is residual systematics and notphoton noise, when fitting the follow-up light curvesEXOFASTv2 (see Section 3.2) adds a variance term to eachtransit to enforce reduced χ2∼1.A summary of our follow-up photometric observations is
given in Table 1 where we list the date, telescope, filter, andcadence for each transit observation. In the last column we givethe mean uncertainty in two-minute bins if the cadence is less
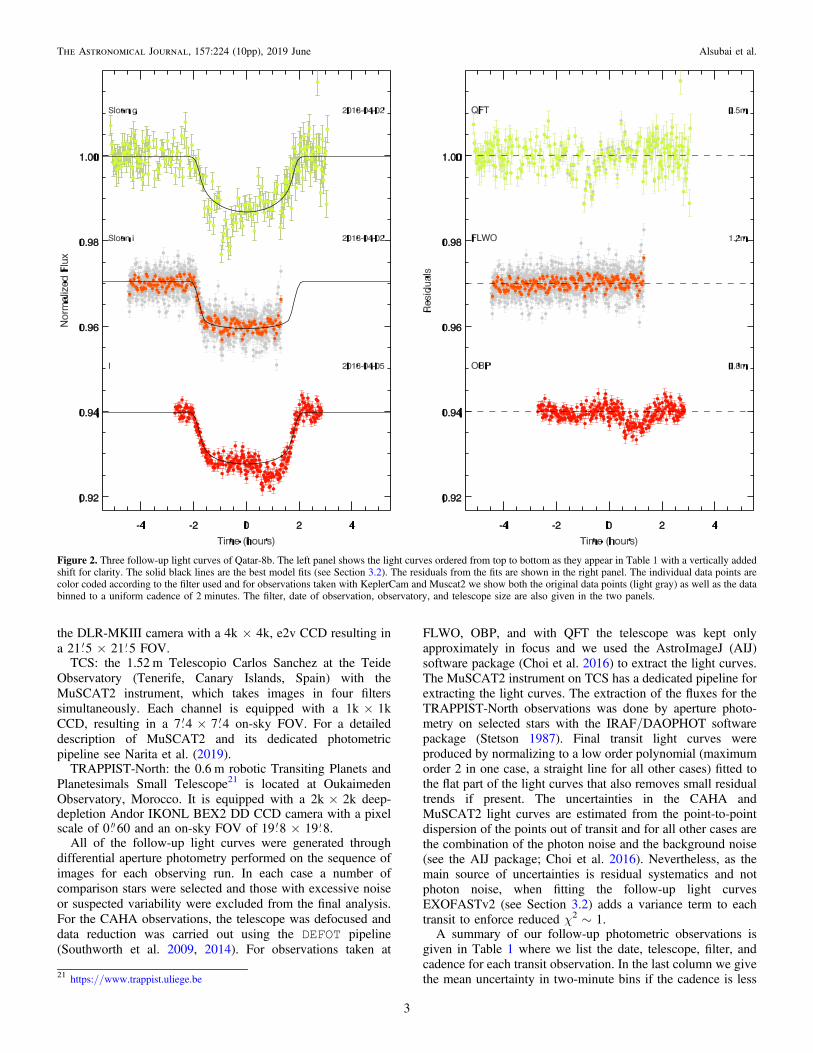
Figure 2. Three follow-up light curves of Qatar-8b. The left panel shows the light curves ordered from top to bottom as they appear in Table 1 with a vertically addedshift for clarity. The solid black lines are the best model fits (see Section 3.2). The residuals from the fits are shown in the right panel. The individual data points arecolor coded according to the filter used and for observations taken with KeplerCam and Muscat2 we show both the original data points (light gray) as well as the databinned to a uniform cadence of 2 minutes. The filter, date of observation, observatory, and telescope size are also given in the two panels.
21 https://www.trappist.uliege.be
3
The Astronomical Journal, 157:224 (10pp), 2019 June Alsubai et al.

than 2 minutes, otherwise for the original observations cadence.The resulting light curves, along with the best model fit and thecorresponding residuals, are plotted in Figures 2–4.
2.3. Follow-up Spectroscopy
Follow-up spectroscopic observations to measure precisionRVs for all three targets—Qatar-8b, 9b, and 10b—wereobtained in the same manner as for all previous QES candidates(for details see Alsubai et al. 2011 and subsequent papers). Inbrief, we used the Tillinghast Reflector Echelle Spectrograph(TRES) on the 1.5 m Tillinghast Reflector at FLWO. Allspectra were obtained using the medium fiber, which results ina resolving power of R∼44,000 and a velocity resolutionelement of 6.8 km s−1 FWHM. The wavelength calibration wasestablished using a Th–Ar hollow-cathode lamp illuminating
Figure 3. Seven follow-up transit light curves of Qatar-9b. All symbols, labels, and colors follow the same convention as in Figure 2.
Table 2Relative RVs and BS Variations for Qatar-8
BJDTDB RV (m s−1) BS (m s−1)
TRES2458183.747354 22.6±31.4 12.7±14.52458207.782751 −113.5±27.0 −28.7±8.82458211.702819 −59.5±30.0 3.0±15.52458218.684754 −65.5±25.2 6.3±12.32458226.645789 −77.7±37.6 35.1±14.82458228.646936 20.7±26.3 35.8±14.52458241.668589 −80.9±37.2 −12.3±15.82458244.754532 −57.5±32.6 −32.1±21.52458261.706560 0.0±27.0 12.2±8.02458263.738688 −110.5±24.5 −24.9±17.42458267.667690 −81.7±20.4 −34.7±15.72458274.674490 −64.9±33.0 10.1±17.62458276.668550 −7.3±24.1 6.0±11.22458278.682960 −44.1±26.3 19.6±17.12458280.670353 24.7±20.7 −7.9±12.7FIES2458223.51513 0.0±9.0 14.0±11.02458233.50676 −8.1±7.6 38.2±13.6
Table 3Relative RVs and BS Variations for Qatar-9
BJDTDB RV (m s−1) BS (m s−1)
2458172.753789 −508.1±62.8 −29.4±33.62458216.655360 100.7±90.8 55.9±52.82458259.747481 −60.5±57.8 −12.5±43.72458266.688086 −550.1±37.1 −167.1±29.12458273.684727 −43.8±49.5 28.0±34.02458276.698788 0.0±57.8 54.4±21.82458277.715329 −213.2±74.9 56.3±60.12458279.694742 38.7±49.4 −9.1±43.02458280.702564 −458.2±40.2 23.6±29.8
4
The Astronomical Journal, 157:224 (10pp), 2019 June Alsubai et al.

the science fiber with two exposures obtained immediatelybefore and after each target spectrum.
For each one of the three target stars we obtained thefollowing TRES spectra: (a) Qatar-8–15 spectra between 2017
March 6 and 2018 June 11 with exposure times in the range of10–30 minutes and an average signal-to-noise ratio perresolution element (SNRe) ∼34 at the peak of the continuumin the echelle order centered on the Mg b triplet near 519 nm;(b) Qatar-9–9 spectra between 2018 February 23 and June 11all with individual exposure times of 60 minutes and an average
Figure 4. Same as Figures 2 and 3 but for Qatar-10b. All symbols, labels, and colors follow the same convention.
Figure 5. Orbital solution for Qatar-8b, showing the velocity curve andobserved velocities and the bisector values.
Table 4Relative RVs and BS Variations for Qatar-10
BJDTDB RV (m s−1) BS (m s−1)
2458258.976713 10.2±36.9 18.3±15.22458259.824390 −179.3±42.7 −19.8±19.12458263.950937 −37.0±28.7 −31.0±19.02458273.912527 0.0±34.9 −29.1±9.02458274.928598 −175.8±34.9 −28.0±15.82458277.931350 −216.8±39.2 −20.9±19.82458278.755400 57.9±39.3 38.5±30.22458280.931487 −170.8±30.0 −24.8±15.42458281.917044 55.7±23.3 6.6±15.92458292.804140 −204.4±34.8 −3.7±11.92458296.861241 152.0±38.2 64.4±31.02458300.930706 −232.4±33.5 15.3±16.62458301.790512 39.0±33.1 14.8±16.62458386.632867 −174.7±30.1 40.9±21.02458387.655367 −13.7±32.6 −10.0±18.62458389.611784 −130.1±37.6 −49.1±20.5
5
The Astronomical Journal, 157:224 (10pp), 2019 June Alsubai et al.

SNRe ∼14.9; (c) Qatar-10–16 spectra between 2018 May 20and September 28, with exposure times in the range of20–40 minutes and an average SNRe ∼30. For each of ourtarget stars, we cross-correlated each observed spectrum againstthe reference spectrum (taken to be the strongest among thespectra of the given star) to obtain relative RVs. This was donefor a set of echelle orders (in an order-by-order fashion) chosenso as to have both good SNRe and minimal telluric linecontamination. These RVs are reported in Tables 2–4 (with the
time stamps in Barycentric Julian Date in BarycentricDynamical time, BJDTDB) and plotted in Figures 5–7. Theobservation that was used for the template spectrum has, bydefinition, an RV of 0.0 km s−1, and the error on the templateRV is the median of the uncertainties of all the orders. In orderto be sure that the periodic RV signal detected in all three casesis due to orbital motion and excludes other astrophysicalphenomena that could potentially produce a similar periodicsignal, we also derived the line profile bisector span values (BS;
Figure 6. Orbital solution for Qatar-9b, showing the velocity curve andobserved velocities and the bisector values.
Figure 7. Orbital solution for Qatar-10b, showing the velocity curve andobserved velocities and the bisector values.
Table 5Basic Observational and Spectroscopic Parameters of Qatar-8b, 9b, 10b Host Stars and Photometry Used for the Spectral Energy Distribution Fit
Parameter Description Value References
Names Qatar-8b Qatar-9b Qatar-10b3UC 322-045544 302-100935 320-060170
2MASS J23540364+3701185 J23540364+3701185 J23540364+3701185Astrometryα2000 R.A. (J2000) 10h29m38 962 10h42m59 543 18h57m46 537 (1)δ2000 decl. (J2000) +70°31′37 50 +60°57′50 83 +69°34′15 01 (1)PhotometryB Johnson B, mag 12.132±0.084 15.515±0.088 13.437±0.080 (2)V Johnson V, mag 11.526±0.046 14.133±0.048 12.879±0.079 (2)g Sloan g, mag 11.806±0.018 14.894±0.065 13.147±0.124 (2)r Sloan r, mag 11.355±0.028 13.569±0.061 12.712±0.079 (2)i Sloan i, mag 11.174±0.015 13.074±0.078 12.569±0.109 (2)J 2MASS J, mag 10.299±0.023 11.835±0.019 11.754±0.022 (3)H 2MASS H, mag 10.005±0.024 11.235±0.017 11.474±0.023 (3)K 2MASS K, mag 9.937±0.015 11.104±0.023 11.382±0.017 (3)W1 WISE1, mag 9.890±0.023 11.021±0.024 11.375±0.023 (4)W2 WISE2, mag 9.932±0.021 11.120±0.021 11.413±0.020 (4)W3 WISE3, mag 9.902±0.033 10.986±0.090 11.348±0.067 (4)Spectroscopic Parameters
Spectral type G0V K5V F7V this workTeff Effective temperature, K 5687±50 4363±51 6123±50 this worklog g Gravity, cgs 4.22±0.10 4.65±0.10 4.36±0.10 this work[m/H] Metallicity 0.0±0.08 0.25±0.08 0.40±0.08 this workγabs Systemic velocity, km s−1 5.57±0.10 2.92±0.10 −25.49±0.10 this workvrot Rotational velocity, km s−1 2.7±0.5 4.3±0.5 5.9±0.5 this work
References. (1) GAIA DR2http://gea.esac.esa.int/archive/; (2) APASS9http://www.aavso.org/apass; (3) 2MASShttp://irsa.ipac.caltech.edu/Missions/2mass.html; (4) WISEhttp://irsa.ipac.caltech.edu/Missions/wise.html.
6
The Astronomical Journal, 157:224 (10pp), 2019 June Alsubai et al.

lower panels in Figures 5–7). Buchhave et al. (2010) describe theprocedures used above for both the RV and the BS measurementsin more detail. The absolute center-of-mass velocity of eachsystem is determined in two steps as the precise RV of eachspectrum is measured against the strongest observed spectrum ofthe same star. That reference spectrum could be anywhere on theRV curve, and so a relative systemic velocity (γrel) is determinedwhen fitting the Keplerian model. The absolute systemic velocityis then the sum of γrel and the absolute RV offset of the referencespectrum which is determined by cross-correlating the Mg b orderof the respective reference spectrum against the CfA library of
synthetic templates. We also correct by −0.61 km s−1, becausethe CfA library does not include the gravitational redshift. Thisoffset has been determined empirically by many observations ofIAU Radial Velocity Standard Stars system. We quote anuncertainty of±0.1 km s−1 in the resulting absolute velocity,which is an estimate of the residual systematic errors in the IAURadial Velocity Standard Star system. Note that the error indetermining the absolute center-of-mass RV of each system doesnot affect the determination of the planetary parameters. Althougha dedicated paper on the assessment of the TRES absolute zero-point has not been published, we refer the interested reader to
Figure 8. Spectral energy distribution fit for the hosts stars of Qatar-8b (left panel), Qatar-9b (middle panel), and Qatar-10b (right panel). Photometric measurementsused in each fit (Table 5) are plotted here as error bars, where the vertical bars represent the quoted 1σ measurement uncertainties, and the horizontal bars mark theeffective width of the passbands. The solid curve is the best-fit SED from the NextGen library of models from the global EXOFASTv2 fit.
Table 6Median Values and 68% Confidence Intervals
Parameter Units Qatar-8b Qatar-9b Qatar-10b
Stellar Parameters:M* Mass (Me) 1.029±0.051 0.719±0.024 1.156±0.068R* Radius (Re) 1.315±0.020 0.696±0.008 1.254±0.026L* Luminosity (Le) 1.690±0.068 0.151±0.004 1.993±0.094ρ* Density (g cm−3) 0.641±0.024 3.015±0.086 0.823±0.062log(g*) Surface gravity (cgs) 4.214±0.016 4.610±0.010 4.303±0.027Teff Effective temperature (K) 5738±51 4309±31 6124±46[Fe/H] Metallicity 0.025±0.071 0.252±0.076 0.016±0.089τMIST Age (Gyr) 8.3±2.1 7.5±4.5 3.2±1.9AV Extinction (mag) 0.063±0.042 0.016±0.010 0.119±0.062π Parallax (mas) 3.614±0.043 4.730±0.036 1.855±0.035d Distance (pc) 276.7±3.4 211.4±1.6 539±10Planetary Parameters:P Period (days) 3.71495±0.00100 1.540731±0.000038 1.645321±0.000010a Semimajor axis (au) 0.0474±0.0008 0.0234±0.0003 0.0286±0.0006MP Mass (MJ) 0.371±0.062 1.19±0.16 0.736±0.090RP Radius (RJ) 1.285±0.022 1.009±0.014 1.543±0.040ρP Density (g cm−3) 0.216±0.037 1.43±0.20 0.248±0.036log(gP) Surface gravity 2.745±0.080 3.460±0.063 2.884±0.059Teq Equilibrium Temperature (K) 1457±14 1134±9 1955±25Θ Safronov Number 0.0265±0.0044 0.0764±0.0100 0.0236±0.0028RV Parameters:K RV semi-amplitude (m s−1) 47.7±8.0 259±35 114±13γrel Relative RV offset, TRES (m s−1) −34.2±6.8 −252±32 −89±11γrel Relative RV offset, FIES (m s−1) 25±13e Eccentricity (fixed) 0 0 0Primary Transit Parameters:TC Time of transit (BJDTDB) 2458210.83980±0.00085 2458227.75643±0.00027 2458247.90746±0.00036RP/Rå Radius of planet in stellar radii 0.1005±0.0008 0.1489±0.0009 0.1265±0.0010a/Rå Semimajor axis in stellar radii 7.761±0.100 7.236±0.069 4.90±0.12i Inclination (°) 89.29±0.70 89.23±0.64 85.87±0.96b Impact Parameter 0.096±0.093 0.097±0.079 0.379±0.055T14 Total duration (days) 0.1678±0.0017 0.0778±0.0004 0.1155±0.0009
7
The Astronomical Journal, 157:224 (10pp), 2019 June Alsubai et al.

Quinn et al. (2014, 2015), which gives a detailed account of theinstrument RV precision, stability, sources of error, and steps usedto bring observed stellar velocities to the absolute scale of the IAURadial Velocity Standard Star system.
For Qatar-8 we also obtained two RV measurements, on 2018April 15 and 25, with the high-resolution Fiber-fed EchelleSpectrograph (FIES; Telting et al. 2014) on the 2.5m NordicOptical Telescope (NOT) at the Observatorio del Roque de losMuchachos (ORM) on the island of La Palma, Canary Islands,Spain. We used FIES in its high-resolution mode R∼67,000 anda velocity resolution element of 4.8 km s−1 FWHM. For the firstobservation we obtained a single 30-minute exposure spectrum,while for the second observation we obtained three consecutive15-minute exposure spectra. Similar to the TRES observations,the wavelength calibration was established using exposures of aTh–Ar lamp illuminating the science fiber bracketing the targetexposure spectra. Relative RV measurements were obtainedthrough the cross-correlation technique described above and usingthe spectrum obtained on 2018 April 15 (Texp=30minutes) as atemplate. Each one of the three spectra obtained on 2018 April 25was measured separately against the template and the threemeasurements were averaged.
3. Analysis and Results
3.1. Rejecting False Positives
For all three targets, the observed transit light curvescombined with the shape and amplitude of the RV variations,are well described by a planet orbiting a single star. Never-theless, there are astrophysical scenarios not involving a planetthat could mimic such a behavior. These include an eclipsingbinary—either a background or in a hierarchical triple system—blended with the primary, much brighter star. Next we putforward arguments that allow us to exclude such scenarios.
It has been well established (e.g., Queloz et al. 2001; Torreset al. 2005) that if the observed RV pattern were a result of a blendwith an eclipsing binary, the spectral line bisectors (seeTables 2–4) would follow a similar pattern, that is, they wouldvary in phase with the photometric period and with a similaramplitude. The measured line bisectors are shown in the bottompanels in Figures 5–7 on the same scale as the RV residuals fromthe Keplerian orbit fit. No obvious pattern is seen in all threecases. To quantify that we performed a significance test on thePearson’s correlation between the BS and RV for each star, andalso the BS and the Keplerian fit model. In each of the threecases, the correlation between the BS and the RV (or betweenthe BS and the Keplerian model) is insignificant, while thecorrelation between the RV and the Keplerian model is highlysignificant. Numerically, the probability of chance RS/RVcorrelation is higher than the typical significance level (5%):Qatar-8b—p-values, p=0.061; Qatar-9b—p=0.073; Qatar-10b—p=0.067. This supports our argument that the observedRV pattern is a result of a gravitationally induced motion from aplanet orbiting a single star.
A further argument in favor of the planet scenario can bedrawn from the equal transit depths across all filters(accounting for limb-darkening effects). We do, however, notethat an eclipse of a stellar companion with very similar colorswould also lead to equal depths at different wavelengths. Assuch, we consider the equal depths as a supportive argumentonly, albeit in full agreement with our conclusion regarding theplanetary nature of the transits.
3.2. Planetary System Parameters
Physical properties of each system were determined througha global model fit using the EXOFASTV2 package. A detaileddescription of EXOFASTV2 can be found in Eastman (2017) andRodriguez et al. (2017). For each of the three exoplanetarysystems the global fit includes the RV measurements listed inTables 2–4, the follow-up transit light curves shown inFigures 2–4, respectively, the distance and broadband photo-metry for each star, and the priors on the stellar atmosphericparameters (Teff and [Fe/H]) determined from the availablespectra.The effective temperature (Teff), surface gravity (log g),
metallicity ([m/H]), and projected rotational velocity (vrot) forthe host stars were determined using the stellar parameterclassification tool (SPC; Buchhave et al. 2012). SPC works bycross-correlating an observed spectram against a grid ofsynthetic spectra based on the Kurucz atmospheric models.We used the ATLAS9 grid of models with the opacitydistribution functions from Castelli & Kurucz (2004). InTable 5 we list the weighted mean values and the associateduncertainties of the stellar atmospheric parameters determinedfrom the SPC analysis of each individual spectrum.Broadband photometric surveys provide measurements
across the electromagnetic spectrum for all three host stars,from the optical (APASS) to the mid-IR (WISE). Thesemeasurements are gathered in Table 5 and used to fit a modelspectral energy distribution (SED) for each one of the stars asdescribed below. The resulting SED fits are shown in Figure 8.In the global fit we apply Gaussian priors on the parallax
from Gaia DR2, including the offset determined by Stassun &Torres (2016) and impose an upper limit on the V-bandextinction from the Galactic dust reddening maps (Schlafly &Finkbeiner 2011). The limb-darkening coefficients were fit witha prior derived from an interpolation from the Claret &Bloemen (2011) tables for each band. We note that while alltransit light curves were normalized as described in Section 2.2,in the global fit EXOFASTV2 treats the baseline flux (the fluxoutside the transit) as a free constant and adjusts its value tounity. Because all transit light curves were normalized inadvance this adjustment is naturally very small.All of the host stars properties were determined during the
global fit. EXOFASTV2 simultaneously uses the SED, the stellar
Figure 9. Orbital period vs. planet mass. The planets data (gray points) arefrom TEPCat, while Qatar-8b, 9b, and 10b are plotted as the red, green, andblue points, respectively. The dotted box is the sub-Jupiter desert as defined bySzabó & Kiss (2011), while the dashed line is the upper limit of the same, asdefined by Mazeh et al. (2016).
8
The Astronomical Journal, 157:224 (10pp), 2019 June Alsubai et al.
density and limb-darkening constraint from the transit, the MISTisochrones (Collier Cameron et al. 2006; Dotter 2016), priors fromSPC (Teff, [Fe/H]) and Gaia (parallax), and an upper limit on thereddening to simultaneously determine all the stellar properties.The stellar radius is predominantly constrained by the SED andGaia parallax, while the stellar age and mass are predominantlyconstrained by the MIST isochrones and spectroscopic priors. Inaddition, consistency between the stellar mass and radius derivedfrom these methods and the stellar density from the transit isstrictly required.
In fitting Qatar-8b, 9b, and 10b we only considered circularorbits and kept the eccentricity fixed to zero. On the one hand,our RV data is not of high enough quality to allowinvestigation of potential small departures from circularity,and on the other hand we expect the planets orbits to havecircularized. Following the equations from Jackson et al.(2008), and using the values from Table 6 of Må, Rå, MP, RP,and a/Rå, we estimate orbit circularization timescales ofτcirc∼0.04, 0.01, 0.01 Gyr, respectively, for the entire rangeof tidal quality factors Qå and QP considered by the authors(104–108 for each Q). This is much lower than the estimatedage of the host stars and, thus, we expect the planet orbit tohave circularized.
A precise orbital period for each system is also obtainedduring the global fit. The best ephemeris for each star iscalculated by fitting all transits simultaneously to a linearephemeris within EXOFASTV2:
= +( ) ( ) ( )T E2458210.83980 85 3.71495 100 , 1C
= +( ) ( ) ( )T E2458227.75643 27 1.540731 38 , 2C
= +( ) ( ) ( )T E2458247.90746 36 1.645321 10 , 3C
where E is the number of cycles after the reference epoch, whichwe take to be the transit time that minimizes the covariancebetween TC and the period, and the numbers in parenthesis denotethe uncertainty in the last two digits. Equations (1)–(3) correspondto Qatar-8b, 9b, and 10b, respectively.
Table 6 summarizes the physical parameters of eachplanetary system. We note that for Qatar-8b, for which wehave RV measurements from two different telescopes andinstruments, EXOFASTV2 fits the relative offset for each RVdata set separately. These are the reported γrel values in thetable. The Safronov number is not used in the current paper and
is provided in Table 6 for completeness, as it may be useful forother studies.
4. Discussion and Conclusions
In this paper we present Qatar-8b, 9b, and 10b, a transitinghot Saturn and two transiting hot Jupiters identified by QES.We combine follow-up photometric and spectroscopic obser-vations, together with available broadband photometry andGAIA measurements, to calculate a full set of physicalparameters for the planets and their host stars. In Figures 9and 10 we present the new discoveries in the context of thecurrent state of the field. To produce these figures, we made useof the well-studied sample of planets from the TransitingExtrasolar Planets Catalogue (TEPCat; Southworth 2011,online version22 as of 2018 October 10).Qatar-8b is a typical example of a hot Saturn, Qatar-9b is
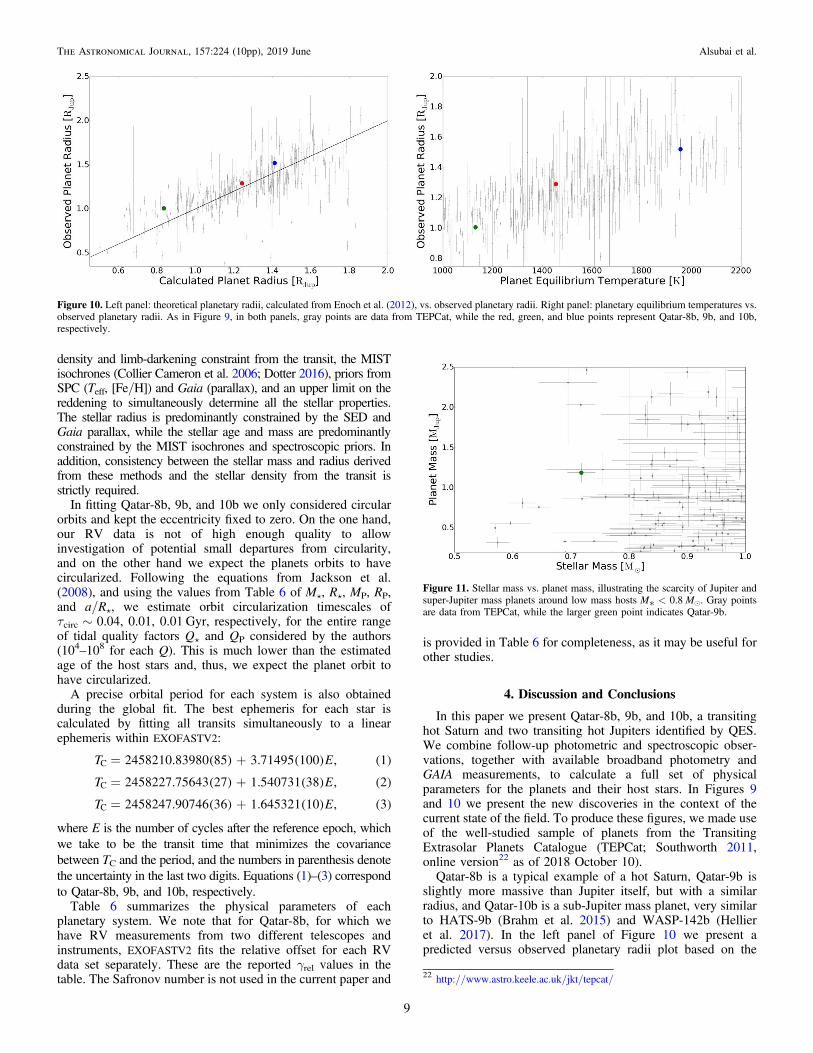
slightly more massive than Jupiter itself, but with a similarradius, and Qatar-10b is a sub-Jupiter mass planet, very similarto HATS-9b (Brahm et al. 2015) and WASP-142b (Hellieret al. 2017). In the left panel of Figure 10 we present apredicted versus observed planetary radii plot based on the
Figure 10. Left panel: theoretical planetary radii, calculated from Enoch et al. (2012), vs. observed planetary radii. Right panel: planetary equilibrium temperatures vs.observed planetary radii. As in Figure 9, in both panels, gray points are data from TEPCat, while the red, green, and blue points represent Qatar-8b, 9b, and 10b,respectively.
Figure 11. Stellar mass vs. planet mass, illustrating the scarcity of Jupiter andsuper-Jupiter mass planets around low mass hosts M*<0.8 Me. Gray pointsare data from TEPCat, while the larger green point indicates Qatar-9b.
22 http://www.astro.keele.ac.uk/jkt/tepcat/
9
The Astronomical Journal, 157:224 (10pp), 2019 June Alsubai et al.

widely used relations of Enoch et al. (2012). At face value, therelations of Enoch et al. (2012) underpredict the observedradius of Qatar-9b, while the observed radii of Qatar-8b andQatar-10b are close to the theoretical predictions. We notehowever, that none of the three new exoplanets stand out fromthe rest and follow the general trend well.
An interesting aspect of Qatar-9b is the moderately largeplanet mass, MP=1.19 MJ, in relation to the relatively lowhost star mass, Må=0.72Me. Using data from TEPCat, wefind 59 planets with a host mass of Må<0.8Meand only 8 ofthese have masses in the range of 0.7�MP [MJ]�2.5. Theposition of Qatar-9b in this scarcely populated region of theparameter space is shown in Figure 11. We also note thatQatar-10b, at an orbital period of 1.65 days, is situated on theupper edge of the sub-Jupiter desert (e.g., Szabó & Kiss 2011;Mazeh et al. 2016; and see again Figure 9).
The combination of relatively low surface gravity andrelatively high equilibrium temperature for both Qatar-8b andQatar-10b imply considerable-sized atmospheres. The atmo-spheric scale height, given by H=kT/gμ and assuming aJupiter mean molecular mass of 2.3 times the mass of a proton,is calculated to be ∼930 km for Qatar-8b and ∼850 km forQatar-10b. Taking into account the somewhat large host radii,the absorption signal, A, of an annular area of one atmosphericscale height during transit (Brown 2001) is calculated to be∼200 ppm and ∼250 ppm for Qatar-8b and 10b, respectively.
This publication is supported by NPRP grant No. X-019-1-006from the Qatar National Research Fund (a member of QatarFoundation). The statements made herein are solely the respon-sibility of the authors. The Nanshan 1m telescope of XAO issupported by the CAS “Light of West China” program (XBBS-2014-25, 2015-XBQN-A-02), and the Youth Innovation Promo-tion Association CAS (2014050). This article is partly based onobservations made with the MuSCAT2 instrument, developed byABC, at Telescopio Carlos Sánchez operated on the island ofTenerife by the IAC in the the Spanish Observatorio del Teide.This work is partly financed by the Spanish Ministry of Economicsand Competitiveness through grants ESP2013-48391-C4-2-R.TRAPPIST-North is a project funded by the University of Liège,and performed in collaboration with Cadi Ayyad University ofMarrakesh. The research leading to these results has receivedfunding from an ARC grant for Concerted Research Actionsfinanced by the Wallonia-Brussels Federation. M.G. and E.J. are F.R.S.-FNRS Senior Research Associates. L.M. acknowledgessupport from the Italian Minister of Instruction, University andResearch (MIUR) through FFABR 2017 fund and from theUniversity of Rome Tor Vergata through “Mission: Sustainability2016” fund. This work has made use of data from the EuropeanSpace Agency (ESA)mission Gaia (https://www.cosmos.esa.int/gaia), processed by the Gaia Data Processing and AnalysisConsortium (DPAC;https://www.cosmos.esa.int/web/gaia/dpac/consortium). Funding for the DPAC has been provided bynational institutions, in particular the institutions participating in theGaia Multilateral Agreement. We also acknowledge support fromJSPS KAKENHI grant No. JP16K13791, 17H04574, 18H01265,and 18H05439, and JST PRESTO grant No. JPMJPR1775.
ORCID iDs
Khalid Alsubai https://orcid.org/0000-0001-6253-0179Zlatan I. Tsvetanov https://orcid.org/0000-0001-6177-6767
David W. Latham https://orcid.org/0000-0001-9911-7388Allyson Bieryla https://orcid.org/0000-0001-6637-5401Jason Eastman https://orcid.org/0000-0003-3773-5142Dimitris Mislis https://orcid.org/0000-0003-4819-1435Luigi Mancini https://orcid.org/0000-0002-9428-8732Pilar Montañes-Rodriguez https://orcid.org/0000-0002-6855-9682Norio Narita https://orcid.org/0000-0001-8511-2981Akihiko Fukui https://orcid.org/0000-0002-4909-5763Motohide Tamura https://orcid.org/0000-0002-6510-0681Francisco Pozuelos https://orcid.org/0000-0003-1572-7707Michael Gillon https://orcid.org/0000-0003-1462-7739
References
Alonso, R., Brown, T. M., Torres, G., et al. 2004, ApJL, 613, L153Alsubai, K., Mislis, D., Tsvetanov, Z. I., et al. 2017, AJ, 153, 200Alsubai, K., Parley, N. R., Bramich, D. M., et al. 2011, MNRAS, 417, 709Alsubai, K., Parley, N. R., Bramich, D. M., et al. 2013, AcA, 63, 465Alsubai, K., Tsvetanov, Z. I., Latham, D. W., et al. 2018, AJ, 155, 52Bakos, G., Noyes, R. W., Kovács, G., et al. 2004, PASP, 116, 266Barklem, P. S., Stempels, H. C., Allende Prieto, C., et al. 2002, A&A, 385, 951Brahm, R., Jordán, A., Hartman, J. D., et al. 2015, AJ, 150, 33BBramich, D. M. 2008, MNRAS, 386, L77Brown, D. J. A. 2014, MNRAS, 442, 1844Brown, T. M. 2001, ApJ, 553, 1006BBuchhave, L. A., Bakos, G. Á., Hartman, J. D., et al. 2010, ApJ, 720, 1118Buchhave, L. A., Latham, D. W., Johansen, A., et al. 2012, Natur, 486, 375Castelli, F., & Kurucz, R. L. 2004, in IAU Symp. 210, Modelling of Stellar
Atmospheres, Poster Contributions, ed. N. Piskunov, W. W. Weiss, &D. F. Gray (Cambridge: Cambridge Univ. Press), A20
Choi, J., Dotter, A., Conroy, C., et al. 2016, ApJ, 823, 102Claret, A., & Bloemen, S. 2011, A&A, 529, 75Collier Cameron, A., Pollacco, D., Street, R. A., et al. 2006, MNRAS, 373, 799Dotter, A. 2016, ApJS, 222, 8Eastman, J. 2017, EXOFASTv2, Generalized publication-quality exoplanet
modeling code, Astrophysics Source Code Library, ascl:1710.003Enoch, B., Collier Cameron, A., & Horne, K. 2012, A&A, 540A, 99EHellier, C., Anderson, D. R., Collier Cameron, A., et al. 2017, MNRAS, 465,
3693HHenden, A. A., Levine, S., Terrell, D., & Welch, D. L. 2015, AAS Meeting,
225, 336.16Jackson, B., Greenberg, R., & Barnes, R. 2008, ApJ, 678, 1396Kovács, G., Bakos, G., & Noyes, R. 2005, MNRAS, 356, 557Kovács, G., Zucker, S., & Mazeh, T. 2002, A&A, 391, 369Mayor, M., & Queloz, D. 1995, Natur, 378, 355Mazeh, T., Holczer, T., & Faigler, S. 2016, A&A, 589, A75McCullough, P. R., Stys, J. E., Valenti, J. A., et al. 2005, PASP, 117, 783Meléndez, J., Bergemann, M., Cohen, J. G., et al. 2012, A&A, 543, A29Meléndez, J., Bergemann, M., Cohen, J. G., et al. 2014, A&A, 567, L3Mislis, D., Pyrzas, S., Alsubai, K. A., et al. 2017, MNRAS, 465, 3759MMislis, D., Pyrzas, S., Alsubai, K. A., et al. 2018, MNRAS, 481, 1624MNarita, N., Fukui, A., Kusakabe, N., et al. 2019, JATIS, 5, 015001Pepper, J., Pogge, R. W., DePoy, D. L., et al. 2007, PASP, 119, 923Pollacco, D. L., Skillen, I., Collier Cameron, A., et al. 2006, PASP, 118, 1407Queloz, D., Henry, G. W., Sivan, J. P., et al. 2001, A&A, 379, 279Quinn, S. N., White, R. J., Latham, D. W., et al. 2014, ApJ, 787, 27Quinn, S. N., White, T. R., Latham, D. W., et al. 2015, ApJ, 803, 49Rodriguez, J. E., Zhou, G., Vanderburg, A., et al. 2017, AJ, 153, 256Schlafly, E. F., & Finkbeiner, D. P. 2011, ApJ, 737, 103Southworth, J. 2011, MNRAS, 417, 2166Southworth, J., Hinse, T. C., Burgdorf, M., et al. 2014, MNRAS, 444, 776Southworth, J., Hinse, T. C., Jørgensen, U. G., et al. 2009, MNRAS, 396, 1023Stassun, K. G., & Torres, G. 2016, ApJ, 831, 6Stetson, P. B. 1987, PASP, 99, 191Szabó, G. M., & Kiss, L. L. 2011, ApJ, 727L, 44STelting, J. H., Avila, G., Buchhave, L., et al. 2014, AN, 335, 41Torres, G., Andersen, J., & Giménez, A. 2010, A&ARv, 18, 67Torres, G., Konacki, M., Sasselov, D., & Jha, S. 2005, ApJ, 619, 558Tucci Maia, M., Meléndez, J., Castro, M., et al. 2015, A&A, 576, L10Udalski, A., Paczynski, B., Zebrun, K., et al. 2002, AcA, 52, 1
10
The Astronomical Journal, 157:224 (10pp), 2019 June Alsubai et al.