qantas airways limited preliminary final report for the ... · qantas airways limited preliminary...
TRANSCRIPT
QANTAS AIRWAYS LIMITED AND ITS CONTROLLED ENTITIES
PRELIMINARY FINAL REPORT FOR THE FINANCIAL YEAR ENDED 30 JUNE 2014
ABN: 16 009 661 901
ASX CODE: QAN

QANTAS AIRWAYS LIMITED PRELIMINARY FINAL REPORT ABN: 16 009 661 901 YEAR ENDED 30 JUNE 2014
Page 1
Table of Contents
ASX Appendix 4E – Preliminary Final Report Results for Announcement to the Market 2 Other Information 17 Consolidated Income Statement 18 Consolidated Statement of Comprehensive Income 19 Consolidated Balance Sheet 20 Consolidated Statement of Changes in Equity 21 Consolidated Cash Flow Statement 23 Notes to the Preliminary Final Report 24
Additional Information Operational Statistics 43 Gearing Ratio 44

QANTAS AIRWAYS LIMITED PRELIMINARY FINAL REPORT ABN: 16 009 661 901 YEAR ENDED 30 JUNE 2014
Page 2
RESULTS FOR ANNOUNCEMENT TO THE MARKET Qantas Airways Limited (Qantas) and its controlled entities (the Qantas Group or Group) Results for Announcement to the Market are detailed below.
June 2014
$M
June 2013 Restated1
$M Change
$MChange
%
Revenue and other income 15,352 15,902 (550) (3)
Statutory (loss)/profit after tax (2,843) 2 (2,845) >(100)
Statutory (loss)/profit after tax attributable to members of Qantas
(2,843) 1 (2,844) >(100)
Underlying profit before tax (646) 186 (832) >(100) 1 Restatement for the impact of revised AASB 119 relating to defined benefit superannuation plans. Refer to Note 10.
DIVIDENDS
No interim dividend was paid in relation to the year ended 30 June 2014.
No final dividend will be paid in relation to the year ended 30 June 2014.
EXPLANATION OF RESULTS The Qantas Group reported an Underlying PBT1 loss of $646 million for the financial year ended 30 June 2014. The result reflects the very difficult operating environment the Group has faced, with challenges including:
- Weak underlying demand growth in Australia, with consumer spending and business confidence remaining
subdued - $566 million of yield and load factor decline from market capacity growth running ahead of demand - $253 million higher fuel expense, driven by the weaker Australian dollar
The Qantas Group took decisive action to address these challenges, commencing the accelerated Qantas Transformation program on 1 January 2014. This program is targeting the delivery $2 billion2 of benefits by the end of financial year 2016/2017. The program delivered $204 million of benefits in the second half of the year, building on the benefits derived from previous Qantas Transformation and fuel burn initiatives. Combined, all these measures delivered $440 million of cost reduction in the period. All accelerated Qantas Transformation milestones were met in the second half, with strong momentum heading into 2014/2015. Transformation is at the centre of the Group’s strategy to drive an earnings recovery, strengthen the balance sheet and build long-term shareholder value. Other key pillars of that strategy include:
- Group capacity and network response to shifting demand and competitive environment - Targeted investment in the customer to maintain brand and yield premium - Reduced capital investment to maximise free cash flow for debt reduction
1 Underlying Profit Before Tax (PBT) is the primary reporting measure used by the Qantas Group’s chief operating decision-making bodies, being
the Chief Executive Officer, Group Management Committee and the Board of Directors, for the purpose of assessing the performance of the Group. The primary reporting measure of the Qantas International, Qantas Domestic, Jetstar Group, Qantas Loyalty and Qantas Freight operating segments is Underlying Earnings Before Net Finance Costs and Tax (EBIT) as net finance costs are managed centrally. The primary reporting measure of the Corporate/Unallocated segment is Underlying PBT. Refer to Note 2 for a reconciliation of Underlying PBT to Statutory (Loss)/Profit Before Tax.
2 Excluding the impact of inflation.

QANTAS AIRWAYS LIMITED PRELIMINARY FINAL REPORT ABN: 16 009 661 901 YEAR ENDED 30 JUNE 2014
Page 3
EXPLANATION OF RESULTS (continued) A comprehensive Group structural review was announced in December 2013, and has now been completed. The outcomes from the review are both structural and strategic for the future direction of the Qantas Group:
- Non-core assets identified and valued, including terminals, land and property holdings. The Group will continue to assess opportunities to sell, with proceeds to repay debt.
- Detailed assessment of potential for Qantas Loyalty minority sale undertaken. After careful consideration, the decision has been made that Loyalty continues to offer major profitable growth opportunities and there was no justification for a partial sale.
- No new Jetstar ventures to be established while Group focused on Transformation. Substantial value exists across Jetstar Group Airlines, to be realised over time.
- Following partial repeal of Qantas Sale Act foreign ownership limits, the decision has been made to establish a new holding structure and corporate entity for Qantas International to increase the potential for future external investment, and creates long-term options for Qantas International to participate in partnership and consolidation opportunities. This change to the Group’s organisational structure resulted in the write-down of the Qantas International fleet.
The Qantas Group’s Statutory Loss After Tax was $2,843 million for the financial year ended 30 June 2014. The Statutory result includes the impact of fleet restructuring costs of $394 million and redundancies, restructuring and other transformation costs associated with the accelerated Transformation program of $428 million. In addition, triggered by the Board decision relating to Qantas International on conclusion of the Structural Review, a non-cash impairment of the Qantas International fleet of $2,560 million has been recognised. The Group’s underlying financial position is strong and improving with cash of $3,001 million, liquidity of $3,631 million, net debt4 reduction of $96 million and neutral free cash flow achieved alongside significant investment in fleet and product. The Board’s decision on 28 August 2014 changes the organisational structure of the Group. As a result, for the purpose of assessing the carrying value of the Group’s assets, each of the Segments will now be required to be tested for impairment on a stand-alone basis. There are significant surpluses in the Qantas Domestic, Qantas Freight, Qantas Loyalty and Jetstar Group Cash Generating Units (CGUs), but an impairment of $2,560 million arose in the newly created Qantas International CGU. Performance highlights in the year include:
- Record3 result for Qantas Loyalty, and fifth consecutive year of double-digit EBIT growth - Both Qantas and Jetstar domestic businesses profitable in intensely competitive market - Qantas Domestic outperformed major competitor in on-time performance for fifth consecutive year - Record customer satisfaction and advocacy levels reached at Qantas Domestic, Qantas International, Qantas
Loyalty and Jetstar The challenging operating environment precipitated the loss of the Group’s investment grade credit rating. Despite this, the Qantas Group continues to display strong financial discipline. Financial highlights in the year included:
- Delivery of neutral free cash flow in the context of significant earnings pressure and significant investment in the Qantas Transformation program
- $3 billion cash held at year end - Reduction in net debt4 of $96 million - Significantly extending unsecured debt maturity profile through $700 million of landmark bond issuances - Prudent capital investment5 of $874 million
3 Qantas Loyalty record Underlying EBIT result compared to prior periods normalised for changes in accounting estimates of the fair value of points
and breakage expectations effective 1 January 2009. 4 Net debt including operating lease liabilities includes net on balance sheet debt and off balance sheet aircraft operating lease liabilities. Operating
lease liability is the present value of minimum lease payments for aircraft operating leases which, in accordance with AASB 117: Leases, is not recognised on balance sheet. The operating lease liability has been calculated as the present value of future non-cancellable operating lease rentals of aircraft in service, using a discount rate of seven per cent applied in Standard and Poor’s methodology.
5 Capital investment is net cash from investing activities, net of changes in operating lease liability and including non-cash investing activities. Operating lease liability is the present value of minimum lease payments for aircraft operating leases which, in accordance with AASB 117: Leases, is not recognised on balance sheet.
QANTAS AIRWAYS LIMITED PRELIMINARY FINAL REPORT ABN: 16 009 661 901 YEAR ENDED 30 JUNE 2014
Page 4
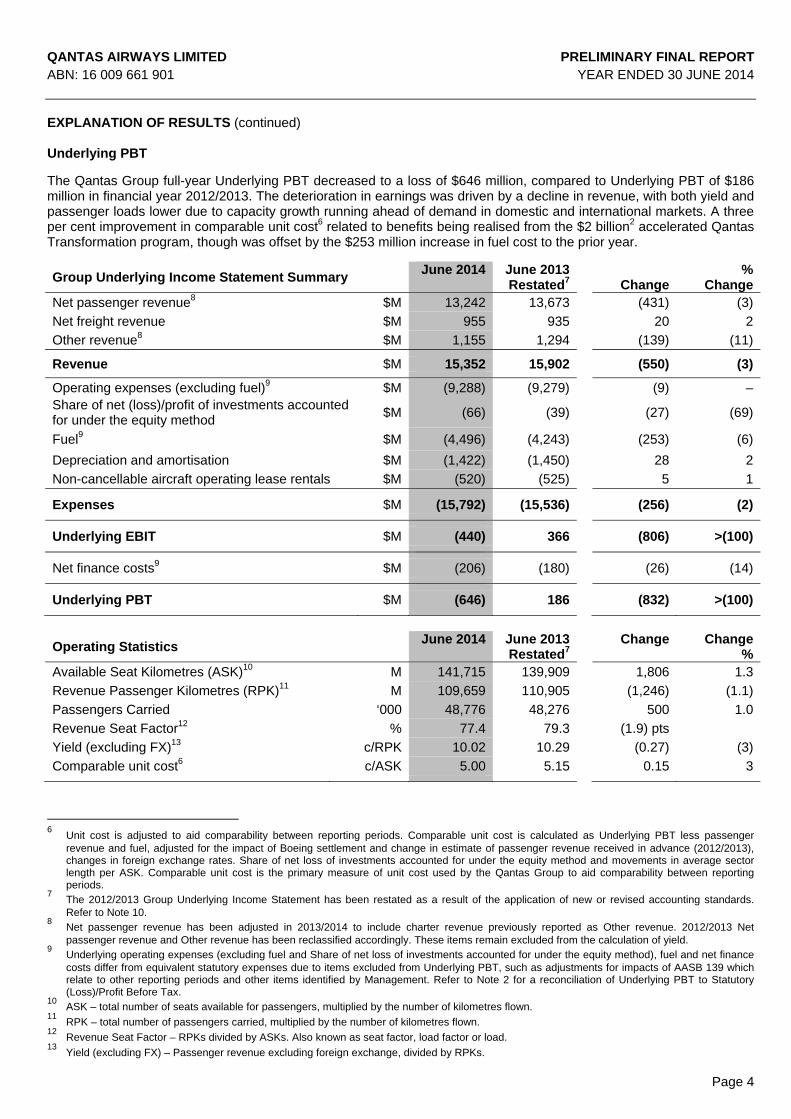
EXPLANATION OF RESULTS (continued) Underlying PBT The Qantas Group full-year Underlying PBT decreased to a loss of $646 million, compared to Underlying PBT of $186 million in financial year 2012/2013. The deterioration in earnings was driven by a decline in revenue, with both yield and passenger loads lower due to capacity growth running ahead of demand in domestic and international markets. A three per cent improvement in comparable unit cost6 related to benefits being realised from the $2 billion2 accelerated Qantas Transformation program, though was offset by the $253 million increase in fuel cost to the prior year.
Group Underlying Income Statement Summary June 2014 June 2013
Restated7
Change%
ChangeNet passenger revenue8 $M 13,242 13,673 (431) (3)
Net freight revenue $M 955 935 20 2
Other revenue8 $M 1,155 1,294 (139) (11)
Revenue $M 15,352 15,902 (550) (3)
Operating expenses (excluding fuel)9 $M (9,288) (9,279) (9) –Share of net (loss)/profit of investments accounted for under the equity method
$M (66) (39)
(27) (69)
Fuel9 $M (4,496) (4,243) (253) (6)
Depreciation and amortisation $M (1,422) (1,450) 28 2
Non-cancellable aircraft operating lease rentals $M (520) (525) 5 1
Expenses $M (15,792) (15,536) (256) (2)
Underlying EBIT $M (440) 366 (806) >(100)
Net finance costs9 $M (206) (180) (26) (14)
Underlying PBT $M (646) 186 (832) >(100)
Operating Statistics June 2014 June 2013
Restated7 Change Change
%Available Seat Kilometres (ASK)10 M 141,715 139,909 1,806 1.3
Revenue Passenger Kilometres (RPK)11 M 109,659 110,905 (1,246) (1.1)
Passengers Carried ‘000 48,776 48,276 500 1.0
Revenue Seat Factor12 % 77.4 79.3 (1.9) pts
Yield (excluding FX)13 c/RPK 10.02 10.29 (0.27) (3)
Comparable unit cost6 c/ASK 5.00 5.15 0.15 3
6 Unit cost is adjusted to aid comparability between reporting periods. Comparable unit cost is calculated as Underlying PBT less passenger
revenue and fuel, adjusted for the impact of Boeing settlement and change in estimate of passenger revenue received in advance (2012/2013), changes in foreign exchange rates. Share of net loss of investments accounted for under the equity method and movements in average sector length per ASK. Comparable unit cost is the primary measure of unit cost used by the Qantas Group to aid comparability between reporting periods.
7 The 2012/2013 Group Underlying Income Statement has been restated as a result of the application of new or revised accounting standards. Refer to Note 10.
8 Net passenger revenue has been adjusted in 2013/2014 to include charter revenue previously reported as Other revenue. 2012/2013 Net passenger revenue and Other revenue has been reclassified accordingly. These items remain excluded from the calculation of yield.
9 Underlying operating expenses (excluding fuel and Share of net loss of investments accounted for under the equity method), fuel and net finance costs differ from equivalent statutory expenses due to items excluded from Underlying PBT, such as adjustments for impacts of AASB 139 which relate to other reporting periods and other items identified by Management. Refer to Note 2 for a reconciliation of Underlying PBT to Statutory (Loss)/Profit Before Tax.
10 ASK – total number of seats available for passengers, multiplied by the number of kilometres flown. 11
RPK – total number of passengers carried, multiplied by the number of kilometres flown. 12 Revenue Seat Factor – RPKs divided by ASKs. Also known as seat factor, load factor or load. 13 Yield (excluding FX) – Passenger revenue excluding foreign exchange, divided by RPKs.
QANTAS AIRWAYS LIMITED PRELIMINARY FINAL REPORT ABN: 16 009 661 901 YEAR ENDED 30 JUNE 2014
Page 5
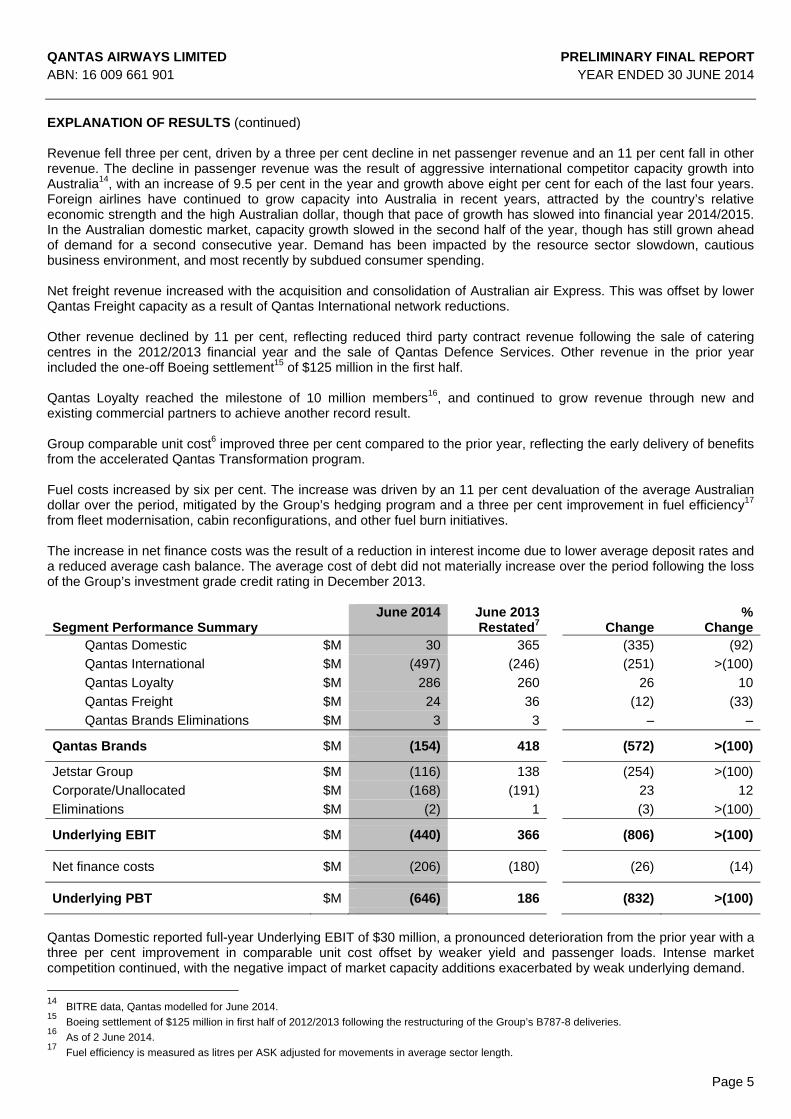
EXPLANATION OF RESULTS (continued) Revenue fell three per cent, driven by a three per cent decline in net passenger revenue and an 11 per cent fall in other revenue. The decline in passenger revenue was the result of aggressive international competitor capacity growth into Australia14, with an increase of 9.5 per cent in the year and growth above eight per cent for each of the last four years. Foreign airlines have continued to grow capacity into Australia in recent years, attracted by the country’s relative economic strength and the high Australian dollar, though that pace of growth has slowed into financial year 2014/2015. In the Australian domestic market, capacity growth slowed in the second half of the year, though has still grown ahead of demand for a second consecutive year. Demand has been impacted by the resource sector slowdown, cautious business environment, and most recently by subdued consumer spending. Net freight revenue increased with the acquisition and consolidation of Australian air Express. This was offset by lower Qantas Freight capacity as a result of Qantas International network reductions. Other revenue declined by 11 per cent, reflecting reduced third party contract revenue following the sale of catering centres in the 2012/2013 financial year and the sale of Qantas Defence Services. Other revenue in the prior year included the one-off Boeing settlement15 of $125 million in the first half. Qantas Loyalty reached the milestone of 10 million members16, and continued to grow revenue through new and existing commercial partners to achieve another record result. Group comparable unit cost6 improved three per cent compared to the prior year, reflecting the early delivery of benefits from the accelerated Qantas Transformation program. Fuel costs increased by six per cent. The increase was driven by an 11 per cent devaluation of the average Australian dollar over the period, mitigated by the Group’s hedging program and a three per cent improvement in fuel efficiency17 from fleet modernisation, cabin reconfigurations, and other fuel burn initiatives. The increase in net finance costs was the result of a reduction in interest income due to lower average deposit rates and a reduced average cash balance. The average cost of debt did not materially increase over the period following the loss of the Group’s investment grade credit rating in December 2013.
Segment Performance Summary June 2014 June 2013
Restated7 Change%
ChangeQantas Domestic $M 30 365
(335) (92)
Qantas International $M (497) (246)
(251) >(100)
Qantas Loyalty $M 286 260
26 10
Qantas Freight $M 24 36
(12) (33)
Qantas Brands Eliminations $M 3 3
– –
Qantas Brands $M (154) 418 (572) >(100)
Jetstar Group $M (116) 138
(254) >(100)
Corporate/Unallocated $M (168) (191)
23 12
Eliminations $M (2) 1
(3) >(100)
Underlying EBIT $M (440) 366 (806) >(100)
Net finance costs $M (206) (180)
(26) (14)
Underlying PBT $M (646) 186 (832) >(100)
Qantas Domestic reported full-year Underlying EBIT of $30 million, a pronounced deterioration from the prior year with a three per cent improvement in comparable unit cost offset by weaker yield and passenger loads. Intense market competition continued, with the negative impact of market capacity additions exacerbated by weak underlying demand.
14 BITRE data, Qantas modelled for June 2014. 15 Boeing settlement of $125 million in first half of 2012/2013 following the restructuring of the Group’s B787-8 deliveries. 16 As of 2 June 2014. 17 Fuel efficiency is measured as litres per ASK adjusted for movements in average sector length.

QANTAS AIRWAYS LIMITED PRELIMINARY FINAL REPORT ABN: 16 009 661 901 YEAR ENDED 30 JUNE 2014
Page 6
EXPLANATION OF RESULTS (continued) Qantas Domestic maintained its leading network and frequency advantage in the market, supporting the retention of over 80 per cent of corporate account revenue18. Qantas International reported an Underlying EBIT loss of $497 million, a $251 million decline compared to the prior year. The reduction was primarily due to the continuation of market capacity oversupply, led by competitor airlines in Asia and the Middle East, and unfavourable fuel cost from foreign exchange movements. Strategic highlights in the year included enhancements to the international network offering, with expanded code share partnerships agreed with both China Eastern and China Southern as well as the bedding down of the alliance with Emirates. The focus on business transformation at Qantas International continued, with a four per cent reduction in comparable unit costs as major initiatives including the B747-400 retirement program, cabin reconfigurations, and increased aircraft utilisation delivered benefits. Over the past two financial years, Qantas International has reduced comparable unit costs by nine per cent, with a 10 percentage point improvement in customer advocacy over the same period. These gains have been eroded at an earnings level by unfavourable fuel cost and revenue decline caused by excess market capacity growth. Qantas Loyalty achieved another record3 full-year Underlying EBIT of $286 million, up 10 per cent on the prior year. Membership in the Qantas Frequent Flyer program passed 10 million16 in the period, with 14 new partners added to the program, delivering more ways to earn and increased member interaction. Growth initiatives including Qantas Cash and the Acquire loyalty program have diversified Loyalty’s customer base and added new revenue streams. Jetstar Group’s first full-year Underlying EBIT loss of $116 million reflects the intense competitive environment in both domestic Australia and South East Asia. Domestic Australia remained profitable, however sustained aggressive competitor capacity growth in South East Asia depressed yields and loads in the period. As a result, Jetstar Asia, based in Singapore, reported losses of $40 million. Associate losses of $70 million were consistent with the rapid growth of Jetstar Japan as it expanded to consolidate its leading low-cost carrier position in the Japanese market and the establishment of Jetstar Hong Kong. Continued underlying unit cost19 improvements helped mitigate increased fuel cost of $86 million. Qantas Freight Underlying EBIT of $24 million is down $12 million on the prior corresponding period, with $11 million of the decline reported in the first half of financial year 2013/2014. Qantas International capacity reductions reduced freight capacity, and air freight markets were challenging in the first half of financial year 2013/2014 in particular. The full run-rate of benefits from the integration of Australian air Express began to be received in the second half of financial year 2013/2014. Qantas’ guiding strategic principles remain consistent As the Group undergoes the most significant business transformation in its history, repositioning both its cost base and competitive position in every market we operate in, our guiding strategic principles as a business remain consistent:
– Safety is always our first priority – The first choice for customers in every market we serve – Maintaining dual-brand strength in the Australian market – Reshaping Qantas International to remain competitive – Maintaining the Jetstar opportunity in Asia – Broadening Qantas Loyalty for strong, diversified earnings growth – Driving efficiency and productivity across the Group
In order to continue implementing that strategy and to deliver sustainable returns to shareholders in what will remain a very challenging operating environment, the Group must accelerate the pace of Qantas Transformation.
18
Qantas modelled share of total corporate account revenue. 19 Unit cost – Unit cost is measured using controllable unit cost in line with industry benchmarks for low-cost carriers. Controllable unit cost is
adjusted to aid comparability between reporting periods. Controllable unit cost is measured as total underlying expenses excluding fuel, carbon tax, Jetstar Group costs and Share of net loss of investments accounted for under the equity method, adjusted for changes in foreign exchange rates and movements in average sector length per ASK.
QANTAS AIRWAYS LIMITED PRELIMINARY FINAL REPORT ABN: 16 009 661 901 YEAR ENDED 30 JUNE 2014
Page 7
EXPLANATION OF RESULTS (continued) With overarching targets to implement initiatives that will deliver $2 billion2 of benefits by the end of financial year 2016/2017 and reduce net debt20 by more than $1 billion by the end of financial year 2014/2015, Qantas Transformation is the key to driving earnings recovery and simultaneously deleveraging the Group’s balance sheet. At the same time, the Group is focused on targeted reductions in capital investment to ensure sustainable positive free cash flow from financial year 2014/2015 onwards. To remain the first choice for customers and maintain our brand and yield premium, key customer-facing investments, including gateway lounges, cabin reconfigurations to the A330 and B738 fleets, and the prioritisation of fleet simplification through the arrival of the B787-8 Dreamliner into Jetstar, are all proceeding. Strategic priorities delivered on in the 2013/2014 financial year include:
– Dual brand strength: number one and two most profitable Australian Domestic airlines21; maintained margin premium over competition; market-leading on-time performance; unrivalled network and frequency; retained over 80 per cent of corporate accounts by revenue
– First choice for customers: new and expanded lounges opened in Singapore, Hong Kong, Los Angeles and in the domestic market; roll-out of B787-8 Dreamliner on new routes; record customer satisfaction levels; ongoing commitment to staff training
– Reshaping Qantas International: strong comparable unit cost improvement of four per cent; enhanced code share relationships with China Eastern and China Southern; successful integration with major alliance partner Emirates after move to new hub in Dubai
– Maintaining Jetstar opportunity in Asia: largest Low Cost Carrier (LCC) in domestic Japan market, second base in Osaka launched, market leading OTP; Jetstar Asia ‘Best Budget Airline’ in 201422; Jetstar Pacific business recapitalisation complete; all A320-200 fleet driving unit cost improvement
– Broadening Qantas Loyalty: customer innovation with launch of Qantas Cash and Aquire, new revenue streams; reached milestone of over 10 million members16 in Qantas Frequent Flyer
Qantas Transformation strong momentum towards $2 billion target The pillars that underpin the Group’s transformation are:
– Accelerating cost reduction – Right-sizing fleet and network – Working existing assets harder – Deferring growth – Aligning capital expenditure to financial performance – Accelerating simplification – Focus on customer and revenue
In the second half of financial year 2013/2014, $204 million of Transformation benefits were realised and an even greater pipeline of initiatives entered the implementation phase for delivery in financial year 2014/2015 and beyond. The accelerated Qantas Transformation program builds upon the significant cost reduction and strategic achievements of recent years.
20 Net debt including operating lease liabilities includes on balance sheet debt and off balance sheet aircraft operating lease liabilities. Operating
lease liability is the present value of minimum lease payments for aircraft operating leases which, in accordance with AASB 117: Leases, is not recognised on balance sheet. The operating lease liability has been calculated as the present value of future non-cancellable operating lease rentals of aircraft in service, using a discount rate of seven per cent applied in Standard and Poor’s methodology.
21 Based on Qantas Domestic and Jetstar earnings before interest and tax in 2013/2014. Tigerair Australia reported earnings before interest and tax, and consensus estimates for Virgin Australia domestic earnings before interest and tax in 2013/2014.
22 AsiaOne People’s Choice Awards.
QANTAS AIRWAYS LIMITED PRELIMINARY FINAL REPORT ABN: 16 009 661 901 YEAR ENDED 30 JUNE 2014
Page 8
EXPLANATION OF RESULTS (continued) Transformation milestones achieved in the first six months of the accelerated program include:
– $204 million of benefits realised, $900 million worth of initiatives in implementation phase – Accelerating comparable unit cost6 reduction: two per cent in first half, four per cent in second half of 2013/2014 – 2,200 of targeted 5,000 FTE reduction exited as at 30 June 2014. Redundancy, restructuring and other
transformation costs of $428 million23 recognised in financial year 2013/2014 – Avalon heavy maintenance facility closed – Line Maintenance Operations changes enacted – Right-sizing fleet and network at a cost of $394 million23 in financial year 2013/2014
• Qantas International network optimisation under way; exit Perth-Singapore, down-gauge aircraft to A330s on Sydney-Singapore and Brisbane-Singapore, re-time of QF 9/10 and maintenance changes to up-gauge Sydney-Dallas/Fort Worth to A380-800
• Qantas Domestic fleet simplification under way; exit of B737-400 aircraft and completion of B767-300 retirement
• Over 50 aircraft deferred or sold, accelerated B747-400 and B767-300 retirement in Group fleet restructure
– Jetstar ‘Lowest Seat Cost’ program lowering unit costs with a two per cent improvement in 2013/2014 – $1.3 billion reduction24 in planned capital investment in financial years 2014/2015 and 2015/2016 – Net debt4 reduced by $96 million
In December 2013, management announced it would freeze wages until the Qantas Group makes a full-year underlying profit. The wage freeze is:
– Ongoing for executives – Immediate for open Enterprise Bargaining Agreements (EBAs) – Proposed for other EBA-covered staff
Discussions with respective unions on implementation of the wage freeze continue to take place. The Qantas Group Chief Executive Officer did not receive an increase in Base Pay during 2013/2014 and elected to forego five per cent of Base Pay from 1 January 2014. All other Qantas Airways Limited Directors also elected to forego five per cent of their fees from 1 January 2014. In addition to the wages freeze, no bonus payments will be awarded for financial year 2013/2014. The end of financial year 2013/2014 represents the peak in costs associated with Qantas Transformation being incurred, with the full run-rate of permanent cost reduction to flow in the financial year ahead. Unlocking value through a structural review The outcomes from the review are both structural and strategic for the future direction of Qantas Group:
– Creating future optionality for Qantas International: Qantas Sale Act foreign ownership restrictions have been a long-standing barrier to Qantas’ participation in industry consolidation at a Group level. The partial repeal of the Act’s 25% and 35% foreign airline ownership caps removes a substantial barrier to consolidation that was unique to Qantas.
The decision has been made to create a new holding structure and corporate entity for Qantas International. The new structure increases potential for future external investment, and creates long-term options for Qantas International to participate in partnership and consolidation opportunities. The new structure builds upon existing segmentation of Qantas International and Qantas Domestic at management and financial reporting levels since 2012. With the change to Group structure, accounting standards require a change to the Group’s Cash Generating Units (CGU) for impairment testing.
23 Included in items not included in Underlying PBT in the 2013/2014 financial year. 24 Compared to August 2013 planned capital expenditure.

QANTAS AIRWAYS LIMITED PRELIMINARY FINAL REPORT ABN: 16 009 661 901 YEAR ENDED 30 JUNE 2014
Page 9
EXPLANATION OF RESULTS (continued)
– Impact on Qantas International asset carrying values: Prior to the Board decision to change the structure of
the Group, the Qantas Brands CGU comprised the operations of the Qantas fleet and brand to collectively generate cash inflow and derive value. As a result of the decision to create a new holding structure and corporate entity for Qantas International, Accounting Standards require the existing ‘Qantas Brands CGU’ to be split into four separate CGUs for the purposes of assessing the carrying value of the Group’s assets.
While there are significant surpluses in Qantas Loyalty, Qantas Domestic and Qantas Freight CGUs, an impairment of $2,560 million arose in the stand- alone Qantas International CGU. The size of the impairment loss recognised is largely the result of wide body aircraft being purchased through a period where the Australian dollar was significantly weaker against the US dollar compared to recent years.
This impairment is a non-cash charge, with no impact on the economics of the business or change to cash flow forecasts. The impairment has arisen because Qantas International CGU has been tested as a standalone CGU for the first time. Accordingly the Qantas International fleet assets are not assessed in combination with the collective cash flows of the whole of Qantas’ operations. Following the impairment, the carrying value of Qantas International aircraft is more reflective of current market value.
Material business risks The aviation industry is subject to a number of inherent risks. These include, but are not limited to, exposure to changes in economic conditions, changes in government regulations, fuel and foreign exchange volatility and other exogenous events such as aviation incidents, natural disasters, war or epidemic. Qantas is subject to a number of specific business risks which may impact the achievement of the Group’s strategy and financial prospects:
– Competitive intensity: Market capacity growth ahead of demand impacts industry profitability • Australia’s liberal aviation policy settings coupled with the strength of the Australian economy relative to
global economic weakness has attracted more offshore competitors to the Australian international aviation market, predominantly state-sponsored airlines. Qantas is responding by building key strategic airline partnerships with strong global partners. Qantas brings domestic strength and the unrivalled customer offering of Qantas Loyalty. Qantas has also embarked on reducing its cost base through the Qantas Transformation program. Qantas continues to leverage its considerable fleet flexibility and established relationships with manufacturers to adjust capital expenditure in line with financial performance and right-size its fleet and network.
• The Australian domestic aviation market has attracted increased competition in recent years. The resulting intensity of competition as a result of capacity growth ahead of demand over a sustained period is being mitigated by maintaining the Qantas Group’s market leading domestic position and executing Qantas Group’s dual brand strategy. This strategy leverages Qantas Domestic (including QantasLink) to serve business and premium leisure customers and Jetstar to serve price sensitive customers. Qantas Domestic is focused on removing the cost base disadvantage to its competitors through its transformation initiatives and fleet renewal, while Jetstar is working to maintain its low-cost scale advantage and continually lower unit costs.
– Fuel and foreign exchange volatility: The Qantas Group is subject to fuel and foreign exchange risks: These
risks are an inherent part of the operations of an airline. The Qantas Group manages these risks through a comprehensive hedging program.
– Industrial relations: The associated risks of a transformation including industrial action relating to Qantas’ collective agreements with its employees. This risk is being mitigated through continuous employee engagement initiatives and ongoing, constructive dialogue with all union groups and other relevant stakeholders.
– Continuity of critical systems: The Group’s operations depend on the continuous functioning of a number of information technology and communication services. The Group has an extensive control and management framework25 to reduce the likelihood of outages, ensure early detection and to mitigate the impact.
25 An overview of the Group Risk Management Framework is available through the Qantas Group Business Practices Document on qantas.com.au.
QANTAS AIRWAYS LIMITED PRELIMINARY FINAL REPORT ABN: 16 009 661 901 YEAR ENDED 30 JUNE 2014
Page 10
EXPLANATION OF RESULTS (continued)
– Credit rating: Qantas’ credit rating is Ba2 negative outlook and BB+ negative outlook by Moody’s and Standard
and Poor’s respectively. Compared to an investment grade credit rating, the price of new debt funding may increase and/or the Group’s access to some sources of unsecured credit could reduce over time. To mitigate the risk, Qantas maintains strong liquidity and has a flexible fleet plan to enable it to reduce Capital Expenditure to ensure debt remains within an acceptable range.
– Key business partners: The Qantas Group has relationships with a number of key business partners. Any potential exposures as a result of these partnerships are mitigated through the Group Risk Management Framework25.
Securing the future with financial discipline
Cash Flow Summary June 2014
June 2013
Change%
Change
Operating cash flows $M 1,069 1,417 (348) (25)
Investing cash flows $M (1,069) (1,045) (24) (2)
Net free cash flow26 $M – 372 (372) (100)
Financing cash flows $M 173 (953) 1,126 >100
Cash at beginning of period $M 2,829 3,398 (569) (17)
Effect of foreign exchange on cash $M (1) 12 (13) >(100)
Cash at period end $M 3,001 2,829 172 6
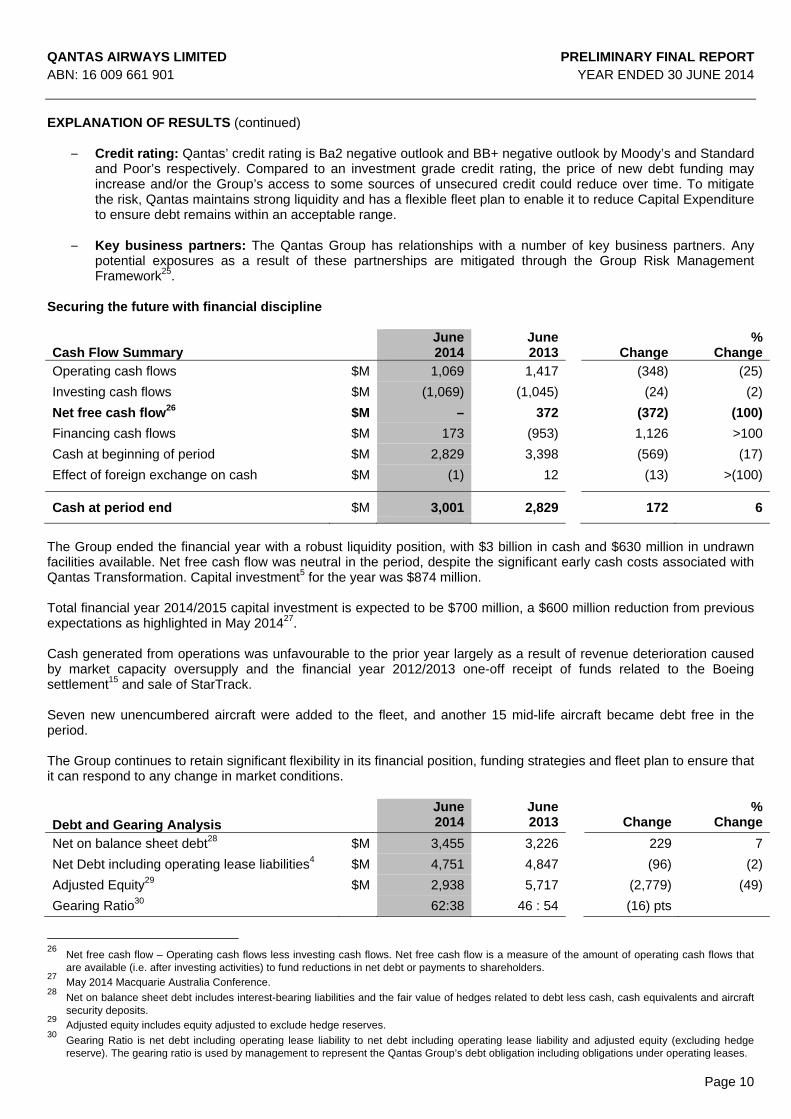
The Group ended the financial year with a robust liquidity position, with $3 billion in cash and $630 million in undrawn facilities available. Net free cash flow was neutral in the period, despite the significant early cash costs associated with Qantas Transformation. Capital investment5 for the year was $874 million. Total financial year 2014/2015 capital investment is expected to be $700 million, a $600 million reduction from previous expectations as highlighted in May 201427. Cash generated from operations was unfavourable to the prior year largely as a result of revenue deterioration caused by market capacity oversupply and the financial year 2012/2013 one-off receipt of funds related to the Boeing settlement15 and sale of StarTrack. Seven new unencumbered aircraft were added to the fleet, and another 15 mid-life aircraft became debt free in the period. The Group continues to retain significant flexibility in its financial position, funding strategies and fleet plan to ensure that it can respond to any change in market conditions.
Debt and Gearing Analysis June 2014
June 2013
Change%
Change
Net on balance sheet debt28 $M 3,455 3,226 229 7
Net Debt including operating lease liabilities4 $M 4,751 4,847 (96) (2)
Adjusted Equity29 $M 2,938 5,717 (2,779) (49)
Gearing Ratio30 62:38 46 : 54 (16) pts
26 Net free cash flow – Operating cash flows less investing cash flows. Net free cash flow is a measure of the amount of operating cash flows that
are available (i.e. after investing activities) to fund reductions in net debt or payments to shareholders. 27 May 2014 Macquarie Australia Conference. 28 Net on balance sheet debt includes interest-bearing liabilities and the fair value of hedges related to debt less cash, cash equivalents and aircraft
security deposits. 29 Adjusted equity includes equity adjusted to exclude hedge reserves. 30 Gearing Ratio is net debt including operating lease liability to net debt including operating lease liability and adjusted equity (excluding hedge
reserve). The gearing ratio is used by management to represent the Qantas Group’s debt obligation including obligations under operating leases.

QANTAS AIRWAYS LIMITED PRELIMINARY FINAL REPORT ABN: 16 009 661 901 YEAR ENDED 30 JUNE 2014
Page 11
EXPLANATION OF RESULTS (continued) Fleet The Qantas Group remains committed to a fleet strategy that provides for long-term flexibility, renewal, and that prioritises Group fleet simplification. The fleet strategy is designed to support the strategic objectives of the Group’s two flying brands and the overarching targets of the Qantas Transformation program. At all times, the Group retains significant flexibility to respond to any changes in market conditions and the competitive environment. At 30 June 2014, the Qantas Group fleet31 totalled 308 aircraft. During financial year 2013/2014, the Group purchased 17 aircraft and leased six aircraft:
– Qantas – four B737-800s, two Bombardier Q400s and five B717-200s. – Jetstar (including Jetstar Asia) – four B787-8s and eight A320-200s.
The Group removed 27 aircraft from service in financial year 2013/2014 including eight lease returns. These included three B747-400s, seven B767-300s, six B737-400s, five A320-200s, two Q200s and four EMB120s. The Qantas Group’s scheduled passenger fleet average age is now 7.7 years. The benefits of fleet investment include improved customer satisfaction, environmental outcomes, operational efficiencies and cost reductions. With the fleet modernisation program nearing completion, the low fleet age has enabled planned capital investment5 to be reduced by $1.3 billion over two years from previous expectations as highlighted in May 201427 to $700 million in financial year 2014/2015 and $800 million in financial year 2015/2016. Qantas Domestic
– Domestic market yields and revenue seat factor were adversely impacted by market capacity growth running ahead of demand for the second consecutive year
– Comparable unit cost improvement of three per cent, up from one per cent improvement in first half of financial year 2013/2014
– Superior on-time performance: market leader in 12 out of 12 months – Record levels of customer satisfaction and advocacy
Qantas Domestic Underlying EBIT of $30 million for the full year ended 30 June 2014 was down from $365 million in the prior corresponding period. The reduction in Underlying EBIT was driven largely by continued domestic market capacity growth ahead of demand growth and increased fuel cost of $68 million. Business and leisure demand remained weak throughout the year, with corporate account revenue impacted by softening resources sector demand, particularly in the Western Australian and Queensland markets and reduced Government spending. This challenging competitive environment resulted in reduced revenue seat factor and weaker yields. However, Qantas continues to be the clear choice for business travellers and has maintained over 80 per cent share of corporate account revenue. Qantas Domestic’s comparable unit cost6 improved three per cent on the prior corresponding period, as cost savings were realised from the accelerated Qantas Transformation program. Benefits realised stemmed from initiatives including the consolidation of Qantas heavy maintenance bases, continued fleet renewal, and the ongoing management and non-operational restructure.
31 Includes Jetstar Asia, Qantas Freight and Network Aviation and excludes aircraft owned by Jetstar Japan, Jetstar Hong Kong and Jetstar Pacific.
June June %
2014 2013 Change Change
Total Revenue and Other Income $M 5,848 6,218 (370) (6)
Revenue Seat Factor % 73.3 75.9 (2.6) pts
Underlying EBIT $M 30 365 (335) (92)

QANTAS AIRWAYS LIMITED PRELIMINARY FINAL REPORT ABN: 16 009 661 901 YEAR ENDED 30 JUNE 2014
Page 12
EXPLANATION OF RESULTS (continued) Qantas Domestic achieved record customer satisfaction levels over the year, with a number of industry awards recognising our product offering and service standards:
– ‘Best Domestic Airline’32 five years running – ‘Best Economy’33 noting that Qantas Domestic was the world’s best by a wide margin – ‘Best Lounges’33 – ‘Australia’s Favourite Airline’34
Qantas Domestic has achieved superior on-time performance for the fifth year running, including beating its main competitor for an unprecedented 18 consecutive months to June 2014. Qantas Domestic continued to strengthen its customer proposition through improved lounge experiences, investing in new and expanded lounges in Melbourne, Tamworth and Broome airports, and continued investment in front-line team training. Network growth continues with commencement of new East Coast premium leisure routes: Brisbane to Port Macquarie, Sydney to Hervey Bay, Melbourne to Coffs Harbour, and Sydney to Hamilton Island. Qantas Domestic continues to support the regional market position through QantasLink and Network Aviation services. QantasLink launched two-class B717-200 services on Canberra and Tasmania routes and took delivery of two Bombardier Q400 aircraft and two B717-200 aircraft during the period. Network Aviation commenced regular passenger transport operations during June. QantasLink relocated into the Qantas Sydney terminal, creating a more seamless travel experience for Qantas customers through smoother connections and reduced check-in times. Qantas International
– Market capacity oversupply adversely impacted International market yields and revenue seat factors – Adverse currency movement increased AUD fuel price – Comparable unit cost6 improvement of four per cent – Strengthening alliances through Emirates partnership and new codeshare agreements – Ongoing product investment to build on recent customer advocacy gains
June June %
2014 2013 Change Change
Total Revenue and Other Income $M 5,297 5,496 (199) (4)
Revenue Seat Factor % 79.6 81.6 (2.0) pts
Underlying EBIT $M (497) (246) (251) >(100) Qantas International Underlying EBIT loss of $497 million represents a $251 million deterioration on the prior financial year. Significant benefits from the Qantas Transformation program have been materially offset by lower revenue and the unfavourable foreign exchange impact on fuel of $42 million. Yields were reduced due to market capacity oversupply, with International capacity in and out of Australia increasing by 9.5 per cent (or 3.7 million additional seats), resulting in an intensely competitive pricing environment. Capacity growth was largely led by Middle Eastern, Asian network and low-cost carriers. The strength of our alliance with Emirates has provided a partial offset, with a strong ‘one stop’ European proposition and additional frequencies into Asia. Comparable unit cost improved four per cent. Improved asset utilisation of six per cent, combined with the ongoing restructure of the legacy cost base through the Qantas Transformation program, has delivered this strong unit cost result. The B747-400 retirement program (an additional three units in financial year 2013/2014), reduction in heavy maintenance footprint, and improved fleet economics following the A380-800 and B747-400 reconfiguration program have all made a significant contribution to cost reduction. Ongoing optimisation of the network remains a key focus area. Recent examples include the exit of Perth-Singapore and down-gauge of Brisbane-Singapore and Sydney-Singapore to A330 aircraft.
32
Australian Federation of Travel Agents National Industry Awards 2010 – 2014. 33
AirlineRatings.com’s Airline Excellence Awards, January 2014. 34 TripAdvisor Traveller’s Choice Awards.
QANTAS AIRWAYS LIMITED PRELIMINARY FINAL REPORT ABN: 16 009 661 901 YEAR ENDED 30 JUNE 2014
Page 13
EXPLANATION OF RESULTS (continued) Qantas International continues to invest in what our customers value most, including lounges, with significant improvements to the Los Angeles and Hong Kong lounges, and onboard product enhancement including menu design and a sleeper service. These, combined with the broader network proposition through the Emirates alliance, have seen Net Promoter Scores improve a significant 10 points over two years. The launch of the A330 flat bed in late 2014 continues this commitment. Qantas International continued to strengthen its intra-Asia proposition, including announcing a new codeshare partnership with China Southern and expanded code share with China Eastern. Qantas International now has agreements with three major China-based carriers, providing access to one of the world’s largest and fastest growing economies. Jetstar
– Domestic business profitable every year since 2004 – Competitive environment impacting yields, in particular in South East Asia – Unfavourable fuel cost with lower Australian dollar – Low Cost Carrier (LCC) business fundamentals remain strong
• Continued unit cost19 improvement • Successful introduction of the B787-8 Dreamliner
– Record customer advocacy levels reached
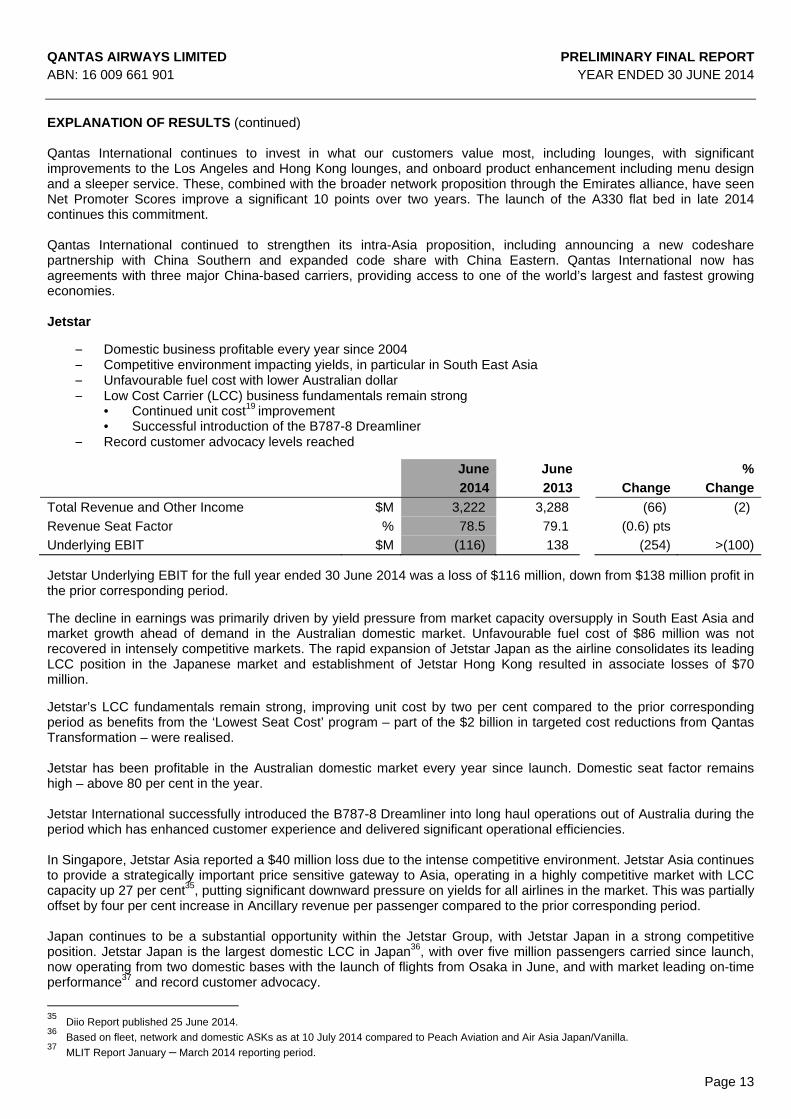
Jetstar Underlying EBIT for the full year ended 30 June 2014 was a loss of $116 million, down from $138 million profit in the prior corresponding period. The decline in earnings was primarily driven by yield pressure from market capacity oversupply in South East Asia and market growth ahead of demand in the Australian domestic market. Unfavourable fuel cost of $86 million was not recovered in intensely competitive markets. The rapid expansion of Jetstar Japan as the airline consolidates its leading LCC position in the Japanese market and establishment of Jetstar Hong Kong resulted in associate losses of $70 million. Jetstar’s LCC fundamentals remain strong, improving unit cost by two per cent compared to the prior corresponding period as benefits from the ‘Lowest Seat Cost’ program – part of the $2 billion in targeted cost reductions from Qantas Transformation – were realised. Jetstar has been profitable in the Australian domestic market every year since launch. Domestic seat factor remains high – above 80 per cent in the year. Jetstar International successfully introduced the B787-8 Dreamliner into long haul operations out of Australia during the period which has enhanced customer experience and delivered significant operational efficiencies. In Singapore, Jetstar Asia reported a $40 million loss due to the intense competitive environment. Jetstar Asia continues to provide a strategically important price sensitive gateway to Asia, operating in a highly competitive market with LCC capacity up 27 per cent35, putting significant downward pressure on yields for all airlines in the market. This was partially offset by four per cent increase in Ancillary revenue per passenger compared to the prior corresponding period. Japan continues to be a substantial opportunity within the Jetstar Group, with Jetstar Japan in a strong competitive position. Jetstar Japan is the largest domestic LCC in Japan36, with over five million passengers carried since launch, now operating from two domestic bases with the launch of flights from Osaka in June, and with market leading on-time performance37 and record customer advocacy.
35
Diio Report published 25 June 2014. 36 Based on fleet, network and domestic ASKs as at 10 July 2014 compared to Peach Aviation and Air Asia Japan/Vanilla. 37
MLIT Report January – March 2014 reporting period.
June June %
2014 2013 Change Change
Total Revenue and Other Income $M 3,222 3,288 (66) (2)
Revenue Seat Factor % 78.5 79.1 (0.6) pts
Underlying EBIT $M (116) 138 (254) >(100)

QANTAS AIRWAYS LIMITED PRELIMINARY FINAL REPORT ABN: 16 009 661 901 YEAR ENDED 30 JUNE 2014
Page 14
EXPLANATION OF RESULTS (continued) Jetstar Pacific continues to realise the benefits from its fleet renewal program, achieving a two per cent unit cost19 improvement compared to the prior corresponding period. The successful recapitalisation during the period will support fleet growth and the planned launch of international services in the first half of 2014/2015. Jetstar Hong Kong’s preparation for operational launch continues while seeking necessary regulatory approvals. Qantas Loyalty
– Record3 Underlying EBIT of $286 million, up 10 per cent on the prior year – Member growth of eight per cent to 10.1 million members – Billings38 up eight per cent to $1,306 million – Growth initiatives exceeding expectations – Qantas Cash and Aquire – Continuing member engagement through Qantas Points Website, Online Mall and upcoming launch of Qantas
Golf Club – Record annual Net Promoter Score39
Qantas Loyalty achieved another record result with a 10 per cent improvement in Underlying EBIT to $286 million. This has been driven by strong billings growth, continuing member engagement and continued member growth, with more than 720,000 members added over the financial year. Billings increased by eight per cent to $1,306 million. External billings are up by 10 per cent, mainly due to growth in credit card billings driven by promotional campaigns and new products. New growth initiatives of Qantas Cash and Aquire are already exceeding expectations. Only 10 months from the initial launch, Qantas Cash is already providing incremental EBIT to the business. Over 300,000 members have activated the facility and almost $500 million has been loaded onto cards, making it one of the largest prepaid products in Australia. Qantas Cash has won multiple awards including the Australian Business Award for Product Excellence and a 5-Star Canstar rating for Outstanding Value. Qantas Loyalty launched Aquire on 31 March 2014. The business rewards program continues to grow with close to 35,000 members already registered in the program. Sixteen partners are currently signed up as Aquire partners across airline, financial services, consulting services, car rentals, office supplies and other business expenses. As the program continues to expand its product offerings, Qantas Loyalty launched a dedicated digital channel in August 2014 – www.qantaspoints.com. The channel showcases the depth and breadth of the program and is a responsive design across all devices, making it even easier to access all there is to know about earning and redeeming Qantas Points. Along with Qantas Points, Qantas Loyalty also launched the Online Mall, providing new opportunities for Qantas Frequent Flyer members to earn Qantas Points when shopping online with 17 premium Australian and International retailers such as David Jones, eBay, Net-A-Porter and The Iconic. Qantas Loyalty announced Qantas Golf Club which will launch in the summer of 2014. This is an online program dedicated to engaging golfers and supporting golf clubs in Australia. The Qantas Golf Club will offer easy access to play at participating golf courses, earn Qantas Points when playing golf, receive invitations to attend Qantas Golf Club events and participate in tournaments, and access to a range of golf travel packages, both within Australia and overseas. Qantas Loyalty added 14 new partners to the Qantas Frequent Flyer Program during the period, providing members with expanded opportunities to earn and redeem points. New ways to earn include Macquarie Bank Home Loans, secure Parking, iSelect, Jumeirah Hotels & Resorts, Qantas Restaurants, Qantas Cruises and Qantas Hotels. Airline partners that joined the program this year were US Airways, Qatar Airways, LATAM and Sri Lankan Airlines.
38 Billings represent point sales to partners. 39 Net Promoter Score is at its highest level since reporting started in 2008.
June June %
2014 2013 Change Change
Members M 10.1 9.4 0.7 8 Billings $M 1,306 1,209 97 8
Underlying EBIT $M 286 260 26 10
QANTAS AIRWAYS LIMITED PRELIMINARY FINAL REPORT ABN: 16 009 661 901 YEAR ENDED 30 JUNE 2014
Page 15
EXPLANATION OF RESULTS (continued) Qantas Freight
– Increased revenue in a competitive environment – Full run-rate synergies from embedding the Australian air Express acquisition – Removal of B747F hull from January 2014 – Closure of Qantas Courier Australian operations
June June %
2014 2013 Change Change
Total Revenue and Other Income $M 1,084 1,056 28 3
Revenue Load Factor40 % 55.1 56.2 (1.1) pts
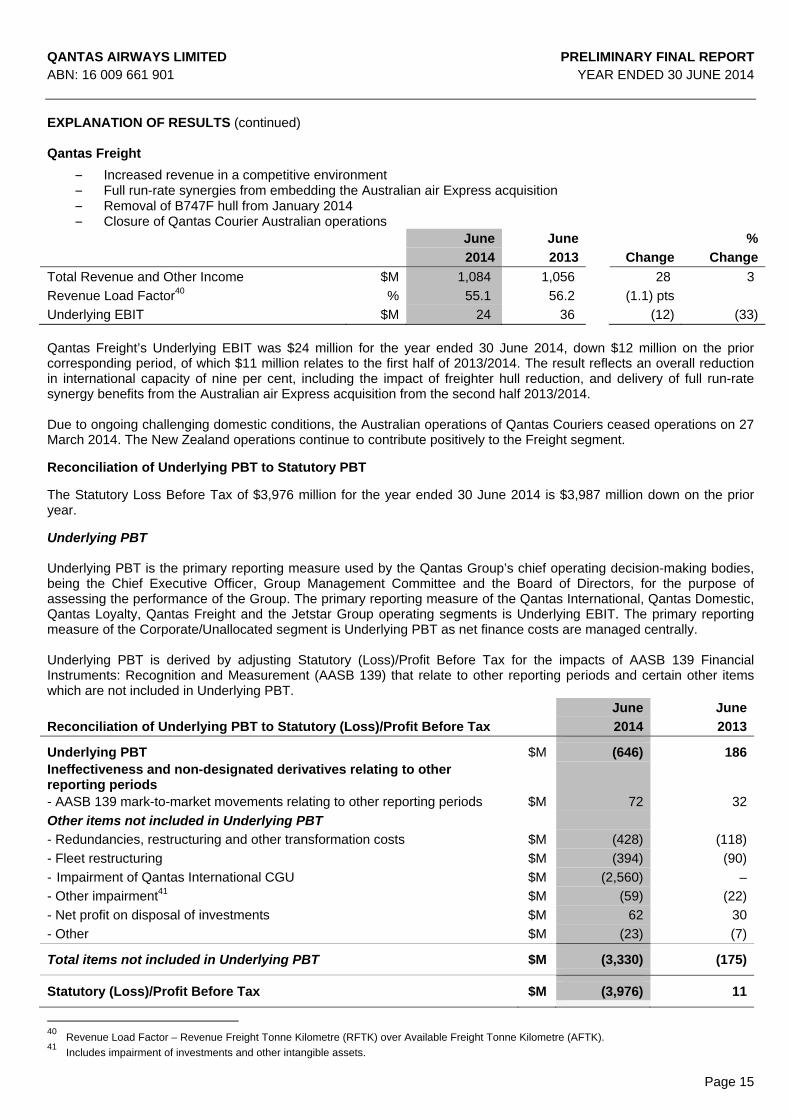
Underlying EBIT $M 24 36 (12) (33) Qantas Freight’s Underlying EBIT was $24 million for the year ended 30 June 2014, down $12 million on the prior corresponding period, of which $11 million relates to the first half of 2013/2014. The result reflects an overall reduction in international capacity of nine per cent, including the impact of freighter hull reduction, and delivery of full run-rate synergy benefits from the Australian air Express acquisition from the second half 2013/2014. Due to ongoing challenging domestic conditions, the Australian operations of Qantas Couriers ceased operations on 27 March 2014. The New Zealand operations continue to contribute positively to the Freight segment. Reconciliation of Underlying PBT to Statutory PBT The Statutory Loss Before Tax of $3,976 million for the year ended 30 June 2014 is $3,987 million down on the prior year.
Underlying PBT Underlying PBT is the primary reporting measure used by the Qantas Group’s chief operating decision-making bodies, being the Chief Executive Officer, Group Management Committee and the Board of Directors, for the purpose of assessing the performance of the Group. The primary reporting measure of the Qantas International, Qantas Domestic, Qantas Loyalty, Qantas Freight and the Jetstar Group operating segments is Underlying EBIT. The primary reporting measure of the Corporate/Unallocated segment is Underlying PBT as net finance costs are managed centrally. Underlying PBT is derived by adjusting Statutory (Loss)/Profit Before Tax for the impacts of AASB 139 Financial Instruments: Recognition and Measurement (AASB 139) that relate to other reporting periods and certain other items which are not included in Underlying PBT. June June
Reconciliation of Underlying PBT to Statutory (Loss)/Profit Before Tax 2014 2013
Underlying PBT $M (646) 186Ineffectiveness and non-designated derivatives relating to other reporting periods
- AASB 139 mark-to-market movements relating to other reporting periods $M 72 32
Other items not included in Underlying PBT
- Redundancies, restructuring and other transformation costs $M (428) (118)
- Fleet restructuring $M (394) (90)
- Impairment of Qantas International CGU $M (2,560) –
- Other impairment41 $M (59) (22)
- Net profit on disposal of investments $M 62 30
- Other $M (23) (7)
Total items not included in Underlying PBT $M (3,330) (175)
Statutory (Loss)/Profit Before Tax $M (3,976) 11
40
Revenue Load Factor – Revenue Freight Tonne Kilometre (RFTK) over Available Freight Tonne Kilometre (AFTK). 41 Includes impairment of investments and other intangible assets.
QANTAS AIRWAYS LIMITED PRELIMINARY FINAL REPORT ABN: 16 009 661 901 YEAR ENDED 30 JUNE 2014
Page 16
EXPLANATION OF RESULTS (continued) AASB 139 mark-to-market movements relating to other reporting periods All derivative transactions undertaken by the Qantas Group represent economic hedges of underlying risk and exposures. The Qantas Group does not enter into speculative derivative transactions. Notwithstanding this, AASB 139 requires certain mark-to-market movements in derivatives which are classified as ’ineffective’ to be recognised immediately in the Consolidated Income Statement. The recognition of derivative valuation movements in reporting periods which differ from the designated transaction causes volatility in statutory profit that does not reflect the hedging nature of these derivatives. Underlying PBT reports all hedge derivative gains and losses in the same reporting period as the underlying transaction by adjusting the reporting period’s statutory profit for derivative mark-to-market movements that relate to underlying exposures in other reporting periods. All derivative mark-to-market movements which have been excluded from Underlying PBT will be recognised through Underlying PBT in future periods when the underlying transaction occurs. Other items not included in Underlying PBT Items which are identified by Management and reported to the chief operating decision-making bodies as not representing the underlying performance of the business are not included in Underlying PBT. The determination of these items is made after consideration of their nature and materiality and is applied consistently from period to period. Items not included in Underlying PBT primarily result from major transformational/restructuring initiatives, transactions involving investments and impairments of assets outside the ordinary course of business. Items not included in Underlying PBT in the 2013/2014 year were driven by the accelerated Qantas Transformation program, fleet restructuring, the disposal of Qantas Defence Services, impairment of an investment in an associate (Helloworld Limited) and the impairment of the Qantas International CGU. Redundancy, restructuring and other transformation costs of $428 million include the reduction of management and non-operational roles, further consolidation of engineering and catering facilities and the integration of Australian air Express. Fleet restructuring costs of $394 million include impairment of aircraft, together with associated support property, plant and equipment, inventory and other related costs following strategic network changes and accelerated fleet retirements resulting from the Qantas Transformation program. Impairment of cash generating unit of $2,560 million relates to an impairment being recognised in the Qantas International CGU arising because as a result of the outcome of the Structural Review the Qantas International CGU has been tested as a standalone CGU for the first time. The size of the impairment loss recognised is largely the result of wide body aircraft being purchased through a period where the Australian dollar was significantly weaker against the US dollar compared to recent years.
QANTAS AIRWAYS LIMITED PRELIMINARY FINAL REPORT ABN: 16 009 661 901 YEAR ENDED 30 JUNE 2014
Page 17
OTHER INFORMATION
June 2014
$
June 2013Restated1
$
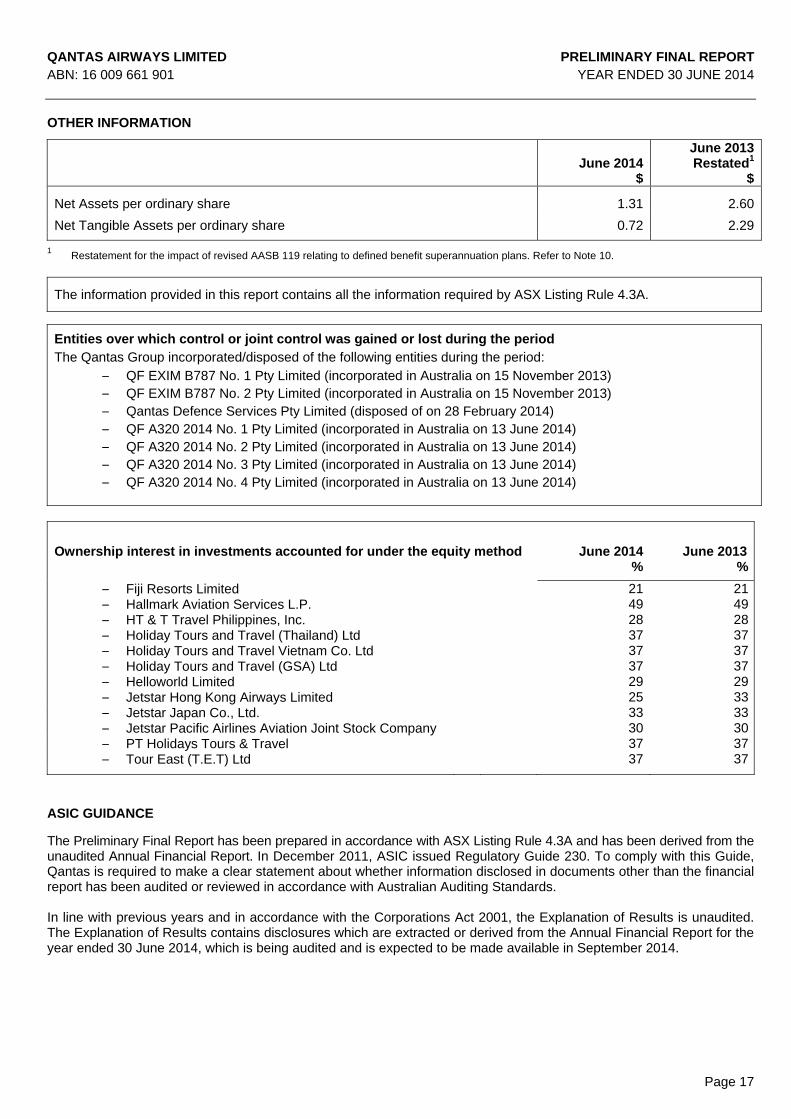
Net Assets per ordinary share 1.31 2.60
Net Tangible Assets per ordinary share 0.72 2.29
1 Restatement for the impact of revised AASB 119 relating to defined benefit superannuation plans. Refer to Note 10.
The information provided in this report contains all the information required by ASX Listing Rule 4.3A.
Entities over which control or joint control was gained or lost during the period
The Qantas Group incorporated/disposed of the following entities during the period:
– QF EXIM B787 No. 1 Pty Limited (incorporated in Australia on 15 November 2013) – QF EXIM B787 No. 2 Pty Limited (incorporated in Australia on 15 November 2013) – Qantas Defence Services Pty Limited (disposed of on 28 February 2014) – QF A320 2014 No. 1 Pty Limited (incorporated in Australia on 13 June 2014) – QF A320 2014 No. 2 Pty Limited (incorporated in Australia on 13 June 2014) – QF A320 2014 No. 3 Pty Limited (incorporated in Australia on 13 June 2014) – QF A320 2014 No. 4 Pty Limited (incorporated in Australia on 13 June 2014)
Ownership interest in investments accounted for under the equity method
June 2014 June 2013
% %
– Fiji Resorts Limited 21 21– Hallmark Aviation Services L.P. 49 49– HT & T Travel Philippines, Inc. 28 28– Holiday Tours and Travel (Thailand) Ltd 37 37– Holiday Tours and Travel Vietnam Co. Ltd
37 37– Holiday Tours and Travel (GSA) Ltd
37 37– Helloworld Limited
29 29– Jetstar Hong Kong Airways Limited
25 33– Jetstar Japan Co., Ltd.
33 33– Jetstar Pacific Airlines Aviation Joint Stock Company
30 30– PT Holidays Tours & Travel
37 37– Tour East (T.E.T) Ltd
37 37
ASIC GUIDANCE The Preliminary Final Report has been prepared in accordance with ASX Listing Rule 4.3A and has been derived from the unaudited Annual Financial Report. In December 2011, ASIC issued Regulatory Guide 230. To comply with this Guide, Qantas is required to make a clear statement about whether information disclosed in documents other than the financial report has been audited or reviewed in accordance with Australian Auditing Standards. In line with previous years and in accordance with the Corporations Act 2001, the Explanation of Results is unaudited. The Explanation of Results contains disclosures which are extracted or derived from the Annual Financial Report for the year ended 30 June 2014, which is being audited and is expected to be made available in September 2014.

QANTAS AIRWAYS LIMITED PRELIMINARY FINAL REPORT ABN: 16 009 661 901 YEAR ENDED 30 JUNE 2014
Page 18
CONSOLIDATED INCOME STATEMENT
For the year ended 30 June 2014 June 2014
June 2013Restated1
Note $M $M
Revenue and other income
Net passenger revenue 13,242 13,673
Net freight revenue 955 935
Other 4 1,155 1,294
15,352 15,902
Expenditure
Manpower and staff related 3,717 3,846
Fuel 4,461 4,154
Aircraft operating variable 3,142 3,061
Depreciation and amortisation 1,422 1,450
Impairment of specific assets 3 387 115
Impairment of cash generating unit 3 2,560 –
Non-cancellable aircraft operating lease rentals 520 525
Share of net loss of investments accounted for under the equity method 66 39
Other 4 2,849 2,514
19,124 15,704
Statutory (loss)/profit before income tax expense and net finance costs
(3,772) 198
Finance income 82 109
Finance costs (286) (296)
Net finance costs (204) (187)
Statutory (loss)/profit before income tax expense (3,976) 11
Income tax benefit/(expense) 5 1,133 (9)
Statutory (loss)/profit for the year
(2,843) 2
Attributable to:
Members of Qantas (2,843) 1
Non-controlling interests
– 1
Statutory (loss)/profit for the year
(2,843) 2
(Loss)/earnings per share attributable to members of Qantas:
Basic/diluted (loss)/earnings per share (cents) (128.5) 0.04
1 Restatement for the impact of revised AASB 119 relating to defined benefit superannuation plans. Refer to Note 10. The above Consolidated Income Statement should be read in conjunction with the accompanying notes.
QANTAS AIRWAYS LIMITED PRELIMINARY FINAL REPORT ABN: 16 009 661 901 YEAR ENDED 30 JUNE 2014
Page 19
CONSOLIDATED STATEMENT OF COMPREHENSIVE INCOME
For the year ended 30 June 2014
June 2014 June 2013Restated1
$M $M
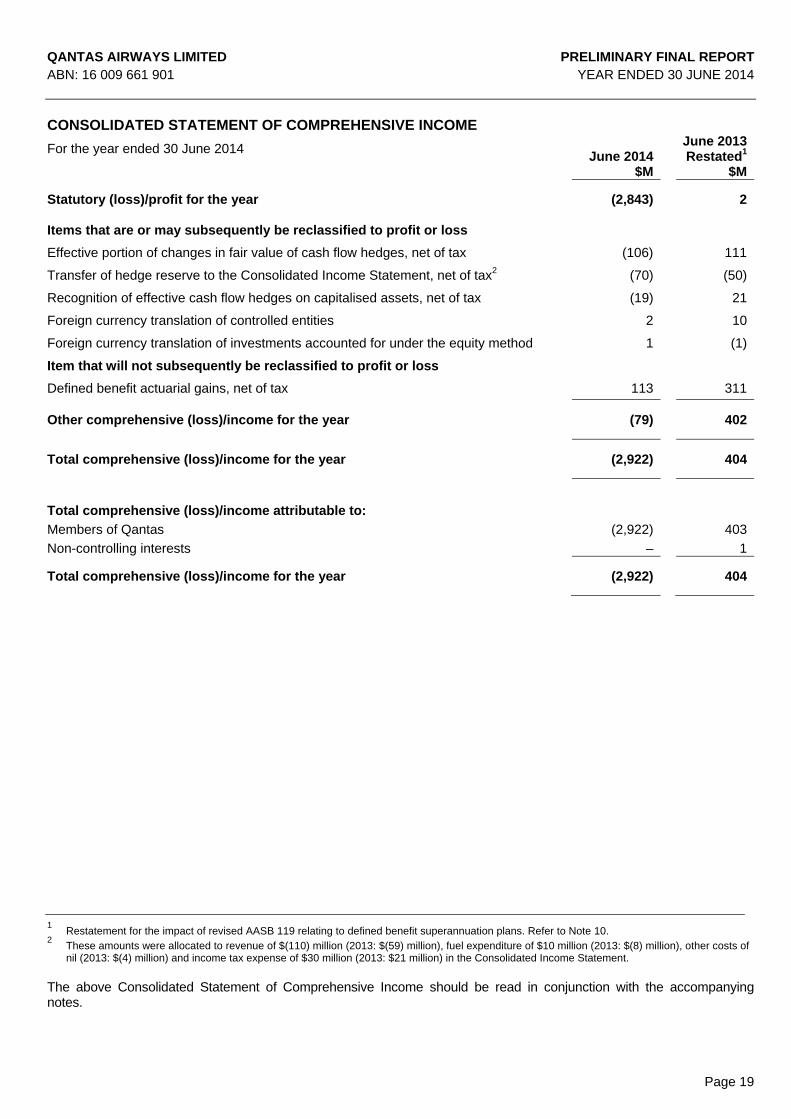
Statutory (loss)/profit for the year (2,843) 2
Items that are or may subsequently be reclassified to profit or loss
Effective portion of changes in fair value of cash flow hedges, net of tax (106) 111
Transfer of hedge reserve to the Consolidated Income Statement, net of tax2 (70) (50)
Recognition of effective cash flow hedges on capitalised assets, net of tax (19) 21
Foreign currency translation of controlled entities 2 10
Foreign currency translation of investments accounted for under the equity method 1 (1)
Item that will not subsequently be reclassified to profit or loss
Defined benefit actuarial gains, net of tax 113 311
Other comprehensive (loss)/income for the year (79) 402
Total comprehensive (loss)/income for the year (2,922) 404
Total comprehensive (loss)/income attributable to:
Members of Qantas (2,922) 403
Non-controlling interests – 1
Total comprehensive (loss)/income for the year (2,922) 404
1 Restatement for the impact of revised AASB 119 relating to defined benefit superannuation plans. Refer to Note 10. 2 These amounts were allocated to revenue of $(110) million (2013: $(59) million), fuel expenditure of $10 million (2013: $(8) million), other costs of
nil (2013: $(4) million) and income tax expense of $30 million (2013: $21 million) in the Consolidated Income Statement. The above Consolidated Statement of Comprehensive Income should be read in conjunction with the accompanying notes.

QANTAS AIRWAYS LIMITED PRELIMINARY FINAL REPORT ABN: 16 009 661 901 YEAR ENDED 30 JUNE 2014
Page 20
CONSOLIDATED BALANCE SHEET As at 30 June 2014
June 2014June 2013 Restated1
June 2012Restated1
Note $M $M $MCurrent assets Cash and cash equivalents 3,001 2,829 3,398Receivables 1,196 1,436 1,111Other financial assets 172 180 88Inventories 317 364 376Assets classified as held for sale 134 42 73Other 112 110 121
Total current assets 4,932 4,961 5,167
Non-current assets Receivables 158 174 472Other financial assets 34 27 17Investments accounted for under the equity method 143 190 457Property, plant and equipment 10,500 13,827 14,139Intangible assets 741 714 610Deferred tax assets 548 – –Other 262 139 23
Total non-current assets 12,386 15,071 15,718
Total assets 17,318 20,032 20,885
Current liabilities Payables 1,851 1,844 1,865Revenue received in advance 3,406 3,047 3,183Interest-bearing liabilities 8 1,210 835 1,119Other financial liabilities 182 86 369Provisions 876 835 879Liabilities classified as held for sale – – 12
Total current liabilities 7,525 6,647 7,427
Non-current liabilities Revenue received in advance 1,183 1,186 1,136Interest-bearing liabilities 8 5,273 5,245 5,430Other financial liabilities 66 54 224Provisions 405 435 736Deferred tax liabilities – 625 464
Total non-current liabilities 6,927 7,545 7,990
Total liabilities 14,452 14,192 15,417
Net assets 2,866 5,840 5,468
Equity Issued capital 4,630 4,693 4,729Treasury shares (16) (43) (42)Reserves (81) 128 36Retained earnings (1,671) 1,057 741
Equity attributable to the members of Qantas 2,862 5,835 5,464Non-controlling interests 4 5 4
Total equity 2,866 5,840 5,468
1 Restatement for the impact of revised AASB 119 relating to defined benefit superannuation plans. Refer to Note 10. The above Consolidated Balance Sheet should be read in conjunction with the accompanying notes.

QANTAS AIRWAYS LIMITED PRELIMINARY FINAL REPORT ABN: 16 009 661 901 YEAR ENDED 30 JUNE 2014
Page 21
STATEMENT OF CHANGES IN EQUITY For the year ended 30 June 2014
June 2014 $M
Issued
Cap
ital
Treasu
ry Sh
ares
Em
plo
yee C
om
pen
sation
R
eserv
e
Hed
ge R
eserv
e
Fo
reign
Cu
rrency
Tran
slation
R
eserv
e
Retain
ed E
arnin
gs
No
n-co
ntro
lling
In
terests
To
tal Eq
uity
Balance as at 1 July 2013 (restated1) 4,693 (43) 49 123 (44) 1,057 5 5,840 Total comprehensive (loss)/income for the year Statutory loss for the year – – – – – (2,843) – (2,843)
Other comprehensive (loss)/income - Effective portion of changes in fair value
of cash flow hedges, net of tax – – – (106) – – – (106)
- Transfer of hedge reserve to the Consolidated Income Statement, net of tax
– – – (70) – – – (70)
- Recognition of effective cash flow hedges on capitalised assets, net of tax
– – – (19) – – – (19)
- Defined benefit actuarial gains, net of tax – – – – – 113 113- Foreign currency translation of controlled
entities – – – – 2 – – 2
- Foreign currency translation of investments accounted for under the equity method
– – – – 1 – – 1
Total other comprehensive (loss)/income – – – (195) 3 113 – (79)
Total comprehensive (loss)/ income for the year
– – – (195) 3 (2,730) – (2,922)
Transactions with owners recorded directly in equity Contributions by and distributions to owners
- Shares bought back2 (63) – – – – – – (63)- Share-based payments – – 12 – – – – 12- Shares vested and transferred to
employees – 27 (23) – – (4) – –
- Share-based payments unvested and lapsed
– – (6) – – 6 – –
- Dividends paid – – – – – – (1) (1)
Total contributions by and distributions to owners
(63) 27 (17) – – 2 (1) (52)
Total transactions with owners (63) 27 (17) – – 2 (1) (52)
Balance as at 30 June 2014 4,630 (16) 32 (72) (41) (1,671) 4 2,866
1 Restatement for the impact of revised AASB 119 relating to defined benefit superannuation plans. Refer to Note 10. 2 45,415,538 shares were bought back and cancelled during the year ended 30 June 2014.
The above Consolidated Statement of Changes in Equity should be read in conjunction with the accompanying notes.
QANTAS AIRWAYS LIMITED PRELIMINARY FINAL REPORT ABN: 16 009 661 901 YEAR ENDED 30 JUNE 2014
Page 22
CONSOLIDATED STATEMENT OF CHANGES IN EQUITY For the year ended 30 June 2014
June 2013 Restated1 $M
Issued
Cap
ital
Treasu
ry Sh
ares
Em
plo
yee C
om
pen
sation
R
eserv
e
Hed
ge R
eserv
e
Fo
reign
Cu
rrency
Tran
slation
R
eserv
e
Retain
ed E
arnin
gs
No
n-co
ntro
lling
In
terests
To
tal Eq
uity
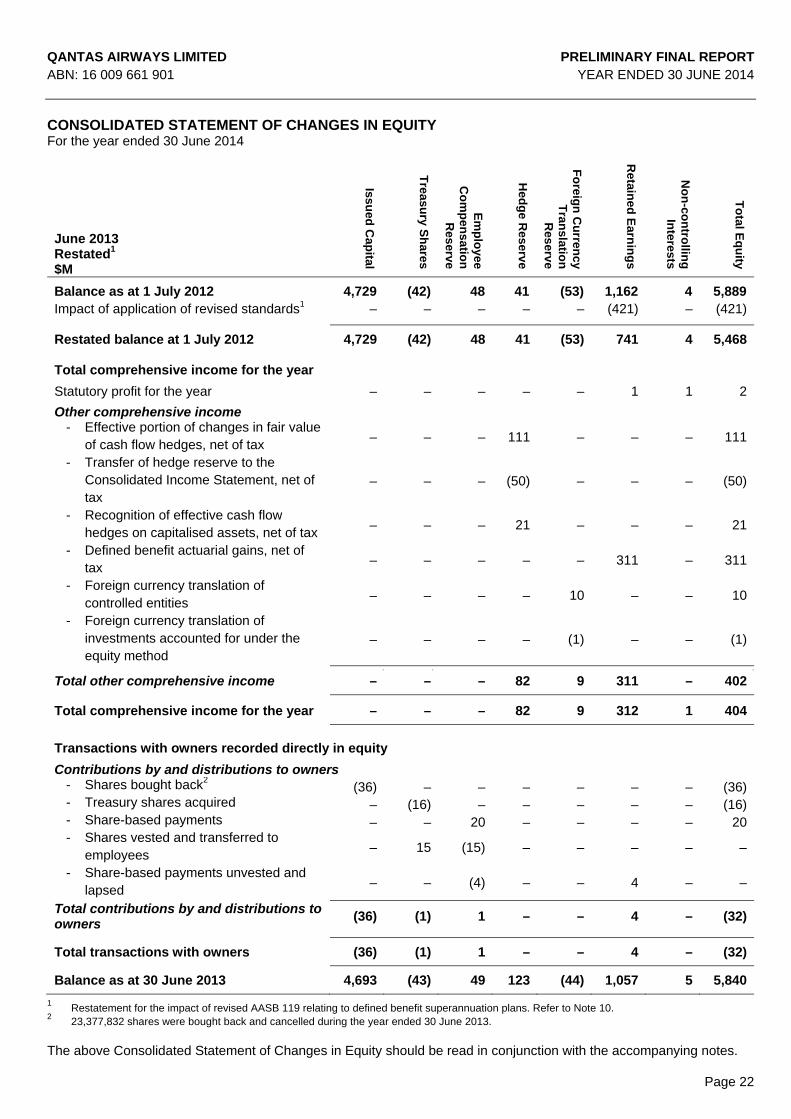
Balance as at 1 July 2012 4,729 (42) 48 41 (53) 1,162 4 5,889Impact of application of revised standards1 – – – – – (421) – (421)
Restated balance at 1 July 2012 4,729 (42) 48 41 (53) 741 4 5,468 Total comprehensive income for the year
Statutory profit for the year – – – – – 1 1 2
Other comprehensive income - Effective portion of changes in fair value
of cash flow hedges, net of tax – – – 111 – – – 111
- Transfer of hedge reserve to the Consolidated Income Statement, net of tax
– – – (50) – – – (50)
- Recognition of effective cash flow hedges on capitalised assets, net of tax
– – – 21 – – – 21
- Defined benefit actuarial gains, net of tax
– – – – – 311 – 311
- Foreign currency translation of controlled entities
– – – – 10 – – 10
- Foreign currency translation of investments accounted for under the equity method
– – – – (1) – – (1)
- - -
Total other comprehensive income – – – 82 9 311 – 402
Total comprehensive income for the year – – – 82 9 312 1 404
Transactions with owners recorded directly in equity
Contributions by and distributions to owners- Shares bought back2 (36) – – – – – – (36)- Treasury shares acquired – (16) – – – – – (16)- Share-based payments – – 20 – – – – 20- Shares vested and transferred to
employees – 15 (15) – – – – –
- Share-based payments unvested and lapsed
– – (4) – – 4 – –
Total contributions by and distributions to owners
(36) (1) 1 – – 4 – (32)
Total transactions with owners (36) (1) 1 – – 4 – (32)
Balance as at 30 June 2013 4,693 (43) 49 123 (44) 1,057 5 5,840
1 Restatement for the impact of revised AASB 119 relating to defined benefit superannuation plans. Refer to Note 10. 2 23,377,832 shares were bought back and cancelled during the year ended 30 June 2013. The above Consolidated Statement of Changes in Equity should be read in conjunction with the accompanying notes.
QANTAS AIRWAYS LIMITED PRELIMINARY FINAL REPORT ABN: 16 009 661 901 YEAR ENDED 30 JUNE 2014
Page 23
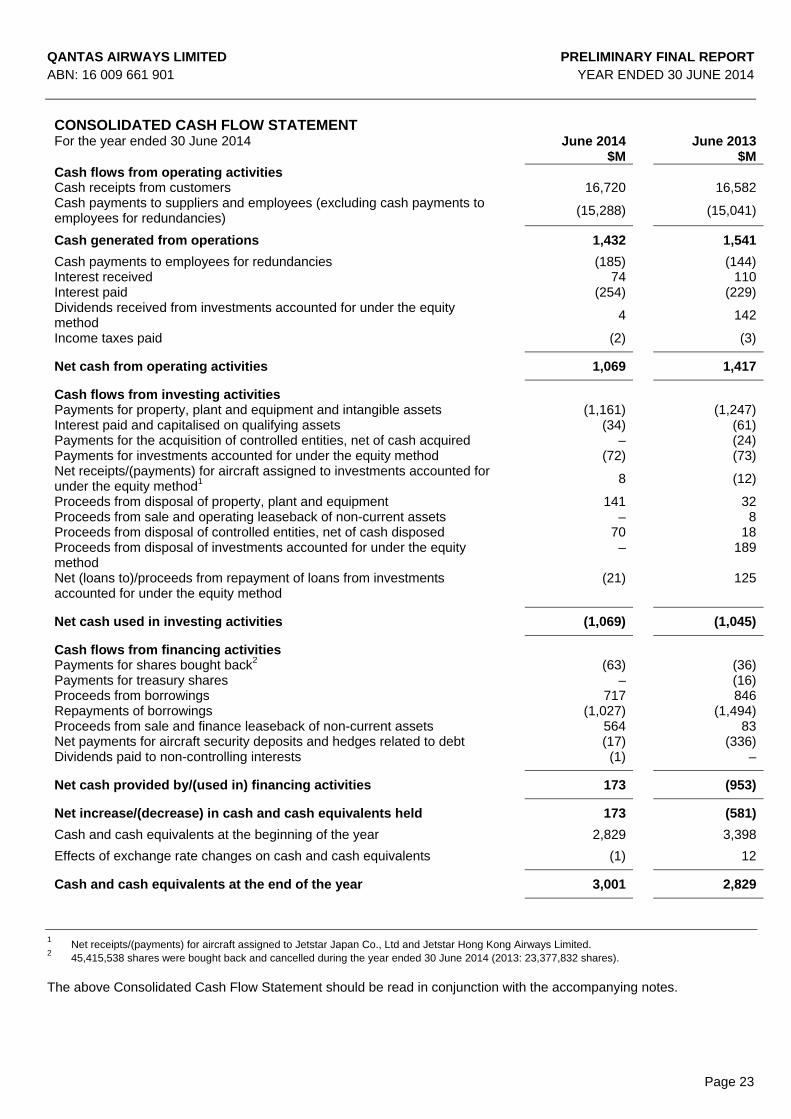
CONSOLIDATED CASH FLOW STATEMENT
For the year ended 30 June 2014 June 2014 June 2013 $M $MCash flows from operating activities Cash receipts from customers 16,720 16,582Cash payments to suppliers and employees (excluding cash payments to employees for redundancies)
(15,288) (15,041)
Cash generated from operations 1,432 1,541
Cash payments to employees for redundancies (185) (144)Interest received 74 110Interest paid (254) (229)Dividends received from investments accounted for under the equity method
4 142
Income taxes paid (2) (3)
Net cash from operating activities 1,069 1,417
Cash flows from investing activities Payments for property, plant and equipment and intangible assets (1,161) (1,247)Interest paid and capitalised on qualifying assets (34) (61)Payments for the acquisition of controlled entities, net of cash acquired – (24)Payments for investments accounted for under the equity method (72) (73)Net receipts/(payments) for aircraft assigned to investments accounted for under the equity method1
8 (12)
Proceeds from disposal of property, plant and equipment 141 32Proceeds from sale and operating leaseback of non-current assets – 8Proceeds from disposal of controlled entities, net of cash disposed 70 18Proceeds from disposal of investments accounted for under the equity method
– 189
Net (loans to)/proceeds from repayment of loans from investments accounted for under the equity method
(21) 125
Net cash used in investing activities (1,069) (1,045)
Cash flows from financing activities Payments for shares bought back2 (63) (36)Payments for treasury shares – (16) Proceeds from borrowings 717 846Repayments of borrowings (1,027) (1,494)Proceeds from sale and finance leaseback of non-current assets 564 83Net payments for aircraft security deposits and hedges related to debt (17) (336)Dividends paid to non-controlling interests (1) –
Net cash provided by/(used in) financing activities 173 (953)
Net increase/(decrease) in cash and cash equivalents held 173 (581)
Cash and cash equivalents at the beginning of the year 2,829 3,398
Effects of exchange rate changes on cash and cash equivalents (1) 12
Cash and cash equivalents at the end of the year 3,001 2,829
1 Net receipts/(payments) for aircraft assigned to Jetstar Japan Co., Ltd and Jetstar Hong Kong Airways Limited. 2 45,415,538 shares were bought back and cancelled during the year ended 30 June 2014 (2013: 23,377,832 shares). The above Consolidated Cash Flow Statement should be read in conjunction with the accompanying notes.

QANTAS AIRWAYS LIMITED PRELIMINARY FINAL REPORT ABN: 16 009 661 901 YEAR ENDED 30 JUNE 2014
Page 24
NOTES TO THE PRELIMINARY FINAL REPORT For the year ended 30 June 2014 Note 1. Statement of Significant Accounting Policies (a) Statement of Compliance The Preliminary Final Report (the Report) has been prepared in accordance with Australian Accounting Standards (AASBs) adopted by the Australian Accounting Standards Board and the Corporations Act 2001. The Annual Financial Report also complies with International Financial Reporting Standards (IFRSs) and interpretations adopted by the International Accounting Standards Board. The Report is presented in Australian dollars, which is the functional currency of Qantas Airways Limited (Qantas) and its controlled entities (the Qantas Group), and has been prepared on the basis of historical cost except in accordance with relevant accounting policies where assets and liabilities are stated at their fair values. The Annual Financial Report is in the process of being audited and is expected to be made available in September 2014. This Report should also be read in conjunction with any public announcements made by Qantas during the year in accordance with the continuous disclosure requirements arising under the Corporations Act 2001 and ASX Listing Rules. (b) Significant Accounting Policies Except as described below, the significant accounting policies applied by the Qantas Group in this Preliminary Final Report are the same as those applied by the Qantas Group in the Consolidated Annual Financial Report for the year ended 30 June 2013. The Group has mandatorily applied the following new Australian Accounting Standards and amendments to standards, including any consequential amendments to other standards, with a date of initial application of 1 July 2013.
- AASB 10 Consolidated Financial Statements - AASB 11 Joint Arrangements - AASB 13 Fair Value Measurement - AASB 119 Employee Benefits (2011)
The nature and the effect of the changes are explained in Note 10 - Application of New or Revised Accounting Standards (c) Comparatives
Where applicable, various comparative balances have been reclassified to align with current period presentation. A provision for long service leave which is expected to be settled beyond the next 12 months is measured as the present value of expected future payments to be made in respect of services provided by employees up to period end. Notwithstanding this pattern of expected future payments, for 30 June 2014, the provision is presented as a current liability in the Balance Sheet if the employees’ entitlements have vested (i.e. the employee has reached the minimum period of service required to become entitled to long service leave). For comparability, current provisions for 30 June 2013 and 30 June 2012 have been reclassified on a consistent basis resulting in an increase in current provisions of $277 million and $309 million, respectively with a corresponding decrease in non-current provisions. (d) Estimates The preparation of the Consolidated Financial Statements in conformity with AASBs requires management to make judgements, estimates and assumptions that affect the application of accounting policies and reported amounts of assets, liabilities, income and expenses. The estimates and associated assumptions are based on historical experience and various other factors that are believed to be reasonable under the circumstances, the results of which form the basis for making the judgements about carrying values of assets and liabilities that are not readily apparent from other sources. Actual results may differ from these estimates.
QANTAS AIRWAYS LIMITED PRELIMINARY FINAL REPORT ABN: 16 009 661 901 YEAR ENDED 30 JUNE 2014
Page 25
NOTES TO THE PRELIMINARY FINAL REPORT For the year ended 30 June 2014 Note 1. Statement of Significant Accounting Policies (continued) Estimates and underlying assumptions are reviewed on an ongoing basis. Revisions to accounting estimates are recognised in the period in which the estimate is revised and in any future periods affected. Judgements made by management in the application of AASBs that have a significant effect on the Consolidated Financial Statements and estimates with a significant risk of material adjustment in future periods are included in Note 3 – Impairment. (e) Carrying Amount of Non-Financial Assets (i) Cash generating units The carrying amounts of non-financial assets are reviewed at each balance date to determine whether there is any indication of impairment. If any such indication exists, the asset’s recoverable amount is estimated. For goodwill and intangible assets with indefinite lives, recoverable amounts are estimated at the end of each financial year. The recoverable amount of an asset is the greater of its fair value less costs to sell and its value in use. Assets which primarily generate cash flows as a group, such as aircraft, are assessed on a cash generating unit (CGU) basis, inclusive of related infrastructure and intangible assets and compared to net cash inflows for the CGU. Estimated net cash flows used in determining recoverable amount are discounted to their net present value using a pre-tax discount rate that reflects current market assessments of the time value of money and the risks specific to the assets. Identification of an asset’s CGU requires judgement, as it requires identification of the lowest aggregation of assets that generate largely independent cash inflows. As a result of the outcome of the Structural Review the Group’s identified CGUs has changed for the year ended 30 June 2014. In Management’s judgement, the lowest aggregation of assets, which give rise to CGUs as defined by AASB 136: Impairment of Assets are the Qantas Domestic CGU, Qantas International CGU, Qantas Loyalty CGU, Qantas Freight CGU and the Jetstar Group CGU. (ii) Assets held for sale Non-current assets, or disposal groups comprising assets and liabilities, that are expected to be recovered primarily through sale rather than through continued use are classified as held for sale. Immediately before classification as held for sale, the measurement of the assets or components of a disposal group is remeasured in accordance with the Qantas Group’s accounting policies. Thereafter, the assets, or disposal group, are measured at the lower of carrying amount and fair value less costs to sell. Any impairment loss on a disposal group is first allocated to goodwill and then to remaining assets and liabilities on a pro-rata basis except that no loss is allocated to inventories, financial assets or deferred tax asset. Impairment losses on initial classification as held for sale and subsequent gains or losses on remeasurement are recognised in the Consolidated Income Statement.
QANTAS AIRWAYS LIMITED PRELIMINARY FINAL REPORT ABN: 16 009 661 901 YEAR ENDED 30 JUNE 2014
Page 26
NOTES TO THE PRELIMINARY FINAL REPORT For the year ended 30 June 2014 Note 2. Underlying PBT and Operating Segments (a) Underlying PBT Underlying PBT is the primary reporting measure used by the Qantas Group’s chief operating decision-making bodies, being the Chief Executive Officer, Group Management Committee and the Board of Directors, for the purpose of assessing the performance of the Group. The primary reporting measure of the Qantas Domestic, Qantas International, Qantas Loyalty, Qantas Freight and Jetstar Group operating segments is Underlying EBIT. The primary reporting measure of the Corporate/Unallocated segment is Underlying PBT as net finance costs are managed centrally and are not allocated to Qantas Domestic, Qantas International, Qantas Loyalty, Qantas Freight and Jetstar Group operating segments. Refer to Note 2(d) for a Description of Underlying PBT and Reconciliation from Statutory PBT. (b) Operating Segments The Qantas Group comprises the following operating segments: Qantas Brands Qantas Domestic, Qantas International, Qantas Loyalty and Qantas Freight operating segments are collectively referred to as Qantas Brands. To drive business focus, assign accountability and monitor performance, the Qantas Brands operations are managed through four operating segments. In order to set targets and assess the performance, including accountability of the operating segments (as measured by Underlying EBIT), Qantas Domestic and Qantas International report depreciation expense for passenger aircraft and Qantas Freight reports depreciation expense for freighters.
- Qantas Domestic The Australian domestic passenger flying business of Qantas Brands.
- Qantas International The International passenger flying business of Qantas Brands.
- Qantas Loyalty Operates the Qantas customer loyalty program for Qantas Brands (Qantas Frequent Flyer) as well as other marketing services, loyalty and recognition programs.
- Qantas Freight The air cargo and express freight business of Qantas Brands.
Jetstar Group
The Jetstar Group comprises those operations of the Qantas Group which are dependent on the Jetstar fleet and the Jetstar Brand being the Jetstar passenger flying businesses (including Jetstar Group’s investments in Jetstar branded airlines in Asia).
Corporate/Unallocated
Costs associated with the centralised management and governance of the Qantas Group, together with certain items which are not allocated to business segments and other businesses of the Qantas Group which are not considered to be significant reportable segments are reported in the Corporate/Unallocated segment.
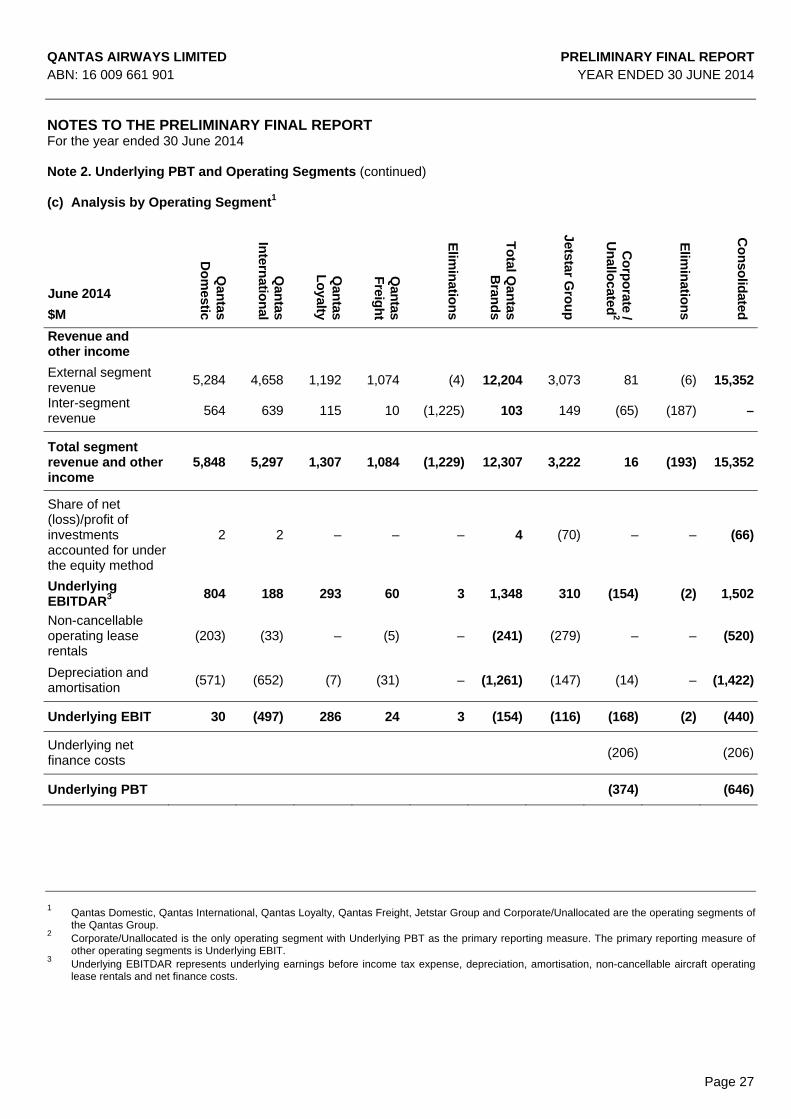
QANTAS AIRWAYS LIMITED PRELIMINARY FINAL REPORT ABN: 16 009 661 901 YEAR ENDED 30 JUNE 2014
Page 27
NOTES TO THE PRELIMINARY FINAL REPORT For the year ended 30 June 2014 Note 2. Underlying PBT and Operating Segments (continued) (c) Analysis by Operating Segment1
June 2014
$M
Qan
tas D
om
estic
Qan
tas In
ternatio
nal
Qan
tas L
oyalty
Qan
tas F
reigh
t
Elim
inatio
ns
To
tal Qan
tas B
rand
s
Jetstar Gro
up
Co
rpo
rate / U
nallo
cated2
Elim
inatio
ns
Co
nso
lidated
Revenue and other income
External segment revenue
5,284 4,658 1,192 1,074 (4) 12,204 3,073 81 (6) 15,352
Inter-segment revenue
564 639 115 10 (1,225) 103 149 (65) (187) –
Total segment revenue and other income
5,848 5,297 1,307 1,084 (1,229) 12,307 3,222 16 (193) 15,352
Share of net (loss)/profit of investments accounted for under the equity method
2 2 – – – 4 (70) – – (66)
Underlying EBITDAR3
804 188 293 60 3 1,348 310 (154) (2) 1,502
Non-cancellable operating lease rentals
(203) (33) – (5) – (241) (279) – – (520)
Depreciation and amortisation
(571) (652) (7) (31) – (1,261) (147) (14) – (1,422)
Underlying EBIT 30 (497) 286 24 3 (154) (116) (168) (2) (440)
Underlying net finance costs
(206) (206)
Underlying PBT (374) (646)
1 Qantas Domestic, Qantas International, Qantas Loyalty, Qantas Freight, Jetstar Group and Corporate/Unallocated are the operating segments of the Qantas Group.
2 Corporate/Unallocated is the only operating segment with Underlying PBT as the primary reporting measure. The primary reporting measure of other operating segments is Underlying EBIT.
3 Underlying EBITDAR represents underlying earnings before income tax expense, depreciation, amortisation, non-cancellable aircraft operating lease rentals and net finance costs.

QANTAS AIRWAYS LIMITED PRELIMINARY FINAL REPORT ABN: 16 009 661 901 YEAR ENDED 30 JUNE 2014
Page 28
NOTES TO THE PRELIMINARY FINAL REPORT For the year ended 30 June 2014 Note 2. Underlying PBT and Operating Segments (continued) (c) Analysis by Operating Segment1 (continued)
June 2013
Restated2
$M
Qan
tas D
om
estic
Qan
tas In
ternatio
nal
Qan
tas L
oyalty
Qan
tas Freig
ht
Elim
inatio
ns
To
tal Qan
tas B
rand
s
Jetstar Gro
up
Co
rpo
rate / U
nallo
cated6
Elim
inatio
ns
Co
nso
lidated
Revenue and other income
External segment revenue3,4
5,731 4,821 1,096 1,048 9 12,705 3,129 71 (3) 15,902
Inter-segment revenue 487 675 109 8 (1,167) 112 159 (70) (201) –
Total segment revenue and other income
6,218 5,496 1,205 1,056 (1,158) 12,817 3,288 1 (204) 15,902
Share of net (loss)/profit of investments accounted for under the equity method5
5 4 – 2 – 11 (50) – – (39)
Underlying EBITDAR7 1,147 495 263 66 3 1,974 543 (177) 1 2,341
Non-cancellable operating lease rentals
(163) (68) – (5) – (236) (289) – – (525)
Depreciation and amortisation
(619) (673) (3) (25) – (1,320) (116) (14) – (1,450)
Underlying EBIT 365 (246) 260 36 3 418 138 (191) 1 366
Underlying net finance costs
(180) (180)
Underlying PBT (371) 186
1 Qantas Domestic, Qantas International, Qantas Loyalty, Qantas Freight, Jetstar Group and Corporate/Unallocated are the operating segments of
the Qantas Group. 2 Restatement for the impact of revised AASB 119 relating to defined benefit superannuation plans. Refer to Note 10. 3 External segment revenue includes the impact of the change in accounting estimates – passenger revenue of $134 million (Qantas Domestic
$80 million and Qantas International $54 million). 4 Includes settlement income of $125 million following the restructure of the Boeing 787 aircraft delivery schedule (reported equally across Qantas
Domestic, Qantas International and Jetstar Group). 5 Share of net profit of investments accounted for under the equity method as reported by Qantas Domestic and Qantas International, before
rounding is $4.5 million and $4.5 million, respectively. 6 Corporate/Unallocated is the only operating segment with Underlying PBT as the primary reporting measure. The primary reporting measure of
other segments is Underlying EBIT. 7 Underlying EBITDAR represents Underlying earnings before income tax expense, depreciation, amortisation, non-cancellable aircraft operating
lease rentals and net finance costs.
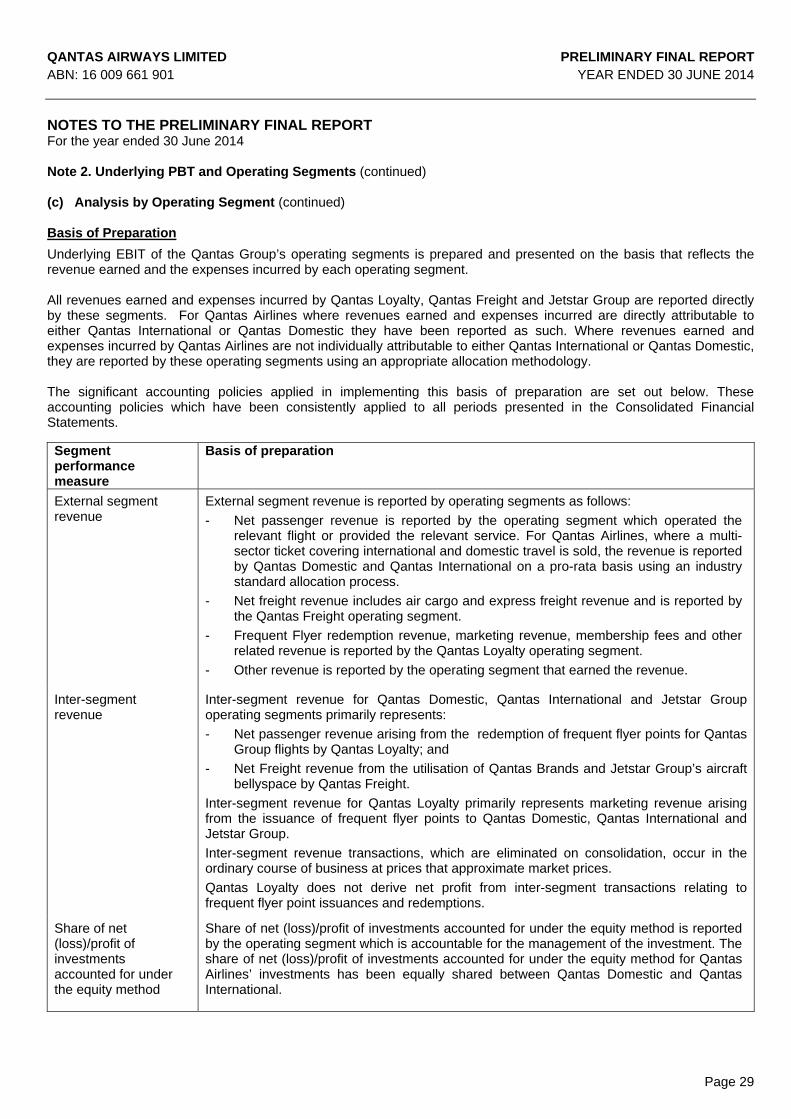
QANTAS AIRWAYS LIMITED PRELIMINARY FINAL REPORT ABN: 16 009 661 901 YEAR ENDED 30 JUNE 2014
Page 29
NOTES TO THE PRELIMINARY FINAL REPORT For the year ended 30 June 2014 Note 2. Underlying PBT and Operating Segments (continued) (c) Analysis by Operating Segment (continued) Basis of Preparation
Underlying EBIT of the Qantas Group’s operating segments is prepared and presented on the basis that reflects the revenue earned and the expenses incurred by each operating segment. All revenues earned and expenses incurred by Qantas Loyalty, Qantas Freight and Jetstar Group are reported directly by these segments. For Qantas Airlines where revenues earned and expenses incurred are directly attributable to either Qantas International or Qantas Domestic they have been reported as such. Where revenues earned and expenses incurred by Qantas Airlines are not individually attributable to either Qantas International or Qantas Domestic, they are reported by these operating segments using an appropriate allocation methodology. The significant accounting policies applied in implementing this basis of preparation are set out below. These accounting policies which have been consistently applied to all periods presented in the Consolidated Financial Statements.
Segment performance measure
Basis of preparation
External segment revenue
External segment revenue is reported by operating segments as follows:
- Net passenger revenue is reported by the operating segment which operated the relevant flight or provided the relevant service. For Qantas Airlines, where a multi-sector ticket covering international and domestic travel is sold, the revenue is reported by Qantas Domestic and Qantas International on a pro-rata basis using an industry standard allocation process.
- Net freight revenue includes air cargo and express freight revenue and is reported by the Qantas Freight operating segment.
- Frequent Flyer redemption revenue, marketing revenue, membership fees and other related revenue is reported by the Qantas Loyalty operating segment.
- Other revenue is reported by the operating segment that earned the revenue.
Inter-segment revenue
Inter-segment revenue for Qantas Domestic, Qantas International and Jetstar Group operating segments primarily represents:
- Net passenger revenue arising from the redemption of frequent flyer points for Qantas Group flights by Qantas Loyalty; and
- Net Freight revenue from the utilisation of Qantas Brands and Jetstar Group’s aircraft bellyspace by Qantas Freight.
Inter-segment revenue for Qantas Loyalty primarily represents marketing revenue arising from the issuance of frequent flyer points to Qantas Domestic, Qantas International and Jetstar Group.
Inter-segment revenue transactions, which are eliminated on consolidation, occur in the ordinary course of business at prices that approximate market prices.
Qantas Loyalty does not derive net profit from inter-segment transactions relating to frequent flyer point issuances and redemptions.
Share of net (loss)/profit of investments accounted for under the equity method
Share of net (loss)/profit of investments accounted for under the equity method is reported by the operating segment which is accountable for the management of the investment. The share of net (loss)/profit of investments accounted for under the equity method for Qantas Airlines’ investments has been equally shared between Qantas Domestic and Qantas International.

QANTAS AIRWAYS LIMITED PRELIMINARY FINAL REPORT ABN: 16 009 661 901 YEAR ENDED 30 JUNE 2014
Page 30
NOTES TO THE PRELIMINARY FINAL REPORT For the year ended 30 June 2014 Note 2. Underlying PBT and Operating Segments (continued) (c) Analysis by Operating Segment (continued) Segment performance measure
Basis of preparation
Underlying EBITDAR
The significant expenses impacting Underlying EBITDAR are as follows:
- Manpower and staff related costs are reported by the operating segment that utilises the manpower. Where manpower supports both Qantas Domestic and Qantas International, costs are reported by Qantas Domestic and Qantas International using an appropriate allocation methodology.
- Fuel expenditure is reported by the segment that consumes the fuel in its operations.
- Aircraft operating variable costs are reported by the segment that incurs these costs.
- All other expenditure is reported by the operating segment to which they are directly attributable or in the case of Qantas Airlines between Qantas Domestic and Qantas International using an appropriate allocation methodology. To apply this accounting policy, where necessary expenditure is recharged between operating segments as a cost recovery.
Depreciation and amortisation
Qantas Domestic, Qantas International and Jetstar Group report depreciation expense for passenger aircraft owned by the Qantas Group and flown by the segment.
Qantas Freight reports depreciation expense for freight aircraft owned by the Qantas Group.
Other depreciation and amortisation is reported by the segment that uses the related asset.
Non-cancellable aircraft operating lease rentals
Qantas Domestic, Qantas International and Jetstar Group report non-cancellable aircraft operating lease rentals for passenger aircraft externally leased by the Qantas Group and flown by the segment.
Qantas Freight reports non-cancellable aircraft operating lease rentals for freighter aircraft externally leased by the Qantas Group.
(d) Description of Underlying PBT and Reconciliation from Statutory (Loss)/Profit Before Tax Underlying PBT is a non-statutory measure, and is the primary reporting measure used by the Qantas Group’s chief operating decision-making bodies, being the Chief Executive Officer, Group Management Committee and the Board of Directors. The objective of measuring and reporting Underlying PBT is to provide a meaningful and consistent representation of the underlying performance of each operating segment and the Qantas Group. Underlying PBT is derived by adjusting statutory (loss)/profit before tax for the impacts of AASB 139: Financial Instruments: Recognition and Measurement (AASB 139) which relate to other reporting periods and identifying certain other items which are not included in Underlying PBT. (i) Adjusting for impacts of AASB 139 which relate to other reporting periods All derivative transactions undertaken by the Qantas Group represent economic hedges of underlying risk and exposures. The Qantas Group does not enter into speculative derivative transactions. Notwithstanding this, AASB 139 requires certain mark-to-market movements in derivatives which are classified as “ineffective” to be recognised immediately in the Consolidated Income Statement. The recognition of derivative valuation movements in reporting periods which differ from the designated transaction causes volatility in statutory profit that does not reflect the hedging nature of these derivatives.

QANTAS AIRWAYS LIMITED PRELIMINARY FINAL REPORT ABN: 16 009 661 901 YEAR ENDED 30 JUNE 2014
Page 31
NOTES TO THE PRELIMINARY FINAL REPORT For the year ended 30 June 2014 Note 2. Underlying PBT and Operating Segments (continued) (d) Description of Underlying PBT and Reconciliation from Statutory (Loss)/Profit Before Tax (continued) Underlying PBT reports all hedge derivative gains and losses in the same reporting period as the underlying transaction by adjusting the reporting period’s statutory profit for derivative mark-to-market movements that relate to underlying exposures in other reporting periods. This adjustment is calculated as follows: - Derivative mark-to-market movements recognised in the current reporting period’s statutory profit that are
associated with current period exposures remain included in Underlying PBT - Derivative mark-to-market movements recognised in the current reporting period’s statutory profit that are
associated with underlying exposures which will occur in future reporting periods are excluded from Underlying PBT - Derivative mark-to-market movements recognised in the current reporting period’s statutory profit that are
associated with capital expenditure are excluded from Underlying PBT and subsequently included in Underlying PBT as an implied adjustment to depreciation expense for the related assets commencing when the assets are available for use
- Derivative mark-to-market movements recognised in previous reporting period’s statutory profit that are associated with underlying exposures which occurred in the current period are included in Underlying PBT
- Ineffectiveness and non-designated derivatives relating to other reporting periods affecting net finance costs are excluded from Underlying PBT
All derivative mark-to-market movements which have been excluded from Underlying PBT will be recognised through Underlying PBT in future periods when the underlying transaction occurs. (ii) Other items not included in Underlying PBT
Items which are identified by Management and reported to the chief operating decision-making bodies as not representing the underlying performance of the business are not included in Underlying PBT. The determination of these items is made after consideration of their nature and materiality and is applied consistently from period to period.
Items not included in Underlying PBT primarily result from revenues or expenses relating to business activities in other reporting periods, major transformational/restructuring initiatives, transactions involving investments and impairments of specific assets or CGUs outside the ordinary course of business. (iii) Underlying EBIT Underlying EBIT is calculated using a consistent methodology as outlined above but excluding the impact of statutory net finance costs and ineffective and non-designated derivatives relating to other reporting periods affecting net finance costs.
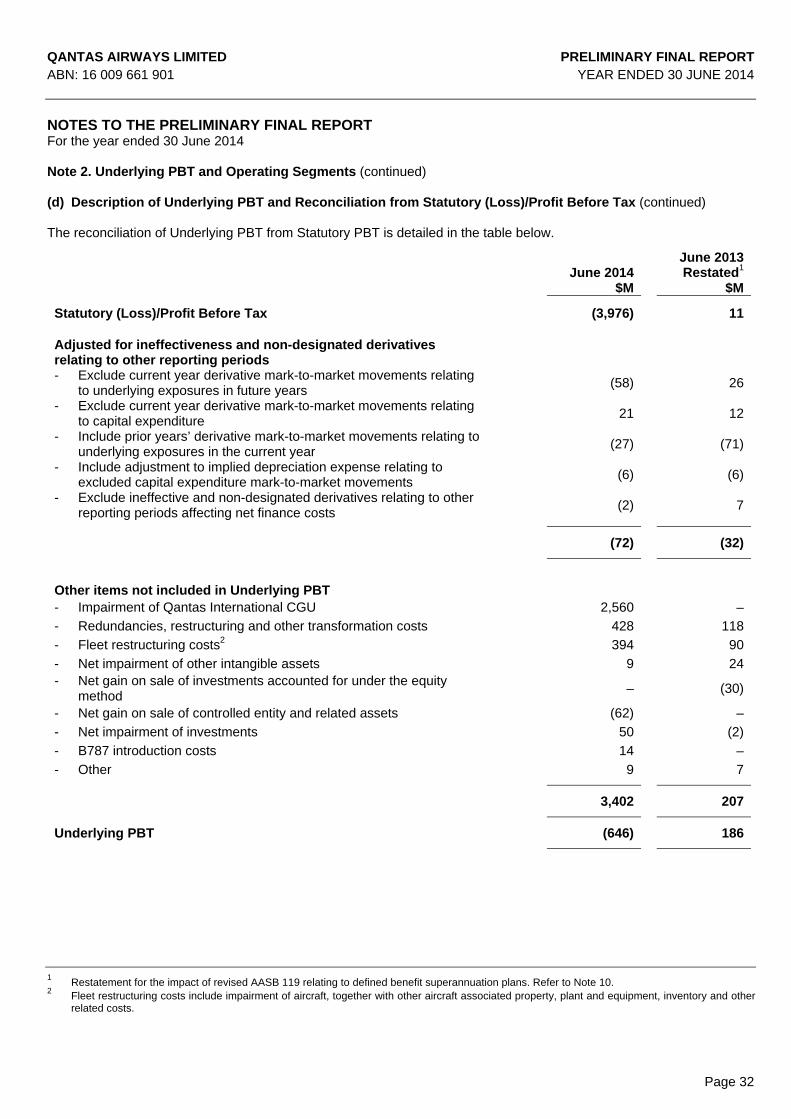
QANTAS AIRWAYS LIMITED PRELIMINARY FINAL REPORT ABN: 16 009 661 901 YEAR ENDED 30 JUNE 2014
Page 32
NOTES TO THE PRELIMINARY FINAL REPORT For the year ended 30 June 2014 Note 2. Underlying PBT and Operating Segments (continued) (d) Description of Underlying PBT and Reconciliation from Statutory (Loss)/Profit Before Tax (continued) The reconciliation of Underlying PBT from Statutory PBT is detailed in the table below.
June 2014 June 2013
Restated1
$M $M
Statutory (Loss)/Profit Before Tax (3,976) 11
Adjusted for ineffectiveness and non-designated derivatives relating to other reporting periods - Exclude current year derivative mark-to-market movements relating
to underlying exposures in future years
(58) 26
- Exclude current year derivative mark-to-market movements relating to capital expenditure
21 12
- Include prior years’ derivative mark-to-market movements relating to underlying exposures in the current year
(27) (71)
- Include adjustment to implied depreciation expense relating to excluded capital expenditure mark-to-market movements
(6) (6)
- Exclude ineffective and non-designated derivatives relating to other reporting periods affecting net finance costs
(2) 7
(72) (32)
Other items not included in Underlying PBT - Impairment of Qantas International CGU 2,560 –
- Redundancies, restructuring and other transformation costs 428 118
- Fleet restructuring costs2 394 90
- Net impairment of other intangible assets 9 24- Net gain on sale of investments accounted for under the equity
method
– (30)
- Net gain on sale of controlled entity and related assets (62) –
- Net impairment of investments 50 (2)
- B787 introduction costs 14 –
- Other 9 7
3,402 207
Underlying PBT
(646) 186
1 Restatement for the impact of revised AASB 119 relating to defined benefit superannuation plans. Refer to Note 10. 2 Fleet restructuring costs include impairment of aircraft, together with other aircraft associated property, plant and equipment, inventory and other
related costs.
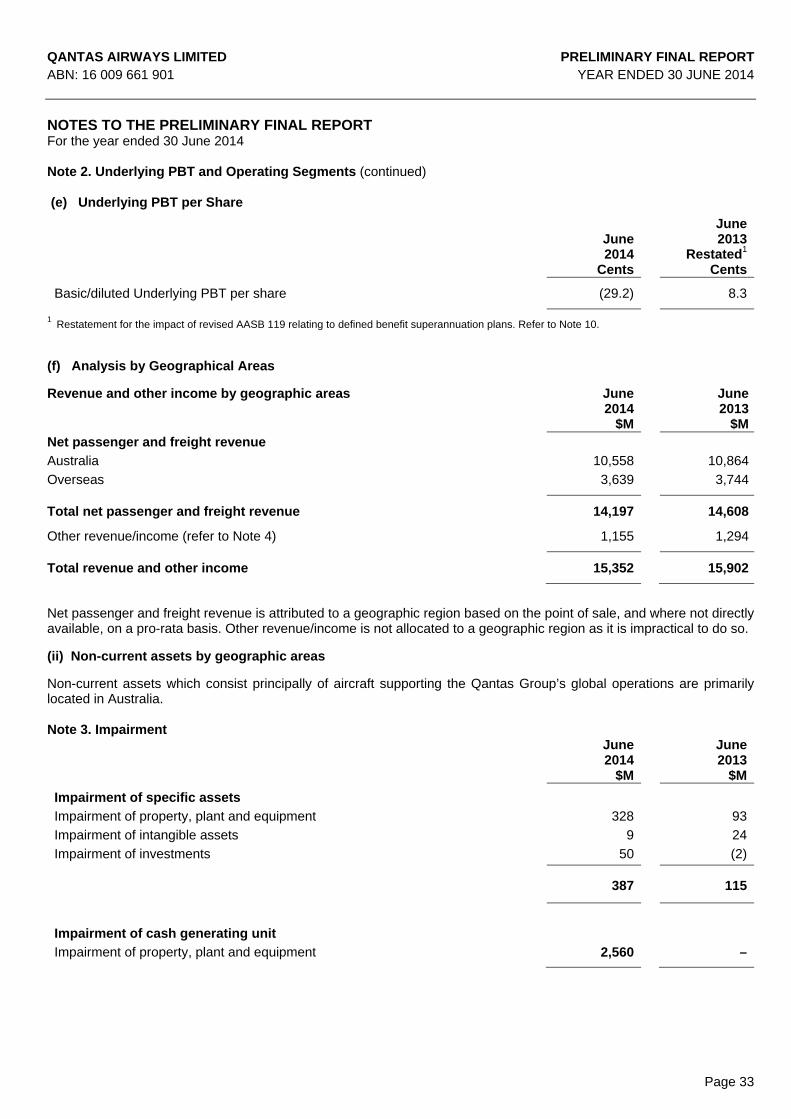
QANTAS AIRWAYS LIMITED PRELIMINARY FINAL REPORT ABN: 16 009 661 901 YEAR ENDED 30 JUNE 2014
Page 33
NOTES TO THE PRELIMINARY FINAL REPORT For the year ended 30 June 2014 Note 2. Underlying PBT and Operating Segments (continued) (e) Underlying PBT per Share
June 2014
June2013
Restated1
Cents Cents
Basic/diluted Underlying PBT per share (29.2) 8.3
1 Restatement for the impact of revised AASB 119 relating to defined benefit superannuation plans. Refer to Note 10.
(f) Analysis by Geographical Areas Revenue and other income by geographic areas June
2014 June 2013
$M $MNet passenger and freight revenue
Australia 10,558 10,864
Overseas 3,639 3,744
Total net passenger and freight revenue 14,197 14,608
Other revenue/income (refer to Note 4) 1,155 1,294
Total revenue and other income 15,352 15,902
Net passenger and freight revenue is attributed to a geographic region based on the point of sale, and where not directly available, on a pro-rata basis. Other revenue/income is not allocated to a geographic region as it is impractical to do so.
(ii) Non-current assets by geographic areas
Non-current assets which consist principally of aircraft supporting the Qantas Group’s global operations are primarily located in Australia. Note 3. Impairment June
2014 June
2013 $M $M
Impairment of specific assets
Impairment of property, plant and equipment 328 93
Impairment of intangible assets 9 24
Impairment of investments 50 (2)
387 115
Impairment of cash generating unit
Impairment of property, plant and equipment 2,560 –

QANTAS AIRWAYS LIMITED PRELIMINARY FINAL REPORT ABN: 16 009 661 901 YEAR ENDED 30 JUNE 2014
Page 34
NOTES TO THE PRELIMINARY FINAL REPORT For the year ended 30 June 2014 Note 3. Impairment (continued) Impairment of specific assets
As part of the Accelerated Qantas Transformation program, the Group has performed a detailed review of its fleet and network including accelerating the retirement of legacy fleet. This Program has resulted in specific impairments relating to property, plant and equipment being classified as held for sale and impaired to their fair value less costs to sell. These impairments primarily relate to accelerated retirement of the non-reconfigured B747-400, B767-300 and B737-400 fleet and other property, plant and equipment associated with these fleet types.
Impairment of Cash Generating Units (CGUs) Identification of an asset’s Cash Generating Unit (CGU) involves judgement based on how Management monitors the Qantas Group’s operations and how decisions to acquire and dispose of the Qantas Group’s assets and operations are made. Management have previously identified the lowest identifiable group of assets that generates largely independent cash inflows being the Qantas Brands CGU and the Jetstar Group CGU. At the Board meeting on 28 August 2014, the Group concluded its Structural Review, the commencement of which was announced on 5 December 2013 and was ongoing as at 30 June 2014. As a result of the Board’s decision to create a new holding structure and corporate entity for Qantas International to increase the potential for future external investment and create long-term options for Qantas International to participate in partnership and consolidation opportunities, the Qantas Brands CGU is required to be separated into individual CGUs for Qantas International, Qantas Domestic, Qantas Freight and Qantas Loyalty for the purpose of assessing the carrying value of the Group’s assets. This constitutes an adjusting subsequent event. The recoverable amounts of CGUs were determined based on their value in use. While there are significant surpluses in Qantas Loyalty, Qantas Domestic and Qantas Freight CGUs, impairment of $2,560 million arose in the stand-alone Qantas International CGU in respect of aircraft and engines. In allocating the impairment to individual aircraft assets their recoverable amount was not reduced below their fair value less costs to sell. The size of the impairment loss recognised is largely the result of wide body aircraft being purchased through a period where the Australian dollar was significantly weaker against the US dollar compared to recent years. The value in use was determined by discounting the future cash flows forecast to be generated from the continuing use of the units and were based on the following assumptions:
Assumption How determined Cash Flows
Cash flows were projected based on the Financial Plan covering a three-year period. Cash flows to determine a terminal value were extrapolated using a constant growth rate of 2.5 per cent per annum, which does not exceed the long-term average growth rate for the industry.
Cash outflows include capital expenditure for the purchase of aircraft and other property, plant and equipment. These do not include capital expenditure that enhances the current performance of assets and related cash flows have been treated consistently.
Discount Rate
A pre-tax discount rate of 10.5 per cent per annum has been used in discounting the projected cash flows of the CGUs, reflecting a market estimate of the weighted average cost of capital of the Qantas Group (2013: 10.5 per cent per annum). The discount rates are based on the risk-free rate for the ten-year Australian Government Bonds adjusted for a risk premium to reflect both the increased risk of investing in equities and the risk of the specific CGU.
Fuel
The fuel into-plane price is assumed to be US$128 per barrel (2013: US$127) and was set with regard to the forward fuel curve and commodity analyst expectations.
Currency
The US$:A$ exchange rate is assumed to be $0.92 (2013: $0.96).
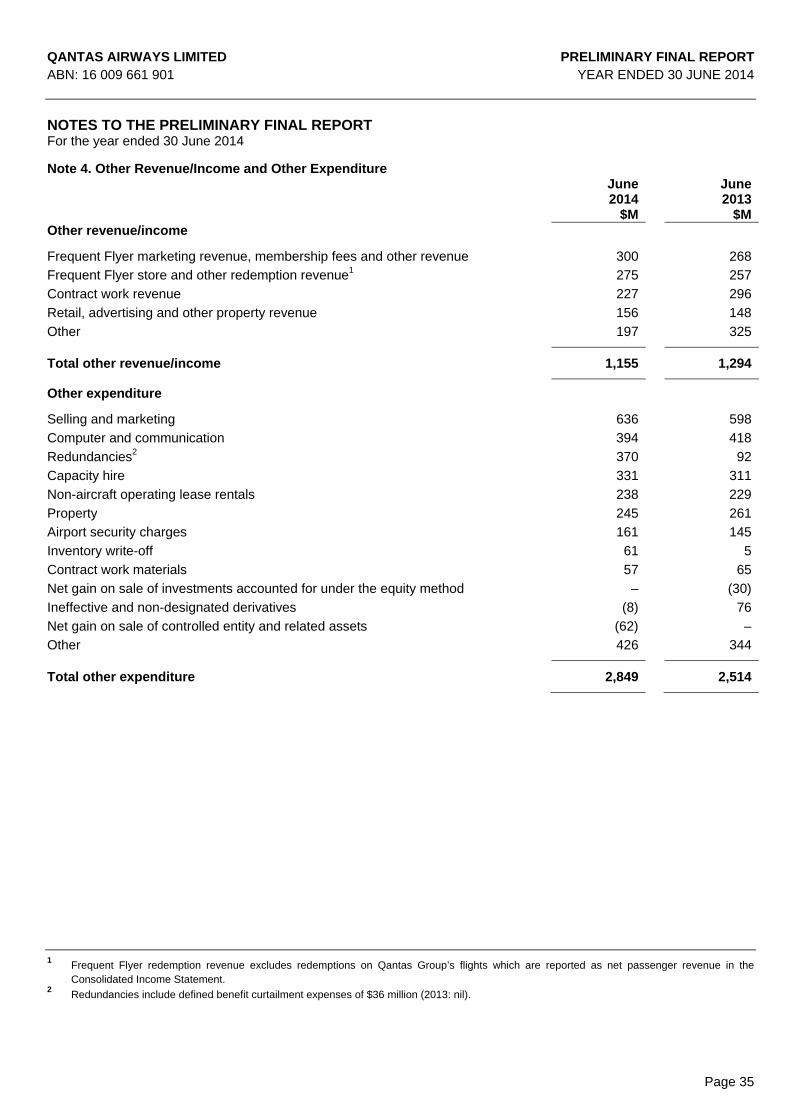
QANTAS AIRWAYS LIMITED PRELIMINARY FINAL REPORT ABN: 16 009 661 901 YEAR ENDED 30 JUNE 2014
Page 35
NOTES TO THE PRELIMINARY FINAL REPORT For the year ended 30 June 2014 Note 4. Other Revenue/Income and Other Expenditure
June 2014
June 2013
$M $MOther revenue/income
Frequent Flyer marketing revenue, membership fees and other revenue 300 268
Frequent Flyer store and other redemption revenue1 275 257
Contract work revenue 227 296
Retail, advertising and other property revenue 156 148
Other 197 325
Total other revenue/income 1,155 1,294
Other expenditure
Selling and marketing 636 598
Computer and communication 394 418
Redundancies2 370 92
Capacity hire 331 311
Non-aircraft operating lease rentals 238 229
Property 245 261
Airport security charges 161 145
Inventory write-off 61 5
Contract work materials 57 65
Net gain on sale of investments accounted for under the equity method – (30)
Ineffective and non-designated derivatives (8) 76
Net gain on sale of controlled entity and related assets (62) –
Other 426 344
Total other expenditure 2,849 2,514
1 Frequent Flyer redemption revenue excludes redemptions on Qantas Group’s flights which are reported as net passenger revenue in the
Consolidated Income Statement. 2 Redundancies include defined benefit curtailment expenses of $36 million (2013: nil).
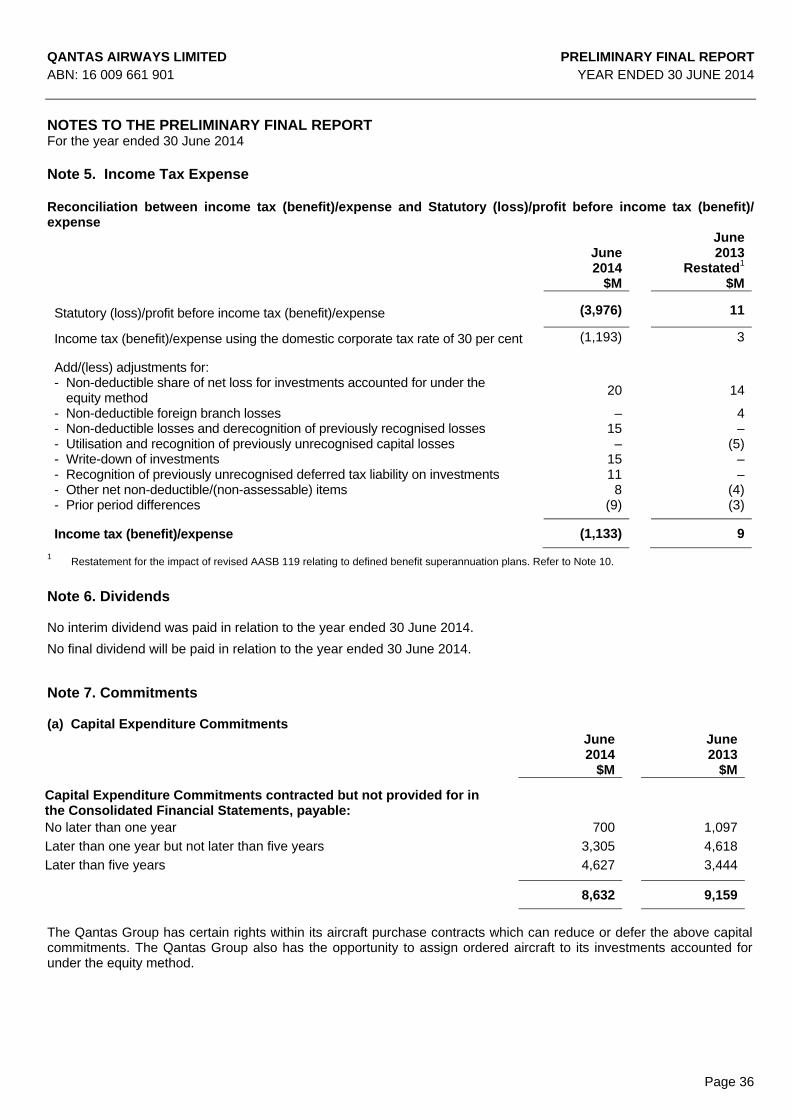
QANTAS AIRWAYS LIMITED PRELIMINARY FINAL REPORT ABN: 16 009 661 901 YEAR ENDED 30 JUNE 2014
Page 36
NOTES TO THE PRELIMINARY FINAL REPORT For the year ended 30 June 2014 Note 5. Income Tax Expense Reconciliation between income tax (benefit)/expense and Statutory (loss)/profit before income tax (benefit)/ expense
June 2014
June2013
Restated1
$M $M
Statutory (loss)/profit before income tax (benefit)/expense (3,976) 11
Income tax (benefit)/expense using the domestic corporate tax rate of 30 per cent (1,193) 3
Add/(less) adjustments for: - Non-deductible share of net loss for investments accounted for under the
equity method
20 14
- Non-deductible foreign branch losses – 4- Non-deductible losses and derecognition of previously recognised losses 15 –- Utilisation and recognition of previously unrecognised capital losses – (5)- Write-down of investments 15 –- Recognition of previously unrecognised deferred tax liability on investments 11 –- Other net non-deductible/(non-assessable) items 8 (4)- Prior period differences (9) (3)
Income tax (benefit)/expense (1,133) 9
1 Restatement for the impact of revised AASB 119 relating to defined benefit superannuation plans. Refer to Note 10.
Note 6. Dividends No interim dividend was paid in relation to the year ended 30 June 2014.
No final dividend will be paid in relation to the year ended 30 June 2014. Note 7. Commitments (a) Capital Expenditure Commitments
June 2014
$M
June 2013
$M
Capital Expenditure Commitments contracted but not provided for in the Consolidated Financial Statements, payable:
No later than one year 700 1,097
Later than one year but not later than five years 3,305 4,618
Later than five years 4,627 3,444
8,632 9,159
The Qantas Group has certain rights within its aircraft purchase contracts which can reduce or defer the above capital commitments. The Qantas Group also has the opportunity to assign ordered aircraft to its investments accounted for under the equity method.

QANTAS AIRWAYS LIMITED PRELIMINARY FINAL REPORT ABN: 16 009 661 901 YEAR ENDED 30 JUNE 2014
Page 37
NOTES TO THE PRELIMINARY FINAL REPORT For the year ended 30 June 2014 Note 7. Commitments (continued) (b) Operating Lease Commitments as Lessee
June 2014
$M
June 2013
$M
Non-cancellable operating lease commitments not provided for in the Consolidated Financial Statements
Aircraft and engines – payable:
No later than one year 456 505 Later than one year but not later than five years 930 1,250 Later than five years 140 227
1,526 1,982
Non-aircraft – payable:
No later than one year 200 195 Later than one year but not later than five years 598 577 Later than five years but not later than 10 years 246 285 Later than 10 years 259 249 Less: Provision for potential under-recovery of rentals on unused premises available for sub-lease (included in onerous contract provision)
(4) (4)
1,299 1,302
2,825 3,284
Note 8. Interest-bearing Liabilities
June
2014
June2013
$M $M
Current Bank loans – secured 459 545
Bank loans – unsecured 450 –
Other loans – unsecured 69 47
Lease and hire purchase liabilities – secured 232 243
1,210 835
Non-current Bank loans – secured 2,313 2,740
Bank loans – unsecured 546 992
Other loans – unsecured 1,336 880
Lease and hire purchase liabilities – secured 1,078 633
5,273 5,245
During the year there were non-cash financing activities of $130 million (June 2013: $115 million).

QANTAS AIRWAYS LIMITED PRELIMINARY FINAL REPORT ABN: 16 009 661 901 YEAR ENDED 30 JUNE 2014
Page 38
NOTES TO THE PRELIMINARY FINAL REPORT For the year ended 30 June 2014 Note 9. Entities over which control was gained or lost during the year On 28 February 2014, Qantas sold its wholly owned subsidiary Qantas Defence Services Pty Limited (QDS) and related assets to Northrop Grumman Australia, part of global aviation firm Northrop Grumman Corporation. The Group received cash of $80 million and recognised a gain on sale of $62 million during the year ended 30 June 2014 for the business and other related assets. Note 10. Application of New or Revised Accounting Standards The nature and the effect of changes from new standards and amendments identified in Note 1(b) are explained below. AASB 10 - Consolidated Financial Statements AASB 10 introduced a new control model that is applicable to all investees, by focusing on whether the Group has power over an investee, exposure or rights to variable returns from its involvement with the investee and ability to use its power to affect those returns. The application of AASB 10 had no impact on the Qantas Group. AASB 11 - Joint Arrangements Under AASB 11, the classification as either joint operations or joint ventures depends on the rights to the assets and obligations for the liabilities of the arrangements. When making this assessment, the Group considered the structure of the arrangements, the legal form of any separate vehicles, the contractual terms of the arrangement and other facts and circumstances. The application of AASB 11 had no impact on the Qantas Group. AASB 13 - Fair Value Measurement AASB 13 establishes a single framework for measuring fair value and making disclosures about fair value measurements, when such measurements are required or permitted by other AASBs. In particular, it unifies the definition of fair value as the price at which an orderly transaction to sell an asset or to transfer a liability would take place between market participants at the measurement date. It also replaces and expands the disclosure requirements about fair value measurements in other AASBs, including AASB 7 Financial Instruments: Disclosures. The application of AASB 13 has no significant impact on the measurements of the Group’s carrying value of assets and liabilities. AASB 119 - Employee Benefits (2011) As a result of the mandatory application of AASB 119 (2011), the Group has changed its accounting policy with respect to the basis of accounting for defined benefit superannuation plans.
The revised standard eliminated the use of the ‘corridor approach’ and instead mandates immediate recognition of all re-measurements of a defined benefit liability and defined benefit assets (including actuarial gains or losses) in other comprehensive income. In addition, it changes the measurement principles for the expected return on planned assets and the basis for determining the income or expense relating to defined benefits.
The Qantas Group’s previous accounting policy for defined benefit superannuation plans utilised the ‘corridor approach’ to account for actuarial gains/losses. Under that policy, accumulated actuarial gains/losses were carried off-balance sheet unless they exceeded 10 per cent of the defined benefit assets or obligations in which case they were recognised through the income statement over the average life of the plan.
Under the revised AASB 119 (2011), these accumulated actuarial gains or losses are recognised on-balance sheet. Subsequent actuarial gains or losses are recognised on-balance sheet through other comprehensive income.
Upon application of the amended AASB 119 (2011), the Group has applied the transition provisions in the Standard requiring retrospective application and as a result the following have been restated:
- Consolidated Balance Sheet as at 30 June 2012 (Condensed Opening Balance Sheet); - Consolidated Balance Sheet as at 30 June 2013 (Condensed Comparative Balance Sheet); - Consolidated Income Statement (Condensed) for the year ended 30 June 2013; and - Consolidated Statement of Comprehensive Income (Condensed) for the year ended 30 June 2013.
For the restated Comparative Results refer to Note 10A - Restatement of Comparative Results.

QANTAS AIRWAYS LIMITED PRELIMINARY FINAL REPORT ABN: 16 009 661 901 YEAR ENDED 30 JUNE 2014
Page 39
NOTES TO THE PRELIMINARY FINAL REPORT For the year ended 30 June 2014
Note 10. Application of New or Revised Accounting Standards (continued)
The impact of the revised standard on the Consolidated Income Statement and Consolidated Statement of Comprehensive Income for the year ended 30 June 2014 have been presented in Note 10B - Impact of Revised Standard on the Current Reporting Period’s Results.
A. Restatement of Comparative Results
(i) Restatement of Consolidated Balance Sheet as at 30 June 2012 (Condensed Opening Balance Sheet)
30 June 2012 (as previously
reported) 1 $M
AASB 119 Employee
Benefits $M
30 June 2012 (Restated)
$MCurrent assets Cash and cash equivalents 3,398 – 3,398Receivables 1,111 – 1,111Other financial assets 88 – 88Inventories 376 – 376Assets classified as held for sale 73 – 73Other 414 (293) 121Non-current assets Receivables 472 – 472Other financial assets 17 – 17Investments accounted for under the equity method 457 – 457Property, plant and equipment 14,139 – 14,139Intangible assets 610 – 610Other 23 – 23
Total assets 21,178 (293) 20,885
Current liabilities Payables 1,865 – 1,865Revenue received in advance 3,183 – 3,183Interest-bearing liabilities 1,119 – 1,119Other financial liabilities 369 – 369Provisions 879 – 879Liabilities classified as held for sale 12 – 12Non-current liabilities Revenue received in advance 1,136 – 1,136Interest-bearing liabilities 5,430 – 5,430Other financial liabilities 224 – 224Provisions 428 308 736Deferred tax liabilities 644 (180) 464
Total liabilities 15,289 128 15,417
Net assets 5,889 (421) 5,468
Issued capital 4,729 – 4,729Treasury shares (42) – (42)Reserves 36 – 36Retained earnings Non-controlling interests
1,1624
(421) –
741 4
Total equity 5,889 (421) 5,468
1 Refer to Note 1(c)

QANTAS AIRWAYS LIMITED PRELIMINARY FINAL REPORT ABN: 16 009 661 901 YEAR ENDED 30 JUNE 2014
Page 40
NOTES TO THE PRELIMINARY FINAL REPORT For the year ended 30 June 2014 Note 10. Application of New or Revised Accounting Standards (continued) (ii) Restatement of Consolidated Balance Sheet as at 30 June 2013 (Condensed Comparative Balance Sheet)
30 June 2013 (as previously
reported) 1
$M
AASB 119 Employee
Benefits $M
30 June 2013 (Restated)
$M Current assets Cash and cash equivalents 2,829 – 2,829Receivables 1,436 – 1,436Other financial assets 180 – 180Inventories 364 – 364Assets classified as held for sale 42 – 42Other 394 (284) 110Non-current assets Receivables 174 – 174Other financial assets 27 – 27Investments accounted for under the equity method 190 – 190Property, plant and equipment 13,827 – 13,827Intangible assets 714 – 714Other 23 116 139
Total assets 20,200 (168) 20,032
Current liabilities Payables 1,844 – 1,844Revenue received in advance 3,047 – 3,047Interest-bearing liabilities 835 – 835Other financial liabilities 86 – 86Provisions 835 – 835Non-current liabilities Revenue received in advance 1,186 – 1,186Interest-bearing liabilities 5,245 – 5,245Other financial liabilities 54 – 54Provisions 441 (6) 435Deferred tax liabilities 673 (48) 625
Total liabilities 14,246 (54) 14,192
Net assets 5,954 (114) 5,840
Issued capital 4,693 – 4,693Treasury shares (43) – (43)Reserves 128 – 128Retained earnings 1,171 (114) 1,057Non-controlling interests 5 – 5
Total equity 5,954 (114) 5,840
1 Refer to Note 1(c)
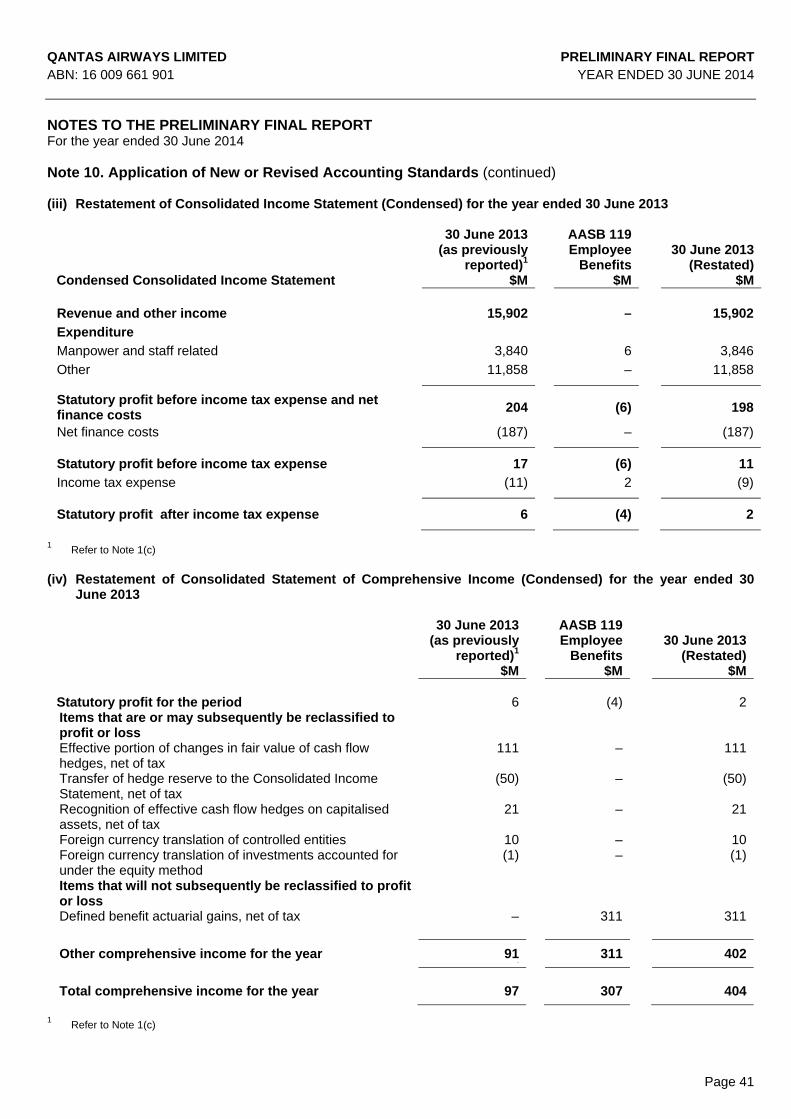
QANTAS AIRWAYS LIMITED PRELIMINARY FINAL REPORT ABN: 16 009 661 901 YEAR ENDED 30 JUNE 2014
Page 41
NOTES TO THE PRELIMINARY FINAL REPORT For the year ended 30 June 2014 Note 10. Application of New or Revised Accounting Standards (continued) (iii) Restatement of Consolidated Income Statement (Condensed) for the year ended 30 June 2013
Condensed Consolidated Income Statement
30 June 2013 (as previously
reported)1
$M
AASB 119 Employee
Benefits $M
30 June 2013 (Restated)
$M Revenue and other income 15,902 – 15,902
Expenditure
Manpower and staff related 3,840 6 3,846
Other 11,858 – 11,858
Statutory profit before income tax expense and net finance costs
204 (6) 198
Net finance costs (187) – (187)
Statutory profit before income tax expense 17 (6) 11
Income tax expense (11) 2 (9)
Statutory profit after income tax expense 6 (4) 2
1 Refer to Note 1(c) (iv) Restatement of Consolidated Statement of Comprehensive Income (Condensed) for the year ended 30
June 2013
30 June 2013 (as previously
reported)1
$M
AASB 119 Employee
Benefits $M
30 June 2013 (Restated)
$M
Statutory profit for the period 6 (4) 2Items that are or may subsequently be reclassified to profit or loss
Effective portion of changes in fair value of cash flow hedges, net of tax
111 – 111
Transfer of hedge reserve to the Consolidated Income Statement, net of tax
(50) – (50)
Recognition of effective cash flow hedges on capitalised assets, net of tax
21 – 21
Foreign currency translation of controlled entities 10 – 10Foreign currency translation of investments accounted for under the equity method
(1) – (1)
Items that will not subsequently be reclassified to profit or loss
Defined benefit actuarial gains, net of tax – 311 311
Other comprehensive income for the year 91 311 402 `
Total comprehensive income for the year 97 307 404
1 Refer to Note 1(c)
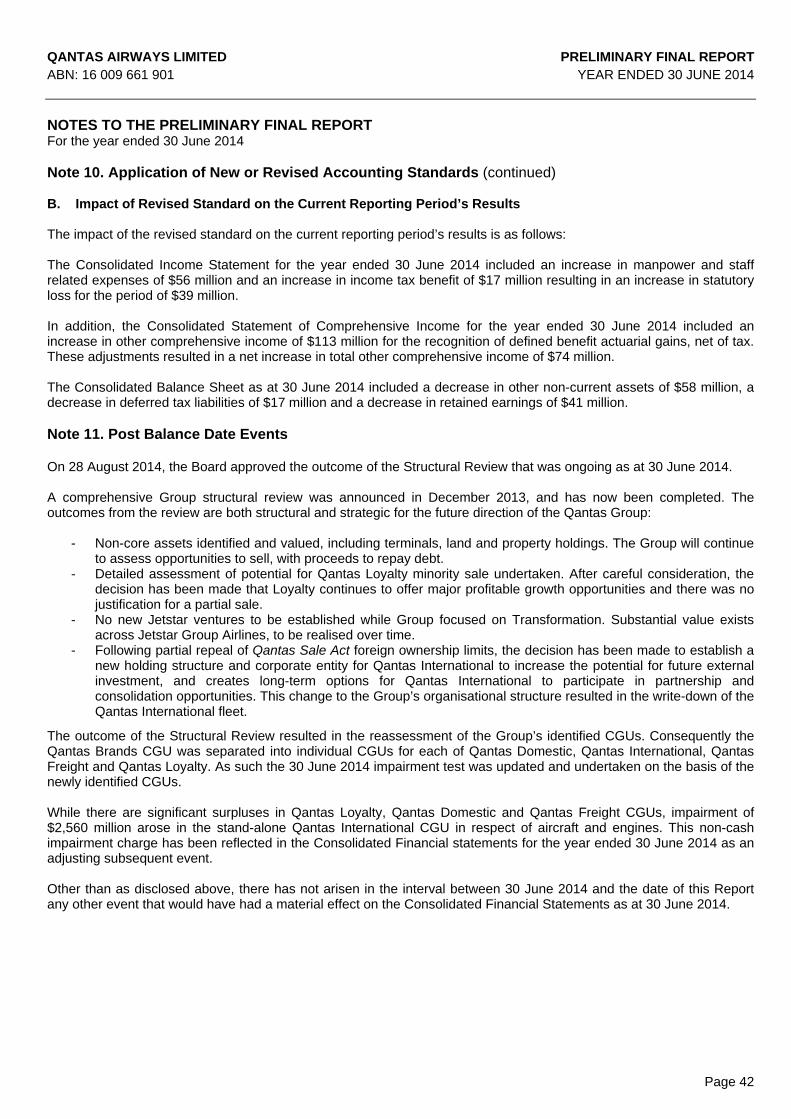
QANTAS AIRWAYS LIMITED PRELIMINARY FINAL REPORT ABN: 16 009 661 901 YEAR ENDED 30 JUNE 2014
Page 42
NOTES TO THE PRELIMINARY FINAL REPORT For the year ended 30 June 2014 Note 10. Application of New or Revised Accounting Standards (continued) B. Impact of Revised Standard on the Current Reporting Period’s Results The impact of the revised standard on the current reporting period’s results is as follows: The Consolidated Income Statement for the year ended 30 June 2014 included an increase in manpower and staff related expenses of $56 million and an increase in income tax benefit of $17 million resulting in an increase in statutory loss for the period of $39 million. In addition, the Consolidated Statement of Comprehensive Income for the year ended 30 June 2014 included an increase in other comprehensive income of $113 million for the recognition of defined benefit actuarial gains, net of tax. These adjustments resulted in a net increase in total other comprehensive income of $74 million. The Consolidated Balance Sheet as at 30 June 2014 included a decrease in other non-current assets of $58 million, a decrease in deferred tax liabilities of $17 million and a decrease in retained earnings of $41 million. Note 11. Post Balance Date Events On 28 August 2014, the Board approved the outcome of the Structural Review that was ongoing as at 30 June 2014. A comprehensive Group structural review was announced in December 2013, and has now been completed. The outcomes from the review are both structural and strategic for the future direction of the Qantas Group:
- Non-core assets identified and valued, including terminals, land and property holdings. The Group will continue to assess opportunities to sell, with proceeds to repay debt.
- Detailed assessment of potential for Qantas Loyalty minority sale undertaken. After careful consideration, the decision has been made that Loyalty continues to offer major profitable growth opportunities and there was no justification for a partial sale.
- No new Jetstar ventures to be established while Group focused on Transformation. Substantial value exists across Jetstar Group Airlines, to be realised over time.
- Following partial repeal of Qantas Sale Act foreign ownership limits, the decision has been made to establish a new holding structure and corporate entity for Qantas International to increase the potential for future external investment, and creates long-term options for Qantas International to participate in partnership and consolidation opportunities. This change to the Group’s organisational structure resulted in the write-down of the Qantas International fleet.
The outcome of the Structural Review resulted in the reassessment of the Group’s identified CGUs. Consequently the Qantas Brands CGU was separated into individual CGUs for each of Qantas Domestic, Qantas International, Qantas Freight and Qantas Loyalty. As such the 30 June 2014 impairment test was updated and undertaken on the basis of the newly identified CGUs. While there are significant surpluses in Qantas Loyalty, Qantas Domestic and Qantas Freight CGUs, impairment of $2,560 million arose in the stand-alone Qantas International CGU in respect of aircraft and engines. This non-cash impairment charge has been reflected in the Consolidated Financial statements for the year ended 30 June 2014 as an adjusting subsequent event. Other than as disclosed above, there has not arisen in the interval between 30 June 2014 and the date of this Report any other event that would have had a material effect on the Consolidated Financial Statements as at 30 June 2014.

QANTAS AIRWAYS LIMITED PRELIMINARY FINAL REPORT ABN: 16 009 661 901 YEAR ENDED 30 JUNE 2014
Page 43
OPERATIONAL STATISTICS For the year ended 30 June 2014
(unaudited) June 2014
June 2013 Change
QANTAS DOMESTIC (INCLUDING QANTASLINK) - SCHEDULED SERVICES
Passengers carried 000 21,818 22,116 (1.3)% Revenue passenger kilometres (RPK) M 27,715 28,352 (2.2)% Available seat kilometres (ASK) M 37,824 37,354 1.3% Revenue seat factor % 73.3 75.9 (2.6)pts
QANTAS DOMESTIC - SCHEDULED SERVICES Passengers carried 000 16,280 16,813 (3.2)% Revenue passenger kilometres (RPK) M 24,158 24,938 (3.1)% Available seat kilometres (ASK) M 32,097 32,119 (0.1)% Revenue seat factor % 75.3 77.6 (2.3)pts
QANTASLINK - SCHEDULED SERVICES Passengers carried 000 5,538 5,303 4.4% Revenue passenger kilometres (RPK) M 3,557 3,414 4.2% Available seat kilometres (ASK) M 5,727 5,235 9.4% Revenue seat factor % 62.1 65.2 (3.1)pts
JETSTAR DOMESTIC - SCHEDULED SERVICES Passengers carried 000 12,296 11,610 5.9% Revenue passenger kilometres (RPK) M 14,584 13,958 4.5% Available seat kilometres (ASK) M 17,885 17,055 4.9% Revenue seat factor % 81.5 81.8 (0.3)pts
QANTAS INTERNATIONAL - SCHEDULED SERVICES Passengers carried 000 5,837 5,765 1.2% Revenue passenger kilometres (RPK) M 47,112 47,983 (1.8)% Available seat kilometres (ASK) M 59,173 58,825 0.6% Revenue seat factor % 79.6 81.6 (2.0)pts
JETSTAR INTERNATIONAL - SCHEDULED SERVICES Passengers carried 000 4,850 5,146 (5.8)% Revenue passenger kilometres (RPK) M 14,060 14,715 (4.5)% Available seat kilometres (ASK) M 18,939 19,207 (1.4)% Revenue seat factor % 74.2 76.6 (2.4)pts
JETSTAR ASIA Passengers carried 000 3,975 3,639 9.2% Revenue passenger kilometres (RPK) M 6,188 5,897 4.9% Available seat kilometres (ASK) M 7,894 7,468 5.7% Revenue seat factor % 78.4 79.0 (0.6)pts QANTAS GROUP OPERATIONS Passengers carried 000 48,776 48,276 1.0% Revenue passenger kilometres (RPK) M 109,659 110,905 (1.1)% Available seat kilometres (ASK) M 141,715 139,909 1.3% Revenue seat factor % 77.4 79.3 (1.9)pts Aircraft at end of year # 308 312 -4 aircraft
QANTAS FREQUENT FLYER Awards redeemed M 6.2 5.6 11.3% Total members M 10.1 9.4 7.8%
FINANCIAL Yield (passenger revenue per RPK)1 c 10.02 10.29 (2.6)%
EMPLOYEES Full-time equivalent employees at end of year (FTE) # 30,751 33,265 (7.6)% RPK per FTE at year-end 000 3,566 3,334 7.0% ASK per FTE at year-end 000 4,608 4,206 9.6%
1 Yield (both current year and prior year) is calculated using prior year exchange rates.
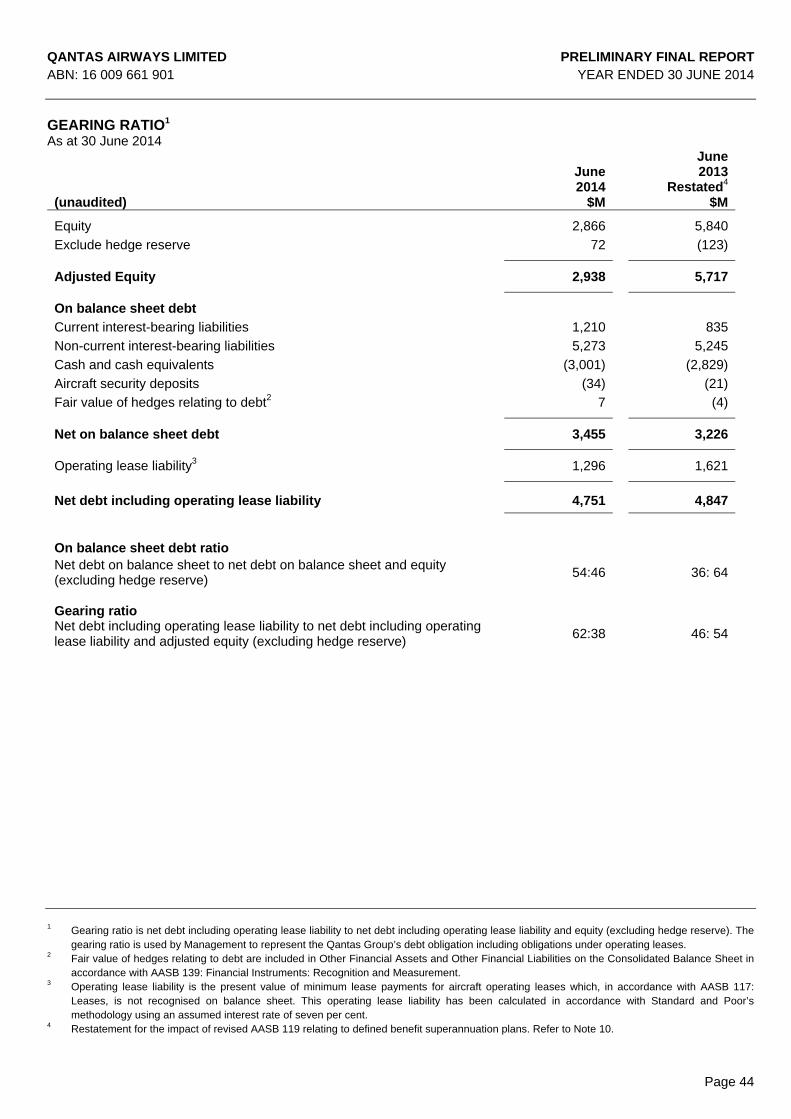
QANTAS AIRWAYS LIMITED PRELIMINARY FINAL REPORT ABN: 16 009 661 901 YEAR ENDED 30 JUNE 2014
Page 44
GEARING RATIO1 As at 30 June 2014
(unaudited)
June 2014
$M
June2013
Restated4
$M
Equity 2,866 5,840
Exclude hedge reserve 72 (123)
Adjusted Equity 2,938 5,717
On balance sheet debt
Current interest-bearing liabilities 1,210 835
Non-current interest-bearing liabilities 5,273 5,245
Cash and cash equivalents (3,001) (2,829)
Aircraft security deposits (34) (21)
Fair value of hedges relating to debt2 7 (4)
Net on balance sheet debt 3,455 3,226
Operating lease liability3 1,296 1,621
Net debt including operating lease liability 4,751 4,847
On balance sheet debt ratio Net debt on balance sheet to net debt on balance sheet and equity (excluding hedge reserve)
54:46 36: 64
Gearing ratio
Net debt including operating lease liability to net debt including operating lease liability and adjusted equity (excluding hedge reserve)
62:38 46: 54
1 Gearing ratio is net debt including operating lease liability to net debt including operating lease liability and equity (excluding hedge reserve). The
gearing ratio is used by Management to represent the Qantas Group’s debt obligation including obligations under operating leases. 2 Fair value of hedges relating to debt are included in Other Financial Assets and Other Financial Liabilities on the Consolidated Balance Sheet in
accordance with AASB 139: Financial Instruments: Recognition and Measurement. 3 Operating lease liability is the present value of minimum lease payments for aircraft operating leases which, in accordance with AASB 117:
Leases, is not recognised on balance sheet. This operating lease liability has been calculated in accordance with Standard and Poor’s methodology using an assumed interest rate of seven per cent.
4 Restatement for the impact of revised AASB 119 relating to defined benefit superannuation plans. Refer to Note 10.