qae designing a supply chain management academic ...gfmeglobal.org/issues/pdfs/benchmarking.pdf ·...
TRANSCRIPT

Designing a supply chainmanagement academic
curriculum using QFD andbenchmarking
Marvin E. Gonzalez, Gioconda Quesada, Kent Gourdin andMark Hartley
College of Charleston, Charleston, South Carolina, USA
Abstract
Purpose – The purpose of this paper is to utilize quality function deployment (QFD), Benchmarkinganalyses and other innovative quality tools to develop a new customer-centered undergraduatecurriculum in supply chain management (SCM).
Design/methodology/approach – The researchers used potential employers as the source for datacollection. Then, they used QFD and benchmarking to develop a Voice of Customer matrix. Usinginformation from the matrix, a new customer-oriented SCM undergraduate programme was designed.
Findings – The researchers outline a practical solution to the problem of designing academicprogrammes which satisfy the main expectations of potential employers (customers).
Research limitations/implications – The study is specifically concerned with the design of anSCM curriculum, but the researchers argue that the design methodology could be applied in otheracademic contexts.
Practical implications – The application of QFD and benchmarking as a joint analysis tool is aninteresting approach in education because the information is analysed from different perspectivessimultaneously. The new programme successfully meets customer/employer expectations andrequirements.
Originality/value – This study demonstrates the effective application of quality design tools toenhance academic programmes. The approach can clearly be extended to other areas for the design ofspecific courses and programmes. The most important needs in programme design are those ofidentifying the programme’s main customers and of clarifying their expectations.
Keywords Quality, Customers, Higher education, Quality function deployment, Benchmarking,Supply chain management
Paper type Research paper
IntroductionOver the last 12 years, the concept of logistics management has been developed withina broader discipline of supply chain management. This new field involves allapproaches used to efficiently integrate all participants of a supply chain so thatproducts/services are delivered to the customer in the right quantities, to the rightlocation, at the right time, and at optimal cost (Gonzalez et al., 2004). Scholars, alongwith practitioners, are continuously developing philosophies and tools to overcome therisks inherent in the current changing environment. The evolution of this concept isdriven by the competitive global market place, where providing very high levels ofefficiency and customer service are prerequisites to success (Rutner and Fawcett, 2005).
The current issue and full text archive of this journal is available at
www.emeraldinsight.com/0968-4883.htm
QAE16,1
36
Received 9 February 2007Revised July 2007Accepted 30 October 2007
Quality Assurance in EducationVol. 16 No. 1, 2008pp. 36-60q Emerald Group Publishing Limited0968-4883DOI 10.1108/09684880810848404

A few decades ago, total quality management arose as a philosophy that proposedthe integration of functional areas in the organization for a common goal: customersatisfaction (Quesada, 1999). Firms started to think about their suppliers as strategicpartners and began involving them in the strategic planning process (Ellram and Carr,1994). Just a few years ago, both academic and practitioner communities were shiftingparadigms regarding supply chain management. After years of viewing theorganization as a single firm, they increasingly view them as one member of anetwork of suppliers and customers, comprising a supply chain (Leenders et al., 1994;Harland, 1996; Choon et al., 2002). However, this paradigm shift must be supported bythe academic institutions that must prepare those future leaders who will eventuallyhave the responsibility for achieving higher standards in supply chain issues in boththe services and manufacturing areas. Therefore, it is the purpose of this research todetermine the customer expectations and needs such that supply chain managementacademic programme can be developed to satisfy them.
In order to design an undergraduate academic programme in the area of supplychain management the authors consider the principles of total quality management(TQM). The major tool employed is Quality Function Deployment (QFD). QFD hasfound widespread acceptance in USA industry as an effective tool to translatecustomer expectations into product or service features. In this approach, several stepsare followed to expose customer expectations into the service process and ensure thatat each level of expectation the highest possible quality is provided. QFD is simply aplanning tool; it begins with market research that identifies just what customers like,information hereafter referred to as “Voice of the Customer” (VOC). It is through theQFD process that the VOC is translated into system requirements (operationalrequirements). Since QFD is a relatively new process, almost all applications have beenin industry or manufacturing. In this article, QFD principles will be applied to studyundergraduate education. A discussion of the methodology and principles of QFD maybe found in Hauser and Clausing (1988); Gonzalez et al. (2004); Akao and Mazur (2003);Gonzalez et al. (2005).
This paper contributes to the literature by showing the innovative use of totalquality management tools such as Quality Function Deployment (QFD)/Benchmarkingand Customer Windows Quadrant (CWQ). The authors show how these tools can beused to incorporate customer expectations into the development of an academicprogramme. Also they present an analysis of considerations to be used in theimplementation of an undergraduate academic programme in supply chainmanagement. The authors begin with a review of the theoretical framework of thepaper and then identify customer expectations and the deployment of alternatives forsatisfying these expectations. The data received from potential employers indicatethey have unique requirements that are not being satisfied by existing undergraduateprogrammes in supply chain management. The research objectives are twofold,namely:
(1) to develop a methodology for the design of a customer-focused undergraduateacademic program in supply chain management using Quality FunctionDeployment (QFD); and
(2) to define a customer-based improvement strategy based on the critical elementsidentified by quality analyses.
SCM academiccurriculum
37

Literature reviewPrevious studies in academic or practitioner literature (Adkins and Radtke, 2004;Clayson and Haley, 2005; Lynne and Brennan, 2007; Hwarng and Teo, 2001) andsurveys with professionals, students (graduate and undergraduate) and potentialemployers have indicated that higher education programmes have several problems:First, these programmes tend to emphasize theoretical models that are hard forstudents to apply as real decision making tools. Next, schools fail to understandreal-life problems and incorporate them into supply chain curricula. Finally, oral andwritten communication skills are not adequately covered; institutions of highereducation can develop academic programmes that resolve these, as well as othercustomer expectations.
Quality function deploymentQuality function deployment (QFD) was developed in Japan during the 1960s by Akao(1972) as a method for incorporating consumers’ demands into product development.Akao and Mazur (2003) defined QFD as a method for defining design qualities that arein keeping with customer expectations and then translating those customerexpectations into design targets and critical quality assurance points that can beused throughout the production/service development phase. QFD is a widely usedsystematic process utilized by cross-functional teams to identify and resolve issuesarising from the provision of products, processes, services, and strategies intended toenhance customer satisfaction Gonzalez et al. (2003). By employing QFD,manufacturers and service providers are able to translate customer expectations intomeasurable quality characteristics and create products and services which satisfythose requirements Hauser and Clausing (1988). Quality function deployment (QFD) isa methodology for the development or deployment of features, attributes, or functionsthat give a product or service high quality. QFD can be very helpful in answering thequestion “how to deliver quality products and services based on the needs ofcustomers, or the voices of customers?” (Hwarng and Teo, 2001). The two fundamentalpurposes of QFD are:
(1) to improve the communication of customer expectations throughout theorganization; and
(2) to improve the completeness of specifications and to make them traceabledirectly to customer expectations and needs (Gonzalez, 2001).
Several researchers have applied QFD to different service areas (Jeong and Oh, 1998;Trappey et al., 1996; Stuart and Tax, 1996; Cadogan et al., 1999; Pun et al., 2000; Peters,1988; Gonzalez et al., 2003, 2005). Since the early 1990s, there have been a number ofQFD applications in the education area, as can be seen in Table I. From these, the mostrelated to this paper are: one case for an undergraduate statistics course (Duffuaa et al.2003) and another one for the development of courses in higher education (Hwarng andTeo, 2001). However, it was originally used in product development and design. Griffinet al. (1995) have considered that QFD provides a means of communication amongproduct life cycle stages. Benefits which arise from these and other reported QFDapplications include lower design and service costs, fewer and earlier design changes,reduced product development time, fewer start-up problems, better companyperformance, more reliable input for marketing strategies, improved service quality
QAE16,1
38

and, above all, increased customer satisfaction (Jae et al., 1998; Franceschini andRossetto, 1995).
The researchers, however, found a lack of quantitative tools that could addreliability and efficiency to the gathering of customer expectations and theirsubsequent translation into the critical elements of an academic institution, mainly inthe higher education field. Furthermore, in 100 percent of the current higher educationcases, the customers are students (graduate or undergraduate) yet all the academicprogrammes are based on the faculty experience. As stated before, in the current studythe “customers” will be the potential employers, not the students. Using QFD
Author Research Findings
Clayton (1993) Used QFD coupled with process analysis to providecost-effective, high-quality lifelong learning foroptometrists-to-be at Aston University
Jaraiedi and Ritz (1994) Applied QFD to explore ways to improve advising andteaching processes at West Virginia University
Lam and Zhao (1998) Use QFD matrix to evaluate the effectiveness of teaching atthe Department of Management Science at the CityUniversity of Hong Kong
Motwani et al. (1996) Use the three-house approach using American Assembly ofCollegiate Schools of Business (AACSB) accreditationrequirements as key considerations for designing the MBAprogramme at Grand Valley State University
Pitman et al. (1995) Used QFD to evaluate their MBA programme by measuringcustomer satisfaction
Koksal and Alpay (1998) Used QFD principles and software to prioritize theirplanning objectives for developing engineering laboratoriesat the University of Missouri-Rolla
Koksal and Alpay (1998) Used QFD in conjunction with AHP to identify generaldesign requirements for the Industrial Engineeringprogramme at the Middle East Technical University
Krishnan and Houshmand (1993) Used QFD to address customer expectations in the design ofengineering curricula at the University of Cincinnati
Owlia and Aspinwall (1998) Used QFD principles to identify broad categories ofprocesses relevant to quality characteristics
Seow and Moody (1996) Used the VOC to improve the curriculum developmentprocess at the University of Portsmouth
Chen and Bullington (1993) Applied QFD in research strategic planningChang and Ku (1995) Used QFD principles to highlight potential improvements to
the engineering and technical education in TaiwanErmer (1995) Analyzed the design requirements needed to satisfy each
group of customers at the Department of MechanicalEngineering, University of Wisconsin-Madison
Rosenkrantz (1996) Developed a curriculum in manufacturing using TQM toolsMurgatroyd (1993) Application of QFD in Distance Learning EducationAyse and Veli (2005) The curriculum of the Tyre Technology Department at the
Kocaeli University Kosekoy Vocational School of HigherEducation (KU-KVSHE) has been reviewed by using thequality function deployment (QFD) technique
Akao et al. (1996) QFD application in the improvement of higher education
Table I.Literature review in QFD
applications for highereducation
SCM academiccurriculum
39

methodology, the final processes/methods will produce the service that meets theoriginal customer expectations (employers’ expectations).
BenchmarkingBenchmarking is a continuous quality improvement process by which an organizationcan assess its internal strengths and weaknesses, evaluate comparative advantages ofleading competitors, identify best practices of industry functional leaders, andincorporate these findings into a strategic action plan geared to gain a position ofsuperiority (Hokey et al., 1997). Benchmarking can be defined as a process ofcomparison of some measure of actual performance against a reference or benchmarkperformance. There are three main aspects to the performance of a company: efficiency,productivity and quality. Benchmark results are used to identify, quantify andprioritize improvement opportunities offering the greatest potential return, whilehighlighting areas at risk due to under-spending. The end result is a factual basis andcontext for creating a business plan to drive change (Hokey et al., 1997). Benchmarkingmay be a one-off event, but is often treated as a continuous process in which companiescontinually seek to challenge their practices
Benchmarking has two distinctive approaches: competitive benchmarking andprocess benchmarking. According to the American Productivity and Quality Centre,competitive benchmarking aims to measure organizational performance relative to theperformance of competing organizations and consists of an ordered sequence of steps,(Hokey et al., 1997) Benchmarking is not complicated but it does seem initially difficultfor organizations to learn from others and complete exercises successfully in order todeliver measurable improvements. Based on the researcher’s experience, often thedifficulties seem to have less to do with the technique of benchmarking than thepressures the organization and individuals are experiencing and their lack of acoherent plan for integrating change management.
Additionally, benchmarking facilitates strategic planning, providing a clearer focusfor setting strategic company goals. While competitor benchmarking encourages anexternal focus, many authors (Rogers, 1993; Andersen and Camp, 1995; Whymark,1998; Woodburn, 1999) emphasize the particular benefits of generic benchmarking infocusing on strategic company goals and thus increasing competitiveness.
The shift in emphasis from comparison of direct competitor performance measuresto one of learning about best practices and identifying what can be achieved (Rogers,1993; Andersen and Camp, 1995; Whymark, 1998; Woodburn, 1999) has furtherenhanced the role of benchmarking in achieving sustainable competitive advantageand superior performance. Furthermore, Porter (1994) recognized the stimulus forchange generated by benchmarking activities and the potential gains possible for allstakeholder groups , while Schmidt (1992) examined the link between benchmarkingand an increase in shareholder value.
We used benchmarking in our paper to compare the new program obtained in theQFD process with the top programs in supply chain management according to Rutnerand Fawcett (2005) and to analyze the competitiveness of in today’s academic market.
Research methodologyThe general method proposed for the design of a supply chain management academiccurriculum using QFD and Benchmarking is depicted in Figure 1. The road map for
QAE16,1
40

developing the supply chain management academic curriculum (the authors call thisprocess the development of academic strategy) is composed of three different phases.Phase 1 includes the procedure that the research group used to collect the initialinformation on customers expectations. Phase 2 includes the QFD and Benchmarkingconstruction in the Voice of Customer matrix. In this phase the research groupdeveloped the planning matrix of QFD that was used as a base for the formulation ofthe academic program under study. Phase 3, is the development of the academicprogram at the College of Charleston and includes the critical parts and action plansmatrices. Each of these phases is explained in detail below.
Phase 1: gathering and analysis of the informationIn this phase the researchers collected and analyzed the customer expectations frompotential employers. In order to obtain these customer expectations, a questionnairewas distributed among a selected group of companies that hire professionals in thearea of supply chain management and logistics. The researchers used the database ofthe Institute for Supply Management (ISM) for this initial sample. In addition, theyused interviews with purchasing managers, plant managers and logistics managers(the research group named them as informants). Multiple informants at each plantreported their perceptions on the degree of knowledge and experience of futureprofessionals in the area of supply chain management.
The questionnaire was structured in 3 sections (general information, customerexpectations, and benchmarking questions). It is important to emphasize that potentialcustomers are companies that hire professionals in the area under study. There isconsiderable debate in the literature regarding customers in higher education, theperspective of this research can be different from studies that consider students ascustomers (Lynne and Brennan, 2007; Clayson and Haley, 2005; Bennett, 2003; Adkinsand Radtke, 2004). From the results, demographic analyses can be done in order to
Figure 1.Road map in the design of
a supply chainmanagement academic
curriculum using QFD andbenchmarking
SCM academiccurriculum
41

understand better the population under study and future trends and needs in the areaof supply chain management.
The data collection resulted in 1596 customer expectations that were categorizedand summarized in order to include the most influential and critical in the QFD matrix.Statistical analyses, such as dynamic analysis and factor analysis, were performed inorder to classify, reduce and rank these customer expectations. The outcome of thisprocess was the grouping of customer expectations into common customerrequirement categories. Using the Customer Window Quadrant (CWQ), customerexpectations were summarized and categorized in order of importance, with the finalselection done using the results obtained in the CWQ.
Phase 2: QFD and benchmarking analysisWhen all the customer expectations were defined and categorized, the final number ofcustomer expectations analyzed in this study was 25, after the reduction process. QFDand benchmarking analyses were applied. As can be seen in Figure 2, the researchgroup designed a method using the basic procedure of the QFD.
The conventional four-matrices of the QFD method designed for manufacturingcompanies (Hauser and Clausing, 1988) was modified slightly so that it could beapplied to the academic program design. Specifically, the four-matrix method was
Figure 2.Strategic QFD
QAE16,1
42

transformed into a three-matrix action-based method (Gonzalez et al., 2005). Thesethree matrices included
(1) house of quality (planning matrix);
(2) critical parts matrix; and
(3) action plans matrix.
Conventional terms also had to be modified to apply the methodology to the design.Matrix I: developing the planning matrix. This step is known as the “House of
Quality”. Activities in this step include the following:. identifying the customers;. identifying customer expectations and their importance;. analyzing customer expectations (What);. identifying current methods and processes (How or academic requirements);. ranking academic requirements; and. establishing correlations between customer and academic requirements to finally
develop and analyze the House of Quality (HOQ) (Gonzalez et al., 2004).
The other two matrixes are part of the problem solution and are explained in the nextsection.
Phase 3: design of an academic program in supply chain managementThis phase is divided in the two final steps of the QFD methodology: the developmentand analysis of the final academic program in supply chain management.
Matrix II: developing of critical parts matrix. This step corresponds to planning thedesign of a supply chain management academic curriculum using the links betweenthe academic requirements identified in Step I to operational elements (this informationcame from the survey applied to faculty members of 18 supply chain academicprograms in USA).
Matrix III: action plans matrix. In this step, an action plan is developed based on theinformation obtained in the previous two steps. The final action plan consists of thesupply chain management academic curriculum. In this phase, multiple factors areconsidered based on the information collected in the previous phases. These factorsinclude the academic program’s organizational structure, technology requirements,and marketing strategy for motivating the customers to support the academicprogram.
ResultsDesigning an academic program in supply chain management; a study caseTo illustrate the methodology, results from the study of the proposed supply chainmanagement undergraduate program at the College of Charleston (CofC) were used.The program is still under design, so all the findings obtained from this study will beused to shape the final undergraduate business major in supply chain management atthe College of Charleston.
SCM academiccurriculum
43

The application of QFD and benchmarking enabled the researchers to translateresearch findings into actionable strategies. In the next section the authors explaineach of those strategies in detail.
Developing a planning matrixIdentifying the customers. In a broad sense, the student is the product of any academicprocess that will serve the needs of the companies that will hire them. Therefore, thereis no doubt that the customer of any academic institution is the companies that willhire their graduates, not the students; the latter are the products or outcomes of theacademic processes at the institutions. With this in mind, the researchers will continueusing the word “customer” for the companies and “products” for the students inacademic institutions.
Identifying customers’ requirements and importance. The first step in applying QFDmethodology is to generate the customer’s expectations. In order to generate thisimportant information the research group consulted secondary data. Using the jobdescriptions and requirements for open positions in supply chain management andlogistics, a set of 1,595 expectations were generated. More than 350 position requestswere analyzed in this process.
The first reduction tool applied in this study was Dynamic Analysis ReductionProcess (DARP) (Gonzalez et al., 2003; Forrester, 1961) DARP is a tool used forreducing the number of variables; this technique considers the interrelationship amongvariables, and groups’ similar variables using the direct and indirect influence in themain variable. For this study, the main variable is customer supply chain managementprogram. DARP determined that 1,202 indirect variables are related with only 29variables or expectations that are related directly with the main variable. Using DARPallows a better understanding of the complexity in the relationships among variables;the application of DARP reduces the number of items by only 24 percent. The results ofthis analysis can be seen in Table II.
The original customers’ requirements (1,595) were grouped into 393 customerexpectations (direct variables) using the DARP. After all the correlations were done,the research group separated the total number of customer expectations (1,595) intotwo groups. Group 1 contains the indirect variables (customer expectations) that arerelated indirectly with the main purpose of the project. Group 2 are the direct variables(393) and are those variables that affect directly the composition of the new academicprogram under study. Using the basic concepts of dynamic analysis, we selected thedirect variables for next steps. According to dynamic analysis theory (Gonzalez et al.,2003; Forrester, 1961) if we satisfy the direct problems, all the other indirect variableswill be satisfied. Dynamic analysis examines the relationship among variables andreduces the number of variables that are related, obtaining only those that have acritical influence on the main problem. However, further data reduction will be neededfor building the final house of quality. In order to further reduce the number of items,factor analysis (Varimax rotation) was used. Factor analysis was conducted to study inmore detail expectations inter-relationships and to determine empirically theirunderlying structure. To conduct the factor analysis, given only 395 subjects (customerexpectations), the researchers separated the quantitative from the qualitativeexpectations and analyzed each separately. Furthermore, 25 items with the lowestitem-to-total correlations were deleted.
QAE16,1
44

Using this set of 370 items, and the criterion to retain factors with values greater than1.0, six customer expectations factors were identified that explained 52 percent of thevariance. Keeping in mind that one of the goals at this stage was to reduce the numberof items further, we systematically deleted items that loaded ambiguously (factorloadings greater than 0.45 on more than one factor). Several iterations of analyses wereconducted until a stable and interpretable set of results was obtained.
The output from the factor analysis shows 49 customer expectations remaining forfurther analyses. The process continues to cycle until the people involved in the projectare satisfied with the results. Through these processes, individual customerexpectations are grouped into common customer requirement categories. Before thiscan happen, however, further data reduction is normally needed. A new survey wasreleased to ISM members in order to evaluate and prioritize for the final 49expectations obtained from the previous analysis. After the evaluation of the new
Dynamic analysis resultsCustomer expectation Direct Indirect Total Code
Production and operations knowledge 21 142 163 POMKTechnical aptitude 48 56 104 TAManagement skill 12 69 81 MSKBusiness strategy skills 11 69 80 BSSKMarket knowledge 27 45 72 MKSupply chain management knowledge 11 59 70 SCHMKLeadership skills 14 55 69 LSKInformation systems skills 10 58 68 ISSKAnalysis skills 10 57 67 ASKLogistics knowledge 15 49 64 LKQuality engineering 26 35 61 QEFinancial knowledge 20 33 53 FKCertification 22 31 53 CEForecasting skills 9 43 52 FSKSupplier relations knowledge 13 38 51 SRKTeam work skills 17 31 48 TWSKKnowledge of Asian supply 16 32 48 KASPurchasing knowledge 6 35 41 PKMulti-bilingual 12 29 41 TOCustomer satisfaction knowledge 7 29 36 CSKCustomer relationship skills 11 23 34 CRSKInventory skills and knowledge 11 22 33 ISKKDecision making skills 6 26 32 DSSKGlobal knowledge 10 22 32 GKVendor relationship 6 26 32 VRKRetailing skills 3 27 30 RSKNegotiating skills 9 19 28 NESKProcurement knowledge 4 24 28 PKCommunication skills 6 18 24 CSKTotal 393 1,202 1,595
Note: Indirect customer expectations are the original ones (coming from the initial screen ofexpectations)
Table II.DARP results
SCM academiccurriculum
45

results, the research group analyzed the results and used the Customer WindowQuadrant technique designed by Intel, 2002 to categorize the final 48 expectations.
The CWQ is an analytical quality tool designed to cluster and classify customerexpectations based both on the level of importance and the level of satisfaction of eachexpectation from the customer’s perspective Gonzalez et al., 2005. There are fourquadrants whose characteristics and guidelines as can be seen in Figure 3 and aredescribed as follows:
(1) Quadrant A. The customer wants it but does not get it. Rated as HighImportance/Low Satisfaction, this is the critical quadrant. All customerexpectations placed here require immediate action. Universities must set up anaction plan to move the critical ones to quadrant B as soon as possible.
(2) Quadrant B. The customer wants it and gets it. Rated as High Importance/HighSatisfaction, this is the most desired quadrant. All important and criticalcustomer expectations should be here and stay here. Universities must improveand monitor all quality characteristics placed here.
(3) Quadrant C. The customer does not want it and does not get it. Rated as LowImportance/Low Satisfaction, items in this quadrant are of the lowest importanceand should not be the focus for now. Institutions should not take any actionunless there are changes in the market, service strategy or customer expectations.
(4) Quadrant D. The customer does not want it but gets it anyway. Rated as LowImportance/High Satisfaction items found here are not needed and possiblycostly. Action should be taken to remove these items if the customerrequirement being offered is expensive or represents any other type of risk tothe university. If the quality characteristic placed here is eliminated or reduced,perhaps the customer will not notice it.
Figure 3.Customer windowsquadrant
QAE16,1
46

The results of the application of the CWQ showed the following clustering based oncustomer weighting as described in the process-planning matrix mentioned above,namely:
. Quadrant A: five customer expectations were placed here. An action plan shouldbe set up to describe how to move these customer expectations to quadrantB. According to the results, companies need people with knowledge of othercultures, especially Asian. In addition, the knowledge and practice of additionallanguages is also important. Clearly, a key finding of this research is thatmulticultural knowledge is essential for professionals in the area of supply chainmanagement.
. Quadrant B: 21 customer expectations were placed here. A special plan should beformulated to maintain, improve and monitor these customer expectations.
In addition, three customer expectations were classified under quadrants C and 20under quadrant D; however, only those considered as critical were shown on quadrantsA and B. On the other hand, the expectations in quadrant D could be move to quadrantB in order to expand and satisfy the maximum amount of expectations.
The final number of customer expectations analyzed in this study was 29 (after allthe process reduction).
Analyzing the customer expectations (What’s). In this section of the curriculumplanning stage, in order to setup the Voice of Customer matrix, information comingfrom different sources were used:
. potential employers prioritized customer expectations in a survey;
. research team rigorously evaluated the supply chain programs of the selectedcomparable competitors and assigned evaluations of each customer expectation,a degree of fulfilment; and finally
. research team set target goals for the School of Business and Economics at theCollege of Charleston (CofC) in all customer expectations.
Table III shows summary results of a survey applied to 65 practitioners and potentialemployers in the area under study. It is important to mention that the researchers sentthe questionnaire using e-mail addresses to 75 potential customers (employers) andreceived in return, 65 usable questionnaires (90 percent response). From this Table, 14customers’ expectations are ranked as critical for future professionals in the area. Aninteresting finding was that the expectation about knowledge of both Asian and globalmarkets were ranked as the most important skills that future professionals need todevelop, factors that need to be considered seriously in the final academic program.From this survey, it was possible to establish that expectations for potential employerscan be categorized in five defined areas: Management, Decisions Sciences, SupplyChain Management, Information Systems and Marketing.
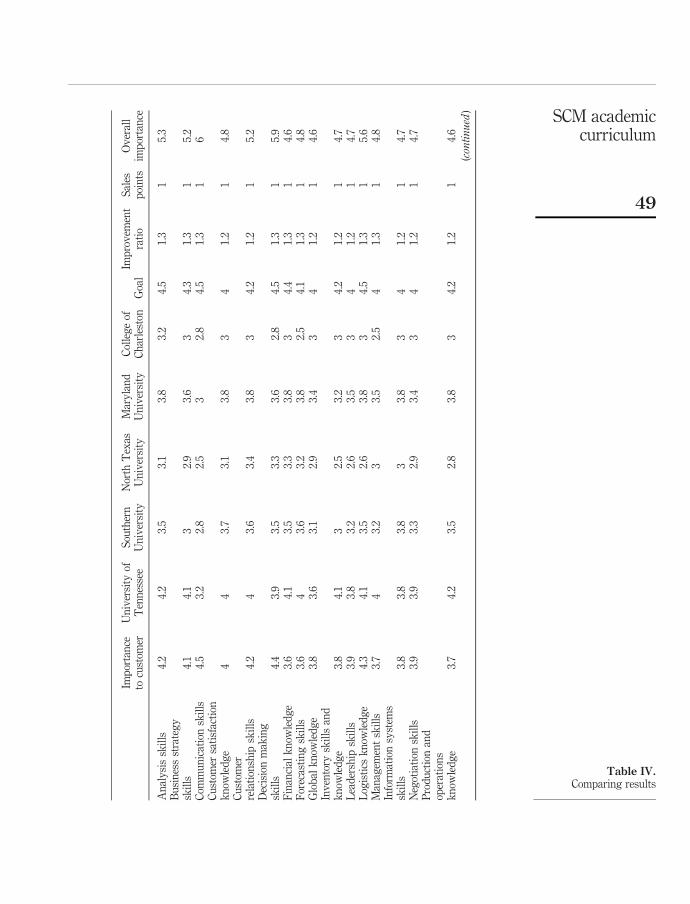
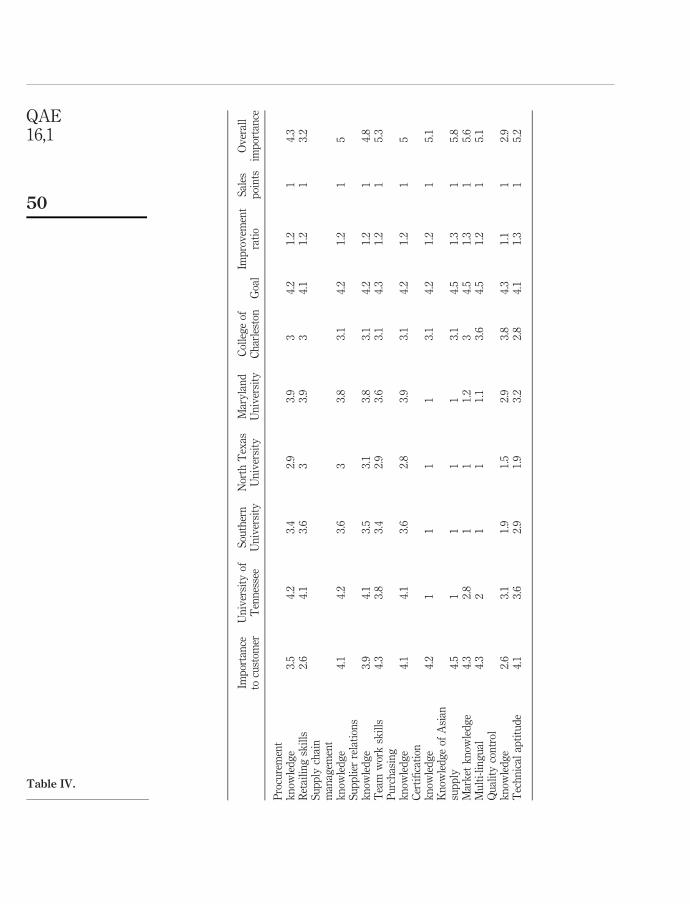
In Table IV, there is a column that evaluates the level of importance of eachcustomer expectation (obtained directly from customer surveys). Additionally, there isa column that evaluates the overall importance. Overall importance not only considersthe customer’s level of importance, but also the necessary degree of improvement forthe CofC to fulfil the expectations (improvement ratio) and the qualification of therequirement as sales point (is this requirement prominent in the academic program to
SCM academiccurriculum
47

be considered competent by employers?). At the same time, these importance levels willimpact the decision on which courses are highly required to successful fulfilment of themost important customer requirements, considering not only the customer but also thebenchmarking results that determine improvement ratios.
Using the importance of the potential employers and all the other evaluations thefinal results show that the expectations “knowledge of Asian Supply” (4.5),“communication skills” (4.3), “certification knowledge” (4.2), “decision-making skills”(4.1) and “teamwork skills” (4.1) are the most critical expectations and must beaddressed in any academic program related to supply chain management. As can beseen from Table IV, potential employers consider important the expectations of“logistics knowledge” and “customer relationships skills” (4.2). Both results are verysimilar, thus confirming that the research team has listened to the customers’ needs orexpectations in the right way.
Identifying current methods and processes or critical elements (How’s). Currentmethods and processes or critical elements (how’s) for the CofC case, refer to specificcourses that contain topics that include the customer expectations. Unfortunately,customer expectations are not often stated in terms of the universities’ current courses.Therefore, the researchers translated customer expectations (called “What’s” in the
Customer expectations Code Average
Communication skills CSK 4.46Knowledge of Asian supply KAS 4.42Decision making skills DSSK 4.39Team work skills TSWK 4.30Logistics knowledge LK 4.29Market knowledge MK 4.28Multi-bilingual TO 4.26Customer relationship skills CRSK 4.23Analysis skills ASK 4.20Certification CE 4.18Business strategy skills BSSK 4.13Technical aptitude TA 4.12Supply chain management knowledge SCHMK 4.11Purchasing knowledge PK 4.09Customer satisfaction knowledge CSK 3.96Leadership skills LSK 3.91Supplier relations knowledge SRK 3.89Negotiation skills NESK 3.86Global knowledge GK 3.84Inventory skills and knowledge ISKK 2.82Information systems skills ISSK 2.80Production and open knowledge POMK 3.73Management skills MSK 3.66Financial knowledge FK 3.63Forecasting skills FSK 3.63Procurement knowledge PK 3.54Retailing skills RSK 2.57Quality engineering QE 2.52
Table III.Customer priority results
QAE16,1
48
Imp
orta
nce
tocu
stom
erU
niv
ersi
tyof
Ten
nes
see
Sou
ther
nU
niv
ersi
tyN
orth
Tex
asU
niv
ersi
tyM
ary
lan
dU
niv
ersi
tyC
olle
ge
ofC
har
lest
onG
oal
Imp
rov
emen
tra
tio
Sal
esp
oin
tsO
ver
all
imp
orta
nce
An
aly
sis
skil
ls4.
24.
23.
53.
13.
83.
24.
51.
31
5.3
Bu
sin
ess
stra
teg
ysk
ills
4.1
4.1
32.
93.
63
4.3
1.3
15.
2C
omm
un
icat
ion
skil
ls4.
53.
22.
82.
53
2.8
4.5
1.3
16
Cu
stom
ersa
tisf
acti
onk
now
led
ge
44
3.7
3.1
3.8
34
1.2
14.
8C
ust
omer
rela
tion
ship
skil
ls4.
24
3.6
3.4
3.8
34.
21.
21
5.2
Dec
isio
nm
akin
gsk
ills
4.4
3.9
3.5
3.3
3.6
2.8
4.5
1.3
15.
9F
inan
cial
kn
owle
dg
e3.
64.
13.
53.
33.
83
4.4
1.3
14.
6F
orec
asti
ng
skil
ls3.
64
3.6
3.2
3.8
2.5
4.1
1.3
14.
8G
lob
alk
now
led
ge
3.8
3.6
3.1
2.9
3.4
34
1.2
14.
6In
ven
tory
skil
lsan
dk
now
led
ge
3.8
4.1
32.
53.
23
4.2
1.2
14.
7L
ead
ersh
ipsk
ills
3.9
3.8
3.2
2.6
3.5
34
1.2
14.
7L
ogis
tics
kn
owle
dg
e4.
34.
13.
52.
63.
83
4.5
1.3
15.
6M
anag
emen
tsk
ills
3.7
43.
23
3.5
2.5
41.
31
4.8
Info
rmat
ion
syst
ems
skil
ls3.
83.
83.
83
3.8
34
1.2
14.
7N
egot
iati
onsk
ills
3.9
3.9
3.3
2.9
3.4
34
1.2
14.
7P
rod
uct
ion
and
oper
atio
ns
kn
owle
dg
e3.
74.
23.
52.
83.
83
4.2
1.2
14.
6
(continued
)
Table IV.Comparing results
SCM academiccurriculum
49
Imp
orta
nce
tocu
stom
erU
niv
ersi
tyof
Ten
nes
see
Sou
ther
nU
niv
ersi
tyN
orth
Tex
asU
niv
ersi
tyM
ary
lan
dU
niv
ersi
tyC
olle
ge
ofC
har
lest
onG
oal
Imp
rov
emen
tra
tio
Sal
esp
oin
tsO
ver
all
imp
orta
nce
Pro
cure
men
tk
now
led
ge
3.5
4.2
3.4
2.9
3.9
34.
21.
21
4.3
Ret
aili
ng
skil
ls2.
64.
13.
63
3.9
34.
11.
21
3.2
Su
pp
lych
ain
man
agem
ent
kn
owle
dg
e4.
14.
23.
63
3.8
3.1
4.2
1.2
15
Su
pp
lier
rela
tion
sk
now
led
ge
3.9
4.1
3.5
3.1
3.8
3.1
4.2
1.2
14.
8T
eam
wor
ksk
ills
4.3
3.8
3.4
2.9
3.6
3.1
4.3
1.2
15.
3P
urc
has
ing
kn
owle
dg
e4.
14.
13.
62.
83.
93.
14.
21.
21
5C
erti
fica
tion
kn
owle
dg
e4.
21
11
13.
14.
21.
21
5.1
Kn
owle
dg
eof
Asi
ansu
pp
ly4.
51
11
13.
14.
51.
31
5.8
Mar
ket
kn
owle
dg
e4.
32.
81
11.
23
4.5
1.3
15.
6M
ult
i-li
ng
ual
4.3
21
11.
13.
64.
51.
21
5.1
Qu
alit
yco
ntr
olk
now
led
ge
2.6
3.1
1.9
1.5
2.9
3.8
4.3
1.1
12.
9T
ech
nic
alap
titu
de
4.1
3.6
2.9
1.9
3.2
2.8
4.1
1.3
15.
2
Table IV.
QAE16,1
50

QFD language) into critical elements (called “How’s” in the QFD language). The criticalelements are placed at the top of the HOQ and, in this application, represent theactivities of the ideal academic program. In order to determine the relationship between“what’s” and “how’s”, researchers asked the question, “If this is what the customerrequires, how can we cover and measure it in the academic program?”
In the critical matrix, these critical elements are divided into the five areasmentioned earlier: Accounting, Marketing, Management, Quantitative Analysis,Supply Chain Management and Information Systems.
Ranking the critical elements. The “roof” of the HOQ indicates the synergistic natureof the new proposed courses. They are used to identify courses that are highlycorrelated, but also, courses that may detrimental to other courses. In the design of thesupply chain management academic program, there were no such courses limiting thesuccess of other courses
Establishing correlations between customer and critical elements. An analysis ofcustomer expectations in each university selected for the benchmark analysis wasdeveloped in order to assess the relationship among customer expectations (potentialemployer’s requirements) and critical elements (Academic Program requirements).Table IV shows evidence of a strong relationship among Communications skills (6.0),Decision-making skills (5.9) and Knowledge of Asian Supply (5.8).
Notice that the value in parentheses represents the overall importance that definesthe strength of the relationship between all the variables and relations in the matrix.This means that if the customers (potential employers) are looking for special skills inAsian market knowledge, communication abilities and decision making thinking whenthey hire professionals in the area of supply chain management, then satisfying thecritical elements mentioned above will satisfy part of the customer skills requirement.
Developing and analyzing the house of quality. The HOQ matrix (the planningmatrix) fully depicts all the customer expectations (What’s) and critical elements(How’s) and provides information useful in determining which courses or areas areimportant in meeting the demands of the customers. It creates a set of priorities for thecustomer expectations based on their importance to the customer and their importanceto the development team’s organization. This set of priorities will have a major impacton all future planning and development activities. As can be shown in Figure 4,universities need to enhance all academic requirements because, in all cases, thecustomer evaluations are under the average and behind of the Goal (performance gap).The HOQ provides important information about what areas need to be improved.Using the improvement factor it is easy to understand that currently the CofC has aslight advantage if we compare it to other universities in the area of bilingual skills ofstudents. The CofC is a Public Art and Sciences University with a strong liberal artstradition. One of the strengths of the College is the availability of courses in differentlanguages. In fact, students must complete two years of a foreign language as part oftheir academic curriculum. For this reason, this area or customer requirement requiresless improvement than the remaining customer expectations. The matrix also showsthat CofC’s proposed program does not yet has any sales points (sales point is theability to sell product or service, based on how well each customer need or expectationis met). Moreover, the HOQ shows that improvements are needed in all the customerexpectations. These customer expectations received the lowest evaluations in thecompetitive analysis and should be addressed in order to satisfy customer
SCM academiccurriculum
51

Figure 4.Planning matrix
QAE16,1
52

expectations. The latter is an expected result because COFC does not yet have theofficial program in supply chain management.
The HOQ also provides information about the evaluation of the critical elements.The following “How’s” were found to be the most important and need to be consideredon the final action plans: courses in the areas of Supply Chain Management (AdvancedLogistics strategy (294.4), Introduction to Logistics Management (269.8), Introductionto Supply Chain management (269.8), Issues in Operations and Supply ChainManagement (269.8)).
Analysis of the house of quality from the benchmarking perspective. This sectionprovides a summary of the benchmarking results by area. The benchmarking wasdone with comparable universities for the COFC, including: University of Tennessee,Southern University, University of North Texas and Maryland University (ranked inRutner and Fawcett, 2005). The best academic program in SCM from the fouruniversities is the University of Tennessee. The research team divided the skills intofour areas in order to evaluate each area in each university. According to thisdistribution, University of Tennessee obtained a global average in analytical skills of3.96, in management skills of 3.725, in supply chain management of 4.1 and in otherspecific areas of 2.08. All benchmarked universities had low values in other specificareas. This is because they involve some of the unique customer expectations that havenot been fulfilled yet in the market of supply chain management programs. Theseunique customer expectations include knowledge of Asian supply, global knowledgeand certification. Therefore, these are areas for creating competitive advantage
According to Table V, the performance of University of North Texas Program islagging the other programs and needs an improvement in all of the activities and allareas in order to compete with the other universities close to its campus in Denton, TX.
It is important to mention that the “others specific skills area” in all the cases is thearea with lower evaluation by the practitioners and potential employers. As mentionedbefore, the requirements are new due to new market trends generally, and newopportunities specifically within Asia. In summary, the academic program with theoverall highest performance is University of Tennessee (3.61), followed by MarylandUniversity Academic Program (3.25), Southern University (2.99), and University ofNorth Texas (2.60). This information can be graphically observed for all academicprograms in Figure 5.
Developing action plansThe present study indicates that five major action plans should be implemented inorder to satisfy customer expectations:
(1) focus on a program that involves more analytical skills;
(2) increase the number of courses related to global issues (Asian Markets, Asiansupply, international certification, etc.);
(3) promote bilingual classes and study abroad programs to students in the SupplyChain Management major;
(4) have a balance among the five areas selected by the customers (accounting,management, quantitative, supply chain management and managementinformation systems); and,
(5) create continuous improvement teams that evaluate customer expectations andthe competitions performance (benchmarking) periodically.
SCM academiccurriculum
53

Ben
chm
ark
ing
anal
ysi
sA
ver
age
cust
omer
imp
orta
nce
Un
iver
sity
ofT
enn
esse
eS
outh
ern
Un
iver
sity
Nor
thT
exas
Un
iver
sity
Mar
yla
nd
Un
iver
sity
An
aly
tica
lsk
ills
An
aly
sis
skil
ls4.
24.
23.
53.
13.
8D
eeci
sion
mak
ing
skil
ls4.
43.
93.
53.
33.
6F
inan
cial
kn
owle
dg
e3.
64.
13.
53.
33.
8F
orec
asti
ng
skil
ls3.
64
3.6
3.2
3.8
Tec
hn
ical
apti
tud
e4.
13.
62.
91.
93.
2A
ver
age
3.98
3.96
3.4
2.96
3.64
Man
agem
ent
skil
lsM
anag
emen
tsk
ills
3.7
43.
23
3.5
Bu
sin
ess
stra
teg
ysk
ills
4.1
4.1
32.
93.
6L
ead
ersh
ipsk
ills
3.9
3.8
3.2
2.6
3.5
Info
rmat
ion
syst
ems
skil
ls3.
83.
83.
83
3.8
Tea
mw
ork
skil
ls4.
33.
83.
42.
93.
6C
omm
un
icat
ion
skil
ls4.
53.
22.
82.
53
Cu
stom
ersa
tisf
acti
onk
now
led
ge
44
3.7
3.1
3.8
Qu
alit
yco
ntr
olk
now
led
ge
2.6
3.1
1.9
1.5
2.9
Av
erag
e3.
863
3.72
53.
125
2.68
83.
463
Su
pp
lych
ain
man
agem
ent
skil
lsL
ogis
tics
kn
owle
dg
e4.
34.
13.
52.
63.
8P
urc
has
ing
kn
owle
dg
e4.
14.
13.
62.
83.
9P
rocu
rem
ent
kn
owle
dg
e3.
54.
23.
42.
93.
9R
etai
lin
gsk
ills
2.6
4.1
3.6
33.
9N
egot
iati
onsk
ills
3.9
3.9
3.3
2.9
3.4
Inv
ento
rysk
ills
and
kn
owle
dg
e3.
84.
13
2.5
3.2
Cu
stom
erre
lati
onsh
ipsk
ills
4.2
43.
63.
43.
8P
rod
uct
ion
and
oper
atio
ns
kn
owle
dg
e3.
74.
23.
52.
83.
8S
up
ply
chai
nm
anag
emen
tk
now
led
ge
4.1
4.2
3.6
33.
8S
up
pli
erre
lati
ons
kn
owle
dg
e3.
94.
13.
53.
13.
8A
ver
age
3.81
4.1
3.46
2.9
3.73
Oth
ersp
ecifi
csk
ills
Bil
ing
ual
skil
ls4.
32
11
1.1
Kn
owle
dg
eof
Asi
ansu
pp
ly4.
51
11
1C
erti
fica
tion
kn
owle
dg
e4.
21
11
1G
lob
alk
now
led
ge
3.8
3.6
3.1
2.9
3.4
Mar
ket
kn
owle
dg
e4.
32.
81
11.
2A
ver
age
4.22
2.08
1.42
1.38
1.54
Table V.Benchmarking analysis
QAE16,1
54

In order to achieve the previous action plans, a new academic program is depicted inFigure 6. As shown, the major in supply chain management requires 54 hrs, and all theexpectations are satisfied with the new program.
Conclusions and recommendationsThis research has several important contributions. First, it suggests a useful solutionto the design of academic programs, where all the expectations of potential employerscan be satisfied. Second, it presents a methodology for analyzing customerexpectations. Finally, it opens the window for future research in the area to includethe uses of innovative tools to solve real problems.
The application of QFD and benchmarking as a joint analysis tool is a veryinteresting approach because the information is analyzed from different perspectivessimultaneously. In addition, the resulting outcome from the QFD/benchmarkinganalysis is an academic programme which embraces customer expectations and therequirements that potential employers are looking for. Determining detailed skills forfuture professionals in the area of supply chain management reduces the potentialtraining costs for companies and reduces the gap between academia and business.
With the outcomes produced by this methodology, academic institutions’ decisionmakers can now have specific suggestions on which to base decisions regarding themost appropriate courses and potential student profiles. Areas designated as highlyimportant for performance standards improvements can easily be pinpointed andaddressed.
In today’s competitive world, customer satisfaction is a vital goal to beaccomplished at an affordable cost. One important factor in customer satisfaction isthe effective identification of customer expectations. This paper illustrates the use of anapproach that takes advantage of benchmarking/QFD analysis in order to design an
Figure 5.Performance by skills
requirement and byuniversity
SCM academiccurriculum
55

Figure 6.Supply chain managementacademic program
QAE16,1
56

academic programme that satisfies the real needs of the market in the area of supplychain management.
While this study demonstrates the effectiveness of the applications of thesetechniques to applied academic areas, the use of this approach can clearly be extendedto other areas for the design of specific courses. The most important of these is toclarify who the customers are and what their expectations are. Future research canbenefit from this research by: expanding the scope from academic programmes toindustrial applications in order to comparatively analyze the applicability of theproposed tools; and applying the same methodology to other areas of academia such asresearch, for developing a model for the identification of customers, (student) needs andpotential solutions.
Glossary of terms
QFD Quality Function Deployment
VOC Voice of the Customer
CWQ Customer Windows Quadrant
SCM Supply Chain Management
TQM Total Quality Management
HOQ House of Quality
CofC College of Charleston
DARP Dynamic Analysis Reduction Process
ISM Institute of Supply Chain Management
References
Adkins, N. and Radtke, R.R. (2004), “Students’ and faculty members’ perceptions of theimportance of business ethics and accounting ethics education: is there an expectationgap?”, Journal of Business Ethics, Vol. 51 No. 3, pp. 279-300.
Akao, Y. (1972), “New product development and quality assurance – quality deploymentsystem”, Standardization and Quality Control, Vol. 25 No. 4, pp. 7-14.
Akao, Y. and Mazur, G. (2003), “The leading edge in QFD: past, present and future”, InternationalJournal of Quality & Reliability Management, Vol. 20 No. 1, pp. 20-35.
Akao, Y., Nagai, K. and Maki, N. (1996), “QFD concept for improving higher education”,Proceedings of the 50th ASQC Quality Congress, Chicago, IL, pp. 12-20, Chicago, IL.
Andersen, B. and Camp, R. (1995), “Current position and future development of benchmarking”,TQM Magazine, Vol. 7 No. 5, pp. 21-5.
Ayse, A. and Veli, D. (2005), “Quality function deployment in education: a curriculum review”,Quality and Quantity, Vol. 39 No. 4.
Bennett, R. (2003), “Determinants of undergraduate student drop out rates in a universitybusiness studies department”, Journal of Further and Higher Education, Vol. 27 No. 2,pp. 123-39.
SCM academiccurriculum
57

Cadogan, J.W., Diamantopoulos, A. and Mortanges, C.P. (1999), “A measure of export marketorientation: scale development and cross-cultural validation”, Journal of InternationalBusiness Studies, Vol. 30 No. 4, pp. 689-96.
Chang, I.-F. and Ku, A.C.-H. (1995), Engineering and Technical Education in Taiwan: Anobservation based on TQM Concept, ASEE, Atlanta, GA.
Chen, C. and Bullington, S.F. (1993), “Development of a strategic research plan for an academicdepartment through the use of quality function deployment”, Computers & IndustrialEngineering, Vol. 25 Nos 1-4, pp. 49-52.
Choon, T.K., Lyman, S.B. and Wisner, J.D. (2002), “Supply chain management: a strategicperspective”, International Journal of Operations & Production Management, Vol. 22 No. 6,pp. 614-31.
Clayson, D.E. and Haley, D.A. (2005), “Marketing models in education: students as customers,products, or partners”, Marketing Education Review, Vol. 15 No. 1, pp. 1-10.
Clayton, M. (1993), “Treading the quality path: a progress report from Aston University”, inPaper, D.W. (Ed.), Quality Management in Universities, Australia Government PublishingService, Canberra.
Duffuaa, S., Al-Turki, U. and Hawsawi, F. (2003), “Quality function deployment for designing abasic statistics course”, International Journal of Quality & Reliability Management, Vol. 20No. 6.
Ellram, L.M. and Carr, A. (1994), “Strategic purchasing: a history and review of the literature”,International Journal of Purchasing & Materials Management, Vol. 30 No. 2, pp. 10-18.
Ermer, D.S. (1995), “Using QFD becomes an educational experience for students and faculty”,Quality Progress, May, pp. 131-6.
Forrester, J. (1961), Industrial Dynamic, Productivity Press Inc., Portland, OR.
Franceschini, F. and Rossetto, S. (1995), “QFD: the problem of comparing technical/engineeringdesign requirements”, Research in Engineering Design, Vol. 7 No. 4, pp. 270-8.
Gonzalez, M. (2001), Quality Function Deployment; A Road for Listening to CustomerExpectations, McGraw Hill, Mexico City.
Gonzalez, M., Quesada, G. and Bahill, T. (2003), “Improving product design using qualityfunction deployment: the school furniture case in developing countries”, QualityEngineering Journal, Vol. 16 No. 1, pp. 47-58.
Gonzalez, M., Quesada, G., Mack, R. and Urrutia de Hoyos, I. (2005), “Building an activity-basedcosting hospital model using quality function deployment and benchmarking”,Benchmarking: an International Journal, Vol. 12 No. 4, pp. 310-29.
Gonzalez, M., Quesada, G., Mueller, R.D. and Mora-Monge, C. (2004), “QFD strategy house: aninnovative tool for linking marketing and manufacturing strategy”, Marketing Intelligenceand Planning, Vol. 22 No. 3, pp. 335-48.
Griffin, A., Gleason, G., Preiss, R. and Shevenaugh, D. (1995), “Best practice for customersatisfaction in manufacturing firms”, Sloan Management Review, Vol. 36 No. 2, pp. 87-98.
Harland, C.M. (1996), “Supply chain management: relationships, chains and networks”, BritishJournal of Management, Vol. 7 No. 1, pp. 63-80.
Hauser, J.R. and Clausing, D.M.-J. (1988), “The House of Quality”, Harvard Business Review,May-June, pp. 63-73.
Hokey, M., Amitava, M. and Sharon, O. (1997), “Competitive benchmarking of health care qualityusing the AHP: an example from Korean cancer clinic”, Socio-Economic Planning Sciences,Vol. 31 No. 2, pp. 147-59.
QAE16,1
58

Hwarng, B. and Teo, C. (2001), “Translating customers’ voices into operations requirements: aQFD application in higher education”, International Journal of Quality and ReliabilityManagement, Vol. 18 No. 2, pp. 195-225.
Intel (Ed.) (2002), Customer Window Quadrant, Intel, Tucson, AZ.
Jae, K.K., Chang, H.H., Sang, H.C. and Soung, H.K. (1998), “A knowledge-based approach to thequality function deployment”, Computers & Industrial Engineering, Vol. 35 Nos 1-2,pp. 223-36.
Jaraiedi, M. and Ritz, D. (1994), “Total quality management applied to engineering education”,Quality Assurance in Education, Vol. 2 No. 1, pp. 32-40.
Jeong, M. and Oh, H. (1998), “Quality function deployment: an extended framework for servicequality and customer satisfaction in the hospitality industry”, International Journal ofHospitality Management, Vol. 17 No. 4, pp. 375-90.
Koksal, G. and Alpay, E. (1998), “Planning and design of industrial engineering educationquality”, Computers & Industrial Engineering, Vol. 35 Nos 3-4, pp. 639-42.
Krishnan, M. and Houshmand, A.A. (1993), “QFD in academia: addressing customerrequirements in the design of engineering curricula, Fifth Symposium on QualityFunction Deployment, November, MI.
Lam, K. and Zhao, X. (1998), “An application of quality function deployment to improve thequality of teaching”, International Journal of Quality & Reliability Management, Vol. 15No. 4, pp. 389-413.
Leenders, M.R., Nollet, J. and Ellram, L. (1994), “Adapting purchasing to supply chainmanagement”, International Journal of Physical Distribution & Logistics Management,Vol. 24 No. 1, pp. 40-2.
Lynne, E. and Brennan, R. (2007), “Are students customers? TQM and marketing perspectives”,Quality Assurance in Education, Vol. 15 No. 1, pp. 44-60.
Motwani, J., Kumar, A. and Mohamed, Z. (1996), “Implementing QFD for improving quality ineducation: an example”, Journal of Professional Services Marketing, Vol. 14 No. 2,pp. 149-59.
Murgatroyd, S. (1993), “The house of quality: using QFD for instructional design in distanceeducation”, The American Journal of Distance Educaction, Vol. 7 No. 2, pp. 34-48.
Owlia, M.S. and Aspinwall, E.M. (1998), “Application of quality function deployment for theimprovement of quality in an engineering department”, European Journal of EngineeringEducation, Vol. 23 No. 1, pp. 105-15.
Peters, T. (1988), “Facing up to the need for a management revolution”, California ManagementReview, Vol. 30, pp. 8-38.
Pitman, G., Motwani, J., Kumar, A. and Cheng, C.H. (1995), “QFD application in an educationalsetting: a pilot field study”, International Journal of Quality & Reliability Management,Vol. 12 No. 6, pp. 63-72.
Porter, M. (1994), “International business benchmarking”, Management Services, Vol. 38 No. 10,pp. 6-8.
Pun, K.F., Chin, K. and Lau, H. (2000), “A QFD/Hoshin approach for service quality deployment:a case study”, Managing Service Quality, Vol. 10 No. 3, pp. 156-70.
Quesada, G. (1999), “A comparative study of quality practices and results in Taiwan, Mexico andCosta Rica”, unpublished thesis, The University of Toledo, Toledo, OH.
Rogers, R.E. (1993), “Managing for quality: current differences between Japanese and Americanapproaches”, National Productivity Review, Vol. 12 No. 4, pp. 503-17.
SCM academiccurriculum
59

Rosenkrantz, P.R. (1996), “Using TQM techniques for curriculum development: developing themanufacturing engineering curriculum at Cal. Poly, Pomona”, Annual Quality CongressTransactions, ASQC Quality Press, Milwaukee, WI, pp. 29-37.
Rutner, S. and Fawcett, D. (2005), “The state of supply chain education”, Supply ChainManagement Review, Vol. 4 No. 4, pp. 55-60.
Schmidt, J.A. (1992), “The link between benchmarking and shareholder value”, Journal ofBusiness Strategy, Vol. 13 No. 3, pp. 7-12.
Seow, C. and Moody, T. (1996), “QFD as a tool for better curriculum design”, Milwaukee, WI.
Stuart, F.I. and Tax, S.S. (1996), “Planning for service quality: an integrative approach”,International Journal of Service Industry Management, Vol. 7 No. 4, pp. 58-77.
Trappey, C.V., Trappey, A.J. and Hwang, S.-J. (1996), “A compututerized quality functiondeployment approach for retail services”, Computers & Industrial Engineering, Vol. 30No. 4, pp. 611-22.
Whymark, J. (1998), “Benchmarking and credit risk management in financial services”,Benchmarking Quality Management Technology, Vol. 5 No. 2, pp. 126-37.
Woodburn, D.T. (1999), “Benchmarking marketing processes for performance improvement: anew approach from the Chartered Institute of Marketing”, Journal of MarketingManagement, Vol. 15 No. 8, pp. 779-98.
Further reading
Benjamin, C.O. and Pattanapanchai, S. (1993), “A QFD framework for developing engineeringlaboratories”, International Journal of Applied Engineering Education, Vol. 9 No. 5,pp. 422-9.
Tan, K.C., Lyman, S.B. and Wisner, J.D. (2002), “Supply chain management: a strategicperspective”, International Journal of Operations & Production Management, Vol. 22 No. 6,pp. 614-31.
Corresponding authorMarvin E. Gonzalez can be contacted at: [email protected]
QAE16,1
60
To purchase reprints of this article please e-mail: [email protected] visit our web site for further details: www.emeraldinsight.com/reprints