q4fy14 results - pelgel.com · however, we are seeing revival in demand for detonator now and...
TRANSCRIPT

- on an explosive journey
Q4FY14 Results
1
2
1. Financial Performance
2. Business divisions
3. Business model – revenue mix set to change
4. About PEL
Contents

3
1. Financial Performance
2. Business divisions
3. Business model – revenue mix set to change
4. About PEL
Contents

Business performance - I The company continued to enjoy strong growth in revenues at 14.8% YoY for Q4FY14
Operating margins were 7.3% in Q4FY14, a drop of 420bps on account of drop in detonator prices
due to sluggish demand caused by extended monsoons, restrictions on movement of explosives during general elections and higher repairs cost on Service contracts
However, we are seeing revival in demand for detonator now and expect prices to rise
Revenue growth in explosives was 3.8% YoY, while defence products showed an impressive rise of 90.8% YoY (56.5% QoQ). PEL registered highest ever defence products turnover in Q4FY14
4
Revenues (INR mn) Q4FY14 Q4FY13 YoY (%) Q3FY14 QoQ (%)
Explosives 279.4 269.1 3.8% 225.6 23.8%
Defence products 97.5 51.1 90.8% 62.3 56.5%
Services 34.2 37.9 -9.7% 43.9 -22.1%
Wind power 0.5 0.4 20.0% 0.7 -23.7%
Total 411.6 358.5 14.8% 332.5 23.8%

Business performance - II For FY14, the topline performance was impressive with 33% YoY growth
Defence products were the key driver of overall revenues, and revenue growth in defence products
was 97% YoY. On a full year basis, PEL achieved highest ever defence products turnover
Operating margins for FY14 stood at 11.2% and PAT margins were at 6.3%
Any revival in demand from mining sector and further growth in sales of defence products can enable margin improvement in FY15
5
Revenues (INR mn) FY10 FY11 FY12 FY13 FY14
Explosives 738.8 731.4 849.7 805.0 1026.0
Defence products 52.4 89.9 89.1 136.1 267.9
Services 97.2 117.6 129.2 141.7 146.5
Windpower 0.5 4.9 5.4 5.5 6.7
Total
888.9
943.8
1073.5
1088.4
1447.1
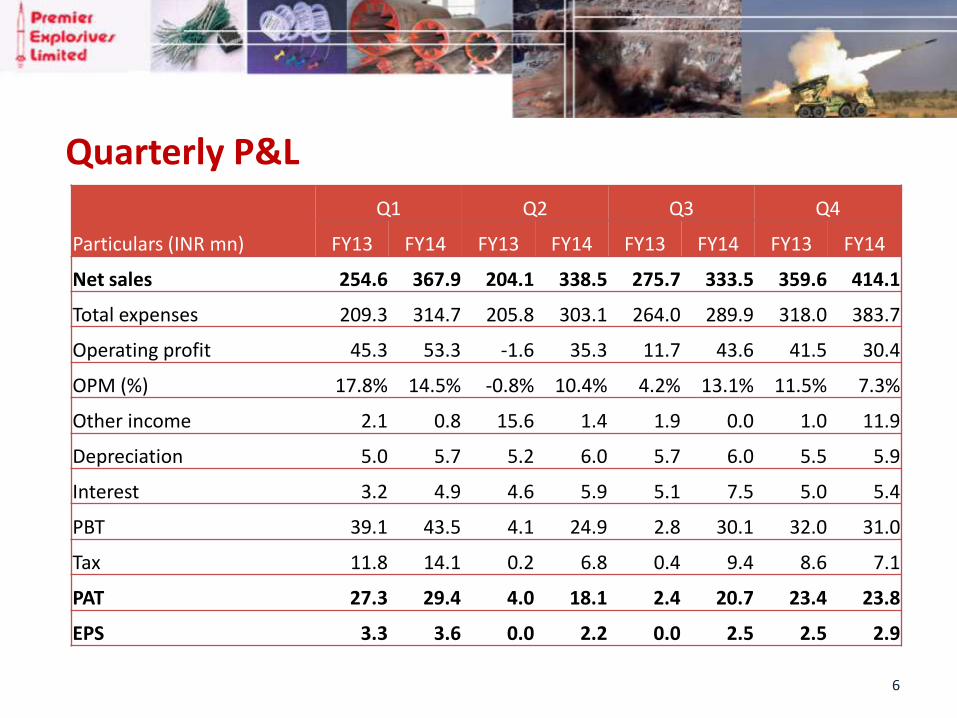
Quarterly P&L
6
Particulars (INR mn)
Q1 Q2 Q3 Q4
FY13 FY14 FY13 FY14 FY13 FY14 FY13 FY14
Net sales 254.6 367.9 204.1 338.5 275.7 333.5 359.6 414.1
Total expenses 209.3 314.7 205.8 303.1 264.0 289.9 318.0 383.7
Operating profit 45.3 53.3 -1.6 35.3 11.7 43.6 41.5 30.4
OPM (%) 17.8% 14.5% -0.8% 10.4% 4.2% 13.1% 11.5% 7.3%
Other income 2.1 0.8 15.6 1.4 1.9 0.0 1.0 11.9
Depreciation 5.0 5.7 5.2 6.0 5.7 6.0 5.5 5.9
Interest 3.2 4.9 4.6 5.9 5.1 7.5 5.0 5.4
PBT 39.1 43.5 4.1 24.9 2.8 30.1 32.0 31.0
Tax 11.8 14.1 0.2 6.8 0.4 9.4 8.6 7.1
PAT 27.3 29.4 4.0 18.1 2.4 20.7 23.4 23.8
EPS 3.3 3.6 0.0 2.2 0.0 2.5 2.5 2.9

Profit & Loss – Key indicators
7
Particulars (INR mn) FY12 FY13 FY14
Net sales 1083.2 1094.0 1454.0
Growth in net sales (%) 14.8% 1.0% 32.9%
Operating profit 174.9 97.7 162.6
OPM (%) 16.1% 8.9% 11.2%
Other income 17.0 20.6 14.1
Depreciation 18.7 21.5 23.5
Interest 11.2 18.8 23.6
PBT 162.0 78.1 129.6
PBT (%) 15.0% 7.1% 8.9%
Tax 46.5 21.0 37.4
PAT 115.5 57.1 92.1
PAT (%) 10.7% 5.2% 6.3%
EPS 14.2 7.0 11.0
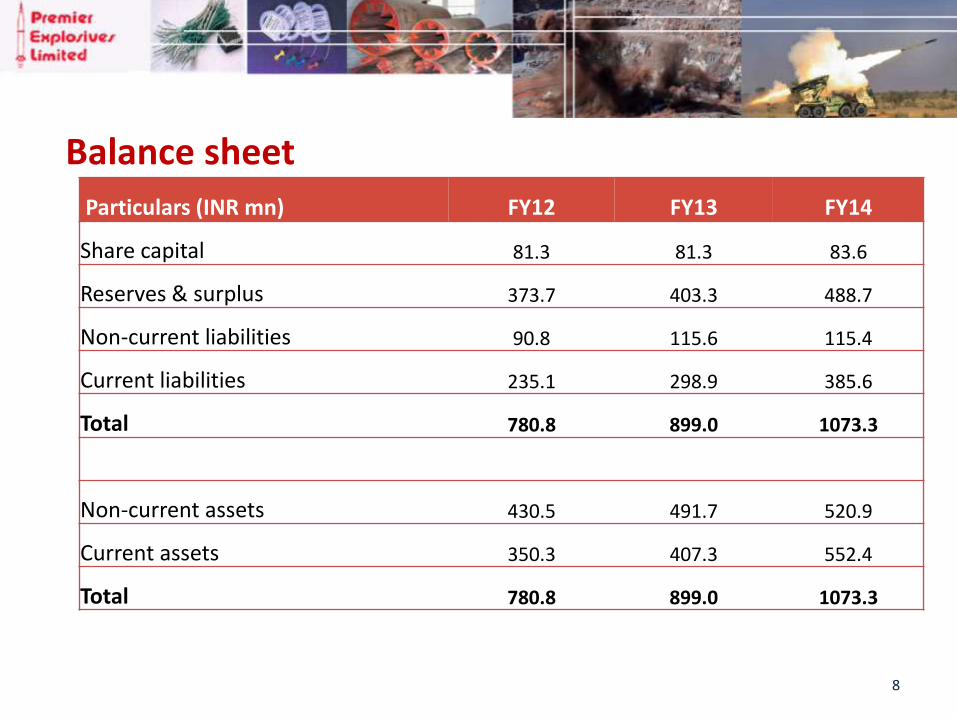
Balance sheet
8
Particulars (INR mn) FY12 FY13 FY14
Share capital 81.3 81.3 83.6
Reserves & surplus 373.7 403.3 488.7
Non-current liabilities 90.8 115.6 115.4
Current liabilities 235.1 298.9 385.6
Total 780.8 899.0 1073.3
Non-current assets 430.5 491.7 520.9
Current assets 350.3 407.3 552.4
Total 780.8 899.0 1073.3

Performance snapshot
9
1083 1094
1454
0
400
800
1200
1600
FY12 FY13 FY14
Net Sales INR mn
16.1%
8.9% 11.2%
0.0%
4.0%
8.0%
12.0%
16.0%
20.0%
0
40
80
120
160
200
FY12 FY13 FY14
Operating profit (LHS) OPM (%)
INR mn
10.7%
5.2% 6.3%
2.0%
4.0%
6.0%
8.0%
10.0%
12.0%
0
40
80
120
FY12 FY13 FY14
PAT (LHS) PATM (%) INR mn
35%
18% 25% 25%
12% 16%
0%
10%
20%
30%
40%
FY12 FY13 FY14
RoCE RoE
* FY13: The drop in performance was due to an accident at the detonator plant

10
1. Financial Performance
2. Business divisions
3. Business model – revenue mix set to change
4. About PEL
Contents

Business divisions – Civil applications
11
Civil applications
Mining
Bulk explosives
Cartridge explosives
Cast booster
Emulsion booster
Detonators
Detonating fuse
Shock tube
Non-mining
Riot control devices
Cloud harvesting flares
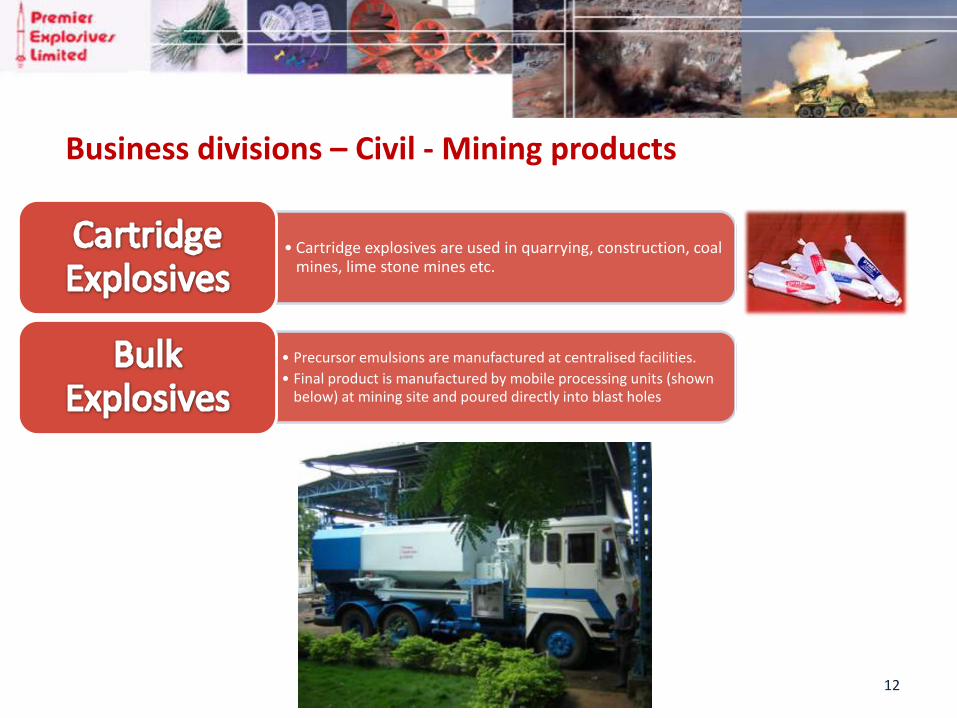
Business divisions – Civil - Mining products
12
• Cartridge explosives are used in quarrying, construction, coal mines, lime stone mines etc.
• Precursor emulsions are manufactured at centralised facilities.
• Final product is manufactured by mobile processing units (shown below) at mining site and poured directly into blast holes
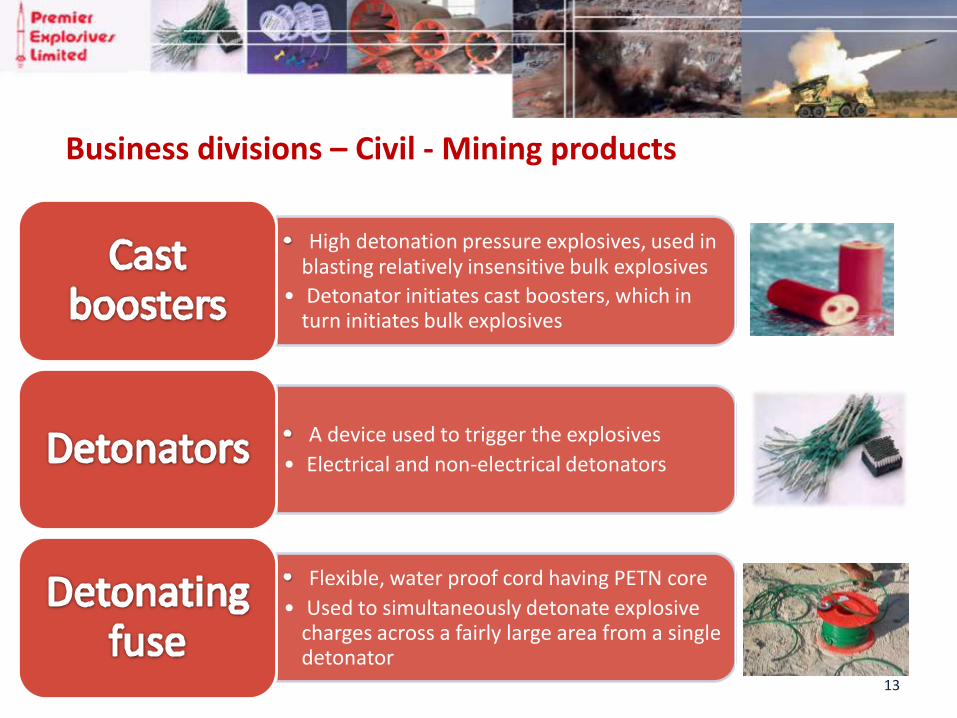
Business divisions – Civil - Mining products
13
High detonation pressure explosives, used in blasting relatively insensitive bulk explosives
• Detonator initiates cast boosters, which in turn initiates bulk explosives
A device used to trigger the explosives
• Electrical and non-electrical detonators
Flexible, water proof cord having PETN core
• Used to simultaneously detonate explosive charges across a fairly large area from a single detonator

14
PEL manufactures entire range of explosives and accessories
PEL derives demand for explosives mainly from core sectors such as mining
coal, iron ore, lime stone which inturn are driven by demand from power and infrastructure sectors.
Share of explosives and detonators in PEL’s revenue mix at ~70%
PEL uses advanced chemical (NHN) for detonators vs. conventional primer (ASA) used by competitors. NHN is safer and environment-friendly
Indian industrial explosives market ~750,000 MT
PEL’s order book for mining products stands at INR640mn
Business divisions – Civil - Mining products
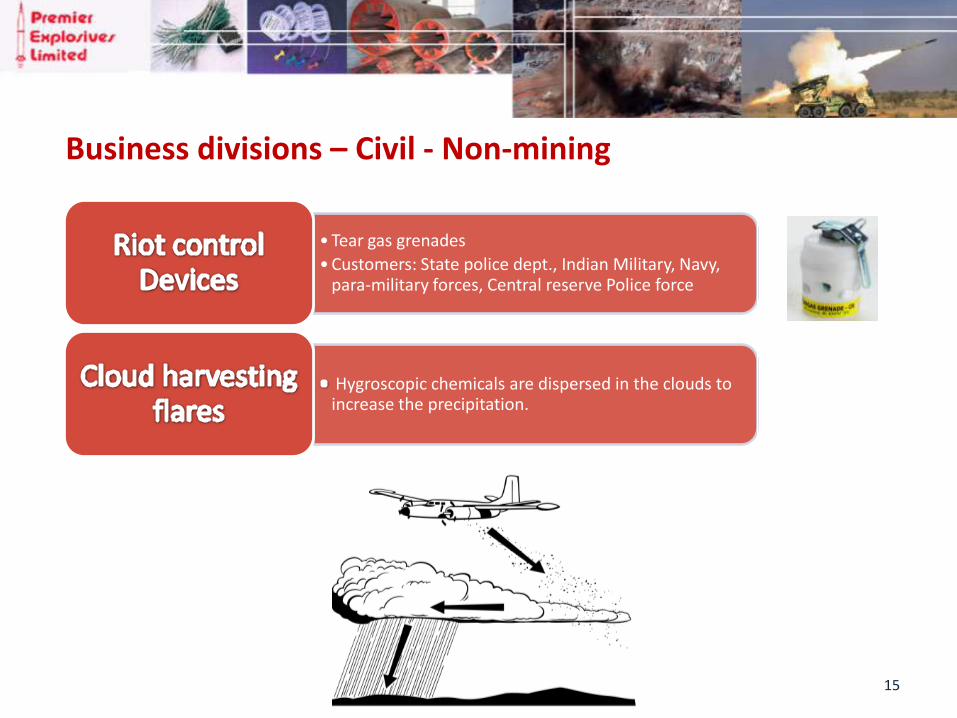
Business divisions – Civil - Non-mining
15
• Tear gas grenades
• Customers: State police dept., Indian Military, Navy, para-military forces, Central reserve Police force
Hygroscopic chemicals are dispersed in the clouds to increase the precipitation.

Business divisions – Defence & Space
16
Defence & Space applications
Propellants
Pyrogen igniters
Case-bonded propellants
Free standing grains
Fuel rich
Gas generators
Pyros
Pyro cartridges
Pyro actuators
Smoke / flash generators
IR generators
Specialized squibs
Explosives
CL - 20
HNS - IV
Explosive
bolts
BKNO3 Igniters

Business divisions – Defence & Space
17
Used in a propulsion systems for rockets and missiles
A pyro cartridge, is an electrical initiator, used to ignite the contents of the igniter for propellant combustion
Explosive bolts are meant for opening the front and rear covers of the transport and launch vehicles or disconnecting two parts.
Business divisions – Defence & Space
18
PEL manufactures high energy materials used as propellants in many prestigious Indian missiles
PEL is the only Indian private entity in the niche market of Solid propellants for defence use
PEL has been manufacturer-partner in various missile programs with: - Advanced Systems Laboratory, DRDO | Bharat Dynamics Ltd | Research Centre Imarat for various missile such as Akash, Astra and several Surface-to-Air Missiles
The share of defence products is the revenue mix is ~20%
Compared to the Explosives products, defence products have a superior margin profile
PEL has proved its capabilities in producing defence products and has bagged repeat orders
for solid propellants
With product approvals already in place, PEL has distinct edge over other private players who are looking to enter in the hi-tech business

Business divisions – Service contract
19
PEL derives ~10% revenue from service contracts with:
- Solid Propellant Plant and Solid Propellant Booster Plant of Satish Dhawan Space Centre SHAR, Sriharikota
- Solid Fuel Complex, Jagdalpur of Advanced Systems Laboratory (due for renewal in Oct. 2014)
With its technological ability, PEL is able to create this niche service offering and is able to generate recurring income from it
The contracts generally have a long term tenure of 5-10 years

20
1. Financial Performance
2. Business divisions
3. Business model – revenue mix set to change
4. About PEL
Contents

Defence products business – to propel growth
21
Defence indeginisation - 12th Five-year plan: To increase domestic procurement from 30% to 75%
- Raise FDI limit – currently at 26%
Defence offset policy: 30% domestic procurement for foreign orders above INR 3000mn
PEL has already entered in NDA, MOU and IOP with foreign suppliers
PEL has distinct ‘First mover advantage’ in terms of product approvals and R&D capabilities. High entry barriers for other players
Margin profile superior in Defence products vis-a-vis mining products

Conventional businesses – steadily growing
22
As per Planning Commission of India, the production of coal is expected to
reach 795mn tons by FY17 –
This translates to ~8% CAGR for coal mining as well as explosive manufacturers
The explosives market is highly competitive and tight on margins – yet PEL has strong order book
Improvement in outlook for infrastructure development and power sector – can act as demand drivers
Any revival in mining industry to further improve demand prospects. The lifting of mining ban in Goa & Karnataka is a positive indicator
PEL’s production capacities exceed current demand projections. No major capex required for explosives business in the near to medium term
New government’s plan of action
23
For defence sector: - Modernize armed forces, and increase the R&D in defence, with a goal of developing
indigenous defence technologies and fast tracking of defence purchases - To emerge as a global platform for defence hardware manufacture and software production - Encourage private sector participation and investment, including FDI in selected defence industries - Encourage domestic industry to have a larger share in design and production of military hardware and platforms for both domestic use and exports, in a competitive environment
For energy sector: - Focus on generation and distribution of power as a national security issue - Take Steps to increase the domestic coal exploration and production, to bridge the demand and supply gap
PEL is best placed to participate in the opportunities that will arise, especially in the defence products
* Source: BJP’s manifesto 2014

0%
20%
40%
60%
80%
100%
FY12 FY13 FY14
Explosives Defence products Services Windpower
Revenue mix set to change
24
The proportion of revenue from Defence products and Services (low competition-high margin) is expected to rise vis-a-vis proportion of revenues from Explosives (high competition-low margin), over the next three years
The change in revenue mix could lead to change in margin profile, as well
Total order book for FY15 stands at INR 1000mn, of which ~36% is contributed by Defence products and Service contracts
The revenue mix chart below shows rise in share of Defence products and Services from 20% in FY12 to 29% in FY14
29% 20% 26%
25
1. Financial Performance
2. Business divisions
3. Business model – revenue mix set to change
4. About PEL
Contents
Technology-minded management
26
Promoted by first-generation technocrat Dr. A.N.Gupta. M.E. (Mining Engineering) Recipient of ‘Pickering and ISM Medal’ from Indian School of Mines, Dhanbad
Executive Director – Mr. T.V.Chowdary, Chemical engineer with 31 years experience in production of chemicals, explosives and
solid propellants
Director (Marketing) – Mr. K.Chalil, AIME-Mining graduate with over 40 years of experience in major mining, quarrying and
explosive industries
Director (Production) – Dr. N.V.S Rao, M.Sc, Ph.D. (Chemistry) with 35 years of experience in production of explosives &
accessories and chemicals
Sharp research focus has lead PEL won several awards including the "Defence Technology Absorption Award 2007" from DRDO, presented by the Prime Minister of India
PEL is built on a strong foundation of research and innovation

27
1980
Company
incorporation &
Production of
high explosives
1984
Production of
Detonating
Fuse
1990
Production of
Detonators
1991
Production of
Emulsion Explosives 1993
DSIR recognition &
Listing on BSE
2001
ISO
2003
CE certification &
Production of
Pyrogen Igniters
2004
Product
Res & Dev
Centre
2005
Production of
Solid Propellants
2007
O & M contract - SHAR, Sriharikota
2009
Set up Windmill &
NABL accreditation
2011
O & M contract -
ARDE, Pune
2012
Solid Propellant Plant
for tactical missiles
2013 Switchover to
NHN detonators from ASA
2013
250 kw Solar Power plant setup
2014
Development of solid propellant for
long range missile
1975 1980 1985 1990 1995 2000 2005 2010 2015 2020
Milestones in
Premier's journey
2008
Defence
Technology
Absorption Award 2002
O&M contract - SFC,
Jagdalpur
1992
Production of
Bulk
Explosives 1997
Production of Shock
Tubes

Strategic presence across India
28
Peddakandukur (A.P.) Detonator, Detonating fuse,
Packaged explosives,
product research &
Special Products Divisions
Bulk Explosives Singrauli (Madhya Pradesh)
Chandrapur (Maharashtra)
Godavarikhani (Andhra Pradesh)
Manuguru (Andhra Pradesh)
Neyveli (Tamil Nadu)
Pushpathur (Tamil Nadu) Windmill
~1300 employees | ~100 engineers & scientists | ~500 trained in propellant production

For further queries: Premier Explosives Limited “Premier House”, 11, Ishaq Colony, (Near AOC Centre), Secunderabad – 500015. Contact No. : 040-66146824
S-Ancial Advisors Pvt. Ltd. 503, Gundecha Chambers, Nagindas Master Road, Fort, Mumbai 400 001 Email: [email protected] Contact No.: 022 6635 1001/2
29