q4/2014 indonesia mobile data report, based on mobomarket user data research
TRANSCRIPT

Q4 2014 INDONESIA MOBILE DATA
REPORT--Based on MoboMarket users data research

1. Overview
o Research background and data sampling
o Main conclusions
2. Mobile application distribution
o Apps download number and category
o Apps upgrade number and category
3. Equipment and behavior analysis
o Mobile phone screen resolution and size
o Indonesian active hour
o App download geographic distribution
Outlines

Overview
o Research background and data sampling
o Main conclusions

Research background and data sampling
o Based on MoboMarket Indonesian user data
MoboMarket is an Android app store developed by Baidu, introduced in Indonesia in February
2014. It is an app store in Indonesia to locally serve APP user and support APP developers.
2.88 million
monthly active users 517 thousand
apps listed in MoboMarket
265 million
2014Q4 downloads
o Data statistic report updated as Dec 2014 ( 3.73 million samples).
o The purpose for this research:
1. To unveil some insights on the current situation and the trend of the mobile market in Indonesia
2. To provide a picture of the mobile users behavior.
Main conclusions
TOP1. Game
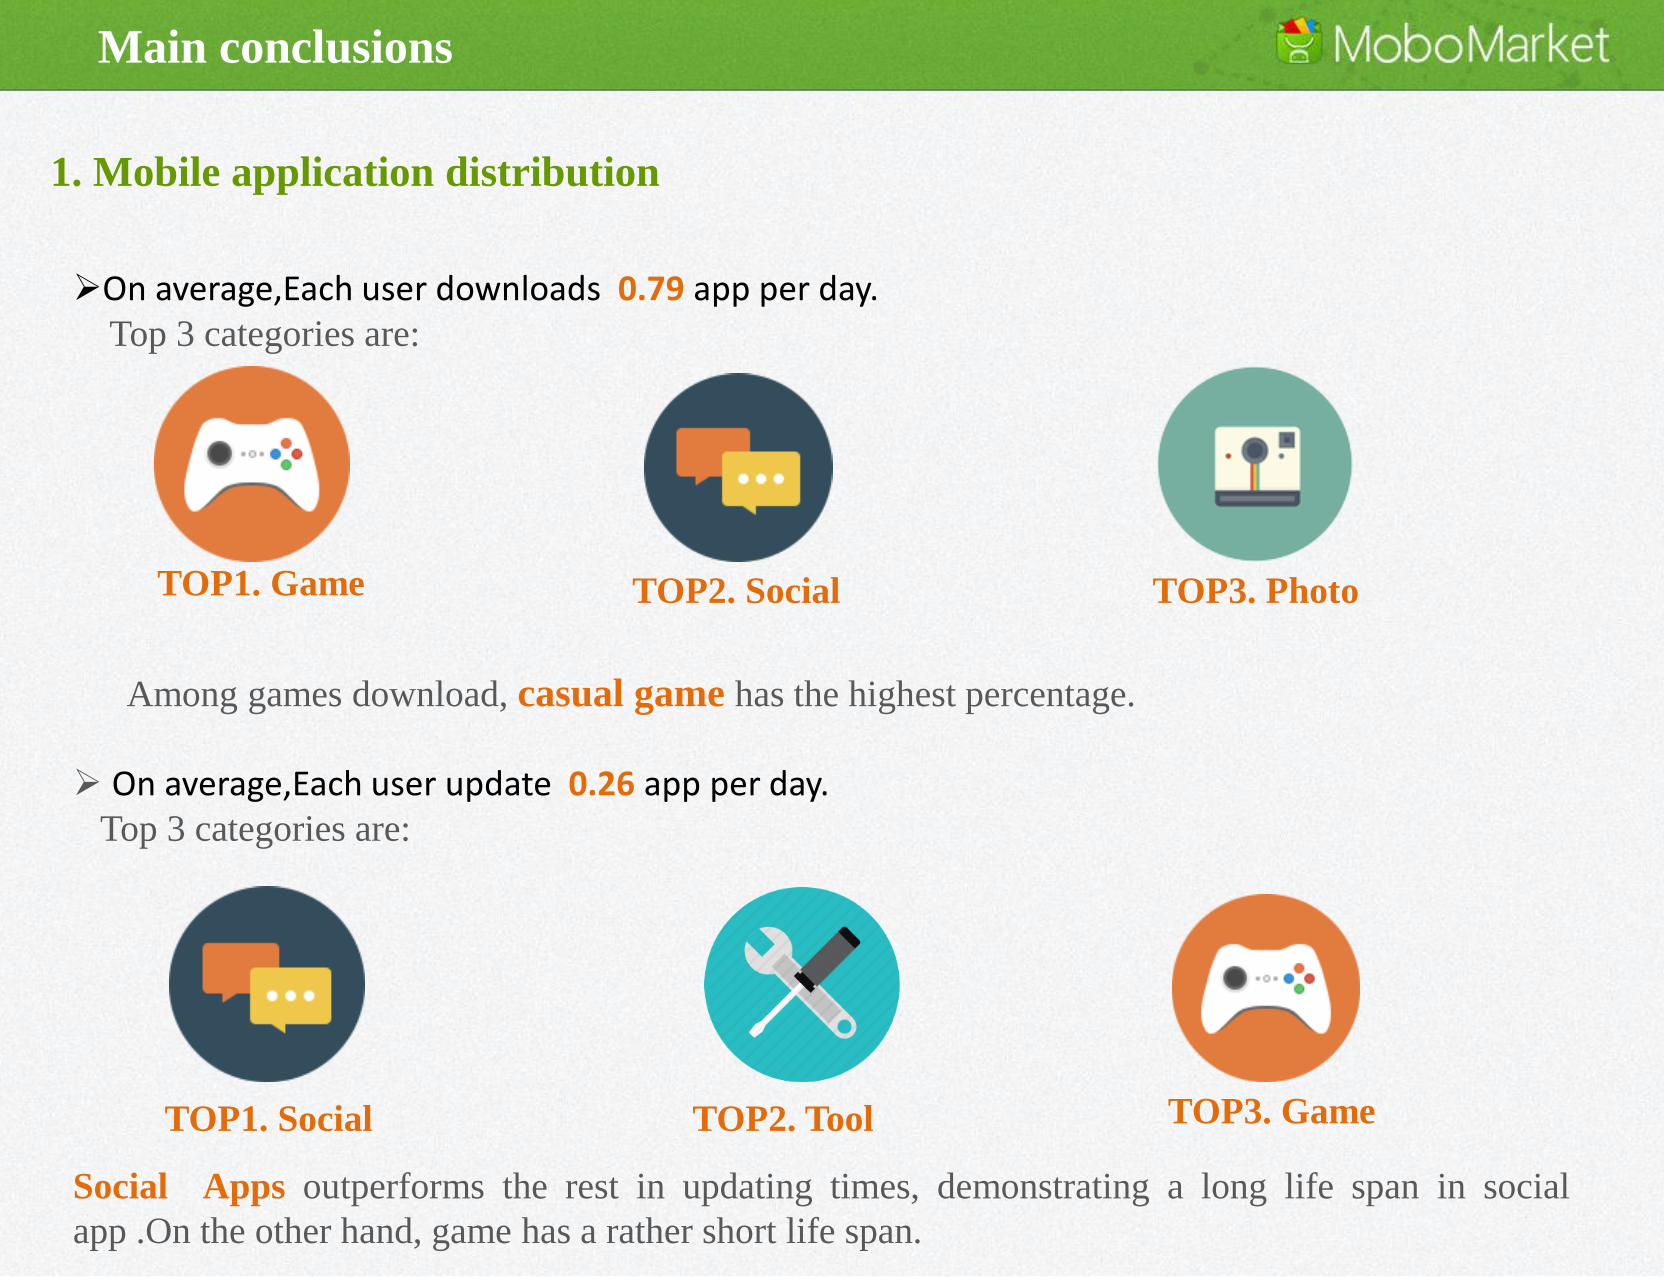
1. Mobile application distribution
TOP2. Social TOP3. Photo
On average,Each user downloads 0.79 app per day.Top 3 categories are:
Among games download, casual game has the highest percentage.
On average,Each user update 0.26 app per day.Top 3 categories are:
Social Apps outperforms the rest in updating times, demonstrating a long life span in social
app .On the other hand, game has a rather short life span.
TOP3. GameTOP1. Social TOP2. Tool

Main conclusions
TOP1. Game
1. Mobile application distribution
TOP2. Social TOP3. Photo
TOP3. GameTOP1. Social TOP2. Tool
o On average,Each user downloads 0.79 app per day.
Top 3 categories are :
Among games download, casual game has the highest percentage.
o On average,Each user update 0.26 app per day.
Top 3 categories are:
Social Apps outperforms the rest in updating times, demonstrating a long life span in social app .On the other hand, game has a rather short life span.

Main conclusions
2. Equipment and behavior analysis
800*480 /4 inch display has the
highest percentage
19:00 – 20:00 & 23:00 – 00:00Peak user active hour

Mobile application distribution
o Apps download number and category
o Apps upgrade number and category
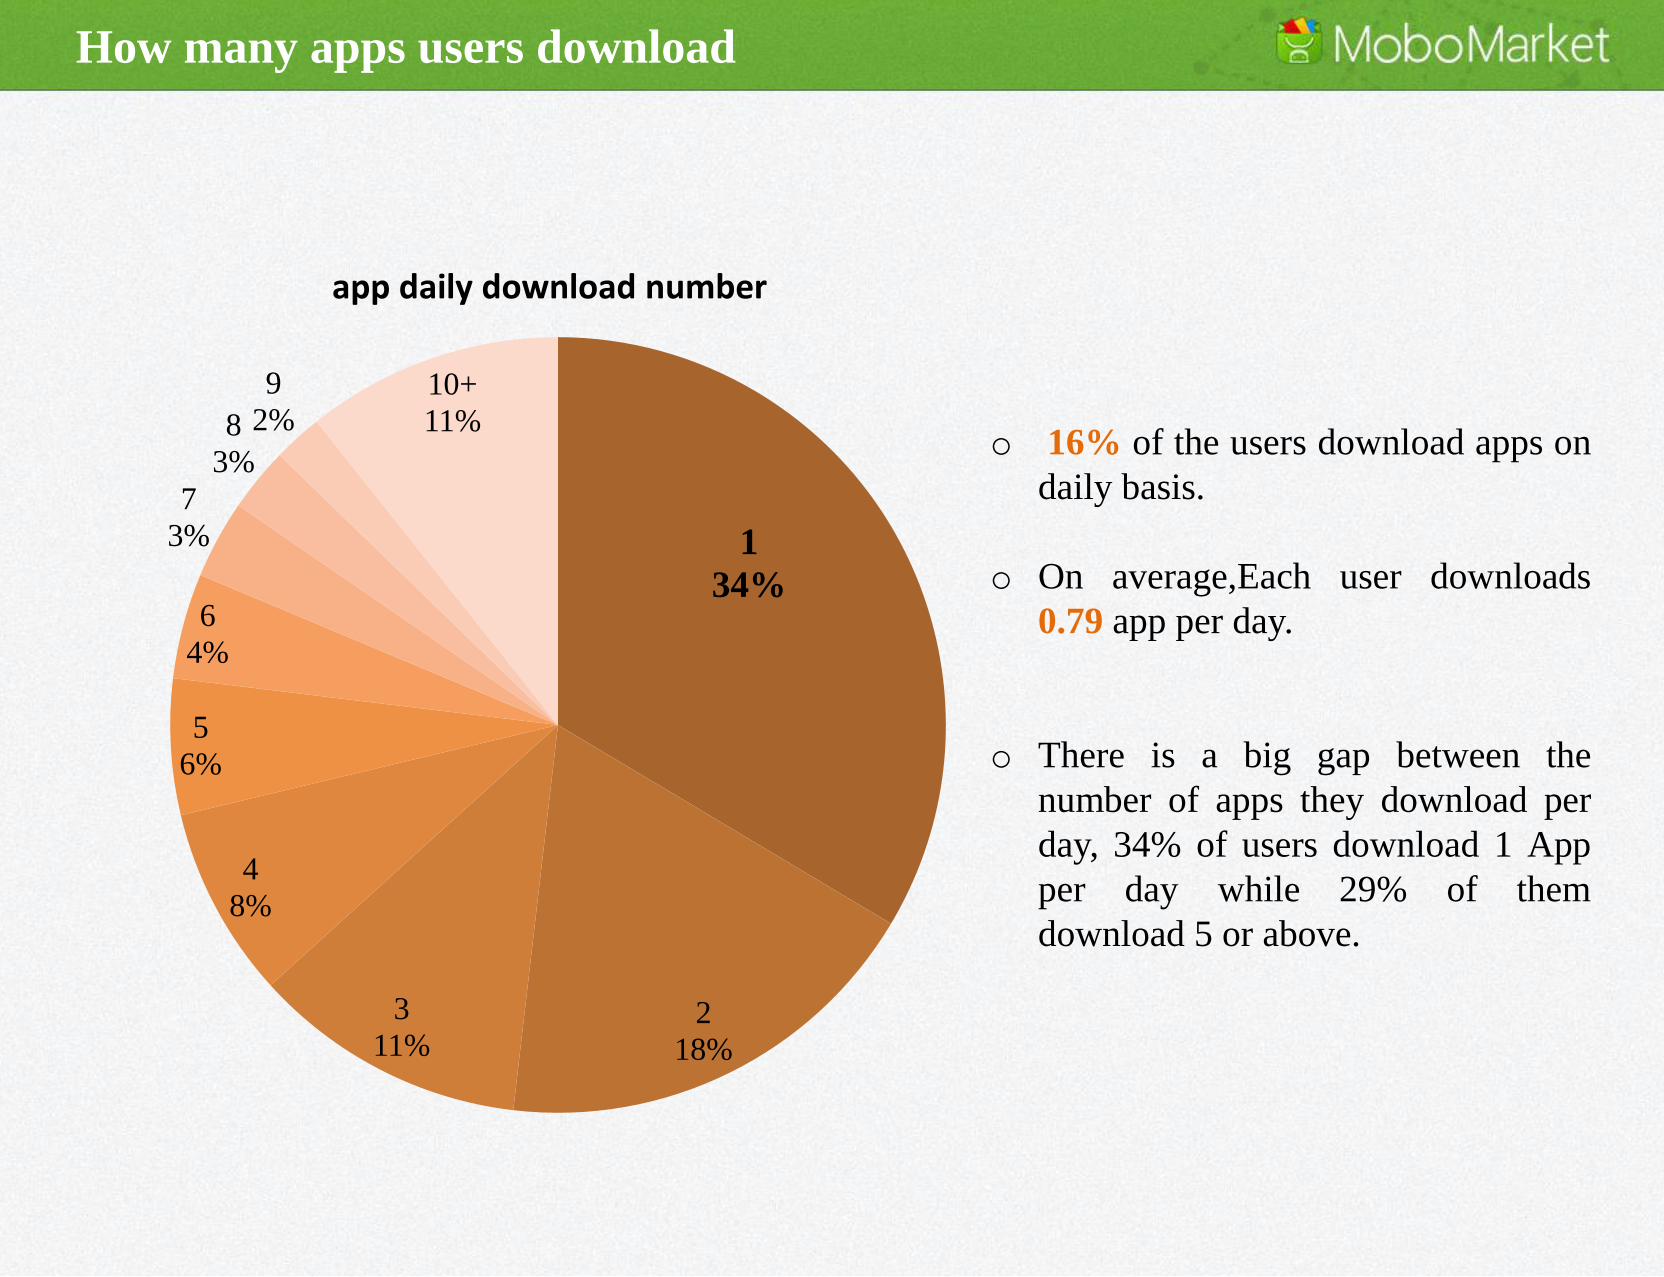
o 16% of the users download apps on
daily basis.
o On average,Each user downloads
0.79 app per day.
o There is a big gap between the
number of apps they download per
day, 34% of users download 1 App
per day while 29% of them
download 5 or above.
How many apps users download
1
34%
2
18%
3
11%
4
8%
5
6%
6
4%
7
3%
8
3%
9
2%10+
11%
app daily download number

43%57%
o Games:Among game types, Casual games isthe most popular one, which is echoedby the using time confettiof1 mobilephone users as people usually investonly spare time in games which isquite short.
*1.Time confetti refers to the phenomenon that only brief scraps of time are used for certain purpose.
o Apps:
In Indonesia, among all types of app,game has the biggest download share(43%),followed by Social apps (12%)and Photo apps (11%).
Casual & Puzzle29%
Arcade16%
Racing12%
Action11%
Sports7%
Strategy5%
Kids5%
Cards & Casino
4%
Simulation4%
Role Playing3%
Adventure2%
Music2%
Social20%
Photography20%
Lifestyle14%
Tool14%
Music & Video9%
Personalization
8%
Productivity5%
Books4%
Other6%
What apps users download

o 5% of the users update Apps on dailybasis. They average update 0.26 App perday,which demonstrates users are notquite willing to update their apps.。
o Among the users who update apps atleast once, 64% of them update 1 or 2apps a day and the share for the peoplewho update 10 Apps or more is 15%. Itmeans a small proportion of users areused to updating apps.
How many apps users update
150%
214%
36%
44%
53%
62%
72%
82%
92%
10+15%
App daily update number

o Social apps1 has the highest score(39%),followed by tools2 (18%).
o Although Game Apps has the mostdownloads, updates for Game Appsaccount for 12%. This is mainly becausesocial apps, like BBM and Facebook, arehaving huge user amount and beingneeded in the long-term. While gamesare having a shorter life-cycle and can’tmeet the public demand like social appsor tool apps. Generally they are fulfillingthe needs of a more specific group ofpeople.
o On average, users install 3 to 4 socialapps in the phone.
*1.social app:examples are Facebook,Twitter and so on.
*2.tool app:examples are Baidu Browser and Du SpeedBooster and so on.
Social39%
Tool18%
game12%
Music & Video7%
Productivity6%
Maps & Travel5%
Photography5%
Lifestyle2%
News2%
Other4%
what apps users update
What apps users update

Equipment and behavior analysis
o Mobile phone screen resolution and size
o Indonesian active hour
o App download geographic distribution

31.89%
18.25%
14.41%
9.20%
4.94%
21.31%
800*480
480*320
320*240
854*480
960*540
other
Display resolution of mobile devices
Other categories include 480*320 and320*240. They stand up for 1/3 of the total portfolio.
74.12%
18.93%
6.95%
under 4 inch
4-5 inch
above 5 inch
screen size of mobile devices
Mobile phone screen resolution and size
Most Indonesian mobiles are small tomiddle size, with 800*400 screen resolutionand size of up to 4 inch. As acomparison, over 70% China mobiles areequiped with 1280*720 screen resolutionand sizable phone body (4+ inches).

o Overall, the active hour follows people's living habits.
o The user number picks up since 17:00 and reaches the first peak at 20:00 when peopletake rest after work.
o What interests us is the second peak which takes place at 24:00,contrary to the usualliving habit of locals who usually go to bed early. Before further analysis in this regard,we are having two guesses:1) the locals are putting off their bed time.2) playing withmobile is becoming a habit before sleep.
use
rs n
um
ber
open app time
Users active hour
When users use app store
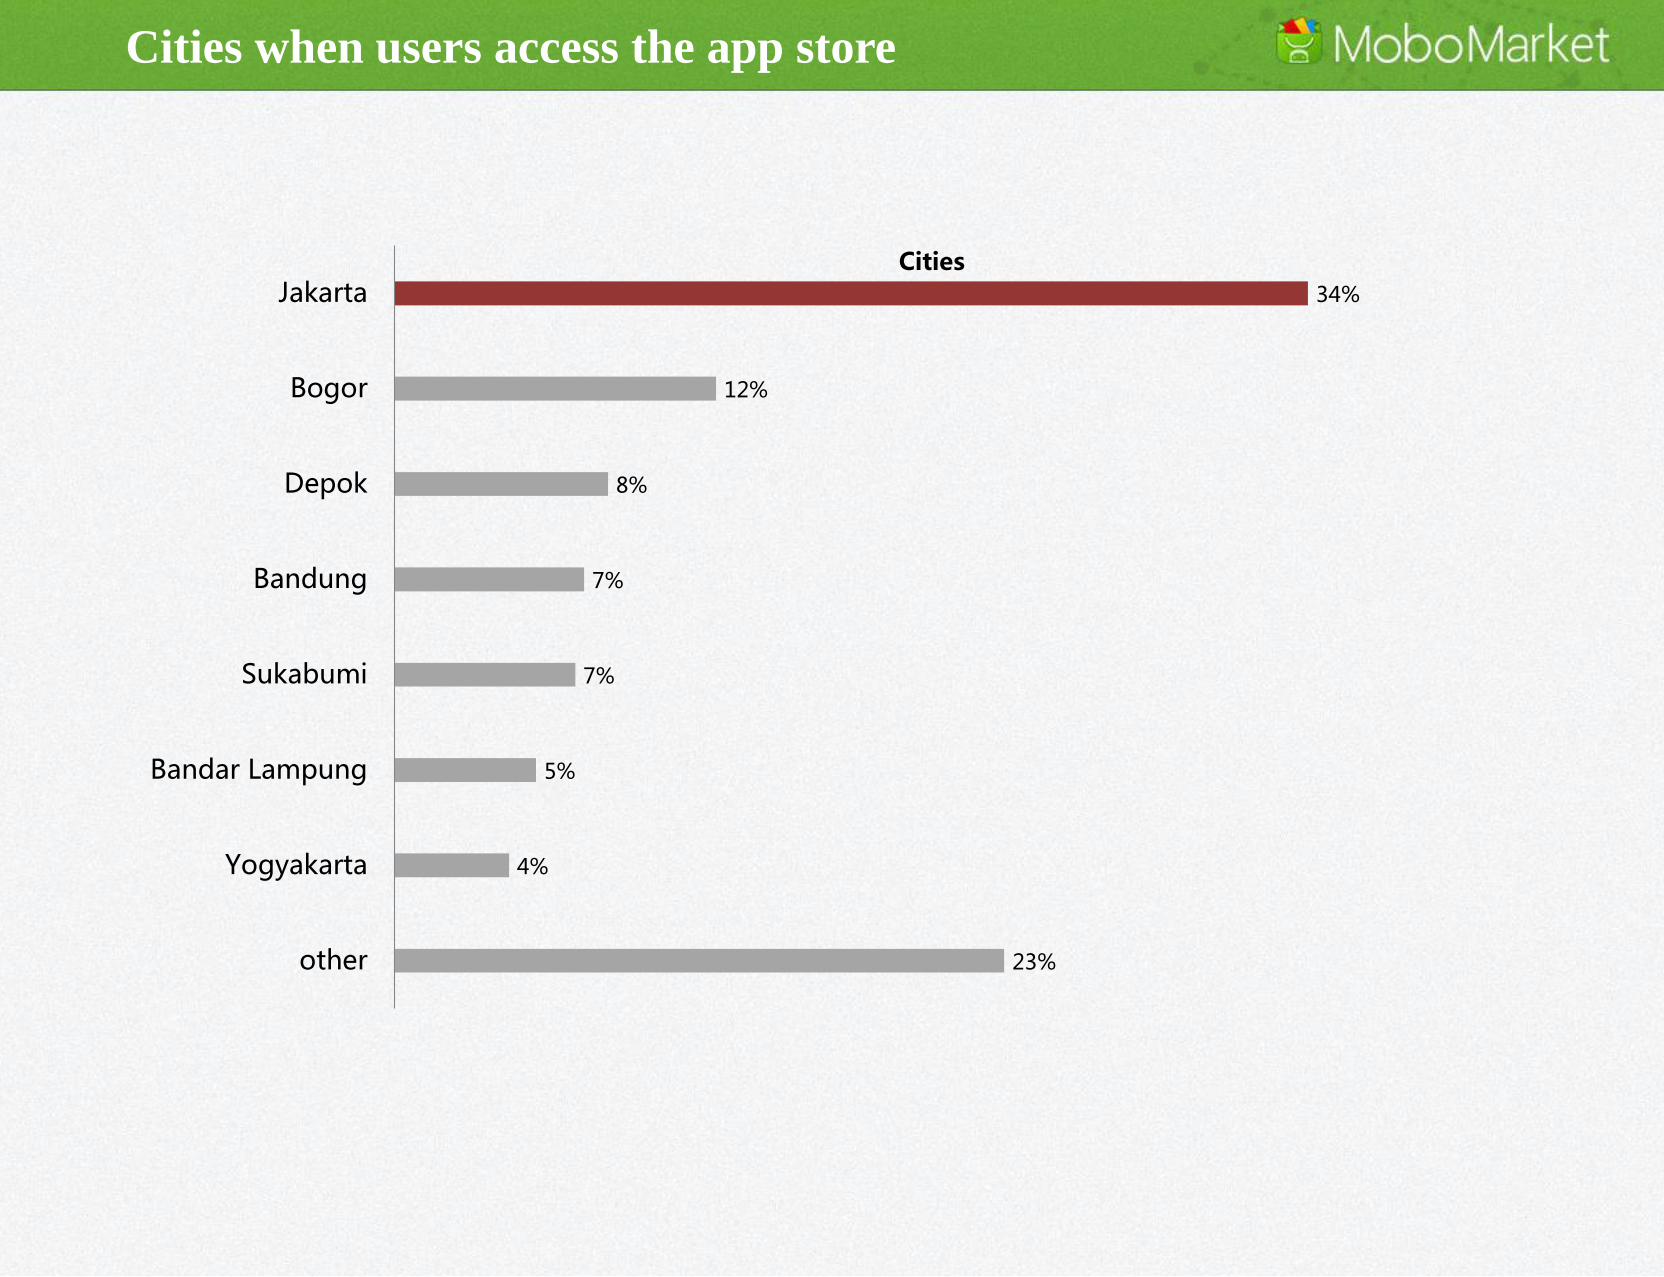
Cities when users access the app store
34%
12%
8%
7%
7%
5%
4%
23%
Jakarta
Bogor
Depok
Bandung
Sukabumi
Bandar Lampung
Yogyakarta
other
Cities

Thanks