q4 2019 financial results - seeking alpha
TRANSCRIPT

1
Q4 2019 FINANCIAL RESULTSFEBRUARY 2020

2
This presentation contains “forward-looking” statements relating to RealPage, Inc.’s strategy, goals, future focus areas, market size estimates and expected, possible or assumed future results, including its
financial outlook for the first quarter ending March 31, 2020 and calendar year ending December 31, 2020, that our platform is thinly penetrated into an enormous market opportunity, that we have laid a solid
foundation to accelerate our organic revenue growth profile, the potential market opportunity for our platform in the traditional multifamily business and the SMB business recently augmented with the acquisition
of Buildium, and the ability of our Yes-To-Success customer journeys, internal innovation and 2019 strategic acquisitions to accelerate organic revenue growth and expanding shareholder value in 2020. These
forward-looking statements are based on management's beliefs and assumptions and on information currently available to management. Forward-looking statements include all statements that are not historical
facts and may be identified by terms such as “expects,” “believes,” “plans,” or similar expressions and the negatives of those terms.
These forward-looking statements involve known and unknown risks, uncertainties and other factors that may cause actual results, performance or achievements to be materially different from any future results,
performance or achievements expressed or implied by the forward-looking statements. The Company may be required to revise its results contained herein upon finalizing its review of quarterly and full-year
results and completion of the annual audit, which could cause or contribute to such differences. Additional factors that could cause or contribute to such differences include, but are not limited to, the following: (a)
the possibility that general economic conditions, including leasing velocity or uncertainty, could cause information technology spending, particularly in the rental housing industry, to be reduced or purchasing
decisions to be delayed; (b) an increase in insurance claims; (c) an increase in client cancellations; (d) the inability to increase sales to existing clients and to attract new clients; (e) RealPage’s failure to integrate
recent or future acquired businesses successfully or to achieve expected synergies, including the recently completed acquisitions of Buildium, LeaseTerm Solutions, Hipercept, SimpleBills, Investor Management
Services and Modern Message; (f) the timing and success of new product introductions by RealPage or its competitors; (g) changes in RealPage’s pricing policies or those of its competitors; (h) legal or regulatory
proceedings; (i) the inability to achieve revenue growth or to enable margin expansion; (j) changes in RealPage’s estimates with respect to its long-term corporate tax rate or any other impact from the Tax Cuts
and Jobs Act; and (k) such other risks and uncertainties described more fully in documents filed with or furnished to the Securities and Exchange Commission (“SEC”) by RealPage, including its Annual Report on
Form 10-K previously filed with the SEC on February 27, 2019 (as amended on November 5, 2019) and its Quarterly Report on Form 10-Q previously filed with the SEC on November 8, 2019. All information
provided in this release is as of the date hereof and RealPage undertakes no duty to update this information except as required by law.
FORWARD LOOKING STATEMENTS

3
A global software and data analytics company that improves theoperational and transactional performance of real estate assets.
REALPAGE®

4
SELL MORE NEW UNITS CROSS-SELL HIGHER RPU
REALPAGE UNITS TOTALADDRESSABLE MARKET
(UNITS)
REALPAGE RPU TOTALADDRESSABLE MARKET
(ALL REALPAGE PRODUCTS)
$18.9B18X
$292
$56(2)
$1,040MMRealPage
ACV(Q4’19)
RPU TAM(1)
(6% Penetrated)
(1) Company estimate as of Q4’19.(2) $64 excluding HOA
65MM
UNITS
18.5MM
5.2X3.5X

5
• Focused on helping owners identify opportunities to capture 300 to 400 basis points of incremental yield• ActiveBuilding eCommerce drives incremental yield from amenities, spaces, services and events
• Even more powerful with recent acquisition of Modern Message, which provides loyalty and rewards programs• Enhancements to Contact Center including much richer guest card and dynamic landing pages• Next generation AI Contact Center• LeaseLabs acquisition integrated into Marketing Suite• AI Revenue Management optimizing four dimensions of yield including price, demand, credit and leasing agent behavior• AI Screening, one of our first self-provisioning solutions, provisioned to significant portion of install base in 2H19• Asset & Investment Management Platform has integrated Asset Monitoring with Modeling for continuous valuation and assessment of an
asset
UNLEASHING A NEW WAVE OF INNOVATION

6
• Inorganic investments include Buildium, Lease Term Solutions, SimpleBills, Modern Message, Hiperceptand Investment Management Services
• Buildium and RealPage teams working on master API to support integration and interoperability ~ front-end integration opportunities in discussion
ACQUISITIONS ENHANCE STRATEGIC PLATFORM
7
• Mike Britti to lead Emerging Markets and will oversee Institutional, SMB and Vacation
• Ashley Glover promoted to President, responsible for Multifamily, Sales, Marketing and Client Success
• Current TAM estimate is $19 billion (up from $13 billion), including nearly 21 million multifamily units within Conventional, Affordable, Senior, Student and Military markets
TAM EXPANDS, ORGANIZATIONAL EFFECTIVENESS

-6.0%
-4.0%
-2.0%
0.0%
2.0%
4.0%
6.0%
8.0%
Annual Rent Growth By Class
92%
93%
94%
95%
96%
97%
-3%-2%-1%0%1%2%3%4%5%6%
Annual Rent Growth / Occupancy
8
• Rents grew 2.8% in Q4’19, compared to growth of 3.3% in Q4’18
MACROECONOMIC TRENDS: RENTAL HOUSING MARKET STRENGTH
• Occupancy at 95.8% in Q4’19, compared with 95.4% in Q4’18
Source: MPF Research and AxioMetrics data. Source: MPF Research and AxioMetrics data.
Annual Rent Growth OccupancyQ1’10 Q4’19 Q1’10 Q4’19
Class CClass A Class B
Occupancy
Annu
al Re
nt G
rowt
h

$228$235
$244
$255 $255
Q4'18 Q1'19 Q2'19 Q3'19 Q4'19
9
• Total Non-GAAP revenue growth of 12% YOY
• Adjusted EBITDA growth of 25% YOY
Q4’19 FINANCIAL SUMMARY
*See the appendix section of this presentation for a reconciliation of GAAP to Non-GAAP measures.
Non-GAAP Total Revenue(in millions)
YOY Growth: 21% 16% 13% 13% 12%

27% 25% 24%20% 19% <17%
OneSite Facilities VendorScreening
DocumentManagement
Accounting All OtherSolutions
10
Percent Penetrated Into 16.1MM Rental Units(1)
PROPERTY MANAGEMENTEstimated Relative Gross Margin(2)
70%71% 71%
2017 2018 2019
(1) Unit overlap exists across solutions, and excluding HOA.(2) Based on Company estimates of certain shared costs allocated to the product category based upon revenue contribution and excludes depreciation, amortization of product technologies, and stock-based expense.

Percent Penetrated Into 16.1MM Rental Units(1)
60%58% 58%
2017 2018 2019
Estimated Relative Gross Margin(2)
11
RESIDENT SERVICES
(1) Unit overlap exists across solutions, and excluding HOA. (2) Based on Company estimates of certain shared costs allocated to the product category based upon revenue contribution and excludes depreciation, amortization of product technologies, and stock-based expense.
20%
17% 16% <16%
Payments RUM Online Living All Other Solutions
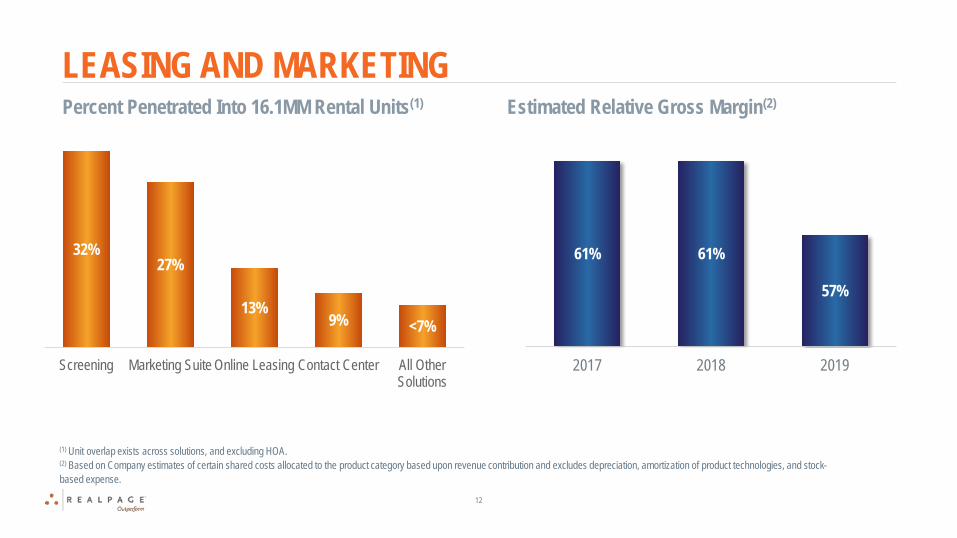
61% 61%
57%
2017 2018 2019
Percent Penetrated Into 16.1MM Rental Units(1) Estimated Relative Gross Margin(2)
12
LEASING AND MARKETING
(1) Unit overlap exists across solutions, and excluding HOA. (2) Based on Company estimates of certain shared costs allocated to the product category based upon revenue contribution and excludes depreciation, amortization of product technologies, and stock-based expense.
32%27%
13%9% <7%
Screening Marketing Suite Online Leasing Contact Center All OtherSolutions

31%
22%
<13%
BI / PA Revenue Management All Other Solutions
70%
74% 75%
2017 2018 2019
Percent Penetrated Into 16.1MM Units(1) Estimated Relative Gross Margin(2)
13
ASSET OPTIMIZATION
(1) Unit overlap exists across solutions, and excluding HOA. (2) Based on Company estimates of certain shared costs allocated to the product category based upon revenue contribution and excludes depreciation, amortization of product technologies, and stock-based expense.

*See the appendix section of this presentation for a reconciliation of GAAP to Non-GAAP measures.
14
• Q4’19 Non-GAAP on-demand growth of 13% driven by: • Property Management – 10% YOY growth• Resident Services – 20% YOY growth• Leasing & Marketing – flat YOY • Asset Optimization – 12% YOY growth
PRODUCT FAMILY QUARTERLY FINANCIAL HIGHLIGHTS
$42.9 $44.4 $46.9 $45.8 $42.8
$47.8 $49.9 $51.0 $52.6 $52.6
$93.9 $96.8 $101.2 $110.3 $112.8
$34.5 $35.6 $36.2$37.0 $38.5
Q4'18 Q1'19 Q2'19 Q3'19 Q4'19
Asset OptimizationResident ServicesProperty ManagementLeasing & Marketing
(in millions)
15
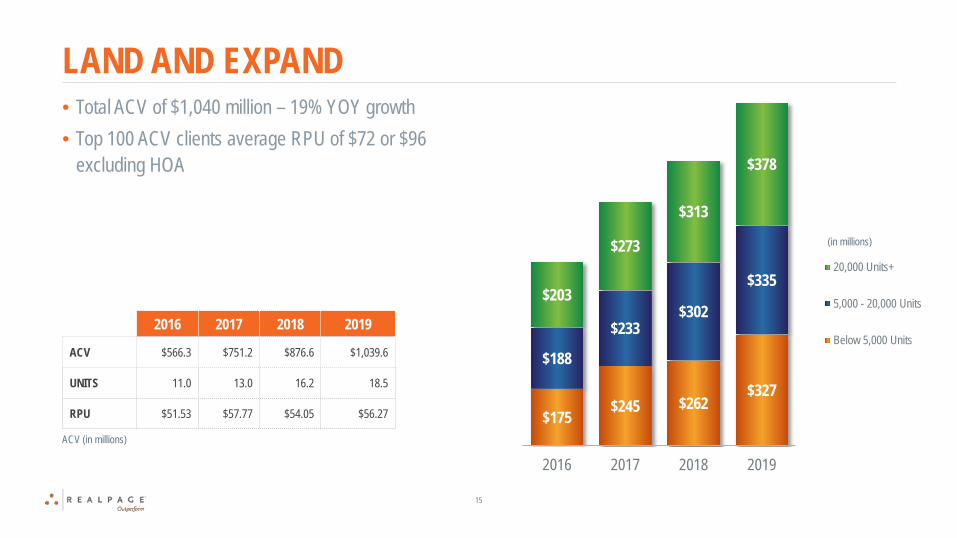
• Total ACV of $1,040 million – 19% YOY growth • Top 100 ACV clients average RPU of $72 or $96
excluding HOA
LAND AND EXPAND
2016 2017 2018 2019
ACV $566.3 $751.2 $876.6 $1,039.6
UNITS 11.0 13.0 16.2 18.5
RPU $51.53 $57.77 $54.05 $56.27 $175$245 $262
$327
$188
$233$302
$335$203
$273
$313
$378
2016 2017 2018 2019
20,000 Units+
5,000 - 20,000 Units
Below 5,000 Units
(in millions)
ACV (in millions)
16
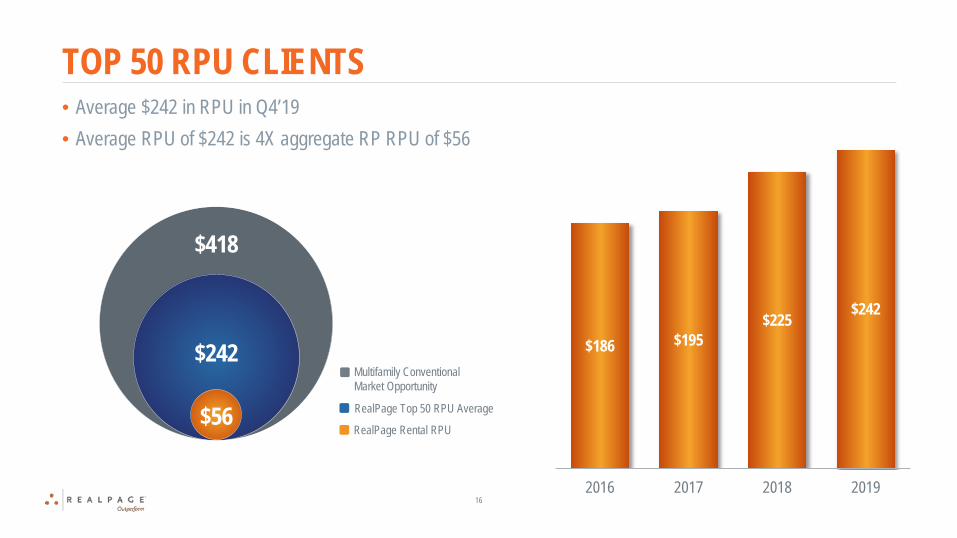
• Average $242 in RPU in Q4’19 • Average RPU of $242 is 4X aggregate RP RPU of $56
TOP 50 RPU CLIENTS
RealPage Rental RPU
RealPage Top 50 RPU Average
Multifamily ConventionalMarket Opportunity
$56
$242
$418
$186 $195$225 $242
2016 2017 2018 2019

$61 $65 $68 $72 $76
Q4'18 Q1'19 Q2'19 Q3'19 Q4'19
17
• Adjusted EBITDA growth of over 25% and margin expansion of nearly 320 basis points YOY
• Margin expansion includes innovation, go-to-market investments
QUARTERLY PROFITABILITY
Margin: 26.7% 27.8% 28.0% 28.3% 29.8%*See the appendix section of this presentation for a reconciliation of GAAP to Non-GAAP measures.
Adjusted EBITDA ($ in millions)

18
• Cash flow from operations was over $46.4(1) million in Q4’19• Capital expenditures of $13.0 million for Q4’19,
5.1% of revenue during the period
LIQUIDITY AND OPERATING CASH FLOW
(millions) Q4 ‘18 Q4 ’19BALANCE SHEETCASH AND CASH EQUIVALENTS $228.2 $197.2
DEBT $596.6 $1.1B
CASH FLOWOPERATING CASH FLOW(1) $46.2 $46.4
CAPITAL EXPENDITURES $13.6 $13.0
LEVERAGE
PROFORMA LEVERAGE 1.5x 3.1x
(2) Includes the accounting treatment of tenant reimbursements related to headquarters of ~$19 million.
(1) Excludes the impact resulting from changes in restricted cash relating to accounting treatment changes.
*See the appendix section of this presentation for a reconciliation of GAAP to Non-GAAP measures.
(3) Includes a $3.4 million impact from the company’s renters’ insurance solution related to hurricanes Harvey and Irma.
$127 $163
$231
$282
$117 $137
$188 $228
2016 2017 2018 2019Adjusted EBITDA ($) Operating Cash Flow ($)
(2)
(3)
(1)

19
• Q1’20 Non-GAAP total revenue of $277 million to $281 million • Q1’20 Adjusted EBITDA of $70 million to $72 million • Q1’20 Non-GAAP diluted EPS of $0.41 to $0.43 • FY’20 Non-GAAP total revenue of $1,165 million to $1,185 million • FY’20 Adjusted EBITDA of $320 million to $324 million • FY’20 Non-GAAP diluted EPS of $1.95 to $2.00
2020 EXPECTATIONS & FINANCIAL SUMMARY
*See the appendix section of this presentation for a reconciliation of GAAP to Non-GAAP measures.

Click to edit body text. To change between levels, click on the “Indent More” or “Indent Less” button in the “Home” formatting palette.
• Second levelThird level
• Fourth level
• Fifth level
• Sixth level
20
APPENDIX

21
RECONCILIATION OF NON-GAAP FINANCIAL MEASURES TO COMPARABLE GAAP MEASURES
Non-GAAP Total RevenueSet forth below is a presentation of the company’s “Non-GAAP Total Revenue.” Please reference the “Explanation of Non-GAAP Financial Measures” section.
Q1'17 Q2'17 Q3'17 Q4'17 2017 Q1'18 Q2'18 Q3'18 Q4'18 2018 Q1'19 Q2'19 Q3'19 Q4'19 2019Revenue (GAAP) 152,919$ 161,306$ 169,058$ 187,680$ 670,963$ 201,301$ 216,252$ 224,953$ 226,974$ 869,480$ 234,306$ 243,861$ 255,202$ 254,767$ 988,136$
Acquisition-related deferred revenue 705 945 698 710 3,058 313 103 418 1,056 1,890 224 157 38 449 868 Non-GAAP Total Revenue 153,624$ 162,251$ 169,756$ 188,390$ 674,021$ 201,614$ 216,355$ 225,371$ 228,030$ 871,370$ 234,530$ 244,018$ 255,240$ 255,216$ 989,004$
Adjusted EBITDASet forth below is a presentation of the company’s "Adjusted EBITDA." Please reference the "Explanation of Non-GAAP Financial Measures" section.
Q1'17 Q2'17 Q3'17 Q4'17 2017 Q1'18 Q2'18 Q3'18 Q4'18 2018 Q1'19 Q2'19 Q3'19 Q4'19 2019Net income (loss) (GAAP) 8,195$ 6,213$ 6,834$ (20,865)$ 377$ 10,901$ 8,479$ 9,073$ 6,272$ 34,725$ 11,272$ 15,063$ 11,704$ 20,169$ 58,208$
Acquisition-related deferred revenue 705 945 698 710 3,058 313 103 418 1,056 1,890 224 157 38 449 868 Depreciation, asset impairment, and loss on disposal of assets 6,675 6,929 7,331 6,817 27,752 7,818 7,662 9,286 10,445 35,211 8,760 8,696 8,499 10,769 36,724 Amortization of product technologies and intangible assets 7,789 8,227 9,335 14,567 39,918 16,384 17,623 18,684 19,017 71,708 19,350 20,302 20,759 20,353 80,764 Loss due to cyber incident, net of recoveries — — — — — — — — 4,952 4,952 — — — — — Gain on change in fair value of equity investment — — — — — — — — — — (2,600) — — — (2,600) Acquisition-related expense (income) 1,210 1,354 485 2,508 5,557 1,007 1,168 519 (257) 2,437 29 376 755 3,594 4,754 Regulatory and legal matters 481 2,228 5,993 2,310 11,012 — — 78 — 78 — 352 215 898 1,465 Interest expense, net 1,120 2,804 4,813 6,335 15,072 7,721 8,584 6,874 6,780 29,959 8,581 8,241 8,791 9,443 35,056 Income tax expense (benefit) 811 (3,132) (7,273) 24,458 14,864 (301) (189) 683 (618) (425) 4,647 (822) 4,171 (5,646) 2,350 Organizational realignment — — — — — — — — — — — — 684 849 1,533 Stock-based expense 10,092 13,876 11,764 10,103 45,835 10,318 13,695 13,479 13,149 50,641 14,913 15,865 16,498 15,287 62,563
Adjusted EBITDA 37,078$ 39,444$ 39,980$ 46,943$ 163,445$ 54,161$ 57,125$ 59,094$ 60,796$ 231,176$ 65,176$ 68,230$ 72,114$ 76,165$ 281,685$
RECONCILIATION OF NON-GAAP FINANCIAL MEASURES TO COMPARABLE GAAP MEASURES(unaudited, in thousands, except per share data)
The following is a reconciliation of the non-GAAP financial measures used by RealPage to describe its financial results determined in accordance with accounting principles generally accepted in the United States of America ("GAAP"). An explanation of these measures is also included under the heading “Explanation of Non-GAAP Financial Measures.”
While the company believes that these non-GAAP financial measures provide useful supplemental information to investors regarding the underlying performance of our business operations, investors are reminded to consider these non-GAAP measures in addition to, and not as a substitute for, financial performance measures prepared in accordance with GAAP. In addition, it should be noted that these non-GAAP financial measures may be different from non-GAAP measures used by other companies, and the company may utilize other measures to illustrate performance in the future. Non-GAAP measures have limitations in that they do not reflect all of the amounts associated with our results of operations as determined in accordance with GAAP.

22
RECONCILIATION OF NON-GAAP FINANCIAL MEASURES TO COMPARABLE GAAP MEASURES
Non-GAAP Net IncomeSet forth below is a presentation of the company’s "Non-GAAP Net Income" and "Non-GAAP Net Income per Diluted Share." Please reference the "Explanation of Non-GAAP Financial Measures" section.
Q1'17 Q2'17 Q3'17 Q4'17 2017 Q1'18 Q2'18 Q3'18 Q4'18 2018 Q1'19 Q2'19 Q3'19 Q4'19 2019Net income (loss) (GAAP) 8,195$ 6,213$ 6,834$ (20,865)$ 377$ 10,901$ 8,479$ 9,073$ 6,272$ 34,725$ 11,272$ 15,063$ 11,704$ 20,169$ 58,208$
Income tax expense (benefit) 811 (3,132) (7,273) 24,458 14,864 (301) (189) 683 (618) (425) 4,647 (822) 4,171 (5,646) 2,350 Income (loss) before income taxes 9,006 3,081 (439) 3,593 15,241 10,600 8,290 9,756 5,654 34,300 15,919 14,241 15,875 14,523 60,558
Acquisition-related deferred revenue 705 945 698 710 3,058 313 103 418 1,056 1,890 224 157 38 449 868 Asset impairment and (gain) loss on disposal of assets 24 63 385 52 524 942 156 2,341 3,294 6,733 286 (17) (10) 2,277 2,536 Amortization of product technologies and intangible assets 7,789 8,227 9,335 14,567 39,918 16,384 17,623 18,684 19,017 71,708 19,350 20,302 20,759 20,353 80,764 Gain on change in fair value of equity investment — — — — — — — — — — (2,600) — — — (2,600) Loss due to cyber incident, net of recoveries — — — — — — — — 4,952 4,952 — — — — — Acquisition-related expense (income) 1,210 1,354 485 2,508 5,557 1,007 1,168 519 (257) 2,437 29 376 755 3,594 4,754 Organizational realignment — — — — — — — — — — — — 684 849 1,533 Regulatory and legal matters 481 2,228 5,993 2,310 11,012 — — 78 — 78 — 352 215 898 1,465 Amortization of convertible note discount — 1,052 2,451 2,488 5,991 2,524 2,562 2,599 2,639 10,324 2,676 2,717 2,756 2,797 10,946 Stock-based expense 10,092 13,876 11,764 10,103 45,835 10,318 13,695 13,479 13,149 50,641 14,913 15,865 16,498 15,287 62,563
Non-GAAP income before income taxes 29,307 30,826 30,672 36,331 127,136 42,088 43,597 47,874 49,504 183,063 50,797 53,993 57,570 61,027 223,387 Assumed rate for income tax expense (1) 40.0 % 40.0 % 40.0 % 40.0 % 40.0 % 26.0 % 26.0 % 26.0 % 26.0 % 26.0 % 26.0 % 26.0 % 26.0 % 26.0 % 26.0 %Assumed provision for non-GAAP income tax expense 11,723 12,330 12,269 14,532 50,854 10,943 11,335 12,447 12,871 47,596 13,207 14,038 14,968 15,867 58,080
Non-GAAP net income 17,584$ 18,496$ 18,403$ 21,799$ 76,282$ 31,145$ 32,262$ 35,427$ 36,633$ 135,467$ 37,590$ 39,955$ 42,602$ 45,160$ 165,307$
Net income (loss) per diluted share 0.10$ 0.08$ 0.08$ (0.26)$ 0.00$ 0.13$ 0.09$ 0.09$ 0.07$ 0.38$ 0.12$ 0.16$ 0.12$ 0.21$ 0.60$ Non-GAAP net income per diluted share 0.22$ 0.23$ 0.22$ 0.26$ 0.93$ 0.37$ 0.37$ 0.38$ 0.39$ 1.51$ 0.40$ 0.43$ 0.45$ 0.48$ 1.76$
Weighted average outstanding shares - basic 78,263 79,018 79,838 80,583 79,433 81,166 85,124 91,222 91,492 87,290 91,490 91,914 92,239 92,412 92,017 Weighted average outstanding shares - diluted 81,386 81,925 82,760 83,464 82,398 84,817 90,005 96,590 95,108 91,531 95,561 96,493 97,114 95,824 96,282
Dilution offset from convertible note hedge transactions — — — (321) (81) (1,319) (2,116) (2,440) (1,621) (1,876) (2,207) (2,528) (2,716) (2,172) (2,406)
Non-GAAP diluted weighted average shares outstanding (2) 81,386 81,925 82,760 83,143 82,317 83,498 87,889 94,150 93,487 89,655 93,354 93,965 94,398 93,652 93,876

23
RECONCILIATION OF NON-GAAP FINANCIAL MEASURES TO COMPARABLE GAAP MEASURES
Non-GAAP On Demand Revenue, Ending On Demand Units, Average On Demand Units, RPU and ACV
Q1'17 Q2'17 Q3'17 Q4'17 2017 Q1'18 Q2'18 Q3'18 Q4'18 2018 Q1'19 Q2'19 Q3'19 Q4'19 2019On demand revenue (GAAP) 146,213$ 154,727$ 161,578$ 180,104$ 642,622$ 193,300$ 206,945$ 215,413$ 218,051$ 833,709$ 226,519$ 235,185$ 245,637$ 246,235$ 953,576$
Acquisition-related deferred revenue 705 945 698 710 3,058 313 103 418 1,056 1,890 224 157 38 449 868 Non-GAAP on demand revenue 146,918 155,672 162,276 180,814 645,680 193,613 207,048 215,831 219,107 835,599 226,743 235,342 245,675 246,684 954,444
Ending on demand units 11,112 11,485 12,253 13,003 13,003 13,173 15,531 16,073 16,219 16,219 16,401 16,505 16,779 18,475 18,475Average on demand units 11,050 11,298 11,869 12,628 11,711 13,088 14,352 15,802 16,146 14,847 16,310 16,453 16,642 17,627 16,758 RPU 53.65$ 56.51$ 57.85$ 57.77$ 57.77$ 59.17$ 53.95$ 55.17$ 54.05$ 54.05$ 55.61$ 57.10$ 59.05$ 56.27$ 56.27$
ACV 596,159$ 649,017$ 708,836$ 751,183$ 751,183$ 779,446$ 837,897$ 886,747$ 876,637$ 876,637$ 912,060$ 942,436$ 990,800$ 1,039,588$ 1,039,588$
Q1'17 Q2'17 Q3'17 Q4'17 2017 Q1'18 Q2'18 Q3'18 Q4'18 2018 Q1'19 Q2'19 Q3'19 Q4'19 2019Property Management $ 40,341 41,404$ 42,175$ 43,082$ $ 167,002 $ 45,319 $ 46,522 $ 47,307 $ 47,826 $ 186,974 $ 49,914 $ 51,006 $ 52,591 $ 52,633 $ 206,144
Percent of total non-GAAP on demand revenue 27% 26% 26% 24% 26% 24% 22% 22% 22% 22% 22% 22% 21% 21% 22%Year-over-year growth 11% 8% 8% 10% 9% 12% 12% 12% 11% 12% 10% 10% 11% 10% 10%
Resident Services $ 60,968 64,860$ 70,527$ 75,822$ $ 272,177 $ 77,175 $ 85,329 $ 94,084 $ 93,865 $ 350,453 $ 96,804 $ 101,209 $ 110,315 $ 112,747 $ 421,075 Percent of total non-GAAP on demand revenue 42% 42% 43% 42% 42% 40% 41% 44% 43% 42% 43% 43% 45% 46% 44%Year-over-year growth 35% 19% 21% 26% 25% 27% 32% 33% 24% 29% 25% 19% 17% 20% 20%
Leasing and Marketing $ 27,815 29,324$ 29,334$ 37,563$ $ 124,036 $ 39,434 $ 42,845 $ 42,198 $ 42,882 $ 167,359 $ 44,401 $ 46,899 $ 45,761 $ 42,792 $ 179,853 Percent of total non-GAAP on demand revenue 19% 19% 18% 21% 19% 20% 21% 19% 19% 20% 19% 20% 19% 17% 19%Year-over-year growth -4% -1% 0% 36% 7% 42% 46% 44% 14% 35% 13% 9% 8% 0% 8%
Asset Optimization $ 17,794 20,084$ 20,240$ 24,347$ $ 82,465 $ 31,685 $ 32,352 $ 32,242 $ 34,534 $ 130,813 $ 35,624 $ 36,228 $ 37,008 $ 38,512 $ 147,372 Percent of total non-GAAP on demand revenue 12% 13% 13% 13% 13% 16% 16% 15% 16% 16% 16% 15% 15% 16% 15%Year-over-year growth 39% 47% 46% 66% 50% 78% 61% 59% 42% 59% 12% 12% 15% 12% 13%
Subscription $ 134,325 141,459$ 152,564$ 158,958$ $ 587,306 $ 169,687 $ 179,082 $ 189,458 $ 196,799 $ 735,026 $ 201,943 $ 207,209 $ 218,536 $ 222,988 $ 850,676 Percent of total non-GAAP on demand revenue 91% 91% 94% 88% 91% 88% 86% 88% 90% 88% 89% 88% 89% 90% 89%Year-over-year growth 22% 15% 20% 24% 20% 26% 27% 24% 24% 25% 19% 16% 15% 13% 16%
Transactional $ 12,593 14,213$ 9,712$ 21,856$ $ 58,374 $ 23,926 $ 27,966 $ 26,373 $ 22,308 $ 100,573 $ 24,800 $ 28,133 $ 27,139 $ 23,696 $ 103,768 Percent of total non-GAAP on demand revenue 9% 9% 6% 12% 9% 12% 14% 12% 10% 12% 11% 12% 11% 10% 11%Year-over-year growth 0% 10% -28% 68% 12% 90% 97% 172% 2% 72% 4% 1% 3% 6% 3%
Set forth below is a presentation of the company’s "Non-GAAP On Demand Revenue," "Ending On Demand Units," "Average On Demand Units," "RPU," and "ACV." Please reference the "Explanation of Non-GAAP Financial Measures" section.

24
RECONCILIATION OF NON-GAAP FINANCIAL MEASURES TO COMPARABLE GAAP MEASURES
Non-GAAP Total Revenue Guidance
Low (3) High (3) Low (3) High (3)
Revenue (GAAP) 276,070$ 280,070$ 1,162,770$ 1,182,770$ Acquisition-related deferred revenue 930 930 2,230 2,230
Non-GAAP total revenue 277,000$ 281,000$ 1,165,000$ 1,185,000$
Guidance Range for theThree Months Ending
Guidance Range for theTwelve Months Ending
Set forth below is a presentation of the company’s "Non-GAAP total revenue" guidance for the three months ending March 31, 2020 and the twelve months ending December 31, 2020. Please reference the "Explanation of Non-GAAP Financial Measures" section.
March 31, 2020 December 31, 2020

25
RECONCILIATION OF NON-GAAP FINANCIAL MEASURES TO COMPARABLE GAAP MEASURES
Non-GAAP Net Income Guidance
Low (3) High (3) Low (3) High (3)
Net income (GAAP) (400)$ 1,760$ 27,990$ 34,450$ Income tax expense (130) 560 8,840 10,880
Income before income taxes (530) 2,320 36,830 45,330
Acquisition-related deferred revenue 930 930 2,230 2,230 Amortization of product technologies and intangible assets 25,550 25,400 101,790 100,990 Acquisition-related expense 2,970 2,970 10,030 9,730 Organizational realignment 890 790 1,240 790 Amortization of convertible note discount 2,840 2,840 11,610 11,610 Stock-based expense 18,050 17,950 78,820 78,270
Non-GAAP income before income taxes 50,700 53,200 242,550 248,950 Assumed rate for income tax expense (1) 24.0% 24.0% 24.0% 24.0%Assumed provision for non-GAAP income tax expense 12,168 12,768 58,212 59,748
Non-GAAP net income 38,532$ 40,432$ 184,338$ 189,202$
Net income per diluted share 0.00$ 0.02$ 0.29$ 0.35$ Non-GAAP net income per diluted share 0.41$ 0.43$ 1.95$ 2.00$
Weighted average outstanding shares - diluted 96,007 96,007 97,097 97,097 Dilution offset from convertible note hedge transactions (2,160) (2,160) (2,584) (2,584)
Non-GAAP diluted weighted average shares outstanding (2) 93,847 93,847 94,513 94,513
Set forth below is a presentation of the company’s "Non-GAAP net income" and "Non-GAAP net income per diluted share" guidance for the three months ending March 31, 2020 and the twelve months ending December 31, 2020. Please reference the "Explanation of Non-GAAP Financial Measures" section.
Guidance Range for theThree Months Ending
Guidance Range for theTwelve Months Ending
March 31, 2020 December 31, 2020

26
RECONCILIATION OF NON-GAAP FINANCIAL MEASURES TO COMPARABLE GAAP MEASURES
Adjusted EBITDA Guidance
Low (3) High (3) Low (3) High (3)
Net income (GAAP) (400)$ 1,760$ 27,990$ 34,450$ Acquisition-related deferred revenue 930 930 2,230 2,230 Depreciation, asset impairment, and loss on disposal of assets 8,650 8,450 36,090 35,190 Amortization of product technologies and intangible assets 25,550 25,400 101,790 100,990 Acquisition-related expense 2,970 2,970 10,030 9,730 Organizational realignment 890 790 1,240 790 Stock-based expense 18,050 17,950 78,820 78,270 Interest expense, net 13,490 13,190 52,970 51,470 Income tax expense (130) 560 8,840 10,880
Adjusted EBITDA 70,000$ 72,000$ 320,000$ 324,000$
(1)
(2)
(3)
Guidance Range for theThree Months Ending
Guidance Range for theTwelve Months Ending
March 31, 2020 December 31, 2020
In 2019, a 26.0% tax rate is assumed in order to approximate the company's long-term effective corporate tax rate. For 2020 guidance purposes, the company uses a 24.0% tax rate to approximate the company's long-term effective corporate tax rate. Please reference the “Explanation of Non-GAAP Financial Measures” section.
It is the current intent of the company to settle conversions of the convertible notes through combination settlement, which involves repayment of the principal portion in cash and any excess of the conversion value over the principal amount in shares of our common stock. We exclude these shares that are issuable upon conversions of our convertible notes because we expect that the dilution from such shares will be offset by the convertible note hedge transactions entered into in May 2017 in connection with the issuance of the convertible notes.Forward-looking statements involve known and unknown risks, uncertainties and other factors that may cause actual results, performance or achievements to be materially different from any future results, performance or achievements expressed or implied by the forward-looking statements. The company may be required to revise its results upon finalizing its review of quarterly and full year results, which could cause or contribute to such differences. All information provided in this release is as of the date hereof and RealPage, Inc. undertakes no duty to update this information except as required by law. See additional discussion under "Cautionary Statement Regarding Forward-Looking Statements" above.
Set forth below is a presentation of the company’s "Adjusted EBITDA" guidance for the three months ending March 31, 2020 and the twelve months ending December 31, 2020. Please reference the "Explanation of Non-GAAP Financial Measures" section.

27
EXPLANATION OF NON-GAAP FINANCIAL MEASURESThe company reports its financial results in accordance with accounting principles generally accepted in the United States of America, or GAAP. However, the company believes that, in order to properly understand its short-term and long-term financial, operational and strategic trends, it may be helpful for investors to exclude certain non-cash or non-recurring items when used as a supplement to financial performance measures in accordance with GAAP. These items result from facts and circumstances that vary in both frequency and impact on continuing operations. The company also uses results of operations excluding such items to evaluate the operating performance of RealPage and compare it against prior periods, make operating decisions, determine executive compensation, and serve as a basis for long-term strategic planning. These non-GAAP financial measures provide the company with additional means to understand and evaluate the operating results and trends in its ongoing business by eliminating certain non-cash expenses and other items that RealPage believes might otherwise make comparisons of its ongoing business with prior periods more difficult, obscure trends in ongoing operations, reduce management’s ability to make useful forecasts, or obscure the ability to evaluate the effectiveness of certain business strategies and management incentive structures. In the future, we expect to continue to incur expenses similar to certain of the non-GAAP adjustments described below and exclusion of these items in the presentation of our non-GAAP financial measures should not be construed as an inference that all of these costs are unusual, infrequent or non-recurring. In addition, the company also believes that investors and financial analysts find this information to be helpful in analyzing the company’s financial and operational performance and comparing this performance to the company’s peers and competitors.The company defines “Non-GAAP Total Revenue” as total revenue plus acquisition-related deferred revenue. The company believes it is useful to include deferred revenue written down for GAAP purposes under purchase accounting rules in order to appropriately measure the underlying performance of its business operations in the period of activity and associated expense. Further, the company believes this measure is useful to investors as a way to evaluate the company’s ongoing performance because it provides a more accurate depiction of revenue arising from our strategic acquisitions.The company defines “Adjusted EBITDA” as net income, plus (1) acquisition-related deferred revenue, (2) depreciation, asset impairment, and the loss on disposal of assets, (3) amortization of product technologies and intangible assets, (4) change in fair value of equity investment, (5) loss due to cyber incident, net of recoveries, (6) acquisition-related expense (income), (7) organizational realignment costs, (8) regulatory and legal matters, (9) stock-based expense, (10) interest expense, net, and (11) income tax expense (benefit). The company believes that investors and financial analysts find this non-GAAP financial measures to be useful in analyzing the company’s financial and operational performance, comparing this performance to the company’s peers and competitors, and understanding the company’s ability to generate income from ongoing business operations.The company defines “Non-GAAP Net Income” as net income, plus (1) income tax expense (benefit), (2) acquisition-related deferred revenue, (3) asset impairment and (gain) loss on disposal of assets, (4) amortization of product technologies and intangible assets, (5) change in fair value of equity investment, (6) loss due to cyber incident, net of recoveries, (7) acquisition-related expense (income), (8) organizational realignment costs, (9) amortization of convertible note discount, (10) regulatory and legal matters, and (11) stock-based expense, less (12) provision for income tax expense based on an assumed rate in order to approximate the company’s long-term effective corporate tax rate. The company defines "Non-GAAP Weighted Average Diluted Shares Outstanding" as weighted average diluted shares outstanding excluding the impact of shares that are issuable upon conversions of our convertible notes. It is the current intent of the company to settle conversions of the convertible notes through combination settlement, which involves repayment of the principal portion in cash and any excess of the conversion value over the principal amount in shares of our common stock. We exclude these shares that are issuable upon conversions of our convertible notes because we expect that the dilution from such shares will be offset by the convertible note hedge transactions entered into in May 2017 in connection with the issuance of the convertible notes.

28
EXPLANATION OF NON-GAAP FINANCIAL MEASURESThe company defines “Non-GAAP On Demand Revenue” as total on demand revenue plus acquisition-related deferred revenue. In addition, the company may refer to derivatives of Non-GAAP On Demand Revenue such as product family details (i.e., Property Management, Resident Services, Leasing and Marketing and Asset Optimization) and other revenue detail (i.e., Subscription and Transactional). The company believes it is useful to include deferred revenue written down for GAAP purposes under purchase accounting rules and revenue deferred due to a lack of historical experience determining the settlement of the contractual obligation in order to appropriately measure the underlying performance of the company’s business operations in the period of activity and associated expense. Further, the company believes that investors and financial analysts find this measure to be useful in evaluating the company’s ongoing performance because it provides a more accurate depiction of on demand revenue arising from our strategic acquisitions.
The company defines “Ending On Demand Units” as the number of rental housing units managed by our clients with one or more of our on demand software solutions at the end of the period. We use ending on demand units to measure the success of our strategy of increasing the number of rental housing units managed with our on demand software solutions. Property unit counts are provided to us by our customers as new sales orders are processed. Property unit counts may be adjusted periodically as information related to our clients’ properties is updated or supplemented, which could result in adjustments to the number of units previously reported.
The company defines "Average On Demand Units "as the average of the beginning and ending on demand units for each quarter in the period presented. The company's management monitors this metric to measure of its success in increasing the number of on demand software solutions utilized by our clients to manage their rental housing units, our overall revenue, and profitability.The company defines “RPU,” or Revenue Per Unit, as ACV divided by ending on demand units. The company monitors this metric to measure its success in increasing the penetration of on demand software solutions utilized by its clients to manage their rental housing units. In addition, the company may refer to derivatives of RPU (i.e., Top 50) that highlight product penetration trends for its clients that have adopted the most software solutions.The company defines “ACV,” or on demand annual client value, as management's estimate of the annual value of the company's on demand revenue contracts at a point in time. The company's management monitors this metric to measure its success in increasing the number of on demand units, and the amount of software solutions utilized by our clients to manage their rental housing units. The company may also refer to derivatives of ACV (i.e., Top 100) that also highlight the company's success in increasing the number of on demand units, and the amount of software solution utilized by its top clients to manage their rental housing units.
The company excludes or adjusts each of the items identified below from the applicable non-GAAP financial measure referenced above for the reasons set forth with respect to each excluded item:
Non-GAAP tax rate – The GAAP tax rate includes certain tax items which may include, but are not limited to: income tax expenses or benefits that are not related to ongoing business operations in the current year; unusual or infrequently occurring items; benefits from stock compensation deductions for tax purposes that exceed the stock compensation expense recognized for GAAP; tax adjustments associated with fluctuations in foreign currency re-measurement; certain changes in estimates of tax matters related to prior fiscal years; certain changes in the realizability of deferred tax assets and liabilities; and changes in tax law. In 2019 the company uses a Non-GAAP tax rate of 26% to approximate the company’s long-term effective corporate tax rate. For 2020 guidance purposes, the company uses a Non-GAAP tax rate of 24.0% to approximate the company's long-term effective corporate tax rate. We believe excluding these items assists investors and analysts in understanding the tax provision and the effective tax rate related to ongoing operations.
29
EXPLANATION OF NON-GAAP FINANCIAL MEASURESAcquisition-related deferred revenue – These items are included to reflect deferred revenue written down for GAAP purposes under purchase accounting rules in order to appropriately measure the underlying
performance of our business operations in the period of activity and associated expense.
Asset impairment and (gain) loss on disposal of assets – These items comprise gains and/or losses on the disposal and impairment of long-lived assets and impairment of indefinite-lived intangible assets, which are not reflective of the company's ongoing operations. We believe exclusion of these items facilitates a more accurate comparison of the company's results of operations between periods.
Depreciation of long-lived assets – Long-lived assets are depreciated over their estimated useful lives in a manner reflecting the pattern in which the economic benefit is consumed. Management is limited in its ability to change or influence these charges after the asset has been acquired and placed in service. We do not believe that depreciation expense accurately reflects the performance of our ongoing operations for the period in which the charges are incurred and it is therefore not considered by management in making operating decisions.
Amortization of product technologies and intangible assets – These items are amortized over their estimated useful lives and generally cannot be changed or influenced by the company after initial capitalization. Accordingly, these items are not considered by the company in making operating decisions. The company does not believe such charges accurately reflect the performance of its ongoing operations for the period in which such charges are incurred.
Change in fair value of equity investment – This represents changes in fair value of our equity investment based on observable price changes in orderly transactions for an identical or similar investment of the same issuer. We believe exclusion of these items facilitates a more accurate comparison of our results of operations between periods as these items are not reflective of our ongoing operations.
Loss due to cyber incident, net of recoveries – This item relates to losses, net of recoveries, associated with the targeted email phishing campaign which led to a diversion of funds intended for disbursement to three clients in the second quarter of 2018. The company believes this loss is not reflective of its ongoing operations and is useful as it allows investors and financial analysts to evaluate our performance for different periods on a more comparable basis.
Acquisition-related expense (income) – These items consist of direct costs incurred in our business acquisition transactions and expenses related to integration activities, and the impact of changes in the fair value of acquisition-related contingent consideration obligations. Examples of these direct costs include transaction fees, due diligence costs, acquisition retention bonuses and severance, and third-party consultants to assist with integration. We believe exclusion of these items facilitates a more accurate comparison of the results of the company’s ongoing operations across periods and eliminates volatility related to changes in the fair value of acquisition-related contingent consideration obligations.
Amortization of the convertible note discount – This item consists of non-cash interest expense related to the amortization of the discount recognized on the convertible notes issued in May 2017. Management excludes this item as it is not indicative of the company’s ongoing operating performance.
Organizational realignment – These items consist of direct costs associated with the alignment of our business strategies. In connection with these actions, we recognize costs related to termination benefits, exit costs associated with closure of facilities, certain asset impairments, cancellation of certain contracts, and other professional and consulting fees associated with these initiatives. We believe exclusion of these items facilitate a more accurate comparison of our ongoing results of operations between periods.
30
EXPLANATION OF NON-GAAP FINANCIAL MEASURESRegulatory and legal matters – These items are comprised of certain regulatory and similar costs and certain legal settlement costs, such as costs related to the company’s Hart-Scott-Rodino Antitrust
Improvements Act review process incurred in connection with our acquisitions or the settlement of certain legal matters. These items are excluded as they are irregular in timing and scope, and may not be indicative of our past and future performance. We believe exclusion of these items facilitates a more accurate comparison of the company’s results of operations between periods.
Stock-based expense – This item is excluded because these are non-cash expenditures that the company does not consider part of ongoing operating results when assessing the performance of our business, and also because the total amount of the expenditure is partially outside of its control because it is based on factors such as stock price, volatility, and interest rates, which may be unrelated to the company’s performance during the period in which the expenses are incurred.