q4 2018 earnings call presentation - itape.com relations/presentations... · and the assumptions...
TRANSCRIPT

2018 Fourth Quarter and Full YearEarnings Call PresentationMarch 13, 2019
Greg Yull | President & CEOJeff Crystal | CFO

INTERTAPE POLYMER GROUP 2March 13, 2019
Safe Harbor Statement Certain statements and information included in this presentation constitute "forward-looking information" within the meaning of applicable Canadian securities legislation and "forward-lookingstatements" within the meaning of Section 27A of the Securities Act of 1933, as amended, and Section 21E of the Securities Exchange Act of 1934, as amended (collectively, "forward-lookingstatements"), which are made in reliance upon the protections provided by such legislation for forward-looking statements. All statements other than statements of historical facts included in thispresentation, including statements regarding 2019 objectives, the Company’s growth opportunities, including its 2019 objectives, the Company's capital investment strategies and acquisitionstrategies, the Company's capital expenditures, including its anticipated cost, return expectations and additional related costs, the Company's strong market position in water-activated tapes, theCompany’s greenfield manufacturing facilities and production lines, including the total cash consideration and timing, the Company’s integration of its recent acquisitions, the Company’s near-termgrowth drivers and the Company's fiscal year 2019 outlook, including revenue, Adjusted EBITDA, capital expenditures, effective tax rate and income tax expenses may constitute forward-lookingstatements. These forward-looking statements are based on current beliefs, assumptions, expectations, estimates, forecasts and projections made by the Company's management. Words such as"may," "will," "should," "expect," "continue," "intend," "estimate," "anticipate," "plan," "foresee," "believe," or "seek" or the negatives of these terms or variations of them or similar terminology areintended to identify such forward-looking statements. Although the Company believes that the expectations reflected in these forward-looking statements are reasonable, these statements, by theirnature, involve risks and uncertainties and are not guarantees of future performance. Such statements are also subject to assumptions concerning, among other things: business conditions andgrowth or declines in the Company's industry, the Company's customers' industries and the general economy; the anticipated benefits from the Company's manufacturing facility expansions,greenfield developments, manufacturing cost reduction programs and other restructuring efforts; the anticipated benefits from the Company’s acquisitions and partnerships; accounting adjustments;the anticipated benefits from the Company’s capital expenditures; the quality and market reception of the Company's products; the effective tax rate and income tax expenses; the Company'santicipated business strategies; risks and costs inherent in litigation; risks and costs inherent in the Company’s intellectual property; the Company’s ability to maintain and improve quality andcustomer service; the Company’s ability to retain, and adequately develop and incentivize, its management team and key employees; anticipated trends in the Company's business; anticipated cashflows from the Company’s operations; the Company’s flexibility to allocate capital as a result of the Notes Offering; availability of funds under the Company’s 2018 Credit Facility; the Company'sability to continue to control costs; the impact of raw material price fluctuations; movements in the prices of key inputs such as raw material, freight, energy and labor; government policies, includingthose specifically regarding the manufacturing industry, such as industrial licensing, environmental regulations, labor and safety regulations, import restrictions and duties, intellectual property laws,excise duties, sales taxes, and value added taxes; accidents and natural disasters; changes to accounting rules and standards; expected strategic and financial benefits from the Company’songoing capital investment and mergers and acquisitions programs; and other factors beyond the Company's control. The Company can give no assurance that these statements and expectationswill prove to have been correct. Actual outcomes and results may, and often do, differ from what is expressed, implied or projected in such forward-looking statements, and such differences may bematerial. You are cautioned not to place undue reliance on any forward-looking statement.
For additional information regarding important factors that could cause actual results to differ materially from those expressed in these forward-looking statements and other risks and uncertainties,and the assumptions underlying the forward-looking statements, you are encouraged to read "Item 3. Key Information - Risk Factors," "Item 5. Operating and Financial Review and Prospects(Management's Discussion & Analysis)" and statements located elsewhere in the Company's annual report on Form 20-F for the year ended December 31, 2017 and the other statements andfactors contained in the Company's filings with the Canadian securities regulators and the US Securities and Exchange Commission. Each of these forward-looking statements speaks only as of thedate of this presentation. The Company will not update these statements unless applicable securities laws require it to do so.
This presentation contains certain non-GAAP financial measures as defined under applicable securities legislation, including Adjusted EBITDA, Adjusted EBITDA Margin, Adjusted Net Earnings,Adjusted Earnings Per Share, Secured Net Leverage Ratio, Total Leverage Ratio and Free Cash Flow. The Company has included these non-GAAP financial measures because it believes that theyallow investors to make a more meaningful comparison between periods of the Company’s performance, underlying business trends and the Company’s ongoing operations. The Company furtherbelieves these measures may be useful in comparing its operating performance with the performance of other companies that may have different financing and capital structures, and tax rates.Adjusted EBITDA excludes costs that are not considered by management to be representative of the Company’s underlying core operating performance, including certain non-operating expenses,non-cash expenses and non-recurring expenses. In addition, adjusted EBITDA is used by management to set targets and is a metric that, among others, can be used by the Company’sCompensation Committee to establish performance bonus metrics and payout, and by the Company’s lenders and investors to evaluate the Company’s performance and ability to service its debt,finance capital expenditures and acquisitions, and provide for the payment of dividends to shareholders. The Company has included Adjusted Net Earnings and Adjusted Earnings Per Sharebecause it believes that they permit investors to make a more meaningful comparison of the Company’s performance between periods presented by excluding certain non-cash expenses and non-recurring expenses. In addition, Adjusted Net Earnings and Adjusted Earnings Per Share are used by management in evaluating the Company’s performance because it believes they provideindicators of the Company’s performance that are often more meaningful than GAAP financial measures for the reasons stated in the previous sentence. The Company has included Free CashFlows because it is used by management and investors in evaluating the Company’s performance and liquidity. As required by applicable securities legislation, the Company has provided definitionsof these non-GAAP measures contained in this presentation, as well as a reconciliation of each of them to the most directly comparable GAAP measure, on its website at http://www.itape.comunder “Investor Relations” and “Events and Presentations” and “Investor Presentations”. You are encouraged to review the related GAAP financial measures and the reconciliation of non-GAAPmeasures to their most directly comparable GAAP measures set forth on the website and should consider non-GAAP measures only as a supplement to, not as a substitute for or as a superiormeasure to, measures of financial performance prepared in accordance with GAAP.
Variance, ratio and percentage changes in this presentation are based on unrounded numbers. All dollar amounts are in US dollars.

INTERTAPE POLYMER GROUP 3March 13, 2019
Maiweaveacquisition
Second Midland linecommissioned(1)
Senior unsecurednotes offering
Strengthening ourproduct bundle
Expandinggeographically
Driving operationalexcellence
STRATEGIES HIGHLIGHTS
(1) Subsequent to the end of the period
Positioning IPG as a global leader in packaging and protective solutions
Q4 2018 Progress

INTERTAPE POLYMER GROUP 4March 13, 2019
2019 Objectives
Completetwo greenfield
projects inIndia
Continuedintegration
of recentacquisitions
Pay downdebt
Focused on operational execution

INTERTAPE POLYMER GROUP 5March 13, 2019
Successful Completion of Capital Investment Strategy
$15-20M:minimumlevel ofannualcapex
100
90
80
70
60
50
40
30
20
10
0
(Inm
illio
nsof
US
dolla
rs)
2014 2015 2016 2017 2018 2019 2020
41
34
50
85
76
40-60
Capex Investment Profile(USD millions) 15% IRR after-tax, hurdle rates on
strategic capex
$161Mdeployed sinceJan 1, 2017including...
$115M3 new greenfieldfacilities
5projectscompleted on timeand on budget
2projects ongoingexpectedcompletion 1H2019
Focused on start-up, base-loading and optimizingproduction at 3 new greenfield facilities
2019: Expect return to normalized capex run rate of $45-55M annually
45-55
INTERTAPE POLYMER GROUP 6March 13, 2019
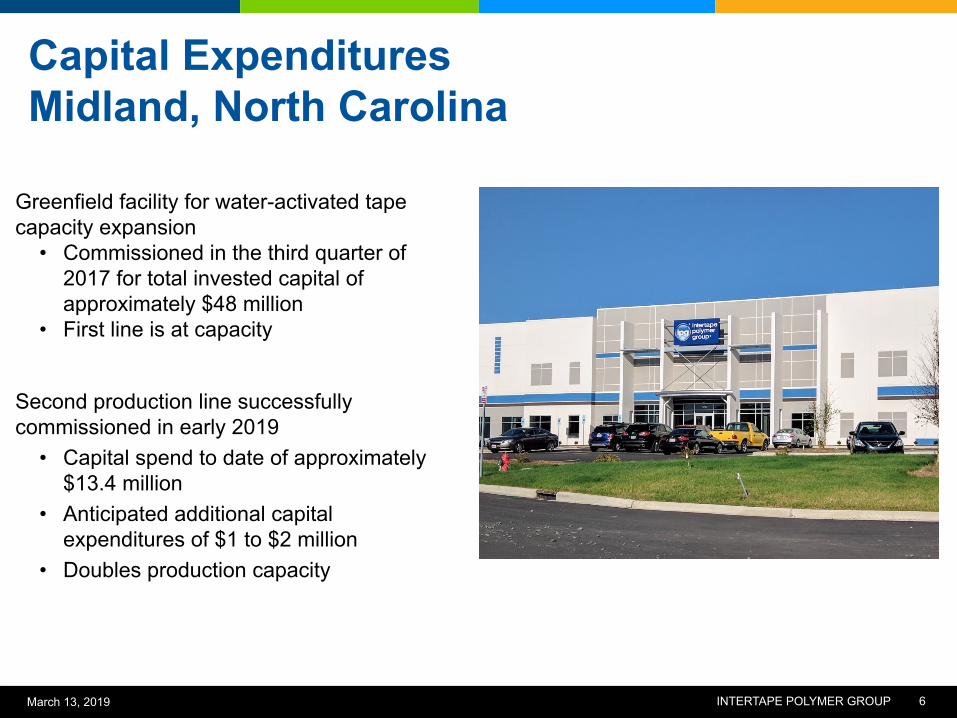
Capital ExpendituresMidland, North Carolina
Greenfield facility for water-activated tapecapacity expansion
• Commissioned in the third quarter of2017 for total invested capital ofapproximately $48 million
• First line is at capacity
Second production line successfullycommissioned in early 2019
• Capital spend to date of approximately$13.4 million
• Anticipated additional capitalexpenditures of $1 to $2 million
• Doubles production capacity

INTERTAPE POLYMER GROUP 7March 13, 2019
Investing in e-commerce
Dominant market position in water-activated tapes
WATER-ACTIVATED TAPES PRODUCTION:
2 lines in Midland, NC$48M first line – Q3 2017$15M second line – Q1 2019DOUBLES PRODUCTION1/3 CAPITAL COST
… plus Menasha, WI, production
PACKAGING:
Water-activated tapesHot-melt & acrylic tapesStretch film
PROTECTIVE:
Bubble cushionMailersAir pillowFoamPaper void fill
SHIP IN OWN CONTAINER (SIOC):
Shrink wrap

INTERTAPE POLYMER GROUP 8March 13, 2019
Greenfield Projects in India
• $25.3 million spent through the end of 2018• Expected total investment of $28 to $32 million
• $14.2 million spent through the end of 2018• Expected total investment between $18 and $20 million
Powerband - Carton Sealing Tapes
• Construction completed• Equipment installation and product trials in process• Commercial operations expected to commence in the first half of 2019
Dahej, India
Capstone - Woven Products
Karoli, India

INTERTAPE POLYMER GROUP 9March 13, 2019
Acquisitions and Integration Update
Maiweave Acquisition Polyair Integration
WOVEN PRODUCTS:
Grain and salt pond coversPit and pond linersShelter fabricsOutdoor mediaLumber mill packaging
GEOGRAPHIC EXPANSION:
Strong position in southeast U.S.building & construction complementsIPG's footprint
OPERATIONAL EFFICIENCIES:
Opportunity to baseload Capstonefacility with product formerly procuredfrom third parties
Unified sales team approach
Early success with cross selling
Scale of IPG provides access tobroader range of distributors
Accelerating vertical integration ofmaterial input
KEY ATTRIBUTES PERFORMING:
PRODUCTS
PLANTS
PEOPLE

INTERTAPE POLYMER GROUP 10March 13, 2019
Q4 2017 to Q4 2018 FY2017 to FY2018Beginning 237.4 898.1Volume effect (1) 6.4 2.7% 15.9 1.8%Price/Mix effect 6.9 2.9% 47.6 5.3%Acquisitions (2) 37.0 15.6% 91.4 10.2%Ending 287.7 21.2% 1,053.0 17.2%
Revenue Analysis(USD Millions)
(1) Excluding acrylic carton sealing tape, sales volume increased 4.4% in the fourth quarter of 2018 compared to the same period last year, and 3.0%in 2018 compared to 2017. The impact of significant volume changes in the acrylic carton sealing tape product line impacts the sales volumedisproportionately compared to its impact on revenue dollars since the acrylic tape is a very low-priced product line.
(2) Results for Cantech reflected beginning on the date acquired, July 1, 2017. Results for Airtrax reflected beginning on the date acquired, May 11,2018. Results for Polyair reflected beginning on the date acquired, August 3, 2018.

INTERTAPE POLYMER GROUP 11March 13, 2019
Q4 2018 Q4 2017Q4 2018 vs
Q4 2017Full Year
2018Full Year
20172018 vs
2017Revenue 287.7 237.4 21.2 % 1,053.0 898.1 17.2 %Gross profit 56.6 54.0 4.8 % 218.9 201.4 8.7 %Gross margin 19.7% 22.8 % (307 bps) 20.8% 22.4% (164 bps)SG&A (2) 31.5 34.1 (7.8)% 122.5 107.6 13.8 %IPG Net Earnings 10.6 21.3 (50.1)% 46.8 64.2 (27.2)%IPG EPS, fully diluted 0.18 0.36 (50.0)% 0.79 1.08 (26.6)%Adjusted net earnings (3) 14.2 17.9 (20.5)% 62.2 63.7 (2.3)%Adjusted EPS, fully diluted (3) 0.24 0.30 (20.4)% 1.05 1.07 (1.5)%Adjusted EBITDA (3) 38.5 35.7 8.0 % 140.9 129.6 8.7 %Adjusted EBITDA margin (3) 13.4% 15.0 % (166) bps 13.4% 14.4% (105 bps)Effective tax rate (4) 6.8% (13.2)% 1990 bps 17.4% 16.9% 50 bps
Summary Q4 2018 and Annual 2018 Results(USD Millions) (1)
(1) Excluding earnings per share (“EPS”).(2) Selling, general and administrative expenses ("SG&A") in the fourth quarter of 2018 and fourth quarter of 2017 includes $0.4 million and $6.4 million in share-based compensation expense
and $2.2 million and $1.9 million in M&A Costs, respectively. SG&A in 2018 and 2017 includes $1.9 million and $3.3 million in share-based compensation expense and $7.5 million and $5.8million in advisory fees and other costs associated with mergers and acquisitions activity, including due diligence, integration and other certain non-cash purchase price accounting adjustments("M&A Costs"), respectively.
(3) Non-GAAP financial measure. Please see the “Safe Harbor Statement” for an explanation of the Company’s use of these measures and a cross-reference to a reconciliation to their respectivemost directly comparable GAAP measure.
(4) The Company recognized a net tax benefit of approximately $9.6 million in the fourth quarter 2017, primarily due to the one-time remeasurement of the US net deferred tax liability using thelower US corporate tax rate provided under the Tax Cuts and Jobs Act 2017.

INTERTAPE POLYMER GROUP 12March 13, 2019
Adjusted EBITDA Adj. EBITDA Margin
2015 2016 2017 2018
104122 129.6
140.9
13.3%
15.1%14.4%
13.4%
Organic plus acquisitions driving adj EBITDA growth:Margin expansion opportunities exist from acquisitions below Intertape margin, but create short-termpressure on margins(USD millions)
Our primary focus: accretive EPS & adj EBITDA dollars

INTERTAPE POLYMER GROUP 13March 13, 2019
Conservative Capital Structure: Sustainable Cash Flow Profile
Senior Unsecured Notes$250M at 7%
• Flexibility to allocate capital at a historically attractivefixed interest rate
• Repaid a portion of the borrowings outstanding under$600M credit facility & general corporate purposes
2018 Credit Facility$600M facility
• $366.2M unused availability
• 4.26% interest rate in 2018 including 200 bps ofcredit spread
CapEx Free Cash Flow
908070605040302010
02015 2016 2017 2018 2019
Well positioned to grow free cash flow with completion of capex program
Sustainable dividends withincreasing ability for debt repayment(USD millions)
2019 marks end of current investment cycle:Expect ↓ Capex and ↑ Operating Cash Flow to drivesignificant Free Cash Flow (1)
(1) Non-GAAP financial measure. Please see the “Safe Harbor Statement” for an explanation of theCompany’s use of these measures and a cross-reference to a reconciliation to their respective mostdirectly comparable GAAP measure.
• $393.9M cash and loan availability
• 1.6x Secured Net Leverage Ratio(1)
• 3.3x Total Leverage Ratio (1)
Overall

INTERTAPE POLYMER GROUP 14March 13, 2019
Outlook
The Company's expectations for fiscal year 2019 are as follows:
• Revenue in 2019 is expected to be between $1,180 and $1,220 million, excluding the impact of anymerger and acquisitions activity that takes place in 2019, and any significant fluctuations in sellingprices caused by unforeseen variations in raw material prices.
• Adjusted EBITDA for 2019 is expected to be between $164 and $174 million. As in previous years,the Company expects adjusted EBITDA to be proportionately higher in the second, third and fourthquarters of the year relative to the first quarter due to the effects of normal seasonality.This estimateincludes the expected impact of new accounting guidance for leases whereby operating lease rentexpense will be classified as amortization of the right-of-use asset and interest expense on the relatedlease obligation, both of which are items excluded from the non-GAAP measure adjusted EBITDA,estimated to be between $6 and $7 million for the year ended December 31, 2019. For the yearended December 31, 2018, rent expense included in adjusted EBITDA was $4.6 million related tooperating leases that will be accounted for as right-of-use assets as of January 1, 2019.
• Total capital expenditures for 2019 are expected to be between $45 and $55 million.
• Excluding the potential impact of changes in the mix of earnings between jurisdictions, the Companyexpects a 25% to 30% effective tax rate for 2019 and cash taxes paid in 2019 to be two thirds of theincome tax expense in 2019, as a result of the anticipated changes in the tax treatment of intercompanydebt.

INTERTAPE POLYMER GROUP 15March 13, 2019
E-commerce Food and Beverage Building & Construction
Transportation Manufacturing Agriculture