q4 2013 gaap earnings conference call march 18, 2014doc.xueqiu.com/144d71db8d1893fe91826c19.pdf ·...
TRANSCRIPT

Delivering Better Energy
Q4 2013 GAAP Earnings Conference CallMarch 18, 2014
SolarCity Corporation | page 2
Forward-Looking StatementsThis presentation contains forward-looking statements that involve risks and uncertainties, including statements regarding SolarCity’s customer and market growth opportunities; financial strategies for cash generation and increasing shareholder value; the booking and deployment of megawatts including estimated Q1 2014 megawatt booking and deployment and full-year 2014 megawatt deployment; forecasted cash flow in 2014; expected future GAAP and non-GAAP operating and financial results; our control environment, including our disclosure controls and procedures and our internal controls over financial reporting, and our related remediation efforts; and assumptions relating to the foregoing. Forward-looking statements should not be read as a guarantee of future performance or results, and will not necessarily be accurate indications of the times at, or by, which such performance or results will be achieved, if at all. Forward-looking statements are subject to risks and uncertainties that could cause actual performance or results to differ materially from those expressed in or suggested by the forward-looking statements. As of the date hereof, we have bookings and financing for less than half of the orders needed to achieve our 2014 megawatt projections. In order to meet our projections, we will need to substantially expand our workforce, increase our installation efficiency and exceed our existing bookings rate relative to what we have achieved to date. Additional key risks and uncertainties include
the level of demand for our solar energy systems, the availability of a sufficient, timely, and cost-effective supply of solar panels and balance of system components, the effects of future tariffs and other trade barriers, changes in federal tax treatment, the effect of electric utility industry regulations, net metering and related policies, the availability and amount of rebates, tax credits and other financial incentives, the availability and amount of financing from fund investors, the retail price of utility-generated electricity or the availability of alternative energy sources, risks associated with SolarCity’s rapid growth, risks that consumers who have executed energy contracts included in reported MW Booked may seek to cancel those contracts, SolarCity’s limited operating history, particularly as a new public company, changes in strategic planning decisions by management or reallocation of internal resources, our ability and the ability of our third-party lease administrator to complete remediation efforts within expected time periods, and general market, political, economic and business conditions. You should read the section entitled “Risk Factors” in our most recent Annual Report on Form 10-K, which has been filed with the Securities and Exchange Commission, which identifies certain of these and additional risks and uncertainties. We do not undertake any obligation to publicly update or revise any forward-looking statement, whether as a result of new information, future developments or otherwise, except as otherwise required by law.

SolarCity Corporation | page 3
2013 Results
SolarCity Corporation | page 4
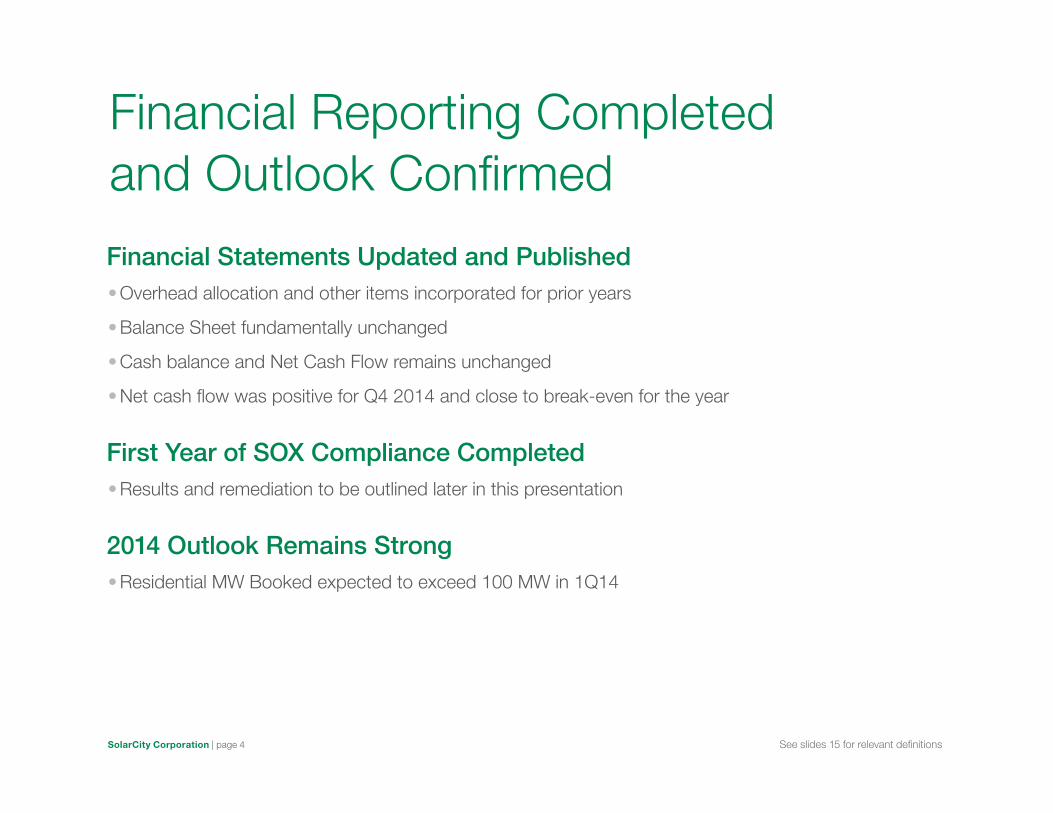
Financial Reporting Completed and Outlook Confirmed
Financial Statements Updated and Published •Overhead allocation and other items incorporated for prior years
•Balance Sheet fundamentally unchanged
•Cash balance and Net Cash Flow remains unchanged
•Net cash flow was positive for Q4 2014 and close to break-even for the year
First Year of SOX Compliance Completed •Results and remediation to be outlined later in this presentation
2014 Outlook Remains Strong •Residential MW Booked expected to exceed 100 MW in 1Q14
See slides 15 for relevant definitions
SolarCity Corporation | page 5
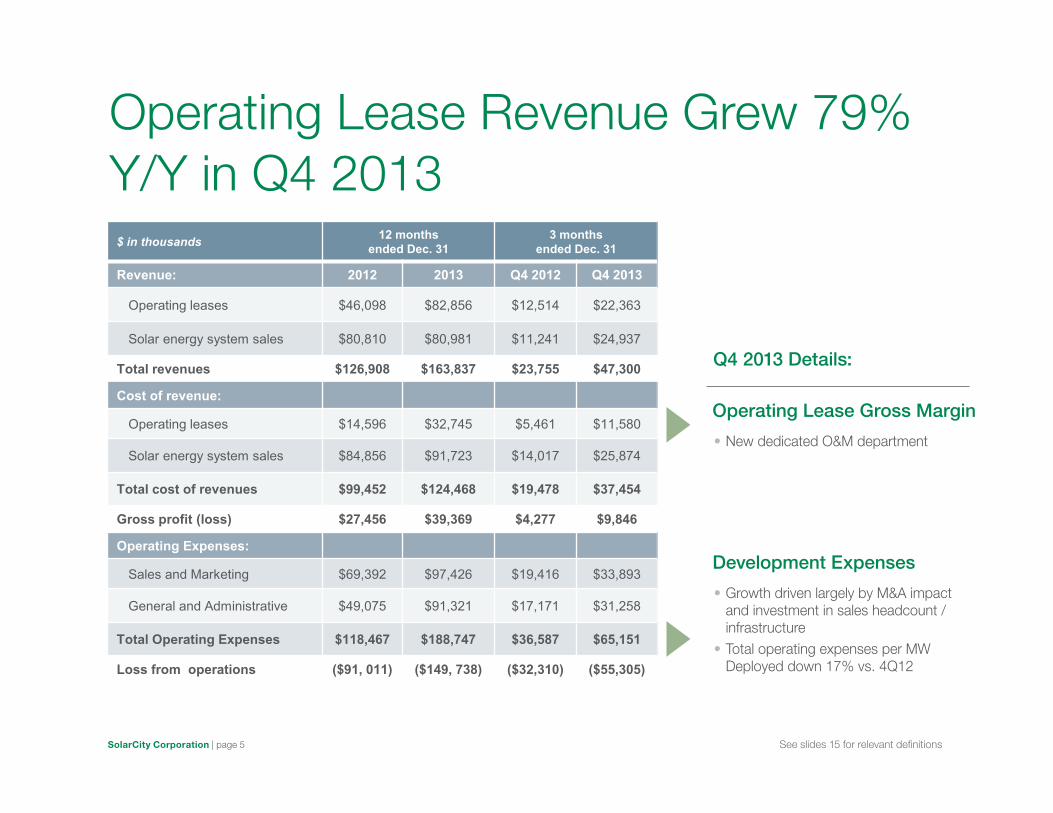
Operating Lease Revenue Grew 79% Y/Y in Q4 2013
See slides 15 for relevant definitions
Q4 2013 Details:
Operating Lease Gross Margin
• New dedicated O&M department
Development Expenses
• Growth driven largely by M&A impact and investment in sales headcount / infrastructure
• Total operating expenses per MW Deployed down 17% vs. 4Q12
$ in thousands 12 months ended Dec. 31
3 months ended Dec. 31
Revenue: 2012 2013 Q4 2012 Q4 2013
Operating leases $46,098 $82,856 $12,514 $22,363
Solar energy system sales $80,810 $80,981 $11,241 $24,937
Total revenues $126,908 $163,837 $23,755 $47,300
Cost of revenue:
Operating leases $14,596 $32,745 $5,461 $11,580
Solar energy system sales $84,856 $91,723 $14,017 $25,874
Total cost of revenues $99,452 $124,468 $19,478 $37,454
Gross profit (loss) $27,456 $39,369 $4,277 $9,846
Operating Expenses:
Sales and Marketing $69,392 $97,426 $19,416 $33,893
General and Administrative $49,075 $91,321 $17,171 $31,258
Total Operating Expenses $118,467 $188,747 $36,587 $65,151
Loss from operations ($91, 011) ($149, 738) ($32,310) ($55,305)

SolarCity Corporation | page 6
Strong Cash Balance and Cash Flow Positive in Q4 2013
$ in thousands Annual Quarterly
Net cash provided by (used in): 2012 2013 Q4 2012 Q4 2013
Operating activities $39,794 $174,515 $56,958 $13,865
Investing activities ($428,520) ($729,899) ($143,523) ($234,912)
Financing activities (before equity issuances) $323,129 $552,204 $104,548 $262,410
Net cash provided (used) before equity issuances ($65,597) ($3,180) $17,983 $41,363
Net cash provided by equity issuances $175,206 $420,180 $92,779 $402,731
Net increase in cash and cash equivalents $109,609 $417,000 $110,762 $444,094
Exited 2013 with a strong balance sheet enabling investment in future growth
and Net Cash Flow expected to be positive in 2014
Exited 2013 with a Cash balance of $577 million and Net Cash Flow for the full year 2013 close to break-even
See slides 15 for relevant definitions

SolarCity Corporation | page 7
M&A and O&M Update to GAAP Income Statement in 2014+
Gross Margin and Amortization of Intangibles •Non-cash expenses arising from recent M&A
• Incremental $3m per quarter of Operating Lease COGS
Operating Expenses and Amortization of Intangibles •Non-cash expenses arising from recent M&A
• Incremental $3m per quarter in Sales & Marketing expenses ($2m in 4Q13)
Dedicated O&M Department •Newly dedicated O&M department to be booked in operating lease COGS
•Affected 4Q13 gross margin by ~5 percentage points
•Expected to impact gross margin by 5 – 10 percentage points per quarter in 2014
See slides 15 for relevant definitions

SolarCity Corporation | page 8
Achieved SOX Compliance within First Year
Section 404 (a): management review of internal controls completed
Section 404 (b): auditor review of internal controls completed •Higher market valuation triggered acceleration in deadline to six months
A Total of 291 Controls and Reports Evaluated and Audited •Certain weaknesses identified
Remediation expected to completed by end of Q2 2014
See slides 15 for relevant definitions
SolarCity Corporation | page 9
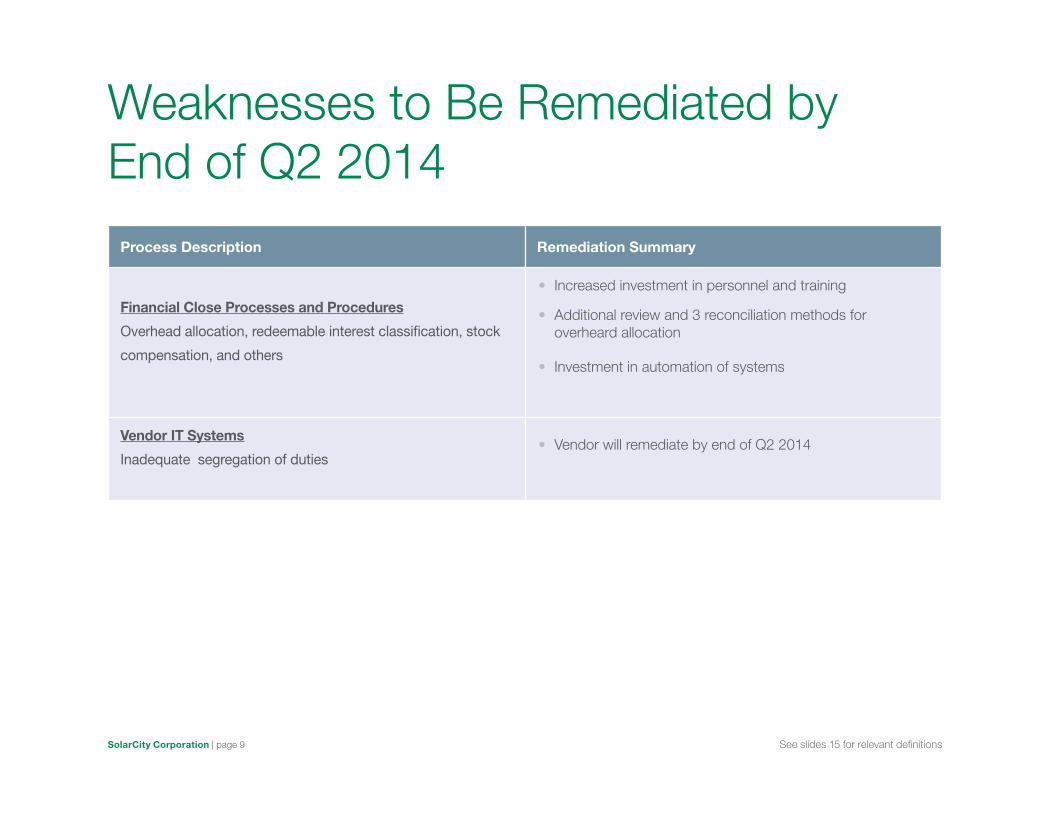
Weaknesses to Be Remediated by End of Q2 2014
Process Description Remediation Summary
Financial Close Processes and Procedures
Overhead allocation, redeemable interest classification, stock
compensation, and others
• Increased investment in personnel and training
• Additional review and 3 reconciliation methods for overheard allocation
• Investment in automation of systems
Vendor IT Systems
Inadequate segregation of duties • Vendor will remediate by end of Q2 2014
See slides 15 for relevant definitions
SolarCity Corporation | page 10
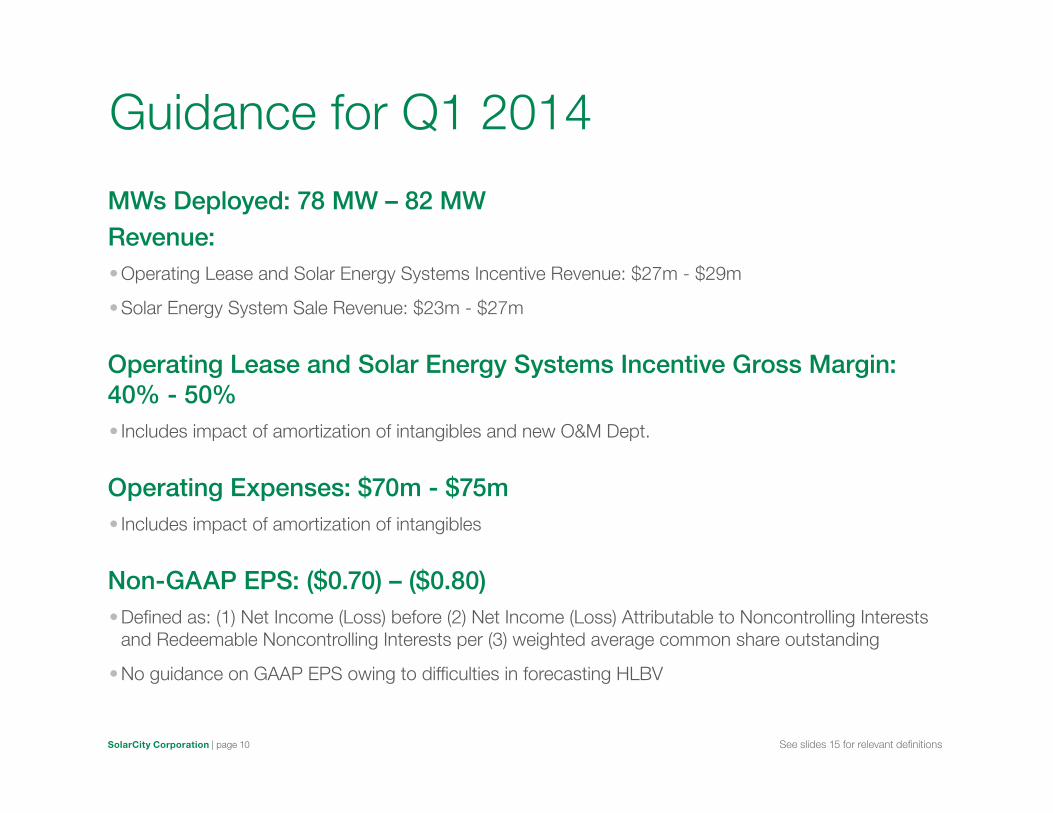
Guidance for Q1 2014
MWs Deployed: 78 MW – 82 MWRevenue:
•Operating Lease and Solar Energy Systems Incentive Revenue: $27m - $29m
•Solar Energy System Sale Revenue: $23m - $27m
Operating Lease and Solar Energy Systems Incentive Gross Margin: 40% - 50%
• Includes impact of amortization of intangibles and new O&M Dept.
Operating Expenses: $70m - $75m • Includes impact of amortization of intangibles
Non-GAAP EPS: ($0.70) – ($0.80) •Defined as: (1) Net Income (Loss) before (2) Net Income (Loss) Attributable to Noncontrolling Interests and Redeemable Noncontrolling Interests per (3) weighted average common share outstanding
•No guidance on GAAP EPS owing to difficulties in forecasting HLBV
See slides 15 for relevant definitions

SolarCity Corporation | page 11
Bookings Off to a Strong Start in 2014
With Residential MW Booked Expected to Be in Excess of 100 MW in Q1 2014 Based on Current Pace, Guidance for 2014 MW Deployed Reaffirmed at 475 – 525
2010 2011 2012 2013 2014E*
500
400
300
200
100
0
31
72
157
280
475-525
MW
s D
eplo
yed
in P
erio
d
1,200
1,000
800
600
400
200
0
Cum
ulat
ive
MW
Dep
loye
d
Annual Cumulative
* Represents the Company’s Estimates
See slides 15 for relevant definitions
SolarCity Corporation | page 12
Questions & Answers
SolarCity Corporation | page 13
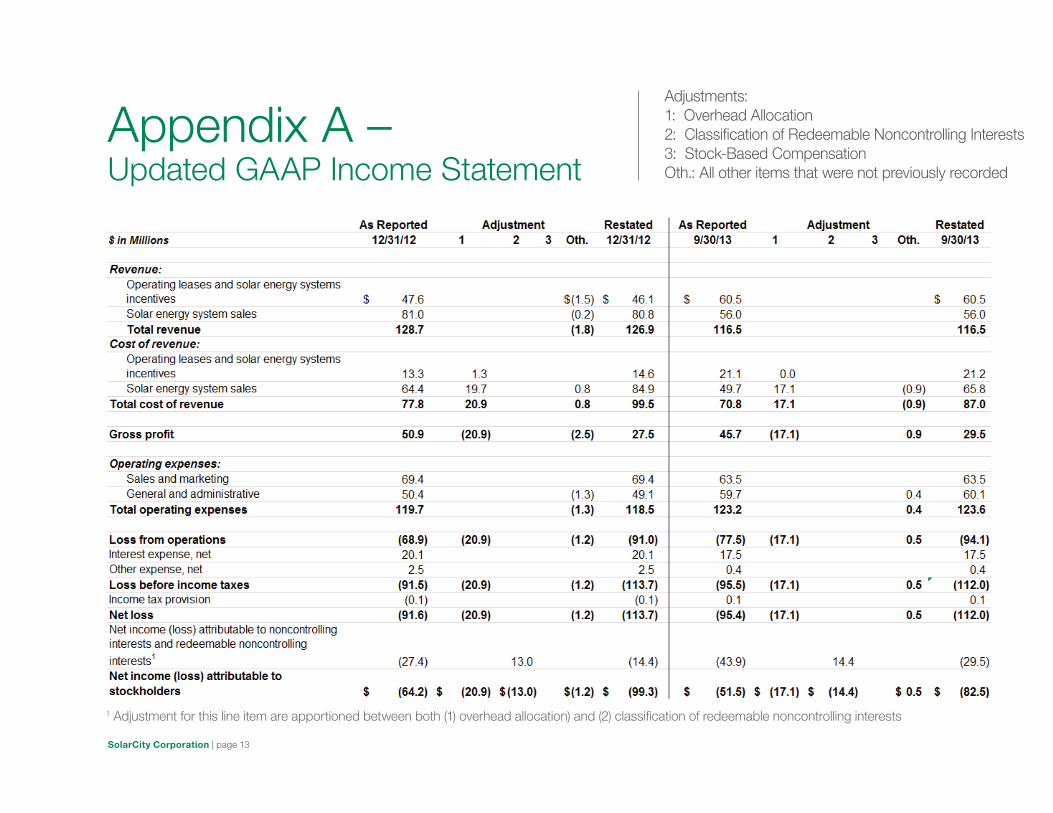
Appendix A – Updated GAAP Income Statement
Adjustments: 1: Overhead Allocation2: Classification of Redeemable Noncontrolling Interests3: Stock-Based CompensationOth.: All other items that were not previously recorded
1 Adjustment for this line item are apportioned between both (1) overhead allocation) and (2) classification of redeemable noncontrolling interests

SolarCity Corporation | page 14
Appendix B – Updated GAAP Balance Sheet
Adjustments: 1: Overhead Allocation2: Classification of Redeemable Noncontrolling Interests3: Stock-Based CompensationOth.: All other items that were not previously recorded

SolarCity Corporation | page 15
Appendix C – Definitions
“MW” or “megawatts” represents the DC nameplate megawatt production capacity. “MW Booked” represents the aggregate megawatt production capacity of solar energy systems pursuant to customer contracts signed during the applicable period net of cancellations during the applicable period. This metric includes solar energy systems booked under Energy Contracts as well as for solar energy system direct sales.
“MW Deployed” represents the megawatt production capacity of solar energy systems that have had all required building department inspections completed during the applicable period. This metric includes solar energy systems deployed under Energy Contracts as well as for solar energy system direct sales.
“Net Cash Flow” is calculated as (1) Net Cash Provided by Operating Activities, less (2) Net Cash Used in Investing Activities, plus (3) Net Cash Provided by Financing Activities, but excluding (4) Net Cash Provided by Equity (including Convertible Notes) Issuance.

SolarCity Corporation | page 16
Thank You
solarcity.com