q32014 project finance cover.ppt - thomson...
TRANSCRIPT
GLOBAL PROJECT FINANCE REVIEWREUTERS / Yannis Behrakis
GLOBAL PROJECT FINANCE REVIEWMANAGING UNDERWRITERS
First Nine Months 2014
]
First Nine Months 2014
Global Deals Intelligence
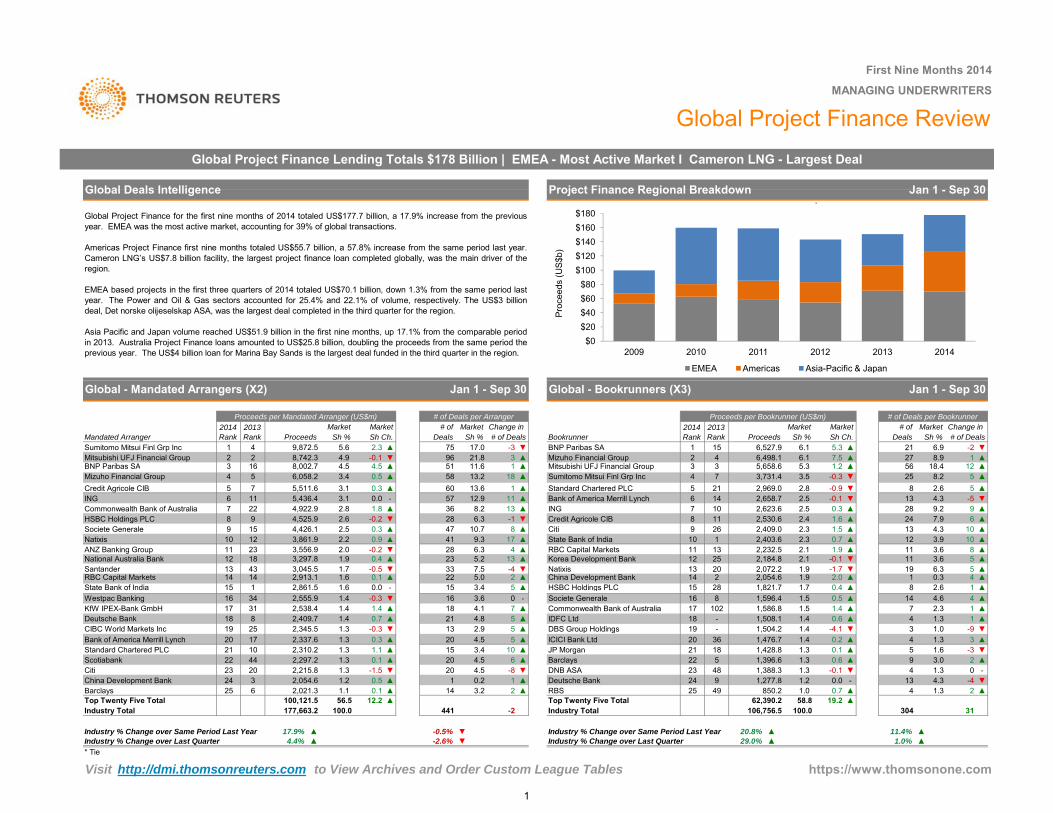
Global Project Finance Lending Totals $178 Billion | EMEA - Most Active Market I Cameron LNG - Largest Deal
Global Project Finance ReviewMANAGING UNDERWRITERS
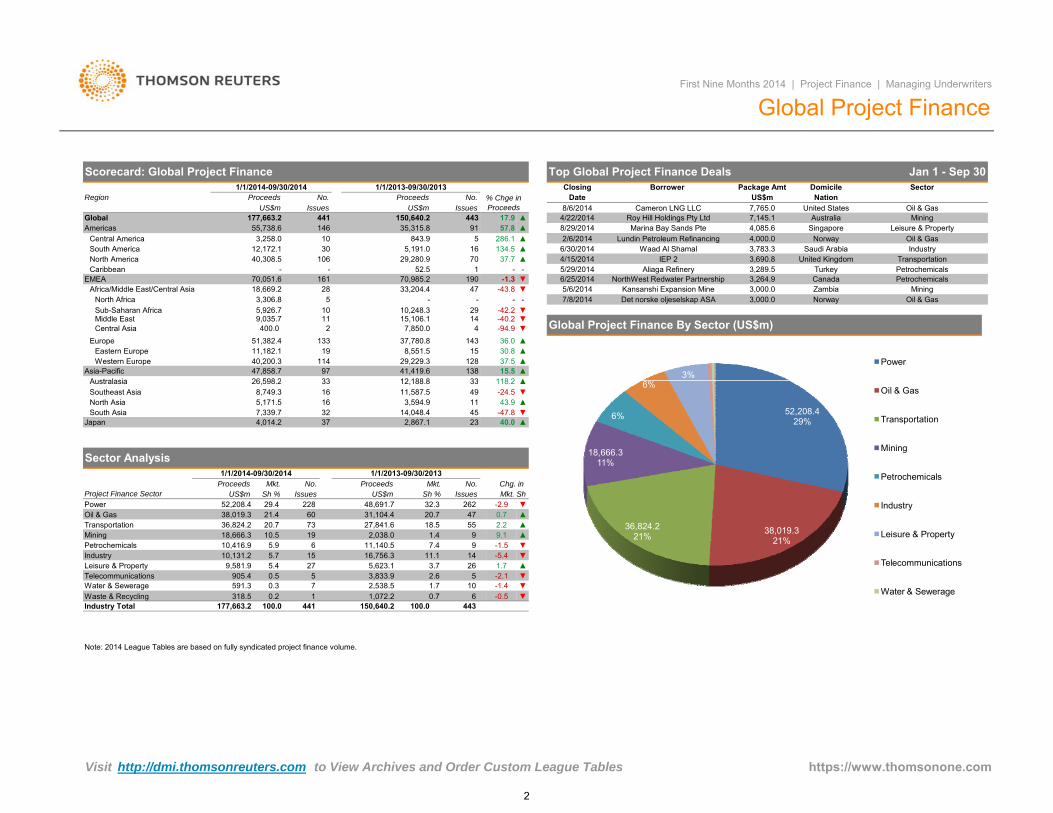
Global Project Finance for the first nine months of 2014 totaled US$177.7 billion, a 17.9% increase from the previousyear. EMEA was the most active market, accounting for 39% of global transactions.
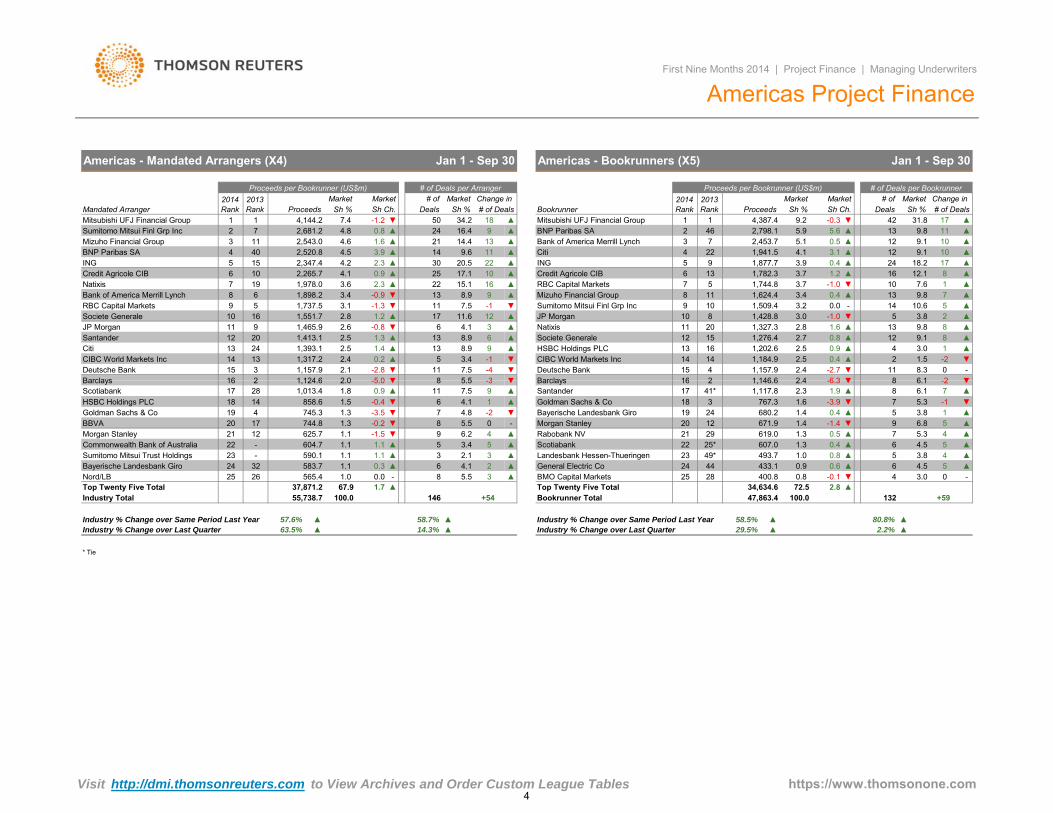
Americas Project Finance first nine months totaled US$55.7 billion, a 57.8% increase from the same period last year.Cameron LNG’s US$7.8 billion facility, the largest project finance loan completed globally, was the main driver of theregion.
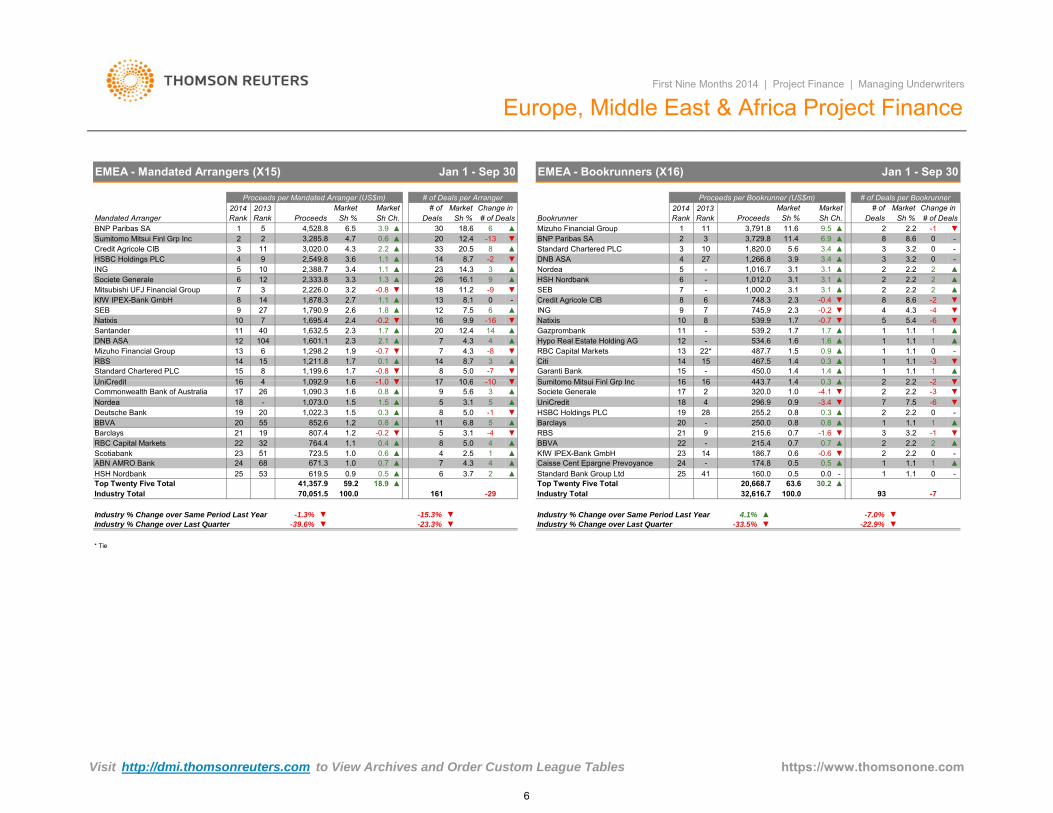
EMEA based projects in the first three quarters of 2014 totaled US$70.1 billion, down 1.3% from the same period lastyear. The Power and Oil & Gas sectors accounted for 25.4% and 22.1% of volume, respectively. The US$3 billiondeal, Det norske olijeselskap ASA, was the largest deal completed in the third quarter for the region.
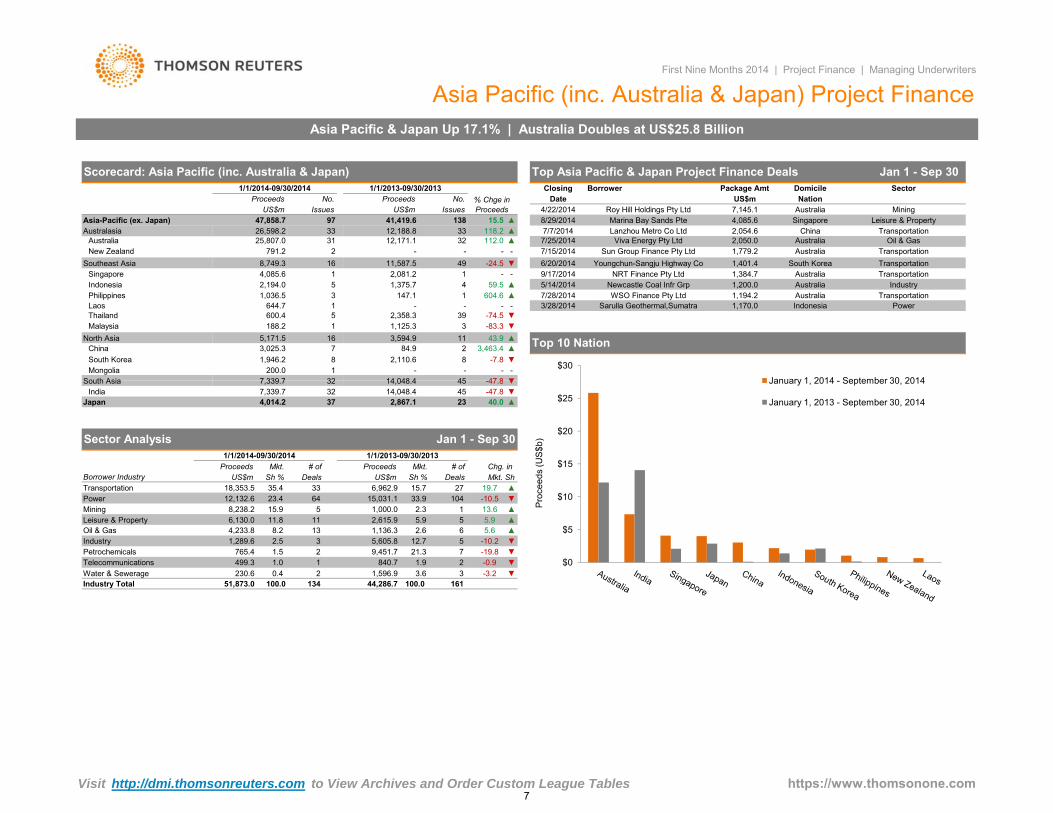
Asia Pacific and Japan volume reached US$51.9 billion in the first nine months, up 17.1% from the comparable periodin 2013. Australia Project Finance loans amounted to US$25.8 billion, doubling the proceeds from the same period theprevious year. The US$4 billion loan for Marina Bay Sands is the largest deal funded in the third quarter in the region.
Project Finance Regional Breakdown Jan 1 - Sep 30
$0$20$40$60$80
$100$120$140$160$180
2009 2010 2011 2012 2013 2014
Proc
eeds
(US$
b)
EMEA Americas Asia-Pacific & Japan
* Tie
▲-0.5%-2.6% ▼ ▲
Industry % Change over Same Period Last Year1.0%
Global - Mandated Arrangers (X2) Global - Bookrunners (X3)Jan 1 - Sep 30
Industry % Change over Last Quarter
Industry Total -2
20.8%Industry % Change over Last Quarter4.4%
▼
Top Twenty Five Total
Industry % Change over Same Period Last Year
Jan 1 - Sep 30
▲
58.8▲1.3
100.0
▲
31
4.3▲ 2
4
30462,390.2 ▲19.2
0.0-0.1 ▼
-1.21.31,388.3
24
▲1.3
0.7
0.6
1.049 850.2
485
1,277.8
1,396.6
9
1,476.71,504.2
18 0.11.31.4 0.2
-4.1
1,428.8
▲
1.6▲ 5
1,508.1 1.4 0.6
4 1.3▲
1,586.8 2.3
3▼1.4
1.7 0.41,596.4
74
4.6141.5 0.5 ▲1.5 1.4 ▲
2.0▲ 8 2.6▲▼
# of Deals per BookrunnerMarket2014
Rank Sh %
-1.7 6.3
Bookrunner
Proceeds per Bookrunner (US$m)Market
# of Deals
# of Deals per ArrangerChange in 2014
RankMarket
Proceeds per Mandated Arranger (US$m)
Sh % Sh %Deals2013 Rank
# ofSh %Proceeds Sh Ch.
Change in MarketDeals # of Deals
DNB ASA
15 28
9
13
10Citi
Korea Development BankNatixis
RBC Capital Markets
RBS 25
Barclays
14
4.5
1 0.220
2223
▲Citi
Barclays
8
MarketSh Ch.
# of
1.6
2,538.4 1.4
Bank of America Merrill Lynch
16
3.1
-0.2
1.61 0.0
-0.3
3,045.518
2524China Development Bank
22
6
2,310.2
2,861.5
2,409.7
4,525.94,426.1
14
3,297.823
43
23
Standard Chartered PLC 21Scotiabank
318
KfW IPEX-Bank GmbH
CIBC World Markets Inc
Westpac Banking
32044
17
34
20
1819
17
10
0.4-0.5
1.42,555.9
1.4
1.9
1.4
1.72,913.1
25
1112
Santander
State Bank of India
13
Deutsche Bank
15RBC Capital Markets 14
2.23,861.92.5
ANZ Banking GroupNational Australia Bank
5,436.422 4,922.9
2.03,556.9
▼
3.1
2.82.6 28
▲1.8 360.0
60
12-0.3
10
12.5
2154
6 148.2
8 2.6▼5 2.8Standard Chartered PLC 2,969.012.9
▲
6.1 5.3
3.5
▲▲7.5 ▲
21 6.918.9▲
▼-22756
6,527.94
3,731.4Sumitomo Mitsui Finl Grp Inc
1
7
BNP Paribas SA 156,498.128,742.3
▲ 33Mitsubishi UFJ Financial Group21.8
4.5-0.1 Mizuho Financial Group
▲3.4 13.20.5
6.1▲5,658.6
▲58
96
▲25▲
13.6 -0.9▼ ▲
58.2
▲
-3▼
18.418
11.6 ▲31 5.3 1.2
75
514.5
Mandated Arranger1
2013 Rank
Sumitomo Mitsui Finl Grp Inc ▲
36,058.2
5.6
8,002.74.9
17.0
MarketProceeds
9,872.5 2.34Mitsubishi UFJ Financial Group
Mizuho Financial Group
2 2BNP Paribas SA 16
4 55 7Credit Agricole CIB
1215
115,511.6
570.3 ▲
Natixis 10Societe Generale 9
97
▲ 23
ING 6
HSBC Holdings PLCCommonwealth Bank of Australia
8
‐
41▼
11
26
ING
2,409.0 2.3
2,658.7
2,530.68Credit Agricole CIB
Bank of America Merrill Lynch▲13 7
▼
▲6112,623.6 ▲
-0.12.5
-59.2 ▲
2.40.31.6 ▲ 24
▼ 7.52,184.8
2.1
▲
28 6.3 4
8 ▲ ▲104.3131
9
▲
7.9
0.7
1328
4.3
2,072.2
1.52,403.6
▲
▼
3.9
1.9
▲
▼10.7
6.3
9.3 17
-1
33▲
0.90.3
▼
State Bank of India▲▲-0.2
47
▲
5.2
2-4
0
0.15
13
‐ 3.422
Commonwealth Bank of Australia
DBS Group HoldingsICICI Bank Ltd
▲
▲
▲5.0
15▲
16718
▼
▲
3.6
▼0.7
▲ 4.1
134.8212.92,345.5
0.3 ▲
20
1.32,337.6 1.3 20
▲
-0.3
▲ ▲3.4
-1.5
1.3 1.1 156
4.5 -8
5
17
21
IDFC Ltd
JP Morgan▲
1920
5
▲
1
11
10▲▼
5
‐1,821.7
20
0.11.32,297.2
1.2 0.52,215.8 1.32,054.6
▼
102.3▲
121.9
▲
190.3 4
▲58
2.13.6
▲
3.6▼ 11
15
18
12
16
2513 11
-0.12,232.5
102
1.92
▲
▲
Societe Generale
2,054.6
Deutsche Bank
HSBC Holdings PLC
36-
▼China Development Bank 14
-
100,121.5 56.51.12,021.3 2
4.5
▲3.20.1▲12.2▲
441177,663.2 100.0
▲
Top Twenty Five TotalIndustry Total
17.9% 11.4%29.0%
106,756.5
▲
▲
▼3.0 2
1
-91.3 1
▼-4
▲1.3
13‐
▲
4
-33▼
▲
▲
▲
1 ▲
90
4
1.0
Visit http://dmi.thomsonreuters.com to View Archives and Order Custom League Tables https://www.thomsonone.com
1
South AmericaCentral America 10
Europe
EMEA- - 52.5
1/1/2014-09/30/2014
-
1/1/2013-09/30/2013
Caribbean
Global Project Finance
United StatesRegion
▲Oil & Gas
% Chge in Proceeds
NationPackage Amt
7,145.1
US$mDomicile
Leisure & Property
Date
286.1
Closing
4/22/2014
▲
7,765.0
Borrower
4,000.0
8/6/2014
4,085.6
10,248.3
70
35,315.8
5,191.0▲ 4/15/2014-
▼
▲57.8
18,669.2
134.5
1
Americas
6/30/2014
28
First Nine Months 2014 | Project Finance | Managing Underwriters
Oil & GasNorway12,172.1
AustraliaRoy Hill Holdings Pty LtdCameron LNG LLC
2
11,182.1133
161
400.0
40,308.5
19
70,051.6
5
10630
3,258.016
Global 177,663.2
--
441
37,780.8
47,858.7
North Africa
Australasia
9,035.7
Mining55,738.6
US$mNo. No.
Issues
3,289.5
US$mProceeds
Issues
5
Proceeds
146843.9
190 NorthWest Redwater Partnership
150,640.2 17.9443
70,985.2
91
29,280.9
▼
8/29/20142/6/2014
Waad Al Shamal▲
Marina Bay Sands PteLundin Petroleum Refinancing
Sector
Scorecard: Global Project Finance
PetrochemicalsNorth America
51,382.4
Sub-Saharan AfricaMiddle East
3,306.8Africa/Middle East/Central Asia
Central Asia
5,926.7
33,204.4
Eastern Europe
97
15
33
15,106.11110
40,200.3 114 29,229.3
4
41,419.6
29
33
47
8,551.5
7,850.0
12 188 8
Western EuropeAsia-Pacific
118 2 ▲26 598 2
30.8143
▲128
14
36.0▼▲
37.5▲
-43.8
5/29/2014-1.3 6/25/2014 Petrochemicals
MiningZambiaDet norske oljeselskap ASA NorwayKansanshi Expansion Mine
-
37.7 IEP 2Aliaga Refinery
3,264.9▼ 5/6/2014
-
Global Project Finance By Sector (US$m)
Oil & Gas7/8/2014-42.2
▲138 15.5
▼-94.9-40.2
Top Global Project Finance Deals Jan 1 - Sep 30
3,000.0
Canada
3,690.83,783.3
Turkey
Industry
3,000.0
TransportationUnited Kingdom
Singapore
Saudi Arabia
3%Power
1.7
10,416.910.5
Waste & Recycling 318.5 0.2 1 1,072.2591.3 0.3 7
North Asia7,339.7
Southeast Asia16
1/1/2014-09/30/2014
Japan
Issues
Transportation
52,208.4Power
South Asia
228
15 Industry
18,666.373
9,581.9
Petrochemicals
36,824.2Mining
5.9 19
60
Mkt.Proceeds
11,587.5
45325,171.5
Oil & Gas
Australasia
US$m
2,867.1
32.3
33
No.Issues
No.Sh %
1633
US$m
3,594.9-47.8
-24.543.9
14,048.4
Sh %
11
48,691.7
1/1/2013-09/30/2013Proceeds
31,104.427,841.6
47 18.5
12,188.8
23
5.4 0.5
5.7 27
20.7 21.4
37
Project Finance Sector
905.4Water & Sewerage
10,131.2
38,019.3
Leisure & PropertyTelecommunications
6
26
177,663.2Industry Total 443
-2.1
441
5 3,833.9
150,640.2
1.714
0.7
▲11.1
2,538.5
16,756.3
9.1
5,623.1▼5 2.6
3.7
10 -1.4
▲
▼▼
9 1.4 7.4 9
-5.4
2,038.0
▼
11,140.5
6 -0.5100.0100.0
▼
▼
▲
Sector Analysis
118.2 ▲
4,014.2
26,598.2
40.0 ▲
8,749.3
20.7 262 -2.9
55 ▲
Mkt. Sh
0.7
Chg. in
▲
29.4
2.2
▼49
Note: 2014 League Tables are based on fully syndicated project finance volume.
Mkt.
-1.5
▼
52,208.429%
38,019.321%
36,824.221%
18,666.311%
6%
6%Oil & Gas
Transportation
Mining
Petrochemicals
Industry
Leisure & Property
Telecommunications
Water & Sewerage
Visit http://dmi.thomsonreuters.com to View Archives and Order Custom League Tables https://www.thomsonone.com
2

Central America 3,258.0 10 843.9 5
United States of America 32,413.0
30 5,191.012,172.1 16
1,290.9
South America7,895.5
North America
18Canada
Brazil 7,434.9 11
106 29,280.984 24,213.6
37.7
22 5,067.4
1,754.0
7091 57.855,738.6 146 35,315.8
55.8
2
40,308.5
US$m Issues US$m IssuesAmericas
Scorecard: Americas Project Finance1/1/2014-09/30/2014
% Chge in Proceeds
Proceeds No.1/1/2013-09/30/2013
▲134.5
Proceeds No. Nation
1,545.0
▲▲▲52 33.9
Peru
Close Borrower Sector
900.0
US$(m)
1,450.0
BrazilOil & Gas
Package Amt
41,000.0 United States
Cia Siderurgica Pecem
Peru 3,220.2 9 149.5 ▲
5/16/2014
Domicile
United States1,506.1
8/6/2014
Jan 1 - Sep 30Top Americas Deals
Date
6/25/2014 NorthWest Redwater Partnership
▲▲
323.9 7/17/2014 1,128.8
1/8/20141,800.0
Cameron LNG LLC 7,765.0
286.1
Industry
United States
TransportationOil & Gas
3,264.9
Carrix Inc
FPSO Cidade de Caraguatatuba
Sabine Oil & Gas LLC1,107.7
3/10/2014
United StatesCanada
Sociedad Minera Cerro Verde SA
3/11/2014 Sudeste Port
BrazilBrazilBrazil
Alfa Lula7/30/2014Oil & Gas
Power5/16/20148/4/2014 Astoria II Power Plant
Oil & GasPetrochemicals
MiningTransportation
Americas Up 58% I Power Projects at US$22.3 Billion
First Nine Months 2014 | Project Finance | Managing Underwriters
Americas Project Finance
Americas Project Finance Volume
S A l i
7 772.9 4 273.1 ▲-
J 1 S 30
▼
Honduras 274.0 2 - - -
▲
Chile 1,152.3 6 1,583.2 6 -27.21 - - -
Mexico 2,884.0
-Colombia 142.0 2 - - - -Guyana 185.0
-Surinam 37.7 1 - - -
Panama 100.0 1 71.0 1 40.8 ▲ 60$30US$ (b) # of Issues
Leisure & Property 200.0 0.4 1 174.1 0.5 ▲3.31 0.5
2 -0.1 ▼
55,738.7Industry Total
Power 19,879.8Sh %
94
Mining
21
100.0
10,934.8
6.6
32.8
US$m Sh %Mkt.Proceeds
Transportation 5,596.3 10.0
Issues US$m
Oil & Gas
No.
56.2
140.014 1,674.59
No.
5.3
Mkt. Sh▼
1.9-16.2
▲▲
▲6
13 30.9
1 4.7
65
1/1/2014-09/30/2014Chg. in
35,368.3
Issues
92
Mkt.
Americas Project Finance by Sector
Proceeds1/1/2013-09/30/2013
Borrower Industry22,273.4
146
40.0
Sector Analysis
3,919.4
100.0
0.4
18,304.7
160.05 3.8 Petrochemicals 3,264.9 5.9 1 1,688.8 4.8 Industry 2,115.0
2 1.1 ▲
Jan 1 - Sep 30
7.0
Telecommunications 65.0 0.1 1 586.3 1.7 1 -1.6 ▼
0
10
20
30
40
50
$0
$5
$10
$15
$20
$25
1Q09 2Q 3Q 4Q
1Q10 2Q 3Q 4Q
1Q11 2Q 3Q 4Q
1Q12 2Q 3Q 4Q
1Q13 2Q 3Q 4Q
1Q14 2Q 3Q
# of
Issu
es
Pro
ceed
s (U
S$b
)
22,273.4 40%
18,304.7 33%
5,596.3 10%
3,919.4 7%
3,264.9 6%
Power
Oil & Gas
Transportation
Mining
Petrochemicals
Industry
Leisure & Property
Visit http://dmi.thomsonreuters.com to View Archives and Order Custom League Tables https://www.thomsonone.com3
Proceeds per Bookrunner (US$m)
▲
15.1
4,387.4
▲17.1
22
▲42
Proceeds per Bookrunner (US$m)
▲
▼
# of Deals per Arranger
▲
-1
Jan 1 - Sep 30
BNP Paribas SA
# of Deals per Bookrunner
▼
MarketSh %Sh %
16.4
Market
-0.39.2# of Deals
▲
Deals Sh %
3
▲
2014 Rank
MarketDeals
First Nine Months 2014 | Project Finance | Managing Underwriters
Mandated Arranger
Jan 1 - Sep 30
Americas Project Finance
MarketMarket Change in 2014 Rank Sh Ch.
Change in # of
13120.5
1,877.7
▲11
0.4 ▲
2,798.1Bank of America Merrill Lynch
10
9
5.9 5.6 ▲ 9.8
▲13
# of
9
17# of Deals
11.6
1131.8
24
▲6 ▲
-1
▼
16
12
7.4Sh Ch.
0.8 ▲-1.2 ▼Mitsubishi UFJ Financial Group
Sumitomo Mitsui Finl Grp Inc 2 71
Sh %
2,681.2 4.84,144.2
2013 Rank
1
2013 RankBookrunner ProceedsProceeds
50 34.2
Market
1
BNP Paribas SA 4 40 2,520.83 11 2,543.0Mizuho Financial Group
▲ 14 9.64.5 3.9▲1.6 14.44.6 21
4.2 20.515 2,347.4 2.3 ▲ 3010 2,265.7
3.64.1 ▲ 25
▲ 22
ING 50.92.37 19 1,978.0Natixis
Credit Agricole CIB 6
8.9
1,465.9
7.5-0.93.4
1,551.7 2.83.1
1,898.21,737.5
Societe Generale 10RBC Capital Markets 5
▼ 13Bank of America Merrill Lynch 8 69
4.11.2
-0.8
1.4
JP Morgan
▲-1.3 ▼ 11
2.611▲ 17
916
▲ 13▼ 6
3.4
Santander 12 20 1,413.1
15
8.91.3
2.47.5
1,317.2
8.924 1,393.1
2.5
2.1▲ 50.2
2.5
5 0
Citi ▲ 13
3 1,157.9CIBC World Markets Inc 14
1313
2 1 124 6 2 0
▼-2.8 ▼ 11
Barclays 16Deutsche Bank
▼ 8 5 5 3 ▼Deutsche BankBarclays
Mitsubishi UFJ Financial Group 12
18 ▲9
-4
▲
5 9Credit Agricole CIBING
46
1,941.5243.9
5.1Citi 4 4.1 3.1
18.2 17
9.13 7 2,453.722
▲▲
▲ 10▲ 12 9.1 10
▲▲ 16 12.1 8 ▲3.7
▲10 7.6 1-1.0 ▼6 13 1,782.3
0.4RBC Capital Markets 7 5 1,744.8 3.7
1.2
▲▲ 13 9.8 75-
▼JP Morgan
3.43.21,509.4
8 11 1,624.4
1,428.8
Mizuho Financial Group
5 3.8▲▲
14 10.62
0.0Sumitomo Mitsui Finl Grp Inc 93.02.8
10
13 9.8▲Natixis 11 20 1,327.32.7 0.8
1.68 -1.0
▲▲ 12 9.1 8▲
Societe Generale 12 15 1,276.4HSBC Holdings PLC 13 16 1,202.6
8
▼▲4 3.0 1 ▲2 -21.5
0.9 ▲2.52.5 0.4
15 8.3 01,184.9
4 1,157.914
16 ▼▼ 8 6 1 22 1 146 6 2 4▼2.4
6 3-2.7 -
Americas - Bookrunners (X5)
CIBC World Markets Inc 1411
Americas - Mandated Arrangers (X4)
10
* Tie
57.6%63.5%
58.5%
+54
▲14.3%Industry % Change over Last Quarter
1.3▲-
▲
5 ▲▲
4
-2
9-5.0
17 28 1,013.42 1,124.6 2.0
0.9Scotiabank 1.8Barclays 16 ▼ 8 5.5 -3 ▼
▲ 11 7.5 ▲
▼ 7HSBC Holdings PLC 18 14 858.6 1.5
19 4 745.317 744.8
-0.4▼
▼ 6 4.1 1 ▲-3.5Goldman Sachs & Co-0.2
1.3 4.8
Morgan Stanley 12 625.721BBVA 20 ▼ 8 5.5 0
1.1▼ 91.1 6.2-1.5
5 3.4Sumitomo Mitsui Trust Holdings -Commonwealth Bank of Australia 22 - 1.1
3Bayerische Landesbank Giro 24 4.1 2
2.1 31.11.132
1.16
261.7
1.0
23604.7 ▲
37,871.2
0.30.0Nord/LB 3 ▲5.525 8
▲
Barclays
583.7590.1
Top Twenty Five Total
▲
565.467.9
▲
-▲
16 ▼▼ 8 6.1 -2
▲
2 1,146.6
Bookrunner Total
Industry % Change over Last Quarter▲58.7%
2.4 -6.3
▲Industry % Change over Same Period Last Year ▲ Industry % Change over Same Period Last Year
Industry Total 100.0 14655,738.7
80.8%
Top Twenty Five Total 2.872.534,634.6
29.5% ▲
100.0
▲
▲
2.2%
47,863.4 132 +59
6.1Santander 17 41*7
1,117.8 2.3 1.9 ▲ 8
▲
7 ▲Goldman Sachs & Co 18 3 767.3 1.6 -3.9 ▼
-1.4
5.3 -1 ▼Bayerische Landesbank Giro 19 24 680.2 1.4 0.4
1.3
5 3.8 1 ▲Morgan Stanley 20 12 671.9 1.4
▲▼ 9 6.8 5 ▲
0.40.5 ▲ 7 5.3 4
1.0Scotiabank 22 25* 607.0 1.3
49* 493.7 ▲▲ 6 4.5 5 ▲
0.60.8 ▲ 5 3.8 4
-▲ 6 4.5 5 ▲
4 3.0 025
Landesbank Hessen-Thueringen 23
Rabobank NV 21
24General Electric CoBMO Capital Markets
29 619.0
-0.1 ▼28 400.8 0.844 433.1 0.9
Visit http://dmi.thomsonreuters.com to View Archives and Order Custom League Tables https://www.thomsonone.com4

▲S eden 195 8 1 133 8 2 46 3
-Belgium 240.5 2 2,198.7 2 -89.1 ▼Greece 277.2 3 - - -
▼Denmark 297.3 1 - - - -Italy 927.0 11 3,020.5 18 -69.3
▲Republic of Ireland 1,073.4 3 485.0 3 121.3 ▲Spain 2,020.2 8 1,464.4 12 38.0
1/1/2013-09/30/2013
2,540.9 1 - -5 2,631.2 5 66.6
▼Germany 2,064.3 11 -39.411 3,408.0
▲Finland
▲Norway 9,571.4
- -Netherlands 4,384.1France 4,723.6 26 2,544.3 38 85.7
10 - - -▼-
United Kingdom 11,652.4 28 13,088.3 30 -11.0
-1.3 ▼Western Europe 40,200.3 114 29,229.3 128 ▲37.5
Issues US$m Issues161 70,985.2 190
1/1/2014-09/30/2014% Chge in Proceeds
Proceeds No. Proceeds No.US$m
Morocco2,540.9
Power2,875.2
First Nine Months 2014 | Project Finance | Managing Underwriters
EMEA Volume down 1% | Power Projects Accounted for 25% of Funding
Oil & Gas
Europe, Middle East & Africa Project Finance
Waad Al Shamal Canada3,783.3
3,000.03,289.5
IEP 270,051.5
2,851.0
Petrochemicals4/15/2014
EMEA
Aliaga Refinery
6/30/20143,690.8
Netherlands4/30/2014
5/29/2014Mining
9/18/2014
5/6/20147/8/2014
Kansanshi Expansion Mine
2/14/20143,000.0
2,605.8Suomi Power Networks Oy Finland2/19/2014
EMEA Project Finance by Sector
TurkeyZambiaNorway
Safi Coal Fired Power PlantOman
United Kingdom
Gemini OffshoreORPIC Refinery Expansion
PowerPower
Petrochemicals
US$mDateBorrowerClose
Norway
Transportation
Lundin Petroleum Refinancing
Domicile
2/6/2014
SectorNation
Jan 1 - Sep 30Package Amt
Top EMEA Deals
4,000.0
Det norske oljeselskap ASA
Oil & GasIndustry
Scorecard: EMEA Project Finance
$25
-Kuwait 56.8 1 - - -▼Jordan 93.8 1 606.0 1 -84.5
▼South Africa 106.2 1 2,580.8 - -95.9 ▼Namibia 130.0 1 150.0 - -13.3
-Chad 140.0 1 - - - -Uganda 160.0 1 - - -
-Kazakhstan 200.0 1 6,500.0 2 -96.9 ▼Azerbaijan 200.0 1 - - -
▼Egypt 618.1 3 - - - -Nigeria 678.5 2 4,671.0 - -85.5
▼Ghana 1,500.0 1 847.0 - 77.1 ▲United Arab Emirates 1,540.0 3 5,764.0 - -73.3
▼Serbia 19.5 1 - - - -Croatia 55.5 1 78.4 1 -29.2
-Bulgaria 125.0 1 - - - -Czech Republic 139.3 1 - - -
▲Poland 235.0 1 635.9 3 -63.0 ▼Romania 522.8 4 113.2 1 361.8
▼Portugal 28.4 1 95.2 3 -70.2 ▼Austria 70.8 2 159.9 4 -55.7
▲Guernsey 133.2 1 - - - -Sweden 195.8 1 133.8 2 46.3
2 - - -Morocco 2,688.7
-Oman 3,101.0 3 269.0 1
--26.3
-
-
Africa/Middle East/Central Asia 18,669.2
1,052.8 ▲Zambia 3,212.0 3
28 33,204.4Saudi Arabia 4,244.1 3 5,759.1
-4 ▼
Russian Federation 4,054.4
47 -43.8 ▼
Hungary 1,761.2 2 -▲
- -4 1,459.5 4 177.8
-
Eastern Europe 11,182.1 ▲19 8,551.5 15 30.8Turkey 4,269.5 4 6,264.5 6 -31.8
28
# ofSh %
# ofProceedsBorrower Industry
Sector Analysis
19.4 Deals
17,802.3
Mkt.
25.4
19,204.2
Chg. in
▼18.4 26
Power
12,874.515,480.7
70 22.1 26
Jan 1 - Sep 30
6.0 ▲Oil & Gas
▼
1.1 6
Deals
▼-8.7▼8
93 13,780.8
1/1/2013-09/30/2013
Industry 6,726.6 9.6 7 -5.922
-4.7
US$m
Transportation
Mkt.
10,990.5 15.5
26.8 27.1
Proceeds
19,033.3
US$m Sh % Mkt. Sh
-Mining 6,508.7
1/1/2014-09/30/2014
Industry Total 70,051.5
▲
5 898.0 1.3 -
8.0
2,833.2 4.0 6,386.6 9.1
811.619
9.3
4.6 0.6
161
7
▼0.5
100.0
-Leisure & Property 3,251.8
5
3
-0.6
-▲
15 Water & Sewerage 360.7
-Petrochemicals
70,985.2 190 100.01.5 5
Telecommunications 341.1 0.5 3 2,407.0 3.4 -1.0 ▼
2 -2.9 ▼Waste & Recycling 318.5 0.5 1 1,026.7
$0
$5
$10
$15
$20
Proc
eeds
(US$
b)
January 1, 2014 - September 30, 2014
January 1, 2013 - September 30, 2013
https://www.thomsonone.comVisit http://dmi.thomsonreuters.com to View Archives and Order Custom League Tables
5
16 1 4▲
▼0 3 ▲▲15 - 1.4450.0
22 2 21.4
16 443 71 1.1 1
1.10.3 113 22* 487.7 1.5 0.9
▲▲
467.5 1.415
▲
-3 ▼-1 1.1 0
1.6 ▲ 1 1.1 11
▼745.9 2.3 -0.2
▲Hypo Real Estate Holding AG 12 - 534.6 1.6
5 5.410 8 539.91.71.7
11 - 539.2
▼
2-2-4
1.7-0.7 ▼
▲ 1 1.1
▼2.33.1
-6 ▼4
▲2 2.2▼8 8.6
4.3
▲-
▲3.11,000.2748.3 -0.4
22.2 21,016.7
3.1 ▲3.11,012.0
3.45.601,266.803
3 3.23.4
▲
3.9 -▲▲ 23.1 3.1
2 2.2
Proceeds
--3.2
▲▲
8 8.6 01,820.03,729.8 11.4
1 11 3,791.8 9.52
2.2Sh Ch. Sh %
▲Sh %
6.910
8ING 9 7
-HSH Nordbank
Credit Agricole CIB
3
SEB 7 -
14
34 27
65
Natixis
6
Citi
Gazprombank
S mitomo Mits i Finl Grp Inc▼▲
▲
Garanti Bank
▼
▲▼
Standard Chartered PLCDNB ASA
RBC Capital Markets
BNP Paribas SA
Nordea
-8
UniCredit 16 4 1 092 9 17 10 61 6 1 0-0.8 ▼
▼▼ 101.7 8 5.0 -7
RBS 14 15 1,211.8Standard Chartered PLC 15 8 1,199.6
1.7 0.1-0.7 ▼
▲1.9 4.3
7 4.3▲
14 8.7 3
DNB ASA 12 104 1,601.16 1,298.2Mizuho Financial Group 13 7
-1620 12.4 14
2.3 2.11.7 ▲
-0.2
4
10 7 1,695.4 2.4 9.9▼
131216
Santander 11 40 1,632.5 2.3
27Natixis
1,790.92.7 1.1
9▲
1.8 ▲2.6
3.2Mitsubishi UFJ Financial Group 7KfW IPEX-Bank GmbH 8 14 1,878.3
2,226.0
SEB 7.5 6 ▲
▼-8.1 0
▼3▲26 16.1 9
18 11.2 -9▲Societe Generale 6 12 2,333.8 1.33.3
ING 52,549.8
1.1 14.33.4103.6 1.1 14 8.7 -2
23
20.533▼-13
30 -1
4.3
2,388.7911 2.23,020.0 ▲
▲▲
BNP Paribas SA▲
6.5
Market
3.9 ▲
Market
18.6
▲20 12.4
Mizuho Financial Group 11.6
Market# of Deals per Arranger
6 ▲# of Deals Deals
2 ▼
First Nine Months 2014 | Project Finance | Managing Underwriters
Proceeds per Mandated Arranger (US$m)
Proceeds2014 Rank
MarketSh %
Jan 1 - Sep 30
Sumitomo Mitsui Finl Grp Inc 2
DealsMandated Arranger
4.7Credit Agricole CIB 3HSBC Holdings PLC
1
4
3,285.82
Jan 1 - Sep 30EMEA - Bookrunners (X16)
# of MarketSh % Sh Ch. Bookrunner
-0.8
Proceeds per Bookrunner (US$m)Change in # of2013
Rank5 4,528.8
0.6
EMEA - Mandated Arrangers (X15)
Europe, Middle East & Africa Project Finance
Change in # of Deals per Bookrunner
Market2014 Rank # of Deals
2013 Rank
8▼
3 ▲
* Tie
3.15
-7
Industry % Change over Same Period Last Year 4.1%
16
Top Twenty Five TotalIndustry Total
▼▲▼ ▼
HSBC Holdings PLC 19 28 255.2 2 2.20.8 0.3 ▲
17 2 320.00.9
0 -
1.0 -4.1 ▼1.4
▼2 2.2 -3▼0.3 ▲
-6-3.4 ▼18 4 296.9 7.57
-22 2.216 443.7
161
4 2.5
70,051.5
Industry % Change over Last Quarter -39.6% ▼ ▼-23.3%
100.0
5.0
UniCredit
-29
Sumitomo Mitsui Finl Grp Inc▲
▲
Barclays
KfW IPEX-Bank GmbH▲
▲18.96 2 ▲
1▲40.7 7
▲5
11 6.8▼ -4
4
Societe Generale
1.0 0.68
▲
3.7
▲
▼1.2
59.2
4.30.5
▲1.0
Industry % Change over Same Period Last Year -1.3% ▼
Top Twenty Five TotalIndustry Total
41,357.9
ABN AMRO Bank 24▲0.9
68 671.3HSH Nordbank 25 53 619.5
RBC Capital Markets 22 32 764.423 51 723.5Scotiabank
1.1 0.4
BBVA 20 55 852.6-0.2Barclays 21 19
8 5.0 -1
807.4
▼1.2 0.8
0.3 ▲▲
1.5Nordea 18 - 1,073.0Deutsche Bank 19 20 1,022.3
Commonwealth Bank of Australia 171.5 1.5
0.8 ▲▲
1.626 1,090.3 39 5.65 3.1 5
UniCredit 16 4 1,092.9 17 10.61.6 -1.0 ▼▼ -10
-33.5%-15.3% -7.0%
-22.9%Industry % Change over Last Quarter
▼
▼
▲
▲100.0 9332,616.7
30.263.620,668.7
20 - 250.0 0.8 0.8 ▲ 1 1.1 1 ▲RBS 21 9 215.6 0.7 -1.6 ▼ 3 3.2 -1 ▼BBVA 22 - 215.4 0.7 0.7 ▲ 2 2.2 2 ▲
23 14 186.7 0.6 -0.6 ▼ 2 2.2 0 -Caisse Cent Epargne Prevoyance 24 - 174.8 0.5 0.5 ▲ 1 1.1 1 ▲Standard Bank Group Ltd 25 41 160.0 0.5 0.0 - 1 1.1 0 -
https://www.thomsonone.comVisit http://dmi.thomsonreuters.com to View Archives and Order Custom League Tables
6
- -47 8
-Mongolia
1/1/2013-09/30/2013
Sarulla Geothermal,Sumatra Power1,194.2
Youngchun-Sangju Highway Co
1,200.0WSO Finance Pty Ltd
AustraliaNRT Finance Pty Ltd
Roy Hill Holdings Pty LtdMarina Bay Sands Pte
Sun Group Finance Pty Ltd7/15/2014
8/29/20147/7/20147/25/2014
5
China
Indonesia
TransportationOil & Gas
Lanzhou Metro Co Ltd 2,054.6
5/14/2014 Australia
6/20/20149/17/2014
7/28/20143/28/2014 1,170.0
Top 10 Nation
Australia1,779.22,050.0
Australia
South Korea TransportationTransportation
Transportation
Australia
1,384.7
DatePackage Amt
US$m
IndustryTransportation
AustraliaSingapore
Nation
4,085.6 Leisure & PropertyMining7,145.14/22/2014
First Nine Months 2014 | Project Finance | Managing Underwriters
Asia Pacific (inc. Australia & Japan) Project FinanceAsia Pacific & Japan Up 17.1% | Australia Doubles at US$25.8 Billion
Borrower SectorClosing
1,401.4
Viva Energy Pty Ltd
Newcastle Coal Infr Grp
DomicileNo. Proceeds No.
41,419.6Issues
Asia-Pacific (ex. Japan) 47,858.7
Scorecard: Asia Pacific (inc. Australia & Japan)1/1/2014-09/30/2014
% Chge in Proceeds
Proceeds
12,188.8 3332
US$m Issues US$m
25,807.0 31 12,171.1
97
Southeast Asia 8,749.3 16
Australasia 26,598.2 33Australia
791.2 2New Zealand
-Indonesia 2,194.0
▲▲▲
118.2112.0
15.5138
59.54
-
Singapore 4,085.6
43.9 ▲
2,081.2 1 -
South Korea 1,946.2China 3,025.3 2 3,463.484.9
45
North Asia 5,171.5 16 3,594.97
Jan 1 - Sep 30Top Asia Pacific & Japan Project Finance Deals
12,110.6 8 -7.8
-▼
1
South Asia 7 339 7 32
8
11,587.5 49 ▼-24.5
▼14 048 4
▲▲
- - -
200.0
1,375.7
11▲
-
-
Philippines 1,036.5 3 147.1 1 604.6
600.4 5 2,358.3 39 -74.5Laos 644.7 1 - -
▼Malaysia 188.2 1 1,125.3 3 -83.3 ▼Thailand
$30
January 1 2014 September 30 2014
3 -3.2 ▼Water & Sewerage 230.6 0.4 2 1,596.9 3.6
-47.8-47.8
1/1/2013-09/30/2013Mkt.
Borrower Industry
Sector Analysis
Proceeds
Oil & Gas 8.2 2.5
Power35.4 27 Transportation 18,353.5
Leisure & Property 6,130.015.9 8,238.2
Industry2 3
11
15,031.1
11.8
33 104
US$m Sh %
12,132.66,962.9
134
Mining 2.3
7 -10.21,289.6
4,233.8
1/1/2014-09/30/2014
23.4 64
Petrochemicals 765.4 1.5
Industry Total 51,873.0 100.0 100.0
5,605.81,136.3
161 44,286.7
5.66 ▼
9,451.72
1,000.0
21.3 12.7
-19.85
▲
▼
▲
-0.9 ▼
Sh % Deals# of
▲33.9
5.9
▼-10.5
Japan
Deals US$mChg. in Proceeds# of
5 1
Mkt. ShMkt.
▲
5
13
19.7
5.913.6
2.6
15.7
2,615.9
India 7,339.745
32 14,048.44,014.2 37 2,867.1 23 40.0 ▲
▼45South Asia 7,339.7 32 ▼
Jan 1 - Sep 30
14,048.4
1.9 Telecommunications 499.3 1.0 1 840.7 $0
$5
$10
$15
$20
$25
Pro
ceed
s (U
S$b
)
January 1, 2014 - September 30, 2014
January 1, 2013 - September 30, 2014
https://www.thomsonone.comVisit http://dmi.thomsonreuters.com to View Archives and Order Custom League Tables7
Asia Pacific (inc. Australia & Japan) Project Finance
10
12
7 510
4
2.7
Korea Development Bank
China Development Bank
21
State Bank of India
▼
▼ ▼▲
3.8
▼
2 1
0
4
11
7
▲
-
9 ▼
0.81,476.7
1 080 0National Australia Bank
▼
Axis Bank Ltd
Standard Chartered PLC
15 2 6 3695 3 2 7 ▼3▼ 3 8 9-1
▲314 6
+33.83-0.4
1,010.9 3.93.3
3.9862.1
+33.83▲1,080.6 4.1 ▲4.1 0-2.3
▲15.2▼
4.5
4.1
+4 ▲12 15.2
10 4 1,176.2 4.5 -0.8 12-
4.3 ▲ 5.14
11 1,081.9 ▼3
-3+24
1,192.5
▲
▲▼
+3
▲5.6
1,216.7 4.6 3.9▲ 4 5.13.8▲ 5.1
▲3.8 +3
1,476.7
▲ 4 5.15.7 5.735.7- 1,504.2
+42.8 9▲
+45.7
7.2+1 ▲
▲Sumitomo Mitsui Finl Grp Inc 4 5 1,778.4 6.8 +111.4
1- 2,054.6
2,403.6
▲4.1 ▲ 8 10.1
12
1,508.1DBS Group HoldingsIDFC Ltd
1,899.4
5 -
3 7
6
Korea Development Bank
12
9 318 18
ICICI Bank Ltd 7ANZ Banking GroupCommonwealth Bank of Australia
12 -
3
13 -
-
▲▲
Mizuho Financial Group
▲
▲
▲
Mitsubishi UFJ Financial Group
United Overseas Bank Ltd-24.5
6.0 5▲0 41.6 8HSBC Holdings PLC 14 30 1,117.5
152.2
Oversea-Chinese Banking 13 1,401.912 6▲1.8
4.5 63.0 -2
4 3.0 -3▲▲1,527.5 2.9▲1,567.7
2.9DBS Group Holdings 11 10 0.6ICICI Bank Ltd
3.0IDFC Ltd 3.0 6
11.916
Mizuho Financial Group 8 4 2,217.0Mitsubishi UFJ Financial Group 3
2,555.994.6 28 20.9-0.8 ▼
0.714.3
2.922.4
2,054.6 4.0 ▲-0.5 ▼
9 1930
5 1▲2.6
2,372.17
National Australia Bank 4 63Commonwealth Bank of Australia
4.9
6.13,158.6
Westpac Banking 6State Bank of India 2,861.5
11
Change in
-16.92.6
5.5▲▼
7.51 5
# of Market
9
Market
3.1 ▲3.4
Sh %-26.4
7.8China Development Bank-2
▲▼
7.8 1.315.2
1▲ 31 ▲23.1
▲13
20.1▼
Sh Ch.Sh %
▲
1# of Deals
9.2
Market# of# of Deals per Bookrunner
Sh % Sh Ch. Deals Proceeds
2
Bookrunner2013 Rank
2013 Rank
Proceeds per Bookrunner (US$m)
Jan 1 - Sep 30
Change in # of DealsMandated Arranger Proceeds
2014 Rank
MarketDeals
Proceeds per Mandated Arranger (US$m) # of Deals per Arranger
Jan 1 - Sep 30
Market
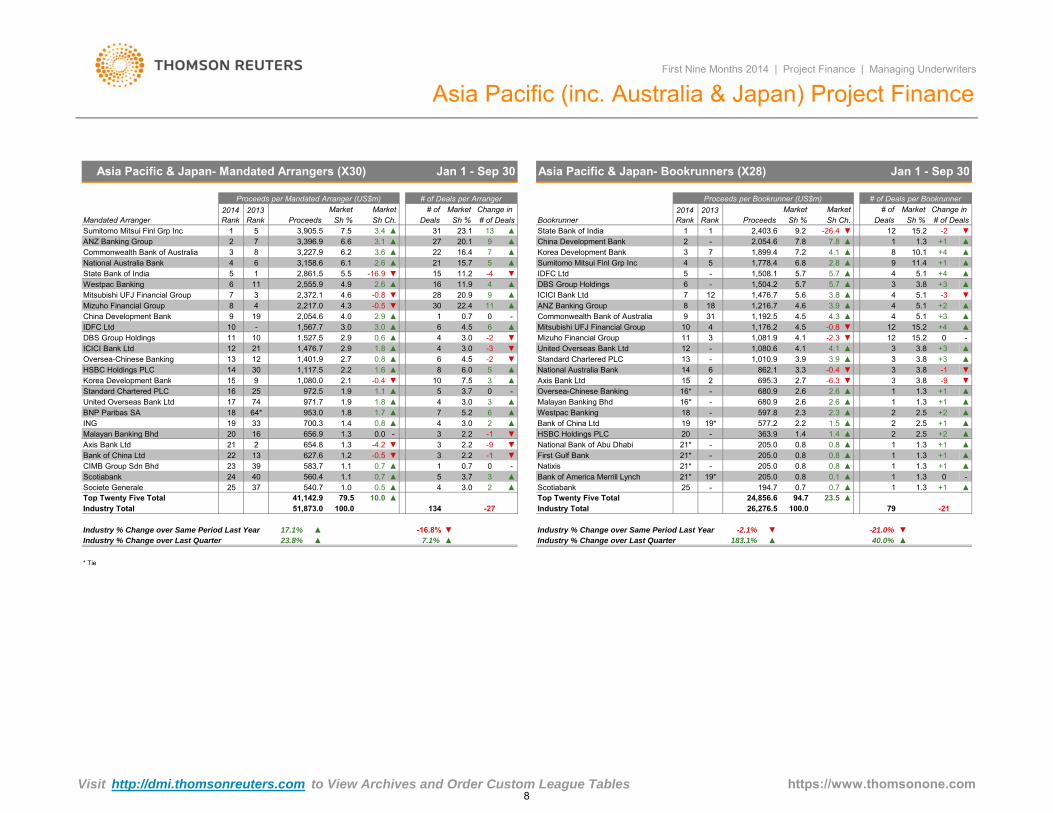
Asia Pacific & Japan- Bookrunners (X28)
Market
First Nine Months 2014 | Project Finance | Managing Underwriters
Asia Pacific & Japan- Mandated Arrangers (X30)
Sumitomo Mitsui Finl Grp Inc 3,905.5
2014 Rank Sh %
22 16.427
▲ANZ Banking Group 2 7 3,396.9
6.215.7 5 ▲
15 ▼11.2 -421
3.686.6
3,227.9
134
64*
-Scotiabank 1.1 ▲3 Bank of America Merrill Lynch 21* 19*540.7
15 0.1560.4
7.510
▲
▲ 1.3 0
41,142.9
205.0 0.8
United Overseas Bank Ltd
ING
25
17
Korea Development Bank
0.5
BNP Paribas SA
Malayan Banking Bhd
18
2 ▲
7.1%
▲ 479.5
Industry % Change over Last Quarter 23.8%
Societe Generale
Industry Total
17.1%
10.037
51,873.0Top Twenty Five Total
▲
19
Standard Chartered PLC
Industry % Change over Same Period Last Year
24 40
33
7416 25 972.5
-16.8%
2.1
-
6▲3
91.9
▼
953.0 1.7 ▲
1,080.0
Malayan Banking Bhd▲
Axis Bank Ltd
National Bank of Abu Dhabi
Oversea-Chinese Banking
Westpac Banking3.0
▼ Industry % Change over Same Period Last Year▲Industry % Change over Last Quarter
Industry Total
▼183.1%▲
▲
-2.1%
-27Top Twenty Five Total 24,856.6
▲40.0%
-21
-21.0%
79
▼
26,276.523.594.7
100.0
0.8 0.8 1▲
▲1.3 +1 ▲1.3 +11.3 +1 ▲▲Natixis 21* -
205.0 0.8205.0
First Gulf Bank 0.8 1▲0.8 0.8
21* -
2.6
2▲21* -20 - 1.4
▲ 1+22.51.4
2.5 +12▲
▲2.5 +218 - 2.3
16* -▲
2.62.6
597.8 2.31.3 +11680.9
2▲▲
16* - ▲15 2 -6.3695.3
680.92.72.6 ▲
▼13
+1▼
1.33.8 -9
-1▼▼
0
19
3
-9 205.0HSBC Holdings PLC 363.9
2.2▲▼-1
2 Bank of China Ltd
▲
▲▲19* 1.5577.2
5.2
▲100.0
3.01.00.7 3.7
-
2.2▼ 33
-0.5-4.2
3.0
39 583.7
4▲1.4 0.8
1
700.3
1.1CIMB Group Sdn Bhd 23627.6
▼
0.7▲
654.82 1.32113
7
0.0 32.2
Bank of China Ltd 22
2.2656.920Axis Bank Ltd
0.71.2
16 1.3
4▲971.7 1.9 1.81.8
3.7 --0.4
▲1.1 5 015
+1 ▲Scotiabank 25 - 194.7 0.7 0.7 1 1.3▲
* Tie
https://www.thomsonone.comVisit http://dmi.thomsonreuters.com to View Archives and Order Custom League Tables8
-
-
-
-
-
-
-
Asia Pacific:
E-mail: [email protected] Mandated Arranger league tables will give equal credit to the Non-Americas mandated arranger and equal credit to the Americas Tier 1 agent. Incases of consolidation, credit will be givien to the surviving/parent firm
Salvatore Reres
Bookrunner league tables will give full credit to the bookrunner, equal if joint. In cases of consolidation, credit will be given to the surviving/parentfirmEwelina Jarecka
Database coverage includes all loan transactions that have reached General close between January 1, 2013 and September 30, 2014 of whichThomson Reuters has been made aware. All current data and previous year's data is as of 6:00am EDT on October 15, 2014.
League tables include limited recourse project finance, non-recourse project finance, and project finance loans and exclude loans with amaturity of less than 90 days from financial close.
Bilateral, self-arranged, commercial and unknown loans are excluded from league tables as well as loans with a maturity of less than 90 days.
All league tables are based on deal proceeds unless otherwise specified.
Regional league tables are based on Domicile Nation.
Tel: +44 207 542 2246
First Nine Months 2014 | Project Finance | Managing Underwriters
Project Finance Criteria Summary
If you would like to participate in the submissionprocess, receive quarterly press releases, orhave questions about league table criteria pleasecontact:
Europe
Americas
E-mail: [email protected]: +1 646-223-8455
-
-
JapanMegumi KonoTel: +813 6441 1155E-mail: [email protected]
E-mail: [email protected] All league table volumes and rankings are based on general close date instead.
Asia Pacific: Non-US dollar denominated transactions are converted to the US dollar equivalent at the time of pricing.Carina Causon
Tel: +632 858 7221
While Thomson Reuters has used reasonable endeavors to ensure that the information provided in this document is accurate and up to date as at the time of issue, neither Thomson Reuters nor its thirdparty content providers shall be liable for any errors, inaccuracies or delays in the information, nor for any actions taken in reliance thereon, nor does it endorse any views or opinions of any third partycontent provider. Thomson Reuters disclaims all warranties, express or implied, as to the accuracy or completeness of any of the content provided, or as to the fitness of the content for any purpose to theextent permitted by law. The content herein is not appropriate for the purposes of making a decision to carry out a transaction or trade and does not provide any form of advice (investment, tax, legal)amounting to investment advice, nor make any recommendations or solicitations regarding particular financial instruments, investments or products, including the buying or selling of securities. ThomsonReuters has not undertaken any liability or obligation relating to the purchase or sale of securities for or by any person in connection with this document.
© 2014 Thomson Reuters. All rights reserved.
Thomson Reuters and the Thomson Reuters logo are registered trademarks and trademarks of Thomson Reuters and its affiliated companies. Any third party name or mark herein belongs to the relevantthird party.
https://www.thomsonone.com9
© 2014 Thomson Reuters. 1006243 03/14.Thomson Reuters and the Kinesis logo are trademarks of Thomson Reuters.
FOR INFORMATION PROFESSIONALSSDC Platinum is the world’s foremost financial transactions database, covering new issues, M&A, syndicated loans, private equity, project finance, poison pills, and more.
Solution for:• Market Analysis & Trends (Geography, Sector,
Asset Class, Deal Type, Deal Size, etc.)• Deal Origination (Debt Maturity Analysis,
Company Lifecycle including Private Equity)• Pitch Creation (Firm Credentials,
Representative Acquirors)• M&A Targeting (Active Strategic/Sponsor
Acquirors, Target Company Screener)• Negotiation (T&C Benchmarking)
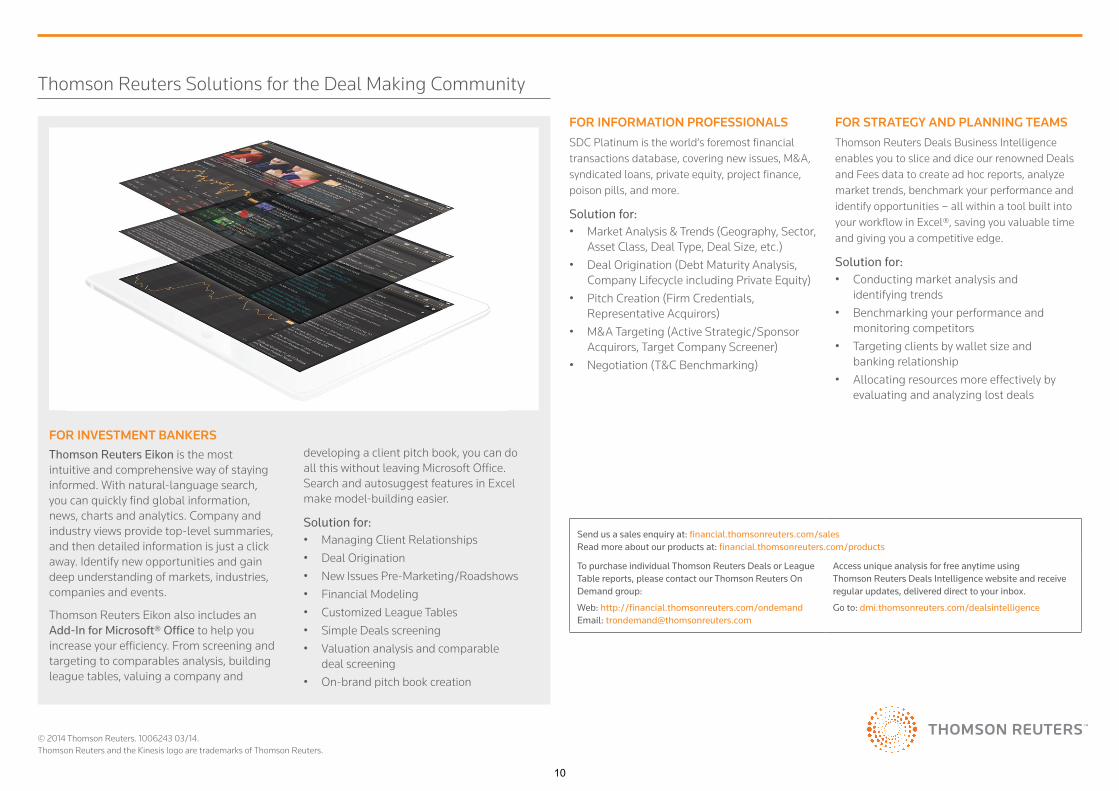
FOR INVESTMENT BANKERSThomson Reuters Eikon is the most intuitive and comprehensive way of staying informed. With natural-language search, you can quickly find global information, news, charts and analytics. Company and industry views provide top-level summaries, and then detailed information is just a click away. Identify new opportunities and gain deep understanding of markets, industries, companies and events.
Thomson Reuters Eikon also includes an Add-In for Microsoft® Office to help you increase your efficiency. From screening and targeting to comparables analysis, building league tables, valuing a company and
developing a client pitch book, you can do all this without leaving Microsoft Office. Search and autosuggest features in Excel make model-building easier.
Solution for:• Managing Client Relationships• Deal Origination• New Issues Pre-Marketing/Roadshows• Financial Modeling• Customized League Tables• Simple Deals screening• Valuation analysis and comparable
deal screening• On-brand pitch book creation
FOR STRATEGY AND PLANNING TEAMSThomson Reuters Deals Business Intelligence enables you to slice and dice our renowned Deals and Fees data to create ad hoc reports, analyze market trends, benchmark your performance and identify opportunities – all within a tool built into your workflow in Excel®, saving you valuable time and giving you a competitive edge.
Solution for:• Conducting market analysis and
identifying trends• Benchmarking your performance and
monitoring competitors• Targeting clients by wallet size and
banking relationship• Allocating resources more effectively by
evaluating and analyzing lost deals
Send us a sales enquiry at: financial.thomsonreuters.com/salesRead more about our products at: financial.thomsonreuters.com/products
To purchase individual Thomson Reuters Deals or League Table reports, please contact our Thomson Reuters On Demand group:
Web: http://financial.thomsonreuters.com/ondemandEmail: [email protected]
Access unique analysis for free anytime using Thomson Reuters Deals Intelligence website and receive regular updates, delivered direct to your inbox.
Go to: dmi.thomsonreuters.com/dealsintelligence
Thomson Reuters Solutions for the Deal Making Community
10