q32013 report
DESCRIPTION
Virginia Q3 2013 home sales reportTRANSCRIPT

VIRGINIA Home SAleS RepoRt se
cond
Qu
arte
r
2011
Published by Virginia association of reaLtors®, the advocate for real estate professionals and property owners in Virginia.
VIRGINIA Home SAleS RepoRt se
cond
Qu
arte
r
2011
Published by Virginia association of reaLtors®, the advocate for real estate professionals and property owners in Virginia.
VIRGINIA Home SAleS RepoRt se
cond
Qu
arte
r
2011
Published by Virginia association of reaLtors®, the advocate for real estate professionals and property owners in Virginia.
TH
IRD
QUAR
TER
2013
Analysis by the Virginia Center for Housing Research at Virginia Tech

2013-Q3Virginia Quarterly Home Sales Report
Published by the Virginia Association of REALTORS®
Analysis by the Virginia Center for Housing Research at Virginia TechPage 2
0
2,000
4,000
6,000
8,000
10,000
12,000
January February March April May June July August September October November December
Num
ber o
f Sin
gle
Fam
ily, T
ownh
ome
and
Con
do S
ales
Month
Virginia Month-to-Month Sales TrendsSingle Family Homes, Townhomes, Condos
2010 2011 2012 2013
Jan Feb Mar Apr May Jun Jul Aug Sep Oct Nov Dec2010 4,562 4,892 7,087 8,337 8,903 10,493 7,137 7,210 6,427 6,035 6,010 6,4682011 4,728 5,116 7,145 7,311 8,391 9,223 7,970 8,136 6,916 6,263 6,070 6,7582012 5,068 5,775 7,213 7,698 9,064 9,740 8,664 9,026 7,213 7,261 7,400 6,8382013 5,528 5,915 7,443 8,623 10,429 10,727 10,302 10,002 7,967
The pace of residential home sales this quarter is 13.48% higher than the third quarter of 2012. This year-over-year increase reflects strong sales in July and August and a moderate increase in September. The decrease in sales from August 2013 to September 2013 (20.4%) was similar to the decline Virginia experienced last year, 20.08% from August 2012 to September 2012.
Year-over-year sales indicate continued recovery, but the sharp decline in sales this September may be a sign that the recovery is slowing. Sales performance over the previous three years is not consistent, so we cannot reliably predict our trajectory this winter. We will likely continue to see year-over-year improvement, but those improvements may be small since the Virginia market is heavily influenced by government spending. The October 2013 government shutdown and continued sequester may be reflected in the housing market.

2013-Q3Virginia Quarterly Home Sales Report
Published by the Virginia Association of REALTORS®
Analysis by the Virginia Center for Housing Research at Virginia TechPage 3
27,733
20,798
18,558
17,105
24,906
23,001
19,09918,056
26,502
24,911
21,505
18,886
29,779
28,271
10,000
15,000
20,000
25,000
30,000
35,000
2010-Q2 2010-Q3 2010-Q4 2011-Q1 2011-Q2 2011-Q3 2011-Q4 2012-Q1 2012-Q2 2012-Q3 2012-Q4 2013-Q1 2013-Q2 2013-Q3
Num
ber o
f Sin
gle
Fam
ily, T
ownh
ome
and
Con
do S
ales
Quarter
Virginia Quarterly Residential SalesSingle Family Homes, Townhomes, Condos
In the third quarter we experienced a decline in home sales, but maintained a year-over-year increase. This seasonal decline is normal and September sales were higher than last year, but economic stress from the October 2013 government shutdown and continued sequester may negatively affect sales throughout the winter.
+13.5%YOY

2013-Q3Virginia Quarterly Home Sales Report
Published by the Virginia Association of REALTORS®
Analysis by the Virginia Center for Housing Research at Virginia TechPage 4
93,279
87,921
83,630 84,194
81,36783,570 84,111 85,062
86,65888,568
90,974 91,804
95,081
98,441
50,000
60,000
70,000
80,000
90,000
100,000
110,000
2010-Q2 2010-Q3 2010-Q4 2011-Q1 2011-Q2 2011-Q3 2011-Q4 2012-Q1 2012-Q2 2012-Q3 2012-Q4 2013-Q1 2013-Q2 2013-Q3
Num
ber o
f Sin
gle
Fam
ily, T
ownh
ome
and
Con
do S
ales
Quarter
Virginia Annualized Residential SalesSingle Family Homes, Townhomes, Condos
Quarterly trends show continued improvement in the pace of home sales in Virginia. This quarter marks approximately two years of market improvements since the post-tax-credit low in the second quarter of 2011.
Each data point on the graph above includes 12 months of home sales data ending in the quarter shown, thus the 2013-Q3 figure (98,441 sales) includes home sales from October 2012 through September 2013. Using this rolling sum of home sales can provide a clearer indicator of long-term trends in Virginia’s housing market.
This graph is more robust than graphs showing monthly and quarterly trends, therefore we can be fairly confident that the market recovery will continue until we begin to experience a consistent plateau over four quarters of annualized data.
Post Tax-Credit Decline
MARKET RECOVERY!
2013-Q3Virginia Quarterly Home Sales Report
Published by the Virginia Association of REALTORS®
Analysis by the Virginia Center for Housing Research at Virginia TechPage 5
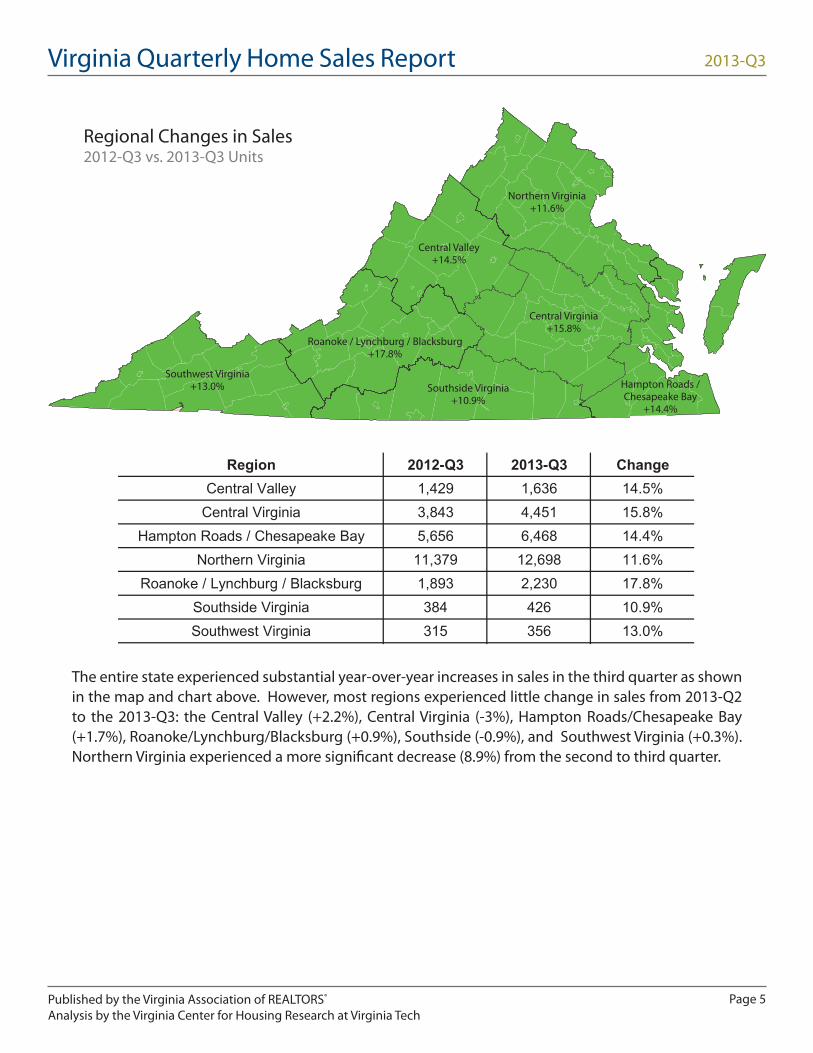
Region 2012-Q3 2013-Q3 ChangeCentral Valley 1,429 1,636 14.5%
Central Virginia 3,843 4,451 15.8%Hampton Roads / Chesapeake Bay 5,656 6,468 14.4%
Northern Virginia 11,379 12,698 11.6%Roanoke / Lynchburg / Blacksburg 1,893 2,230 17.8%
Southside Virginia 384 426 10.9%Southwest Virginia 315 356 13.0%
All of Virginia 24,899 28,265 13.5%
Central Valley+14.5%
Northern Virginia+11.6%
Roanoke / Lynchburg / Blacksburg+17.8%
Southwest Virginia+13.0% Southside Virginia
+10.9%Hampton Roads /Chesapeake Bay
+14.4%
Central Virginia+15.8%
Regional Changes in Sales2012-Q3 vs. 2013-Q3 Units
The entire state experienced substantial year-over-year increases in sales in the third quarter as shown in the map and chart above. However, most regions experienced little change in sales from 2013-Q2 to the 2013-Q3: the Central Valley (+2.2%), Central Virginia (-3%), Hampton Roads/Chesapeake Bay (+1.7%), Roanoke/Lynchburg/Blacksburg (+0.9%), Southside (-0.9%), and Southwest Virginia (+0.3%). Northern Virginia experienced a more significant decrease (8.9%) from the second to third quarter.

2013-Q3Virginia Quarterly Home Sales Report
Published by the Virginia Association of REALTORS®
Analysis by the Virginia Center for Housing Research at Virginia TechPage 6
$239
,900
$249
,900
$232
,500
$210
,000
$232
,694
$235
,000
$220
,000
$215
,000
$249
,500
$248
,000
$241
,000
$232
,600
$269
,000
$254
,000
$100,000
$150,000
$200,000
$250,000
$300,000
2010-Q2 2010-Q3 2010-Q4 2011-Q1 2011-Q2 2011-Q3 2011-Q4 2012-Q1 2012-Q2 2012-Q3 2012-Q4 2013-Q1 2013-Q2 2013-Q3
Med
ian
Sale
s Pr
ice
Quarter
Virginia Median Residential Sales PriceSingle Family Homes, Townhomes, Condos
The median sales price in Virginia increased 2.42% over the past year to $254,000 for all residential sales. Looking at the longer term trend, the median sales price in Virginia has increased by 1.64% over 2010, as measured by third quarter sales data. The decrease in median price has been fairly steady throughout the third quarter and is an assurance that Virginia home prices are stable.
+1.64%
+2.42%

2013-Q3Virginia Quarterly Home Sales Report
Published by the Virginia Association of REALTORS®
Analysis by the Virginia Center for Housing Research at Virginia TechPage 7
Region 2012-Q3 2013-Q3 ChangeCentral Valley $200,000 $214,000 7.0%
Central Virginia $187,900 $205,000 9.1%Hampton Roads / Chesapeake Bay $209,900 $214,950 2.4%
Northern Virginia $352,000 $375,000 6.5%Roanoke / Lynchburg / Blacksburg $155,000 $161,000 3.9%
Southside Virginia $80,000 $80,000 0.0%Southwest Virginia $112,000 $114,350 2.1%
All of Virginia $249,500 269,000 7.8%
Roanoke / Lynchburg / Blacksburg+3.9%
Central Valley+7.0%
Northern Virginia+6.5%
Southwest Virginia2.1% Southside Virginia
0.0%Hampton Roads /Chesapeake Bay
+2.4%
Central Virginia+9.1%
Regional Changes in Median Sales Prices2012-Q3 vs. 2013-Q3
Nearly every region in Virginia experienced year-over-year increases in median sales price which is evidence of a healthy market recovery. The decline in prices from 2013-Q2 to 2013-Q3 (see page 6) was fairly consistent throughout the state.
2013-Q3Virginia Quarterly Home Sales Report
Published by the Virginia Association of REALTORS®
Analysis by the Virginia Center for Housing Research at Virginia TechPage 8
8,198
6,410
5,446
4,503
7,307
6,789
5,275
4,866
8,197
7,684
6,444
5,489
9,827
9,127
2,000
3,000
4,000
5,000
6,000
7,000
8,000
9,000
10,000
11,000
2010-Q2 2010-Q3 2010-Q4 2011-Q1 2011-Q2 2011-Q3 2011-Q4 2012-Q1 2012-Q2 2012-Q3 2012-Q4 2013-Q1 2013-Q2 2013-Q3
Mill
ions
of D
olla
rs o
f Res
iden
tial S
ales
Quarter
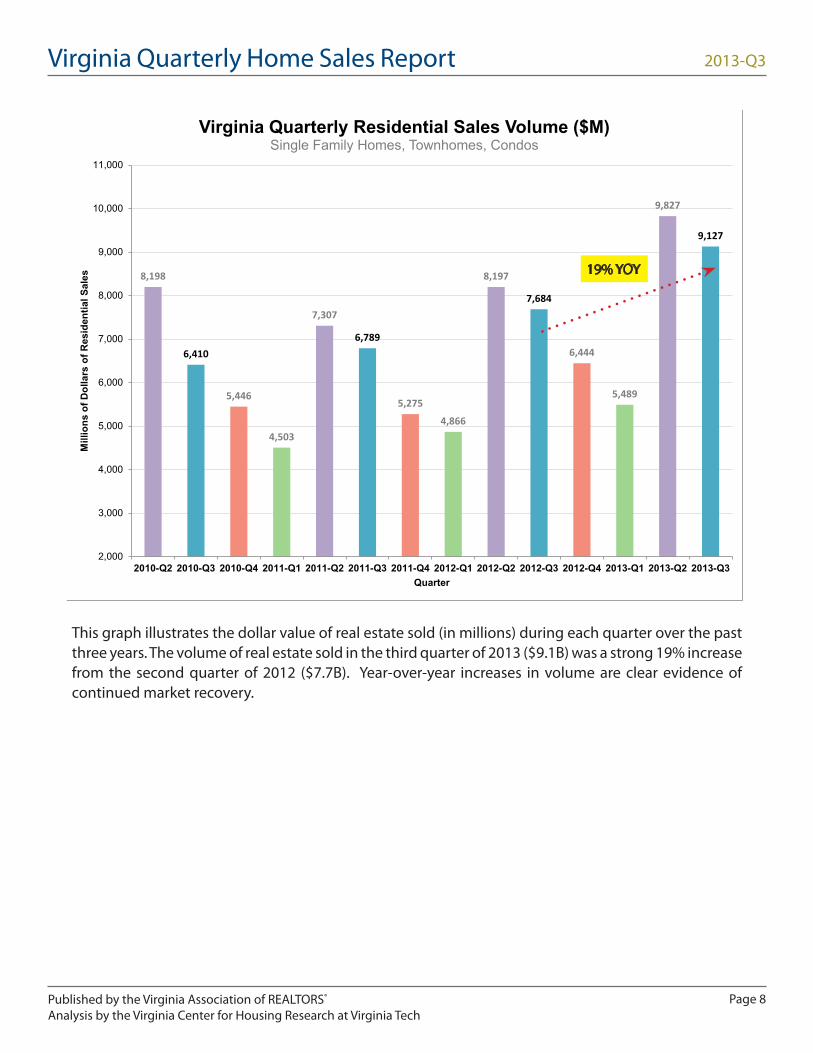
Virginia Quarterly Residential Sales Volume ($M)Single Family Homes, Townhomes, Condos
This graph illustrates the dollar value of real estate sold (in millions) during each quarter over the past three years. The volume of real estate sold in the third quarter of 2013 ($9.1B) was a strong 19% increase from the second quarter of 2012 ($7.7B). Year-over-year increases in volume are clear evidence of continued market recovery.
19% YOY

2013-Q3Virginia Quarterly Home Sales Report
Published by the Virginia Association of REALTORS®
Analysis by the Virginia Center for Housing Research at Virginia TechPage 9
7982
91
104
94 93
100103
85 8488
91
71 71
0
20
40
60
80
100
120
2010-Q2 2010-Q3 2010-Q4 2011-Q1 2011-Q2 2011-Q3 2011-Q4 2012-Q1 2012-Q2 2012-Q3 2012-Q4 2013-Q1 2013-Q2 2013-Q3
Aver
age
Day
s O
n M
arke
t
Quarter
Virginia Average Days On MarketSingle Family Homes, Townhomes, Condos
Days on the market remain historically low. Time on the market decreased 16% from the third quarter of 2012 to an average of 71 days in the third quarter of 2013. Although the quarterly average days on the market remained the same from 2013-Q2 to 2013-Q3, days on the market continued to increase through September.
-16%YOY

2013-Q3Virginia Quarterly Home Sales Report
Published by the Virginia Association of REALTORS®
Analysis by the Virginia Center for Housing Research at Virginia TechPage 10
2,892
7,090
6,438
4,517
2,773
3,114
926
398
80
43
2,980
7,127
6,622
4,657
2,987
3,555
990
440
89
52
0 500 1,000 1,500 2,000 2,500 3,000 3,500 4,000 4,500 5,000 5,500 6,000 6,500 7,000 7,500 8,000
0 - $100K
$100K - $200K
$200K - $300K
$300K - $400K
$400K - $500K
$500K - $750K
$750K - $1M
$1M - $1.5M
$1.5M - $2M
$2M +
Number of Single Family, Townhome and Condo Sales
Pric
e R
ange
Virginia Price Distribution Of Residential Home SalesSingle Family Homes, Townhomes, Condos
2013-Q2 2013-Q3
-17%
-10%
-10%
-6%
-12%
-7%
-3%
-3%
-3%
-1%
Home sales decreased in all price ranges this quarter, reflecting the overall decline in sales primarily in September. The most substantial decreases in sales were for homes sold for more than $400K. Although overall price decreases may be influencing this distribution (as prices decrease homes move from higher price categories or lower price categories), the significant decrease in sales of homes in these ranges ($400K-$2M) should not be entirely attributed to seasonal price decreases. A number of factors, possibly restricted inventory and unfavorable economic conditions could be compounding seasonal declines in sales.

2013-Q3Virginia Quarterly Home Sales Report
Published by the Virginia Association of REALTORS®
Analysis by the Virginia Center for Housing Research at Virginia TechPage 11
9,02610,002
423,000465,000
0
100,000
200,000
300,000
400,000
500,000
600,000
0
2,000
4,000
6,000
8,000
10,000
12,000
14,000
16,000
Aug-12 Sep-12 Oct-12 Nov-12 Dec-12 Jan-13 Feb-13 Mar-13 Apr-13 May-13 Jun-13 Jul-13(p)
Aug- 13(p)
Monthly Residential SalesVIRGINIA (All MLS-Reported Home Sales) UNITED STATES (Existing Home Sales)
$248,000$265,000
$185,500$212,200
$50,000
$100,000
$150,000
$200,000
$250,000
$300,000
$50,000
$100,000
$150,000
$200,000
$250,000
$300,000
Aug-12 Sep-12 Oct-12 Nov-12 Dec-12 Jan-13 Feb-13 Mar-13 Apr-13 May-13 Jun-13 Jul-13(p)
Aug-13(p)
Monthly Residential Median Sales PriceVIRGINIA (All MLS-Reported Home Sales) UNITED STATES (Existing Home Sales)
The median sales price in Virginia remains higher than the national average, but tracked down this quarter . US sales remained steady through July and August, while Virginia prices began to decline.
The monthly variation in the pace of home sales is relatively consistent in Virginia as compared to the entire United States. However, U.S. sales continued to increase into the third quarter while Virginia sales decreased.

2013-Q3Virginia Quarterly Home Sales Report
Published by the Virginia Association of REALTORS®
Analysis by the Virginia Center for Housing Research at Virginia TechPage 12
Unemployment Rates By State seasonally adjusted, August 2013
(U.S. rate = 7.3 percent)
14.0% and over
12.0% to 13.9%
10.0% to 11.9%
8.0% to 9.9%
6 0% t 7 9%
SOURCE: Bureau of Labor Statistics Local Area Unemployment Statistics
6.0% to 7.9%
4.0% to 5.9%
3.9% or below
6.9% 6.7%6.4% 6.5% 6.6%
6.2%5.9% 6.0% 5.9%
5.6%5.3% 5.5%
5.8%
4%5%5%6%6%7%7%8%
2010-Q3 2010-Q4 2011-Q1 2011-Q2 2011-Q3 2011-Q4 2012-Q1 2012-Q2 2012-Q3 2012-Q4 2013-Q1 2013-Q2 2013-Q3(p)
Virginia Unemployment RateSource: Bureau of Labor & Statistics
Virginia’s unemployment rate increased in the third quarter of 2013. Virginia remained at the second lowest level of unemployment in the United States in August, despite the increase in unemployment.
2013-Q3 unemployment rate based on preliminary August 2013 data.

2013-Q3Virginia Quarterly Home Sales Report
Published by the Virginia Association of REALTORS®
Analysis by the Virginia Center for Housing Research at Virginia TechPage 13
4.45% 4.41%
4.85%4.66%
4.31%
4.01%3.92%
3.80%
3.54%3.36%
3.50%3.69%
4.44%
3.0%
3.2%
3.4%
3.6%
3.8%
4.0%
4.2%
4.4%
4.6%
4.8%
5.0%
2010-Q3 2010-Q4 2011-Q1 2011-Q2 2011-Q3 2011-Q4 2012-Q1 2012-Q2 2012-Q3 2012-Q4 2013-Q1 2013-Q2 2013-Q3
Average 30-Year Mortgage Interest RatesSource: FreddieMac
3.9%3.8%
4.1%
3.9%
3.5%3.3%
3.2%3.0%
2.8%2.7% 2.7%
2.9%
3.5%
2.0%
2.5%
3.0%
3.5%
4.0%
4.5%
2010-Q3 2010-Q4 2011-Q1 2011-Q2 2011-Q3 2011-Q4 2012-Q1 2012-Q2 2012-Q3 2012-Q4 2013-Q1 2013-Q2 2013-Q3
Average 15-Year Mortgage Interest RatesSource: FreddieMac
Mortgage interest rates increased faster in the third quarter of 2013 compared to the previous three quarters. The Federal Reserve Board has indicated that this upward trajectory will continue, but likely at a slow pace. Nonetheless, mortgage interest rates remain historically low.

2013-Q3Virginia Quarterly Home Sales Report
Published by the Virginia Association of REALTORS®
Analysis by the Virginia Center for Housing Research at Virginia TechPage 14
The Virginia Association of REALTORS® (VAR) is the business advocate for real estate professionals in Virginia. VAR represents more than 28,000 REALTORS active in all phases of real estate brokerage, management, development and appraisal. Our mission is to enhance our membership’s ability to achieve business success.
All inquiries regarding this report should be directed to:
Stacey Ricks, Director of Public RelationsVirginia Association of REALTORS®10231 Telegraph Road, Glen Allen, VA 23059(804) 249-5716 [email protected]/HomeSales
Economic Regions
Central Valley:
Central Virginia:
Hampton Roads / Chesapeake Bay:
Northern Virginia:
Roanoke / Lynchburg / Blacksburg:
Southside Virginia:
Southwest Virginia:
Albemarle, Augusta, Bath, Buena Vista City, Charlottesville City, Fluvanna, Greene, Harrisonburg City, Highland, Lexington City, Nelson, Rockbridge, Rockingham, Staunton City, Waynesboro City
Amelia, Buckingham, Charles City, Chester�eld, Colonial Heights City, Cumberland, Dinwiddie, Goochland, Hanover, Henrico, Hopewell City, King and Queen, King William, Louisa, New Kent, Nottoway, Petersburg City, Powhatan, Prince Edward, Prince George, Richmond City, Sussex
Accomack, Chesapeake City, Franklin City, Gloucester, Hampton City, Isle of Wight, James City, Lancaster, Mathews, Middlesex, Newport News City, Norfolk City, Northampton, Northumberland, Poquoson City, Portsmouth City, Southampton, Suffolk City, Surry, Virginia Beach City, Williamsburg City, York
Alexandria City, Arlington, Caroline, Clarke, Culpeper, Essex, Fairfax, Fairfax City, Falls Church City, Fauquier, Frederick, Fredericksburg City, King George, Loudoun, Madison, Manassas City, Manassas Park City, Orange, Page, Prince William, Rappahannock, Richmond, Shenandoah, Spotsylvania, Stafford, Warren, Westmoreland, Winchester City
Alleghany, Amherst, Appomattox, Bedford, Bedford City, Botetourt, Campbell, Covington City, Craig, Floyd, Franklin, Giles, Lynchburg City, Montgomery, Pulaski, Radford, Roanoke, Roanoke City, Salem City
Brunswick, Charlotte, Danville City, Emporia City, Galax City, Greensville, Halifax, Henry, Lunenberg, Martinsville City, Mecklenburg, Norton City, Patrick, Pittsylvania
Bland, Bristol City, Buchanan, Carroll, Dickenson, Grayson, Lee, Russell, Scott, Smyth, Tazewell, Washington, Wise, Wythe
Information sourced from multiple listing services across the state with data compiled by R E Stats Inc.All information is deemed reliable but is not guaranteed. Figures might not match those reported elsewhere.
