q3 earnings deck (12.10)
TRANSCRIPT

Swvl Holdings Q3 2021 Earnings
Supplemental Data
2
Table of Contents
About Swvl
Our Customer Promise
Core Strategy - The Fly-Wheel Effect
Swvl's Operating System
ESG at Swvl - Strategy and Initiatives
Q3 2021 Growth Story and Performance Highlights
Cohort Analysis - Double-clicking on the fundamentals
Replicating the successful model for our first city [Cairo] to accelerate new market growth
Swvl's Expansion in the TaaS and SaaS segments
Appendix - Keyword Definitions
Swvl-O-meter and Increased Guidance
Cutting-edge Proprietary Technology - Core of Swvl’s Virtuous Growth Cycle

6 Countries
3
About Swvl:
Swvl is the leading mass transit player globally providing B2C and B2B/B2G solutions to make transportation more affordable, reliable and convenient for its users and corporate clients.
Swvl is expanding fast and is now in 6 countries across the world. With an ambitious team, Swvl plans to expand the footprint globally with a "demand-responsive, supply agnostic, self-optimising and an asset light" mass transit system.
61.3M Cumulative
bookings
1.8M Users
serviced (excluding B2C/B2G users)
245M pounds CO2
emissions prevented
48.3K Cumulative
routes launched
19.4K Captains
onboarded
About Swvl
Note: All figures presented on this slide are as-of September 30, 2021.

4
Reliable and Convenient
01.
Safe02.
Valuable 03.
Low average walk to station (7 mins)7 minutes to station
5 days in-advance booking system
Air conditioned and top quality
95% on time pickups
4.7/5 customer rating Multiple payment options
Vetted drivers with background checks
Ability to share live ride status
Critical incident teams and third-party professional providers
Ability to contact/trace
Far more affordable than alternatives
$5.00 - $8.00Ride-hailing and Taxi
$1.10 - $2.20Swvl
Our Customer Promise

5
Swvl's operating system enables it to continuously utilize vehicles by pooling demand across different use cases and seasonality, thus significantly improving the assets' ROI, reducing the cost structure, and enhancing the margin opportunity.
Customer
Mall
School
Weekend Getaway
Work
Swvl's Operating System
Fulfilled by Powered by
travel
Intra-city
Inter-city
B2B / B2G
Swvl’s Operating System
Intra-city: users book seats on vehicles available exclusively to the platform to commute within a given city
B2B/B2G (SaaS/TaaS): enables corporates, schools and transit agencies to provide optimized mass-mobility solutions via SaaS (Technology only) and TaaS (Technology + Fleet Operations)
Inter-city: users book and go on long distance trips either on buses available exclusively to the platform or on buses marketed through Swvltravel
Swvl's businesses complementing each other..
• The B2C (Intra-city and Inter-city) and B2B/B2G (SaaS/TaaS) businesses of Swvl cater to different use cases and have their own specific target segment; this allows customers to book rides across categories, thereby increasing the lifetime value
• The businesses also complement each other with different demand distribution trends throughout the year enabling the portfolio to de-risk against seasonality and other demographic, consumer behavior patterns.
B2C
B2B/B2G

Cutting-edge proprietary technology is the core of Swvl’s virtuous growth cycle and creates a superior competitive moat
Predicting demand for facilitating better selection
Predict and identify latent demand
Create routes centered around demand clusters and deliver on the reliability promise
• A ML algorithm identifies key pockets of latent and existing demand for a given city
• A ML, self-evolving model, defines optimum routes to maximize demand capture, minimize network-wide cannibalization, minimize walk to station distance and define the right schedule time to deploy vehicles
Map the City
• Swvl divides the city into equal areas (i.e., hexes)
• Hexes are the basic unit of analysis to build a network
Predict and Identify Latent Demand • Run regression analysis to identify major demand pairs
• Use in-app search data, social-media listening to understand potential user movement between hexes
1
Capture Latent Demand, Optimize Existing Areas • Determines hexes to add stations
• Run machine learning algorithm to predict revised network performance
Automated route creation to maximize demand conversion
Create routes around demand clusters2
• An algorithm assembles sets of routes in coherent plans that maximize demand capture, vehicle owner earnings, vehicle utilization, and driver’s convenience
• An "ambulance" like fleet is placed across the network to minimize the impact of vehicle breakdowns/no-shows and maintain customer promise
Dynamic routing improves user experience, providing greater convenienceCreate dynamic routes
Plan stitching tool creates thousands of plans per week while continuously decreasing cost per KM and increasing vehicle ROI • Machine learning (ML) algorithm “stitches” multiple
routes into a plan
• A plan optimizes for driver convenience and earnings by maximizing the driven monetized KMs via a system of 2-6 rides per plan with a combination of retail, travel and TaaS rides
• Dynamic Routing (DR) is a proprietary computational technology developed by Swvl
• Enables Swvl to adapt, real-time, to actual demand pockets, as vehicles move around the city
• Creates stations on the fly to maximize demand capture
• Identifies tolerable travel time budgets for riders and ensures no breach of the ETA promised to customers
3Providing more affordable customer ride starts with minimizing cost per KM incurred while enhancing vehicle ROI
Create cost efficient plans4
• The algorithm helps ensure that the end point of every ride is conveniently close to the starting point of the subsequent ride
• The model helps ensure maximum vehicle RoI and maximum customer demand capture for every vehicle
• Finds the best route that optimizes for the walk to station distance and the travel time
• Evolution of a route dynamically upon discovering a new rider
• Converts to a real station if adding the stop will keep route within prior customer travel time and walk to station budgets

7
Better customer experience
Better selection
Shorter walking distance
More drivers and vehicles
More rides per customer
Denser network
Lower average fare per trip
Lower cost structure
Fly-Wheel Effect Swvl’s Core Strategy
Impact of Cross-utilization on Supply Retention
Uplift in 30-day Rolling Retention % (4)
12%
Non Cross-utilized Fleet Cross-utilized Fleet
$228Earnings (2)
Cost per km (3) $0.020
$429
$0.015
88%
-26%
Detailed Study of Cairo Cross-Utilization
Case Study(1): Cross-utilization of vehicles between different categories including B2C and B2B/B2G at Swvl is the key to augment the fly-wheel effect at a faster pace, leading to a significant increase in captain earnings and retention and at the same time significantly reducing the cost per kilometer and thereby steering Swvl towards efficiency and profitability.
More drivers & vehicles implies
more route creation
Enables cross-dispatch (lower in cost/km +
better earnings/captain)
More routes -> Denser network -> Lower walk to
station
Lower cost, walk to station -> Better CX &
higher willingness to pay
This drives more traffic and more users on the
platform
Cross-dispatched Capacity B2C (thousands)
Apr May Jun Jul Aug Sep
221199
176
139
9582
Non Cross-utilized Fleet Cross-utilized Fleet
$433Earnings
Cost per km $0.015
$608
$0.012
41%
-17%
3x Growth in
6M
Intra-city captains serving Inter-city rides
Inter-city captains serving Intra-city rides
(1) All data considered in the case study is for the period April 2021 - Sep 2021 (2) Earnings is the gross income of a captain in US Dollars (3) Cost per km is the cost of supply per total available seat kilometer in US Dollars (4) 30-day Rolling Retention is the percentage of retained captains out of the total active captains as per the last 30-day period

99.86% Accident Free Rides
Driven by efficient routing algorithms and the ongoing training, up-skilling of captains
~0.64km Walking DistanceIn-house dynamic routing technology helps reduce walk to station and improve access
~5.3min Average LatenessDe-risked network with optimized backup assignment; ~50% lower lateness than developed markets
14.4M person-hours Congestion Reduced
Maintaining 80-85% utilization across our fleet resulting in less buses and cars on the road
27k+ Free Essential Bookings
22K+ bookings catering to front-line workers and 5K+ bookings to/from vaccination centres
~245M pounds CO2 Emission Prevented
Maintaining 80-85% utilization across our fleet resulting in less buses and cars on the road
EVs Accelerating Adoption
Introducing EVs and will continue to accelerate adoption
8
Humanizing the Daily Commute by obsessing about the well-being of each individual rider
Enabling our Societies by acting as a responsible societal agent
Caring for the Planet by reducing greenhouse gas emissions
Humanising the Daily Commute
ESG at Swvl Providing the Right to Mobility
Enabling our Societies
Caring for the Planet
ESG Strategy

9
Q3 '21 Growth Story and Performance Highlights

10
Quarter on Quarter - Gross Revenue ($ in millions)
US$ 4
US$ 8
US$ 12
US$ 16
Q3-2018 Q3-2019 Q3-2020 Q3-2021
US$ 16.0
US$ 4.4
US$ 8.7
US$ 1.1
Gross Revenue
14x Growth
COVID-19 related restrictions & lockdowns were a contributing factor to this drop in revenue
14x growth over last 3 years
3.6x quarter on quarter growth
1.8x pre-COVID19 levels
All around growth across all KPIs including capacity, utilization and average trip fare has resulted in a rapid gross revenue growth
$68M ARR
as on Sep 2021

Q3 '18 Q3 '19 Q3 '20 Q3 '21
11
Capacity & Utilization
Swvl's cutting edge, in-house search based capacity allocation engine enables the optimal allocation of capacity on routes throughout the network based on the geospatial distribution of user searches
Swvl has leveraged this technology which has enabled the bookings growth at a faster pace than the capacity expansion leading to a substantially higher utilization level of 83%
48% Utilization (3)
83% Utilization
Capacity (1) Growth 8X Bookings (2) Growth 13X
COVID-19 related restrictions & lockdowns were a contributing factor to this drop in capacity/bookings
(1) Capacity: Total number of bookable seats (2) Bookings: Total seats booked by the users (3) Utilization: Percentage of seats booked out of all available seats
Capacity
8x growth over last 3 years
3.3x quarter on quarter growth
1.2x pre-COVID19 levels
Combination of high captain retention and low acquisition cost (both as a result of ability to offer up to 2x driven earnings driven by higher vehicle utilization) led to strong capacity growth
Utilization
73% growth over last 3 years
22% higher than pre-COVID19 levels
Dynamic routing (which we believe led to reduction in walk to station) and dynamic pricing (which optimizes pricing to drive utilization) developed during COVID-19 drove increase in utilization
Capacity and Bookings (in millions)
1.50.7
8.7
5.9
3.32.7
10.9
9.0
Capacity Bookings

12
Active Users
Quarterly Active Users - B2C (thousands)
150
300
450
600
Q3-2018 Q3-2019 Q3-2020 Q3-2021
507.7
165.0
346.3
79.1
6x Growth
COVID-19 related restrictions & lockdowns were a contributing factor to this drop in active users
(1) Active Users: Number of users who have done at least 1 booking in a given time frame
6x growth over last 3 years
3.1x quarter on quarter growth
1.5x pre-COVID19 levels
Combination of high user retention and low acquisition cost (both as a result of ability to offer a reliable, safe and convenient ride up to 80% cheaper than private transport) led to strong active user
(1) growth

Quarterly Gross Margins
7.50%
15.00%
22.50%
30.00%
Q3-2018 Q3-2019 Q3-2020 Q3-2021
17.6%
22.4%
2.0%
7.2%
13
Gross Margins
144% Growth
On account of the COVID-19 related restrictions & lockdowns, the focus of the company was to conserve cash and boost profitability during this period
(1) Gross Margins (GM): Margin post the supply cost
144% growth over last 3 years
>20% GM in Q3-2020 as priority was to
conserve cash during COVID-19
780% higher than pre-COVID19 levels
Combination of growth across KPIs including utilization, average trip fare and reduction in cost per seat (due to higher vehicle utilization obtained through cross utilization of vehicles between B2B/B2G & B2C) resulted in strong gross margin (1) expansion

Quarterly Net Margins
-45.00%
-30.00%
-15.00%
0.00%
15.00%
Q3-2018 Q3-2019 Q3-2020 Q3-2021
-12.5%
2.1%
-47.4%
-53.8%
14
Net Margins
330% Growth
On account of the COVID-19 related restrictions & lockdowns, the focus of the company was to conserve cash.
(1) Net Margins (NM): Margin post the supply costs, promotions, refunds, waivers and the captain incentives.
330% growth in Net Margins over the last 3
years
Profitable in Q3-2020 as priority was to
conserve cash during COVID-19
279% higher than pre-COVID19 levels
Net margin (1) maintained within -11% range due to strategic focus on topline growth

15
Swvl-O-meter and Increased 2022 Guidance Q3 ’20 vs Q3 ’21
Substantial outperformance across all KPIs in Q3 '2021
Gross Revenue $16M 264% jump from same quarter last year
Active Users 507K 207% jump from same quarter last year
Capacity 10.7M 229% jump from same quarter last year
Fleet Utilization at 83%
264% 207%
229% 83%
FY 2022 Gross Revenue Guidance $155MUp 10% from Prior
$141m

16
Cohort Analysis Double-clicking on the fundamentals

Schedule Utilization Activation
MonthMonth 1 Month 2 Month 3 Month 4 Month 5 Month 6 Month 7 Month 8 Month 9
Jan 19 37.0% 39.7% 41.9% 47.0% 50.9% 44.3% 55.7% 56.7% 61.0%
Feb 19 24.5% 29.0% 34.3% 43.9% 39.0% 47.2% 51.3% 55.3% 58.5%
Activation Month
Month 1 Month 2 Month 3 Month 4 Month 5 Month 6 Month 7 Month 8 Month 9
Jan 21 72.4% 57.4% 70.4% 83.5% 86.7% 81.3% 83.0% 85.4% 84.1%
Feb 21 68.8% 65.5% 67.7% 74.6% 68.1% 69.1% 69.5% 70.2%
Mar 21 56.4% 61.4% 66.0% 69.3% 70.4% 72.5% 72.6%
Apr 21 92.2% 94.5% 95.3% 95.9% 96.9% 97.3%
May 21 66.8% 60.5% 68.0% 72.4% 67.7%
Jun 21 64.4% 73.0% 76.7% 75.6%
Jul 21 81.4% 83.7% 82.9%
Aug 21 74.6% 70.0%
Sep 21 81.5%
2021 Cohorts take just ~0-1 month(s) to reach similar or greater levels of Utilization
2019 Cohorts took 9 months to reach ~60% Utilization
17(1) Schedule: A combination of a route and an hour, the schedule utilization is the percentage of seats booked out of all available seats in a schedule
A comparison of the 2019 and 2021 cohort shows a ~89% decrease in the time taken (in months) to reach > 60% levels of schedule utilization (1)
This is primarily driven by the network optimization engines powered by Artificial Intelligence which constantly learns and optimizes with every ride building the first of its kind self optimizing mass transit system

Gross Revenue per userActivation
MonthMonth 1 Month 2 Month 3 Month 4 Month 5 Month 6 Month 7 Month 8 Month 9
Apr 19 $4.1 $8.6 $8.4 $12.4 $11.8 $14.2 $15.1 $12.5 $12.7
May 19 $4.1 $7.7 $12.4 $11.3 $13.6 $14.4 $12.1 $12.6 $12.4
Activation Month
Month 1 Month 2 Month 3 Month 4 Month 5 Month 6 Month 7 Month 8 Month 9
Jan 21 $7.5 $15.5 $21.3 $17.9 $18.4 $27.4 $24.8 $27.1 $19.2
Feb 21 $7.9 $23.1 $19.1 $19.1 $25.8 $22.6 $25.5 $18.8
Mar 21 $7.8 $15.3 $13.3 $17.9 $14.3 $15.6 $13.9
Apr 21 $6.5 $11.4 $13.6 $12.9 $12.8 $11.2
May 21 $6.3 $14.8 $13.3 $12.5 $11.5
Jun 21 $9.0 $19.8 $18.9 $15.0
Jul 21 $11.5 $21.7 $17.0
Aug 21 $10.5 $14.9
Sep 21 $9.1
2021 Cohorts take just 2 months to cross $14 per month of gross revenue per user
2019 Cohorts took 6 months to reach $14 per month of gross revenue per user
18(1) Revenue per user is the income generated per active user in the defined time-period
A comparison of the 2019 and 2021 cohort shows a ~33% decrease in the time taken (in months) to cross the same gross revenue per user (1) ($14 per month)
This is driven by dynamic pricing technology which considers users' behaviour on the platform & churn probability to adjust pricing which increases user affinity on the platform.
Also the abundance of services including intracity, intercity & charter rides cater to more use cases and hence increases revenue per user

Building upon the successful model of our first city [ Cairo ] to accelerate new market growth

Cairo A Success Story
Monthly Net Margin (%)
-140%
-105%
-70%
-35%
0%
35%
1/1/2019 1/1/2020 1/1/2021
20
92%Q3 '21 Utilization
-2.9%Q3 '21 NM%
31%Q3 '21 GM% Launched in March 2017, Cairo is the first
market for Swvl.
Cutting-edge technological solutions like demand estimation, demand based capacity allocation, automated dynamic routing and pricing algorithms and supply biding platforms coupled with the flawless execution capability of the Swvl team has made Cairo a success story.
The net margin is maintained at near break even levels due to a strategic focus on growth. With the growth related investments including promotions, refunds and waivers declining, the convergence of gross and net margin becomes inevitable.
Monthly Utilization (%)
0%
28%
55%
83%
110%
1/1/2019 1/1/2020 1/1/2021
Monthly Gross Margin (%)
-60%
-45%
-30%
-15%
0%
15%
30%
45%
1/1/2019 1/1/2020 1/1/2021
Shows the contribution of COVID-19 related lockdowns and restrictions

Other Cities Accelerating Even Faster
0
2
3
5
6
Cairo Nairobi Lahore Karachi Islamabad
22
4
5
6
0
2
4
6
8
Cairo Lahore Islamabad Karachi
3
4
5
8
2
4
6
8
10
12
Cairo Nairobi Lahore Karachi
3
6
910
123456789
Cairo Nairobi Lahore Karachi Islamabad
22
5
88
Months to 100K BookingsMonths to 50K Bookings
Months to 200K BookingsMonths to 150K Bookings
21
Swvl plans to continue focus on growth for the remaining cities to reach critical mass faster and generate levers to optimize the economics in a sustainable manner.
As evident in the charts, other cities are reaching the milestones much faster than Cairo.
Replicating Successful Cairo model

Swvl's expansion in the TaaS and SaaS segments
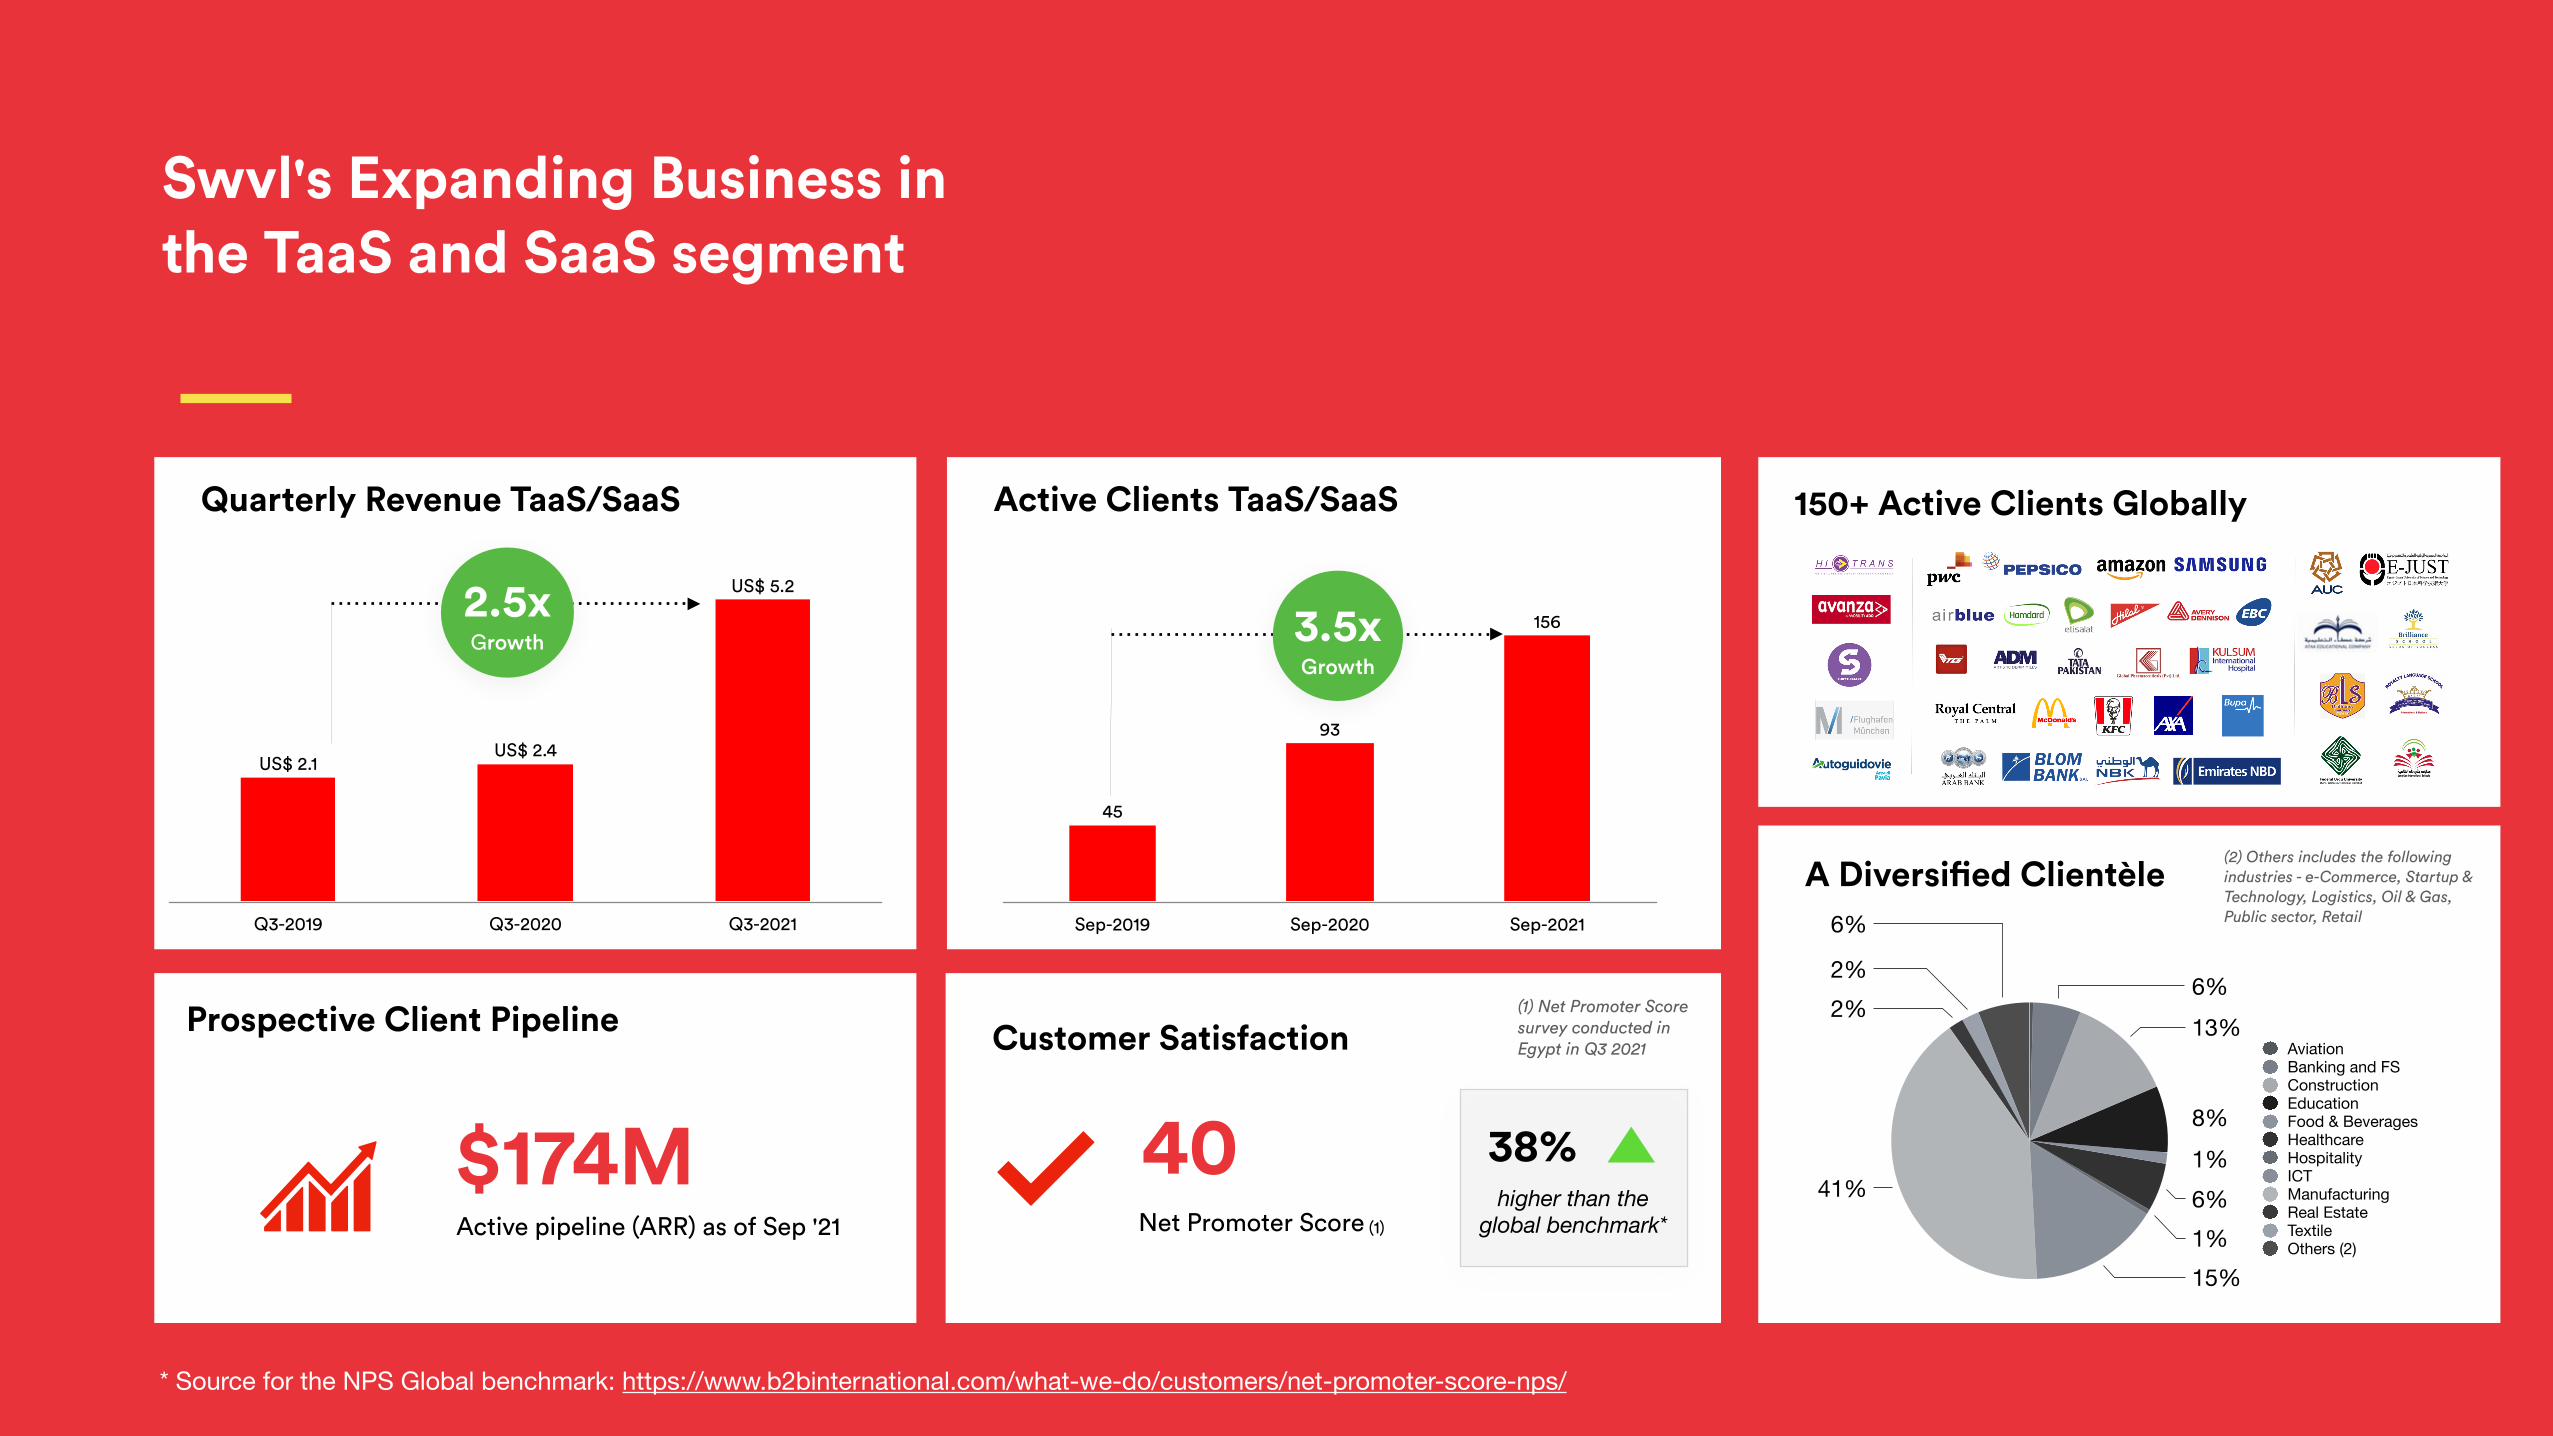
Swvl's Expanding Business in the TaaS and SaaS segment
$174M 40Net Promoter Score (1)Active pipeline (ARR) as of Sep '21
Active Clients TaaS/SaaS
Sep-2019 Sep-2020 Sep-2021
156
93
45
3.5x Growth
Q3-2019 Q3-2020 Q3-2021
US$ 5.2
US$ 2.4US$ 2.1
2.5x Growth
Quarterly Revenue TaaS/SaaS
Prospective Client Pipeline Customer Satisfaction(1) Net Promoter Score survey conducted in Egypt in Q3 2021
150+ Active Clients Globally
6%
2%2%
41%
15%1%6%1%8%
13%6%
AviationBanking and FSConstructionEducationFood & BeveragesHealthcareHospitalityICTManufacturingReal EstateTextileOthers (2)
A Diversified Clientèle(2) Others includes the following industries - e-Commerce, Startup & Technology, Logistics, Oil & Gas, Public sector, Retail
* Source for the NPS Global benchmark: https://www.b2binternational.com/what-we-do/customers/net-promoter-score-nps/
38%higher than the
global benchmark*

Swvl Case Study: Leading Insurance provider
Insurance company chooses operational visibility and employee safety for its Egyptian employees with Swvl's route optimization and real-time tracking solutions
One of the largest global insurers in the world, provides its customers with a full suite of products that saves and protects their life and livelihood.The French multinational firm became one of the top 5 insurance providers in Egypt within 5 years of establishing their presence.
24
The organization had a history of operational issues with its transportation, which led it to solicit proposals for solutions from transportation providers. While all leading providers in the Egyptian market bid, Swvl managed to win with our competitive price and the promise of a better service.
The administrator can track all rides in real-time without any manual touch points on the Swvl Business Dashboard. Each rider can do the same from the Swvl App.
Swvl support is accessible 24/7 over call and in-app to ensure a high quality in-ride experience. Any issue with the captains or vehicles is resolved at the quickest pace.
Client Overview
• Unreliable and unprofessional drivers • Poor quality vehicles • Multiple safety violations • Operational invisibility
ChallengesUse-CaseAutomation of daily transportation from manual operations to digital - giving complete visibility of every moving part in the system.
Solutions
Optimized routes and fleet mix to achieve higher fleet utilization and lower costs.
Route Optimization and Fleet Mix 24/7 Support Real-time Tracking
5% Cost Reduction
Swvl Business Results
10% Less Vehicles
90% Customer Satisfaction

Expansion to Europe with a controlling interest in Shotl
25
>350,000 Bookings to date
Municipality and Corporate client base
22 Cities across 10 countries (1)
Expected to further Swvl's mission of empowering under-served communities globally with safe, efficient and cost-effective mobility solutions
Swvl gains access to an additional ~$35-60BN transit tech market by joining hands with Shotl
(1) Including Brazil, Japan, Spain, Germany, France, UK, Italy, Switzerland, Portugal and Finland. Certain operations currently interrupted due to COVID-19 (2) Demand-responsive transit.
Strong and growing presence in the MENAP region with highly satisfied users and corporate clients
Offerings are tailored for condensed geographies and peak hour scheduled commute use-cases
Product caters to the on-demand use-case. Combined mobility solutions will cater to wide range of use-cases
Dynamic routing, pricing, geospatial demand based capacity allocation engine
Strong and growing presence in the EU and with highly satisfied users, corporate clients and B2G agencies
On-demand SaaS technology and DRT (2) capabilities
Swvl X Shotl (Geographic, Product and Tech synergies)
The yellow dots represent the potential new market launches that can be accelerated with the acquisition of a controlling interest in Shotl

Shotl Case Study: Munich Airport: Large corporate site with unpredictable mobility patterns
26
Find a new way to move employees without raising prices sky-high.
Configured a white-label on-demand service called ShuttleMe with three branded minivans and professional drivers. During working hours, airport employees can book a pick-up and drop-off in real-time via the Passenger App from any of the stops covering the entire airport.
38,000 Employees Employees had complex mobility needs, highly unpredictable employee movements
70 Company Cars Cars were under-utilized, involved a lot of time in parking and longer waiting time for return journeys
Longer Waiting TimeLonger waiting time for return journeys
6 minsAverage Travel Time
Average Wait Time7 mins
Satisfaction Rating4.8
Shotl Results
Increase in passengers per day; 180 up from 25
Registered Users
+620% 1250
Adoption
SolutionChallenge
Business Problem

Thank You

Appendix

Q3 2021 Unaudited Financials
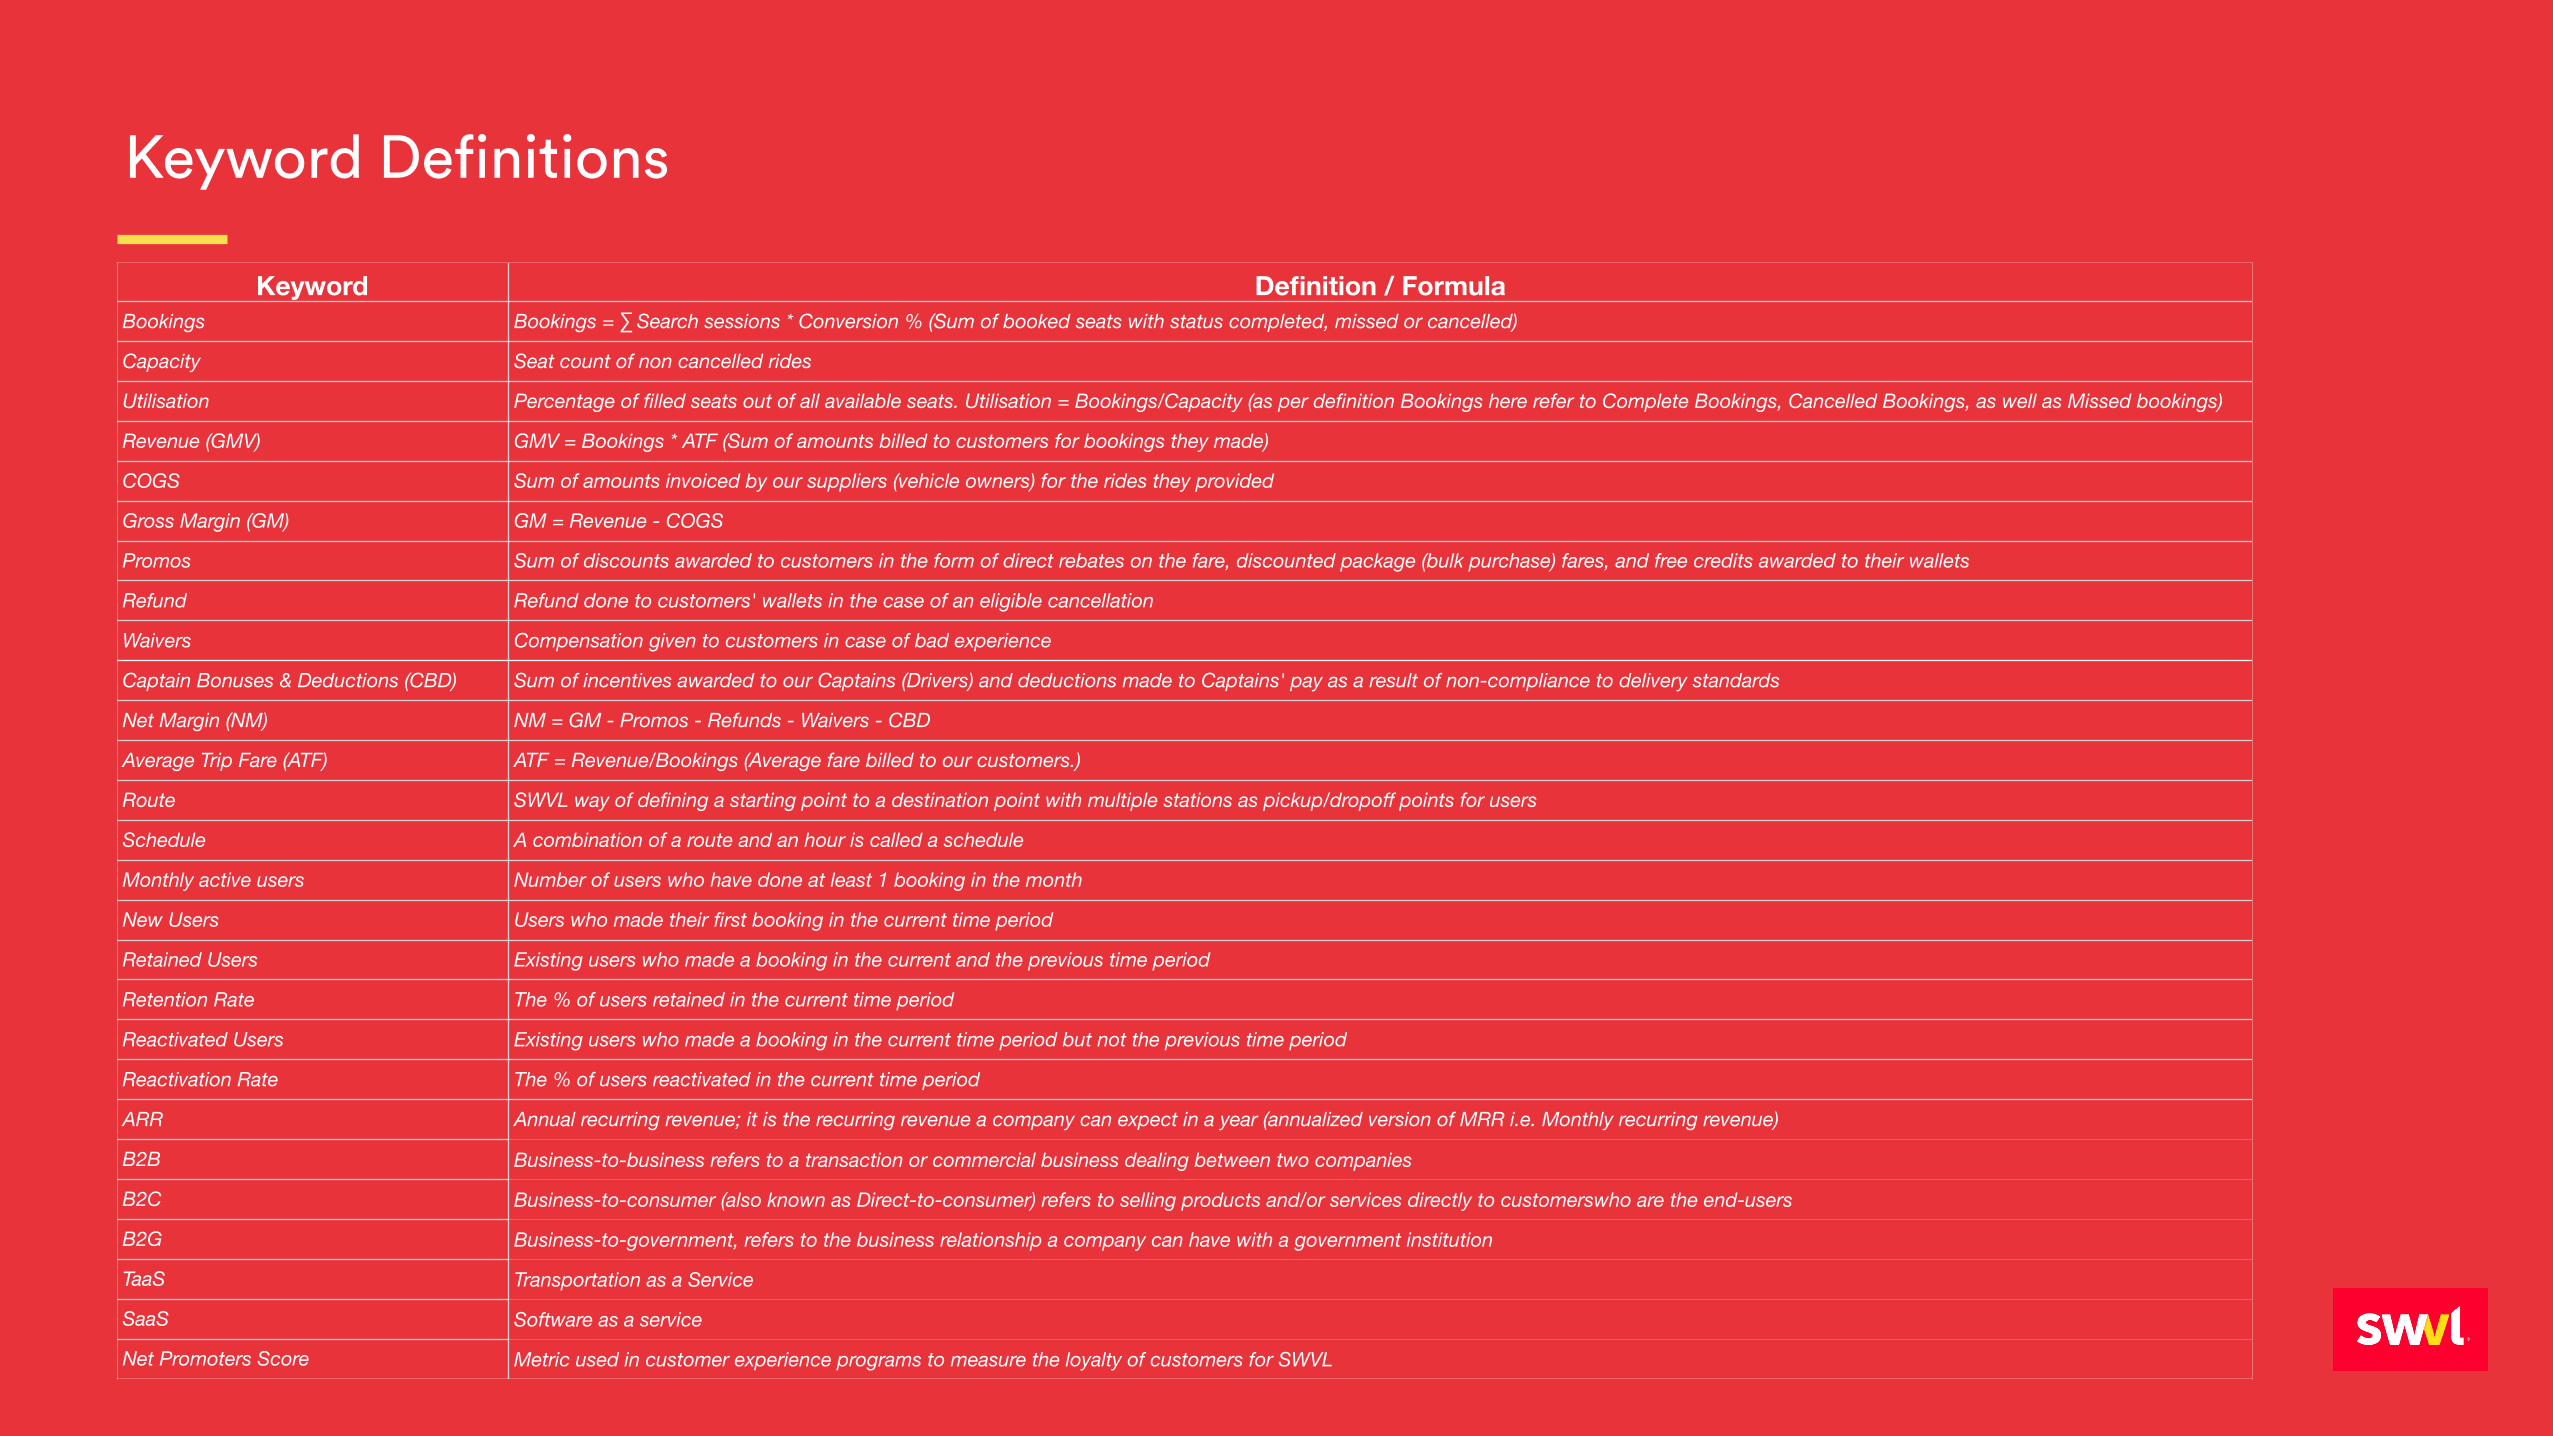
Keyword Definitions
Keyword Definition / FormulaBookings Bookings = ∑ Search sessions * Conversion % (Sum of booked seats with status completed, missed or cancelled)
Capacity Seat count of non cancelled rides
Utilisation Percentage of filled seats out of all available seats. Utilisation = Bookings/Capacity (as per definition Bookings here refer to Complete Bookings, Cancelled Bookings, as well as Missed bookings)
Revenue (GMV) GMV = Bookings * ATF (Sum of amounts billed to customers for bookings they made)
COGS Sum of amounts invoiced by our suppliers (vehicle owners) for the rides they provided
Gross Margin (GM) GM = Revenue - COGS
Promos Sum of discounts awarded to customers in the form of direct rebates on the fare, discounted package (bulk purchase) fares, and free credits awarded to their wallets
Refund Refund done to customers' wallets in the case of an eligible cancellation
Waivers Compensation given to customers in case of bad experience
Captain Bonuses & Deductions (CBD) Sum of incentives awarded to our Captains (Drivers) and deductions made to Captains' pay as a result of non-compliance to delivery standards
Net Margin (NM) NM = GM - Promos - Refunds - Waivers - CBD
Average Trip Fare (ATF) ATF = Revenue/Bookings (Average fare billed to our customers.)
Route SWVL way of defining a starting point to a destination point with multiple stations as pickup/dropoff points for users
Schedule A combination of a route and an hour is called a schedule
Monthly active users Number of users who have done at least 1 booking in the month
New Users Users who made their first booking in the current time period
Retained Users Existing users who made a booking in the current and the previous time period
Retention Rate The % of users retained in the current time period
Reactivated Users Existing users who made a booking in the current time period but not the previous time period
Reactivation Rate The % of users reactivated in the current time period
ARR Annual recurring revenue; it is the recurring revenue a company can expect in a year (annualized version of MRR i.e. Monthly recurring revenue)
B2B Business-to-business refers to a transaction or commercial business dealing between two companies
B2C Business-to-consumer (also known as Direct-to-consumer) refers to selling products and/or services directly to customerswho are the end-users
B2G Business-to-government, refers to the business relationship a company can have with a government institution
TaaS Transportation as a Service
SaaS Software as a service
Net Promoters Score Metric used in customer experience programs to measure the loyalty of customers for SWVL