q3 2017 operations report -...
TRANSCRIPT
| Q3 2017 OPERATIONS REPORT
ContentsHighlights & CEO Perspective 2
Key Modeling Stats 3
Overview & Outlook 4
Operational Excellence 8
STACK 10
Delaware Basin 14
Rockies 17
Cash Flow Generating Assets 19
Q3 2017 Operations ReportOctober 31, 2017
NYSE: DVN devonenergy.com

| Q3 2017 OPERATIONS REPORT
Highlights & CEO Perspective
2
Dave Hager
President & CEO
Q3 Highlights & Outlook
Production exceeds midpoint of hurricane-adjusted guidance
U.S. oil production on track to increase ~20% in Q4
Drill-bit momentum: 50 high-rate wells brought online in Q3
Capital spending 12% below budget YTD
Free cash flow increases cash balances to $2.8 billion
Asset Level Results
STACK production advances 26% YTD
Meramec pilot achieves average IP30 ~3,500 BOED per well
Multi-zone Showboat project in STACK underway
Multi-zone Delaware project delivers savings of $1MM per well
Jackfish complex exits Q3 24% above nameplate capacity
Portfolio & Resource Updates
Divestiture program advances with $420 million of asset sales
Johnson County divestiture package progressing
CEO Perspective
Devon’s “2020 Vision”
We recently unveiled our “2020 Vision,” which
is Devon’s strategic plan through the end of
the decade. The intent of our operating plan
is to deliver top-tier returns on invested
capital while delivering sustainable, long-term
growth for our business.
We plan to attain peer leading returns with our “2020 Vision” by
pursuing the following objectives:
1) Disciplined capital allocation that builds scale in the
STACK & Delaware Basin
2) Maximize returns by growing higher-value liquids production
and lowering expenses with a technology focus across all areas
of the business
3) Further high-grade portfolio with monetization of several
billion dollars of assets
4) Reduce debt balances (net debt to EBITDA target 1.0x – 1.5x)
5) Return cash to shareholders
For more commentary on our “2020 Vision,” I encourage every
investor to listen to our Q3 conference call where I will provide more
details on this differentiating plan.

| Q3 2017 OPERATIONS REPORT
Key Modeling Stats
3
Q3 RESULTS Q3 GUIDANCE Q3 ACTUALS
U.S. oil (MBbls/d) 107 - 112(1) 112
Canada oil (MBbls/d) 117 - 122 121
Total NGLs (MBbls/d) 91 - 96(1) 94
Total gas (MMcf/d) 1,173 - 1,205 1,201
Total (MBoe/d) 511 - 531(1) 527
Marketing & midstream operating profit $225 - $245 $242
Lease operating expenses $360 - $410 $391
General & administrative expenses $150 - $170 $153
Production and property taxes $65 - $75 $71
Depreciation, depletion & amortization $375 - $425 $400
Net financing costs $125 - $135 $127
Exploration & development capital $550 - $600 $548
(1) Adjusted for curtailments related to Hurricane Harvey (see Sept. 15th press release)
(2) Wells that achieved 1st production (not 30-day peak rates)
Q3 OPERATIONAL DETAIL STACK DELAWARE BASIN ROCKIES EAGLE FORD BARNETT HEAVY OIL
Oil (MBbl/d) 27 31 12 30 1 121
NGL (MBbl/d) 32 11 1 12 36 0
Gas (MMcf/d) 313 90 11 88 672 16
Total (MBoe/d) 111 57 16 57 148 124
Exploration & development capital $211 $129 $46 $29 $10 $78
Operated development rigs (9/30/17) 8 9 2 n/a 0
Operated spuds (Q3/YTD) 25/58 25/49 7/13 7/22 2/2
Operated wells tied-in (Q3/YTD) (2) 23/71 11/30 3/9 23/61 0/0
Note: all dollars shown in millions.
BARNETT
STACK
EAGLE FORD
DELAWARE BASIN
ROCKIES
HEAVY OIL
| Q3 2017 OPERATIONS REPORT
Overview & Outlook
4
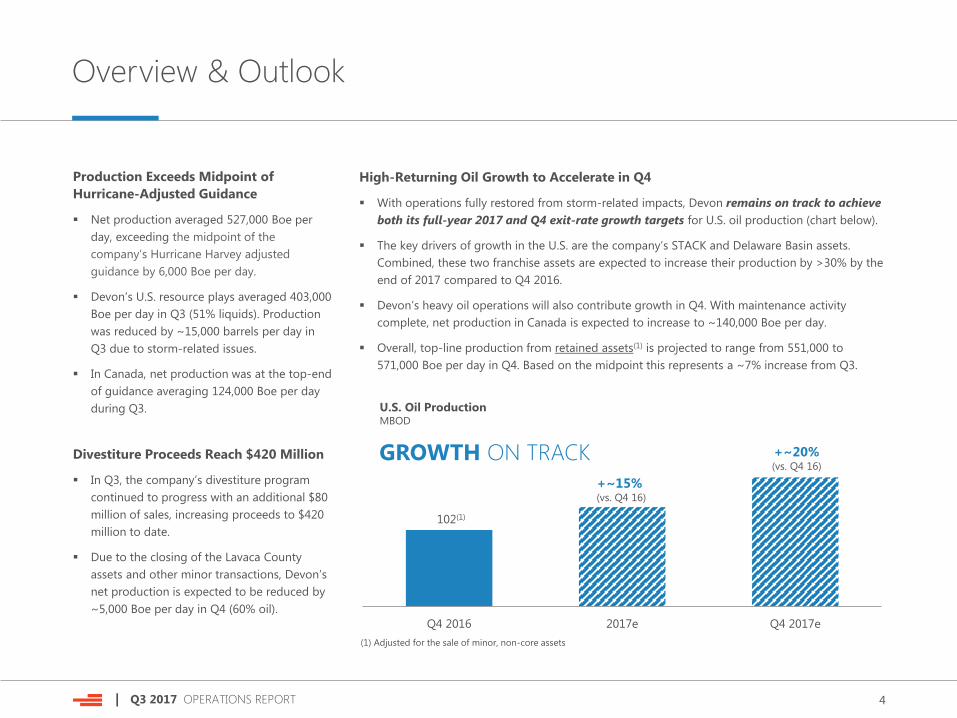
Production Exceeds Midpoint of
Hurricane-Adjusted Guidance
Net production averaged 527,000 Boe per
day, exceeding the midpoint of the
company’s Hurricane Harvey adjusted
guidance by 6,000 Boe per day.
Devon’s U.S. resource plays averaged 403,000
Boe per day in Q3 (51% liquids). Production
was reduced by ~15,000 barrels per day in
Q3 due to storm-related issues.
In Canada, net production was at the top-end
of guidance averaging 124,000 Boe per day
during Q3.
Divestiture Proceeds Reach $420 Million
In Q3, the company’s divestiture program
continued to progress with an additional $80
million of sales, increasing proceeds to $420
million to date.
Due to the closing of the Lavaca County
assets and other minor transactions, Devon’s
net production is expected to be reduced by
~5,000 Boe per day in Q4 (60% oil).
(1) Adjusted for the sale of minor, non-core assets
High-Returning Oil Growth to Accelerate in Q4
With operations fully restored from storm-related impacts, Devon remains on track to achieve
both its full-year 2017 and Q4 exit-rate growth targets for U.S. oil production (chart below).
The key drivers of growth in the U.S. are the company’s STACK and Delaware Basin assets.
Combined, these two franchise assets are expected to increase their production by >30% by the
end of 2017 compared to Q4 2016.
Devon’s heavy oil operations will also contribute growth in Q4. With maintenance activity
complete, net production in Canada is expected to increase to ~140,000 Boe per day.
Overall, top-line production from retained assets(1) is projected to range from 551,000 to
571,000 Boe per day in Q4. Based on the midpoint this represents a ~7% increase from Q3.
Q4 2016 2017e Q4 2017e
102(1)
+~15% (vs. Q4 16)
+~20%(vs. Q4 16)
GROWTH ON TRACK
U.S. Oil ProductionMBOD

| Q3 2017 OPERATIONS REPORT
Overview & Outlook
5
Capital Spending 12% Below Budget YTD
Devon’s E&P capital spending totaled $548 million in Q3, which was
below the low end of guidance for the 3rd consecutive quarter.
Year to date, E&P spending has been 12% below midpoint guidance or
65% of the company’s original 2017 budget.
In the upcoming quarter, Devon expects to run ~20 development rigs
across the U.S. along with 7 frac crews.
With this level of activity, the company plans to bring online ~60
operated wells and invest $650-$700 million of upstream capital in Q4.
For 2017, the company expects to invest $2.0 to $2.1 billion of E&P
capital. This level of investment is expected to be funded within
operating cash flow and EnLink distributions for the year.
This strong drill-bit productivity was highlighted by 14 new Meramec
wells in the over-pressured oil window that achieved average 30-day
rates of >2,300 Boe per day, of which ~55% was light oil production.
The top STACK wells in the quarter were associated with the Fleenor
pilot in Blaine County. The Fleenor wells averaged 30-day production
rates of ~3,500 Boe per day (see pg. 11).
The Delaware Basin also delivered several high-rate oil wells. This
activity was headlined by 4 Bone Spring wells around the state-line
area that attained 30-day rates of 1,750 Boe per day (~75% oil).
These strong wells in Q3 continue a trend of outstanding results. Over
the past year, Devon has the top well productivity of any U.S. operator,
exceeding the peer average by ~50%.
Drill-Bit Momentum: 50 High-Rate Wells Brought Online
During the quarter, Devon commenced production on 50 wells that
averaged initial 30-day IP rates of >2,100 Boe per day (~50% oil).
0
5
10
15
20
25
2016 20172016 2017
Rig Activity – U.S. Resource PlaysOperated Rigs
BY YEAR-END 2017
RIGS20
YEAR-END 2016
RIGS10
RIGS2Q3 2016
Q3 HIGH-RATE WELLS
50WELLS 2,100>
AVG. 30-DAY IP:
BOED

| Q3 2017 OPERATIONS REPORT
Overview & Outlook
6
Free Cash Flow Increases Cash Balances to $2.8 Billion
The company’s upstream operations generated free cash flow in Q3,
helping increase Devon’s cash balances by $400 million to $2.8 billion
at the end of September.
This is the 3rd straight quarter that the company has increased its cash
balance, representing a total cash build of ~$800 million year-to-
date.
In addition to strong liquidity, Devon possesses investment-grade credit
ratings and has no significant debt maturities until mid-2021.
Johnson County Divestiture Package Progressing
With $420 million of asset sales achieved to date, Devon’s divestiture
program is now expected to exceed its original target of $1 billion.
The most significant asset remaining within this divestiture program is
select leasehold within the Barnett Shale, primarily in Johnson County.
Data rooms for the Johnson County properties were opened at the end
of September and initial bids are expected during Q4. Production
associated with these assets is ~30,000 Boe per day (map below).
Hedging Position Bolsters Financial Strength
Devon’s financial strength is further bolstered by its hedge position,
with ~65% of its oil and gas production hedged for the remainder of
2017.
The company also is protecting its regional pricing through various
basis swaps in the Delaware Basin and Canada (see Q3 earnings release
pg. 16 for more hedging details).
For the first half of 2018, Devon has increased its hedge position to
~40% of estimated production and is actively accumulating additional
hedges for the upcoming 6 quarters.
This disciplined, risk-management program consists of systematic
hedges added on a quarterly basis and discretionary hedges that
supplement the systematic program when favorable market conditions
exist.
DATA ROOMS
NOW OPEN
INITIAL BIDS
EXPECTED Q4
BARNETT SHALE: JOHNSON COUNTY

| Q3 2017 OPERATIONS REPORT
Overview & Outlook
7
Preliminary 2018 Outlook Showcases Capital Efficiency
The capital program in 2018 is being designed to optimize returns, not
production growth. And while strong growth is expected from the
STACK and Delaware Basin assets, this growth will be an output of
Devon’s asset quality and strong execution.
While the company is still working through the budgeting process,
Devon’s high-returning E&P capital program in 2018 is expected to
range from $2.0 billion to $2.5 billion.
The 2018 program will represent a major inflection point for the
company due to a step-change improvement in capital efficiency
resulting from the shift to full-field development in the STACK and
Delaware Basin.
A key contributor to this capital efficiency is the company’s multi-zone
development approach. This leading-edge technique leverages
technology to more efficiently develop stacked pay in the STACK and
Delaware Basin (projected NPV uplift of >40%).
This high-returning capital program is expected to increase oil
production in the STACK and Delaware by >30% in 2018 and is
expected to drive per-unit costs lower throughout the year.
In the coming months, Devon will provide more detailed production
targets for 2018 once the company has better insight into planned
activity levels for its non-operated Eagle Ford asset.
| Q3 2017 OPERATIONS REPORT
Operational Excellence & Technology Leadership
8
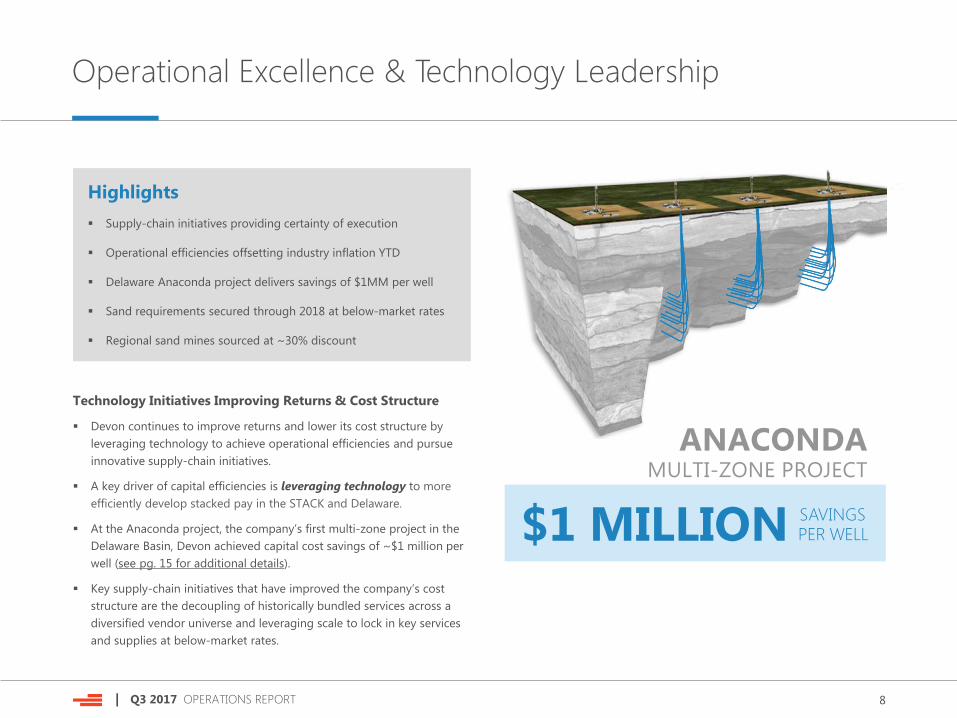
Technology Initiatives Improving Returns & Cost Structure
Devon continues to improve returns and lower its cost structure by
leveraging technology to achieve operational efficiencies and pursue
innovative supply-chain initiatives.
A key driver of capital efficiencies is leveraging technology to more
efficiently develop stacked pay in the STACK and Delaware.
At the Anaconda project, the company’s first multi-zone project in the
Delaware Basin, Devon achieved capital cost savings of ~$1 million per
well (see pg. 15 for additional details).
Key supply-chain initiatives that have improved the company’s cost
structure are the decoupling of historically bundled services across a
diversified vendor universe and leveraging scale to lock in key services
and supplies at below-market rates.
Highlights
Supply-chain initiatives providing certainty of execution
Operational efficiencies offsetting industry inflation YTD
Delaware Anaconda project delivers savings of $1MM per well
Sand requirements secured through 2018 at below-market rates
Regional sand mines sourced at ~30% discount
ANACONDAMULTI-ZONE PROJECT
SAVINGS$1 MILLION PER WELL

| Q3 2017 OPERATIONS REPORT
Operational Excellence & Technology Leadership
9
Regional Sand Mines Drive Substantial Cost Savings
To ensure certainty of execution, Devon recently locked in sand
requirements in the STACK and Delaware through 2018.
These contracts were secured at below-market rates, driven by sourcing
all finer-mesh sand requirements from regional sand mines in the
southern United States.
Due to lower transport costs, Devon estimates cost savings from
regionally sourced sand to be ~30% compared to equivalent grades
of Northern White sand, without any degradation in performance.
To further improve “final mile” logistics, the company has also secured
local transload capacity, providing additional storage and close
proximity to well sites.
Securing Water Requirements at Discounted Rates
Another initiative underway to assist future execution is the securing of
water requirements in the STACK. Devon recently reached an
agreement with a local utility to attain wastewater for operational use.
This innovative and environmentally friendly agreement provides a
long-term supply of low-cost water at purchase rates discounted as
high as 75% compared to the cost of traditional surface water.
The company also is well positioned in the Delaware, where it is the
largest water recycler in SE New Mexico. Additionally, Devon has access
to critical local infrastructure, providing a highly visible water supply for
its completion activity.
STACK
DELAWARE
HISTORICAL SOURCE
NORTHERN WHITE
NEW SOURCE
REGIONAL
Regional Sand Drives
30% SAVINGS
| Q3 2017 OPERATIONS REPORT
STACK
10
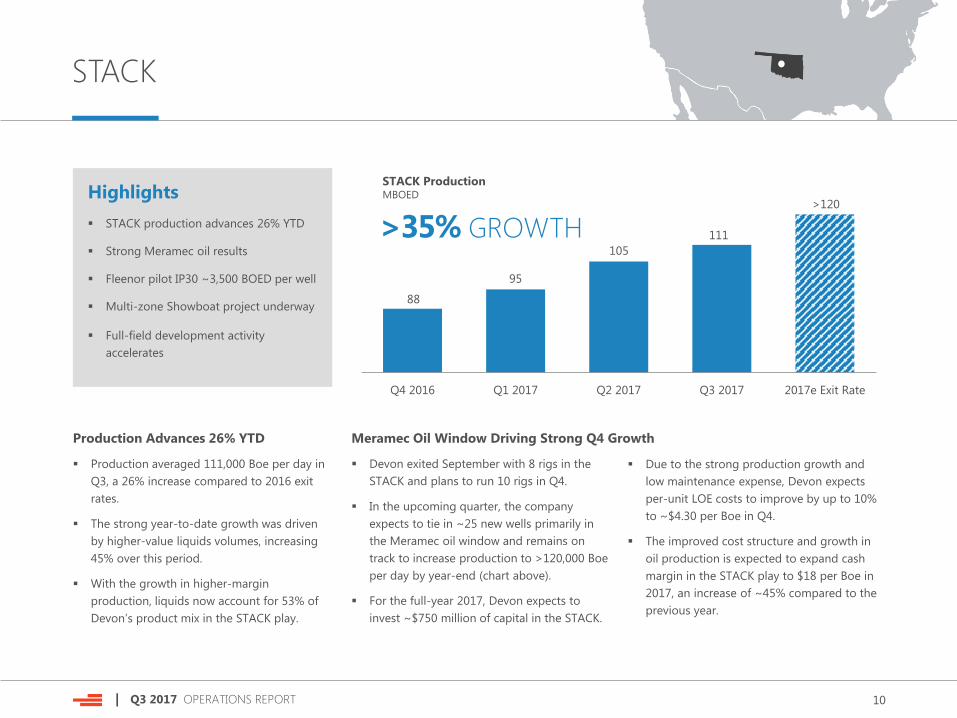
Highlights
STACK production advances 26% YTD
Strong Meramec oil results
Fleenor pilot IP30 ~3,500 BOED per well
Multi-zone Showboat project underway
Full-field development activity
accelerates
Production Advances 26% YTD
Production averaged 111,000 Boe per day in
Q3, a 26% increase compared to 2016 exit
rates.
The strong year-to-date growth was driven
by higher-value liquids volumes, increasing
45% over this period.
With the growth in higher-margin
production, liquids now account for 53% of
Devon’s product mix in the STACK play.
Devon exited September with 8 rigs in the
STACK and plans to run 10 rigs in Q4.
In the upcoming quarter, the company
expects to tie in ~25 new wells primarily in
the Meramec oil window and remains on
track to increase production to >120,000 Boe
per day by year-end (chart above).
For the full-year 2017, Devon expects to
invest ~$750 million of capital in the STACK.
88
95
105
111
>120
Q4 2016 Q1 2017 Q2 2017 Q3 2017 2017e Exit Rate
STACK ProductionMBOED
>35% GROWTH
Due to the strong production growth and
low maintenance expense, Devon expects
per-unit LOE costs to improve by up to 10%
to ~$4.30 per Boe in Q4.
The improved cost structure and growth in
oil production is expected to expand cash
margin in the STACK play to $18 per Boe in
2017, an increase of ~45% compared to the
previous year.
Meramec Oil Window Driving Strong Q4 Growth
| Q3 2017 OPERATIONS REPORT
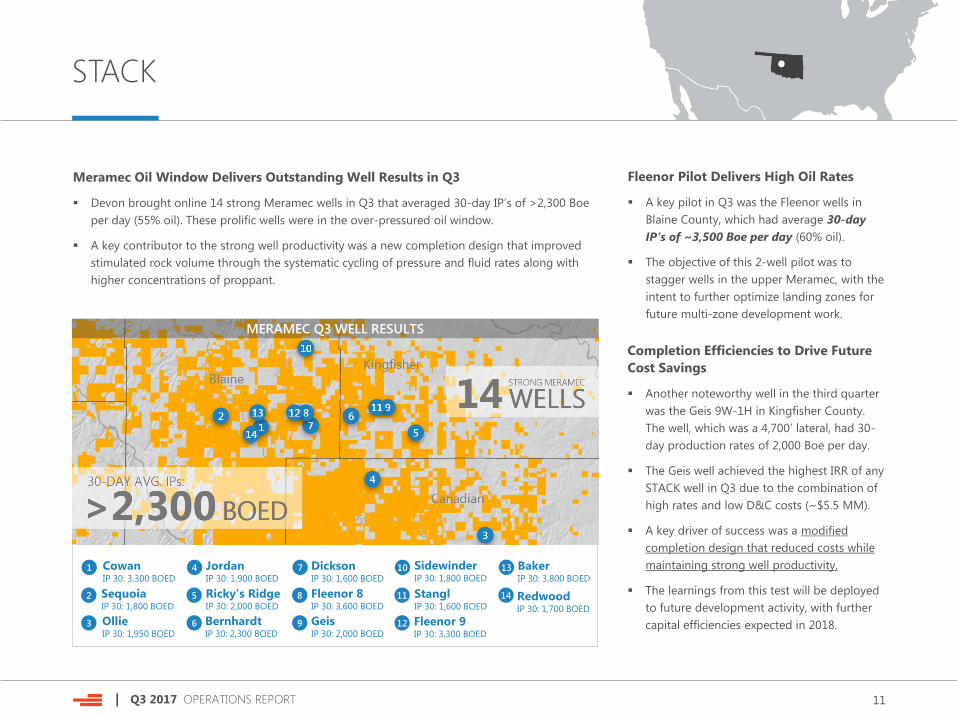
CowanIP 30: 3,300 BOED
SequoiaIP 30: 1,800 BOED
OllieIP 30: 1,950 BOED
JordanIP 30: 1,900 BOED
DicksonIP 30: 1,600 BOED
SidewinderIP 30: 1,800 BOED
BakerIP 30: 3,800 BOED
Ricky’s RidgeIP 30: 2,000 BOED
Fleenor 8IP 30: 3,600 BOED
BernhardtIP 30: 2,300 BOED
GeisIP 30: 2,000 BOED
StanglIP 30: 1,600 BOED
RedwoodIP 30: 1,700 BOED
Fleenor 9IP 30: 3,300 BOED
1
2
3
4
5
6
7
8
9
10
11
12
13
14
STACK
11
Meramec Oil Window Delivers Outstanding Well Results in Q3
Devon brought online 14 strong Meramec wells in Q3 that averaged 30-day IP’s of >2,300 Boe
per day (55% oil). These prolific wells were in the over-pressured oil window.
A key contributor to the strong well productivity was a new completion design that improved
stimulated rock volume through the systematic cycling of pressure and fluid rates along with
higher concentrations of proppant.
Fleenor Pilot Delivers High Oil Rates
A key pilot in Q3 was the Fleenor wells in
Blaine County, which had average 30-day
IP’s of ~3,500 Boe per day (60% oil).
The objective of this 2-well pilot was to
stagger wells in the upper Meramec, with the
intent to further optimize landing zones for
future multi-zone development work.
Completion Efficiencies to Drive Future
Cost Savings
Another noteworthy well in the third quarter
was the Geis 9W-1H in Kingfisher County.
The well, which was a 4,700’ lateral, had 30-
day production rates of 2,000 Boe per day.
The Geis well achieved the highest IRR of any
STACK well in Q3 due to the combination of
high rates and low D&C costs (~$5.5 MM).
A key driver of success was a modified
completion design that reduced costs while
maintaining strong well productivity.
The learnings from this test will be deployed
to future development activity, with further
capital efficiencies expected in 2018.
MERAMEC Q3 WELL RESULTS
| Q3 2017 OPERATIONS REPORT
STACK
12
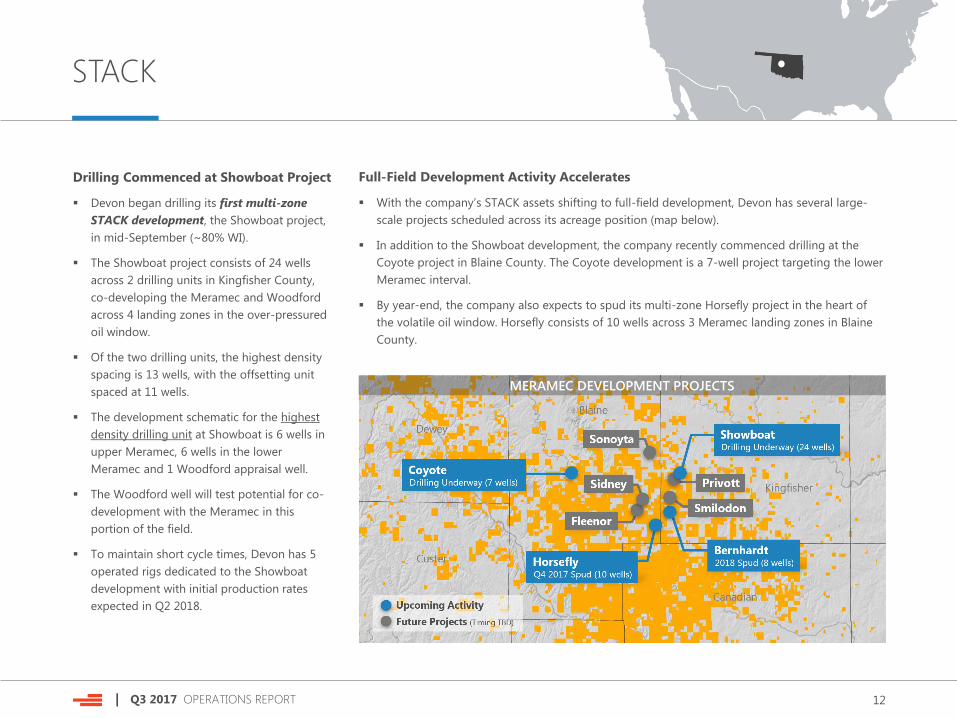
Drilling Commenced at Showboat Project
Devon began drilling its first multi-zone
STACK development, the Showboat project,
in mid-September (~80% WI).
The Showboat project consists of 24 wells
across 2 drilling units in Kingfisher County,
co-developing the Meramec and Woodford
across 4 landing zones in the over-pressured
oil window.
Of the two drilling units, the highest density
spacing is 13 wells, with the offsetting unit
spaced at 11 wells.
The development schematic for the highest
density drilling unit at Showboat is 6 wells in
upper Meramec, 6 wells in the lower
Meramec and 1 Woodford appraisal well.
The Woodford well will test potential for co-
development with the Meramec in this
portion of the field.
To maintain short cycle times, Devon has 5
operated rigs dedicated to the Showboat
development with initial production rates
expected in Q2 2018.
Full-Field Development Activity Accelerates
With the company’s STACK assets shifting to full-field development, Devon has several large-
scale projects scheduled across its acreage position (map below).
In addition to the Showboat development, the company recently commenced drilling at the
Coyote project in Blaine County. The Coyote development is a 7-well project targeting the lower
Meramec interval.
By year-end, the company also expects to spud its multi-zone Horsefly project in the heart of
the volatile oil window. Horsefly consists of 10 wells across 3 Meramec landing zones in Blaine
County.
MERAMEC DEVELOPMENT PROJECTS
| Q3 2017 OPERATIONS REPORT
0
40
80
120
160
DVN
MRO
XEC CLR
NFX
ALTM
ES GST
CARR
STACK
13
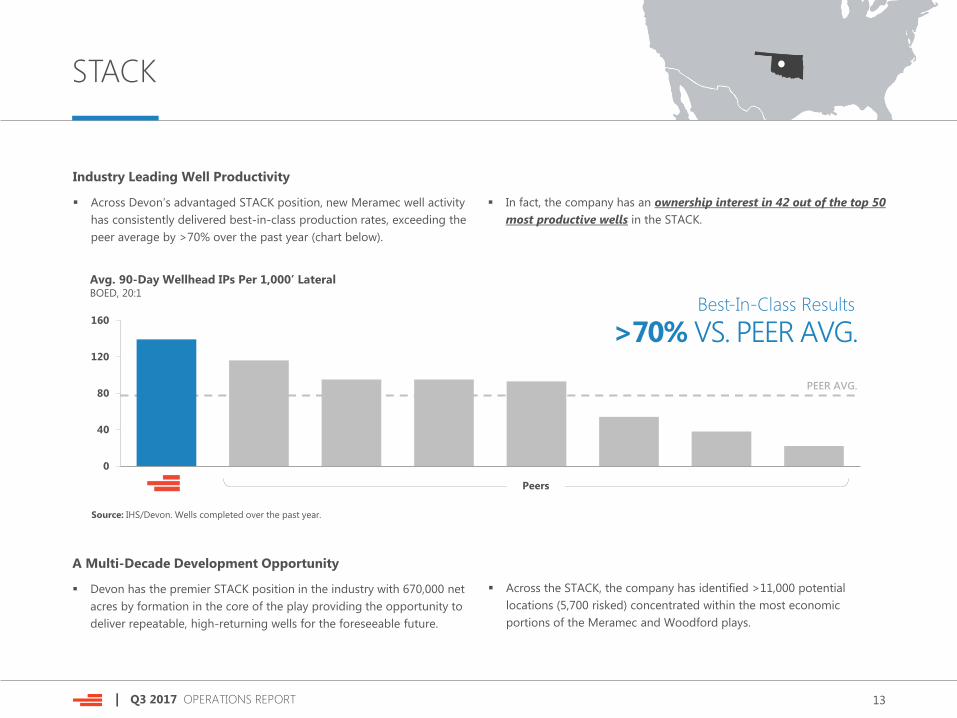
Industry Leading Well Productivity
Across Devon’s advantaged STACK position, new Meramec well activity
has consistently delivered best-in-class production rates, exceeding the
peer average by >70% over the past year (chart below).
In fact, the company has an ownership interest in 42 out of the top 50
most productive wells in the STACK.
Avg. 90-Day Wellhead IPs Per 1,000’ LateralBOED, 20:1
Source: IHS/Devon. Wells completed over the past year.
Peers
Best-In-Class Results
>70% VS. PEER AVG.
PEER AVG.
A Multi-Decade Development Opportunity
Devon has the premier STACK position in the industry with 670,000 net
acres by formation in the core of the play providing the opportunity to
deliver repeatable, high-returning wells for the foreseeable future.
Across the STACK, the company has identified >11,000 potential
locations (5,700 risked) concentrated within the most economic
portions of the Meramec and Woodford plays.

| Q3 2017 OPERATIONS REPORT
Delaware Basin
14
Highlights
Building momentum with ~40 spuds
Bone Spring potential showcased with
high-rate wells
Cost savings reach $1 million per well at
Anaconda project
High-return, multi-zone development
work accelerates
Building Momentum with ~40 Spuds
Net production increased to 57,000 Boe per
day in Q3 with liquids accounting for 74%.
During the quarter, the company increased
rig activity to 9 operated rigs and has now
spud ~40 operated wells since July.
Due to timing of well tie-ins, only 6 of these
wells achieved peak 30-day production rates
during Q3.
Production is expected to accelerate in Q4
with the addition of a 2nd frac crew.
New well activity in Q3 was highlighted by 4 outstanding Bone Spring wells near the NM state
line that attained 30-day rates of 1,750 Boe per day (~75% oil).
With the high oil rates and low average well cost of ~$5.5 million, these Bone Spring wells are
some of the highest rate-of-return wells drilled to date in the play.
Devon has a massive Bone Spring opportunity set with >3,000 risked locations across up to 5
different landing zones. Adding up the Bone Spring acreage by target landing zone, Devon has
exposure to 530,000 net effective acres in the play (~1.5 BBOE of unrisked resource potential).
Prolific Bone Spring Wells Showcase Massive State-Line Potential
DELAWARE BASIN DEVELOPMENT ACTIVITY
| Q3 2017 OPERATIONS REPORT
Delaware Basin
15
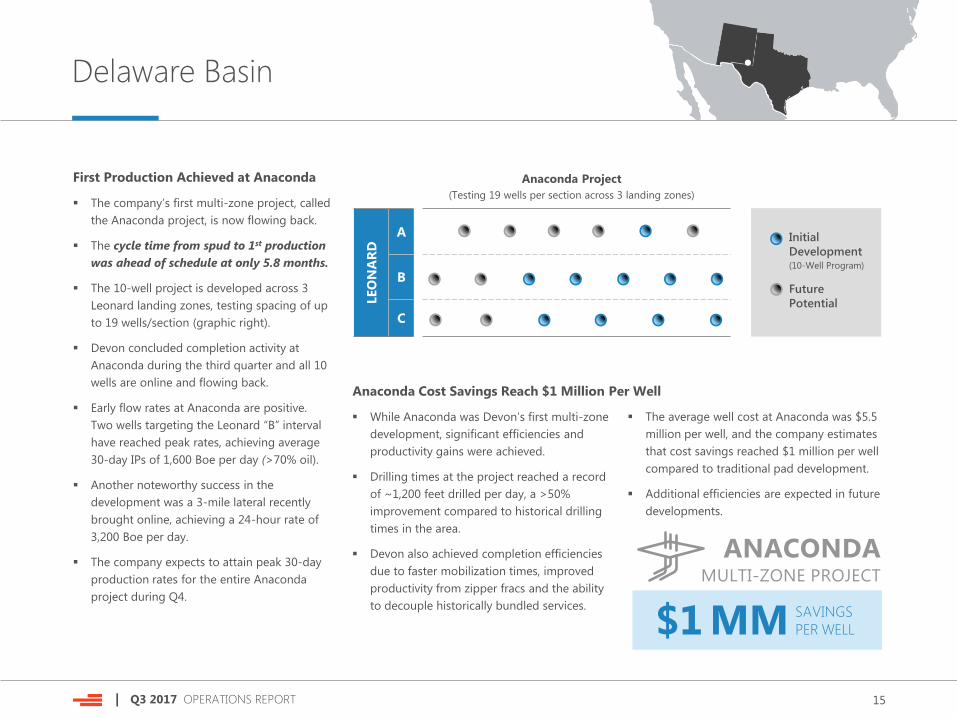
First Production Achieved at Anaconda
The company’s first multi-zone project, called
the Anaconda project, is now flowing back.
The cycle time from spud to 1st production
was ahead of schedule at only 5.8 months.
The 10-well project is developed across 3
Leonard landing zones, testing spacing of up
to 19 wells/section (graphic right).
Devon concluded completion activity at
Anaconda during the third quarter and all 10
wells are online and flowing back.
Early flow rates at Anaconda are positive.
Two wells targeting the Leonard “B” interval
have reached peak rates, achieving average
30-day IPs of 1,600 Boe per day (>70% oil).
Another noteworthy success in the
development was a 3-mile lateral recently
brought online, achieving a 24-hour rate of
3,200 Boe per day.
The company expects to attain peak 30-day
production rates for the entire Anaconda
project during Q4.
While Anaconda was Devon’s first multi-zone
development, significant efficiencies and
productivity gains were achieved.
Drilling times at the project reached a record
of ~1,200 feet drilled per day, a >50%
improvement compared to historical drilling
times in the area.
Devon also achieved completion efficiencies
due to faster mobilization times, improved
productivity from zipper fracs and the ability
to decouple historically bundled services.
The average well cost at Anaconda was $5.5
million per well, and the company estimates
that cost savings reached $1 million per well
compared to traditional pad development.
Additional efficiencies are expected in future
developments.
Anaconda Cost Savings Reach $1 Million Per Well
ANACONDAMULTI-ZONE PROJECT
$1 MM SAVINGS
PER WELL
Anaconda Project
(Testing 19 wells per section across 3 landing zones)
LEO
NA
RD
A
B
C
Initial
Development(10-Well Program)
Future
Potential
| Q3 2017 OPERATIONS REPORT
Delaware Basin
16
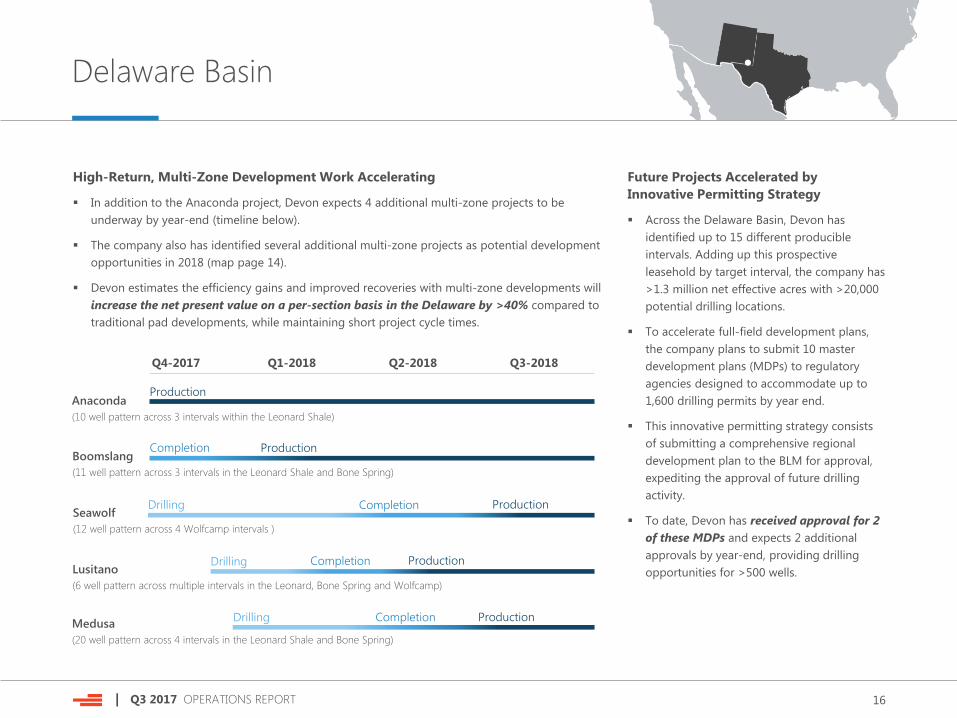
High-Return, Multi-Zone Development Work Accelerating
In addition to the Anaconda project, Devon expects 4 additional multi-zone projects to be
underway by year-end (timeline below).
The company also has identified several additional multi-zone projects as potential development
opportunities in 2018 (map page 14).
Devon estimates the efficiency gains and improved recoveries with multi-zone developments will
increase the net present value on a per-section basis in the Delaware by >40% compared to
traditional pad developments, while maintaining short project cycle times.
Future Projects Accelerated by
Innovative Permitting Strategy
Across the Delaware Basin, Devon has
identified up to 15 different producible
intervals. Adding up this prospective
leasehold by target interval, the company has
>1.3 million net effective acres with >20,000
potential drilling locations.
To accelerate full-field development plans,
the company plans to submit 10 master
development plans (MDPs) to regulatory
agencies designed to accommodate up to
1,600 drilling permits by year end.
This innovative permitting strategy consists
of submitting a comprehensive regional
development plan to the BLM for approval,
expediting the approval of future drilling
activity.
To date, Devon has received approval for 2
of these MDPs and expects 2 additional
approvals by year-end, providing drilling
opportunities for >500 wells.
Q4-2017 Q1-2018 Q2-2018 Q3-2018
Boomslang
(11 well pattern across 3 intervals in the Leonard Shale and Bone Spring)
Drilling Completion Production
Drilling Completion Production
Anaconda
(10 well pattern across 3 intervals within the Leonard Shale)
Drilling CompletionMedusa
(20 well pattern across 4 intervals in the Leonard Shale and Bone Spring)
Completion Production
Production
Seawolf
(12 well pattern across 4 Wolfcamp intervals )
Lusitano
(6 well pattern across multiple intervals in the Leonard, Bone Spring and Wolfcamp)
Production

| Q3 2017 OPERATIONS REPORT
Rockies
17
Highlights
YTD wells achieve IP30 >1,800 BOED (1)
Teapot activity delivers high oil rates )
Initial “Super Mario” Turner results
expected in Q4
Appraisal Program Achieving
Outstanding Results YTD
Net production was 16,000 Boe per day in
Q3 (80% oil). Planned maintenance at
Devon’s CO2 facilities impacted production
by ~1,000 barrels per day during the quarter.
Year to date, Devon has brought online 9
wells targeting the Parkman and Teapot
formations. Normalized for 10,000’ laterals,
30-day rates averaged >1,800 Boe per day
(95% oil).
In the third quarter, 3 low-cost Teapot wells
were tied in ($5 MM per well), with 30-day
rates averaging ~1,200 barrels of oil per day.
POWDER RIVER BASIN ACTIVITY
(1) All activity normalized for 10,000’ laterals
| Q3 2017 OPERATIONS REPORT
Rockies
18
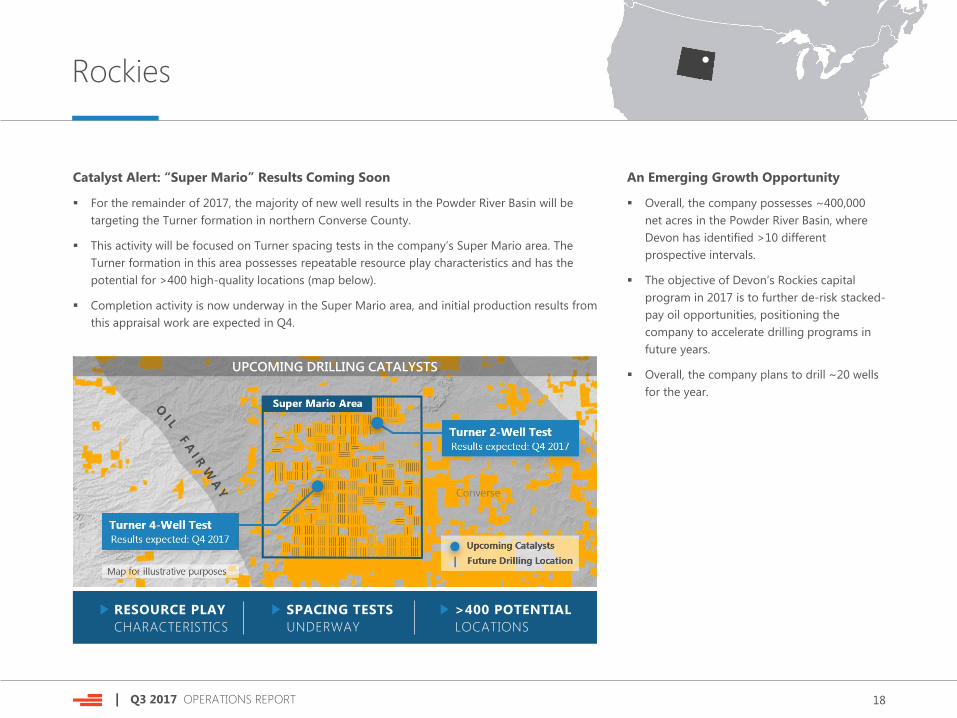
Catalyst Alert: “Super Mario” Results Coming Soon
For the remainder of 2017, the majority of new well results in the Powder River Basin will be
targeting the Turner formation in northern Converse County.
This activity will be focused on Turner spacing tests in the company’s Super Mario area. The
Turner formation in this area possesses repeatable resource play characteristics and has the
potential for >400 high-quality locations (map below).
Completion activity is now underway in the Super Mario area, and initial production results from
this appraisal work are expected in Q4.
An Emerging Growth Opportunity
Overall, the company possesses ~400,000
net acres in the Powder River Basin, where
Devon has identified >10 different
prospective intervals.
The objective of Devon’s Rockies capital
program in 2017 is to further de-risk stacked-
pay oil opportunities, positioning the
company to accelerate drilling programs in
future years.
Overall, the company plans to drill ~20 wells
for the year.
RESOURCE PLAY
CHARACTERISTICS
SPACING TESTS
UNDERWAY
>400 POTENTIAL
LOCATIONS
UPCOMING DRILLING CATALYSTS

| Q3 2017 OPERATIONS REPORT
Cash Flow Generating Assets
19
Summary
Devon possesses top-tier cash flow generating assets in North
America (see graphic) and the company’s strategy with these assets
is two-fold:
1) To efficiently manage base production and maintain a low
cost structure.
2) Redeploy harvested cash flow into STACK and
Delaware Basin growth opportunities.
These high-quality assets are on pace to cumulatively generate
~$2.2 billion of cash flow in 2017.
The upstream capital requirement to deliver this cash flow in
2017 is ~$450 million.
HEAVY OIL
BARNETT
EAGLE FORD
30%EAGLE FORD
20%BARNETT
15%ENLINK
~$2.2B(1)
CASH FLOW
2017e
35%HEAVY OIL
(1) Represents field-level cash flow before G&A and taxes.
| Q3 2017 OPERATIONS REPORT
Cash Flow Generating Assets
Eagle Ford
Record Development Wells Brought Online
Net production averaged 57,000 Boe per day in the quarter. Production
was curtailed over a 3-week period in Q3 by the effects of Hurricane
Harvey. All pads are now back online, producing at pre-storm levels.
Devon delivered strong drill-bit results in the quarter by bringing online
23 new wells to production in Q3. Of these wells, 17 achieved peak 30-
day IP’s, averaging ~2,800 Boe per day per well.
These outstanding wells leveraged Devon’s new staggered
development scheme in the Lower Eagle Ford interval and deployed a
larger, enhanced completion design.
Devon’s Eagle Ford production in Q4 will be impacted by the sale of its
Lavaca County assets that closed at the end of September. This sale will
reduce Eagle Ford volumes by ~3,000 Boe per day in Q4.
20
Heavy Oil
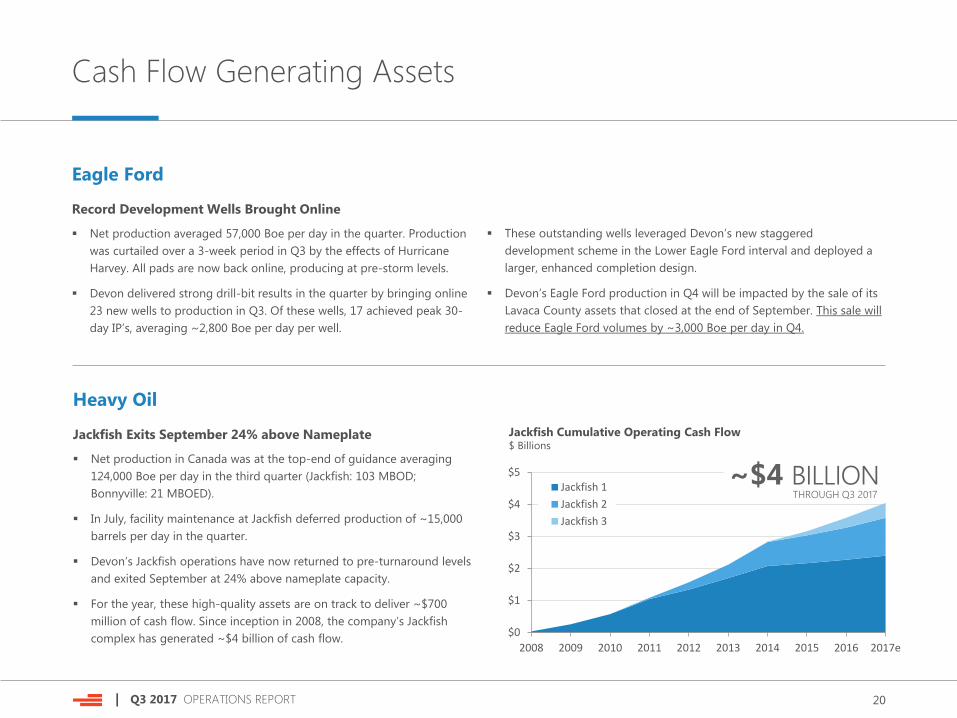
Jackfish Exits September 24% above Nameplate
Net production in Canada was at the top-end of guidance averaging
124,000 Boe per day in the third quarter (Jackfish: 103 MBOD;
Bonnyville: 21 MBOED).
In July, facility maintenance at Jackfish deferred production of ~15,000
barrels per day in the quarter.
Devon’s Jackfish operations have now returned to pre-turnaround levels
and exited September at 24% above nameplate capacity.
For the year, these high-quality assets are on track to deliver ~$700
million of cash flow. Since inception in 2008, the company’s Jackfish
complex has generated ~$4 billion of cash flow. $0
$1
$2
$3
$4
$5
2008 2009 2010 2011 2012 2013 2014 2015 2016 2017e
Jackfish 1
Jackfish 2
Jackfish 3
Jackfish Cumulative Operating Cash Flow$ Billions
~$4 BILLION THROUGH Q3 2017

| Q3 2017 OPERATIONS REPORT
Cash Flow Generating Assets
Barnett Shale
Net production in the Barnett Shale averaged 148,000 Boe per day or
0.9 Bcfe per day.
Due to the impact of Hurricane Harvey, Devon temporarily rejected
ethane in Q3 due to limitations in downstream fractionation capacity
and end-user demand across the Gulf Coast region.
The ethane rejection had a minor impact in Q3 and cash flow in the
Barnett was largely unaffected by these actions.
21
EnLink Midstream
Devon’s Ownership Valued at $3.4 Billion
Devon’s midstream business generated $242 million of operating profit in Q3. On a year-to-date
basis, this stable source of profitability has expanded by 9%.
The company owns 115 million units in EnLink’s general partner (ENLC) and 95 million units in the
limited partner (ENLK) (table right). In aggregate, Devon’s ownership in EnLink is valued at $3.4
billion and will generate cash distributions of $270 million in 2017.
While financial reporting rules require EnLink to be consolidated into the company’s financial
statements, it is important to note that EnLink’s $3.5 billion of debt is non-recourse to Devon.
DEVON’S OWNERSHIP
MARKET VALUE
($B)
ENLC (115 MM Units) $1.9
ENLK (95 MM Units) $1.5
DVN’s Ownership $3.4
As of October 2017

| Q3 2017 OPERATIONS REPORT
Contacts & Investor Notices
22
Investor Relations Contacts
Scott Coody Chris Carr
VP, Investor Relations Supervisor, Investor Relations
405-552-4735 405-228-2496
Email: [email protected]
Forward-Looking Statements
This presentation includes "forward-looking statements" as defined by the Securities and Exchange Commission
(the “SEC”). Such statements include those concerning strategic plans, expectations and objectives for future
operations, and are often identified by use of the words “expects,” “believes,” “will,” “would,” “could,” “forecasts,”
“projections,” “estimates,” “plans,” “expectations,” “targets,” “opportunities,” “potential,” “anticipates,” “outlook”
and other similar terminology. All statements, other than statements of historical facts, included in this
presentation that address activities, events or developments that the Company expects, believes or anticipates will
or may occur in the future are forward-looking statements. Such statements are subject to a number of
assumptions, risks and uncertainties, many of which are beyond the control of the Company. Statements
regarding our business and operations are subject to all of the risks and uncertainties normally incident to the
exploration for and development and production of oil and gas. These risks include, but are not limited to: the
volatility of oil, gas and NGL prices; uncertainties inherent in estimating oil, gas and NGL reserves; the extent to
which we are successful in acquiring and discovering additional reserves; the uncertainties, costs and risks
involved in exploration and development activities; risks related to our hedging activities; counterparty credit
risks; regulatory restrictions, compliance costs and other risks relating to governmental regulation, including with
respect to environmental matters; risks relating to our indebtedness; our ability to successfully complete mergers,
acquisitions and divestitures; the extent to which insurance covers any losses we may experience; our limited
control over third parties who operate our oil and gas properties; midstream capacity constraints and potential
interruptions in production; competition for leases, materials, people and capital; cyberattacks targeting our
systems and infrastructure; and any of the other risks and uncertainties identified in our Form 10-K and our other
filings with the SEC. Investors are cautioned that any such statements are not guarantees of future performance
and that actual results or developments may differ materially from those projected in the forward-looking
Investor Notices
statements. The forward-looking statements in this presentation are made as of the date of this presentation,
even if subsequently made available by Devon on its website or otherwise. Devon does not undertake any
obligation to update the forward-looking statements as a result of new information, future events or otherwise.
Use of Non-GAAP Information
This presentation may include non-GAAP financial measures. Such non-GAAP measures are not alternatives to
GAAP measures, and you should not consider these non-GAAP measures in isolation or as a substitute for analysis
of our results as reported under GAAP. For additional disclosure regarding such non-GAAP measures, including
reconciliations to their most directly comparable GAAP measure, please refer to Devon’s third-quarter 2017
earnings release at www.devonenergy.com.
Cautionary Note to Investors
The SEC permits oil and gas companies, in their filings with the SEC, to disclose only proved, probable and
possible reserves that meet the SEC's definitions for such terms, and price and cost sensitivities for such reserves,
and prohibits disclosure of resources that do not constitute such reserves. This release may contain certain terms,
such as resource potential, potential locations, risked and unrisked locations, estimated ultimate recovery (EUR),
exploration target size and other similar terms. These estimates are by their nature more speculative than
estimates of proved, probable and possible reserves and accordingly are subject to substantially greater risk of
being actually realized. The SEC guidelines strictly prohibit us from including these estimates in filings with the
SEC. Investors are urged to consider closely the disclosure in our Form 10-K, available at www.devonenergy.com.
You can also obtain this form from the SEC by calling 1-800-SEC-0330 or from the SEC’s website at www.sec.gov.