q3 2017 financial results - axalta coating systems axalta corporate … · · 2018-03-21net...
TRANSCRIPT

October 26, 2017
Q3 2017 Financial Results

2PROPRIETARY
Legal Notices
Forward-Looking StatementsThis presentation and the oral remarks made in connection herewith may contain “forward-looking statements” within the meaning of the U.S. Private Securities Litigation Reform Act of 1995,including those relating to 2017 financial projections, including net sales excluding FX, Adjusted EBITDA, interest expense, tax rate, as adjusted, free cash flow, capital expenditures, depreciation andamortization, diluted shares outstanding, cost savings, contributions from acquisitions, raw material cost increases, working capital improvement, and related assumptions. Any forward-lookingstatements involve risks, uncertainties and assumptions. These statements often include words such as “believe,” “expect,” “anticipate,” “intend,” “plan,” “estimate,” “target,” “project,” “forecast,”“seek,” “will,” “may,” “should,” “could,” “would,” or similar expressions. These statements are based on certain assumptions that we have made in light of our experience in the industry and ourperceptions of historical trends, current conditions, expected future developments and other factors we believe are appropriate under the circumstances as of the date hereof. Although we believe thatthe assumptions and analysis underlying these statements are reasonable as of the date hereof, investors are cautioned not to place undue reliance on these statements. We do not have anyobligation to and do not intend to update any forward-looking statements included herein, which speak only as of the date hereof. You should understand that these statements are not guarantees offuture performance or results. Actual results could differ materially from those described in any forward-looking statements contained herein or the oral remarks made in connection herewith as aresult of a variety of factors, including known and unknown risks and uncertainties, many of which are beyond our control including, but not limited to, the risks and uncertainties described in "Non-GAAP Financial Measures," and "Forward-Looking Statements" as well as "Risk Factors" in our Annual Report on Form 10-K for the year ended December 31, 2016 and our Quarterly Report on Form10-Q for the quarters ended March 31, 2017 and June 30, 2017.
Non-GAAP Financial MeasuresThe historical financial information included in this presentation includes financial information that is not presented in accordance with generally accepted accounting principles in the United States(“GAAP”), including net sales excluding FX, Adjusted Net Income, EBITDA, Adjusted EBITDA, Free Cash Flow, tax rate, as adjusted, and Net Debt. Management uses these non-GAAP financialmeasures in the analysis of our financial and operating performance because they assist in the evaluation of underlying trends in our business. Adjusted EBITDA consists of EBITDA adjusted for (i)non-operating income or expense, (ii) the impact of certain non-cash, nonrecurring or other items that are included in net income and EBITDA that we do not consider indicative of our ongoingperformance and (iii) certain unusual or nonrecurring items impacting results in a particular period. We believe that making such adjustments provides investors meaningful information to understandour operating results and ability to analyze financial and business trends on a period-to-period basis. Adjusted Net Income shows the adjusted value of Net Income attributable to controlling interestsafter removing the items that are determined by management to be unusual or nonrecurring in nature or items that we do not consider indicative of our ongoing operating performance. Our use of theterms net sales excluding FX, Adjusted Net Income, EBITDA, Adjusted EBITDA, Free Cash Flow, tax rate, as adjusted, and Net Debt may differ from that of others in our industry. Net sales excludingFX, Adjusted Net Income, EBITDA, Adjusted EBITDA and Free Cash Flow should not be considered as alternatives to net sales, net income, operating income or any other performance measuresderived in accordance with GAAP as measures of operating performance or operating cash flows or as measures of liquidity. Net sales excluding FX, Adjusted Net Income, EBITDA, AdjustedEBITDA, Free Cash Flow, tax rate, as adjusted, and Net Debt have important limitations as analytical tools and should be considered in conjunction with, and not as substitutes for, our results asreported under GAAP. This presentation includes a reconciliation of certain non-GAAP financial measures with the most directly comparable financial measures calculated in accordance with GAAP.Axalta does not provide a reconciliation for non-GAAP estimates for net sales excluding FX, Adjusted Net Income, EBITDA, Adjusted EBITDA, Free Cash Flow or tax rate, as adjusted, as-reported ona forward-looking basis because the information necessary to calculate a meaningful or accurate estimation of reconciling items is not available without unreasonable effort. For example, suchreconciling items include the impact of foreign currency exchange gains or losses, gains or losses that are unusual or nonrecurring in nature, as well as discrete taxable events. We cannot estimate orproject those items and they may have a substantial and unpredictable impact on our US GAAP results.
Segment Financial MeasuresThe primary measure of segment operating performance is Adjusted EBITDA, which is a key metric that is used by management to evaluate business performance in comparison to budgets,forecasts and prior year financial results, providing a measure that management believes reflects Axalta’s core operating performance. As we do not measure segment operating performance basedon Net Income, a reconciliation of this non-GAAP financial measure with the most directly comparable financial measure calculated in accordance with GAAP is not available.
Defined TermsAll capitalized terms contained within this presentation have been previously defined in our filings with the United States Securities and Exchange Commission.

3PROPRIETARY
Q3 2017 Highlights
Net sales and Adjusted EBITDA results Net sales of $1,091.8 million; acquisition growth of 9.7% versus Q3 2016
Net income (attributable to Axalta) of $54.9 million versus $6.6 million loss in Q3 2016; Adjusted net income of $65.0 million versus $81.6 million in Q3 2016
Adjusted EBITDA of $209.5 million versus $230.4 million in Q3 2016
Balance sheet & cash flow progress Operating cash flow of $212.3 million and free cash flow of $182.5 million in Q3 versus $145.3
million and $114.8 million, respectively, in the same quarter last year
Net debt slightly reduced with stronger cash generation in Q3
Capital deployment activities Acquired Plascoat Systems Limited (U.K.)
Wood coatings integration on plan and business performing well
Repurchased $50.1 million in Axalta stock at average price of $29.05
Operating highlights Axalta Way savings on track for year
Completed organizational realignment for Americas; announced global head of Refinish
Multiple new product launches in Industrial; Syrox refinish product line launch in China

4PROPRIETARY
Q3 Consolidated Results
Financial Performance Commentary
Net Sales Variance
$1,021
Price Acq. Q3 2017
$1,092
FXQ3 2016 Volume
Net sales growth driven by acquisitions Acquisitions provided +9.7% growth in
Performance Coatings, mainly in North America and EMEA
Net sales pressured by lower volumes in North America and Latin America Refinish, partially offset by solid growth in Industrial and Commercial Vehicle end-markets
Reduced average pricing in Light Vehicle and Industrial, partially offset by increased Refinish average price
1.9% favorable currency impact driven by stronger Euro; an inflection point following 2+ years of currency headwinds
(3.9%) (0.7%) +1.9% +9.7% +7.0%
($ in millions) 2017 2016 Incl. F/X Excl. F/X
Performance 694 617 12.5% 10.4%
Transportation 398 404 (1.4%) (2.8%)
Net Sales 1,092 1,021 7.0% 5.1%
Net Income (Loss) (1) 55 (7)
Adjusted EBITDA 210 230 (9.1%)(1) Represents Net Income (Loss) attributable to controlling interests
Q3 % Change
5PROPRIETARY
Q3 Performance Coatings Results
Financial Performance Commentary
Net Sales Variance
$694
$617
Q3 2017Acq.FXVolumeQ3 2016 Price
(6.6%) +0.9% +2.1% +12.5%+16.1%
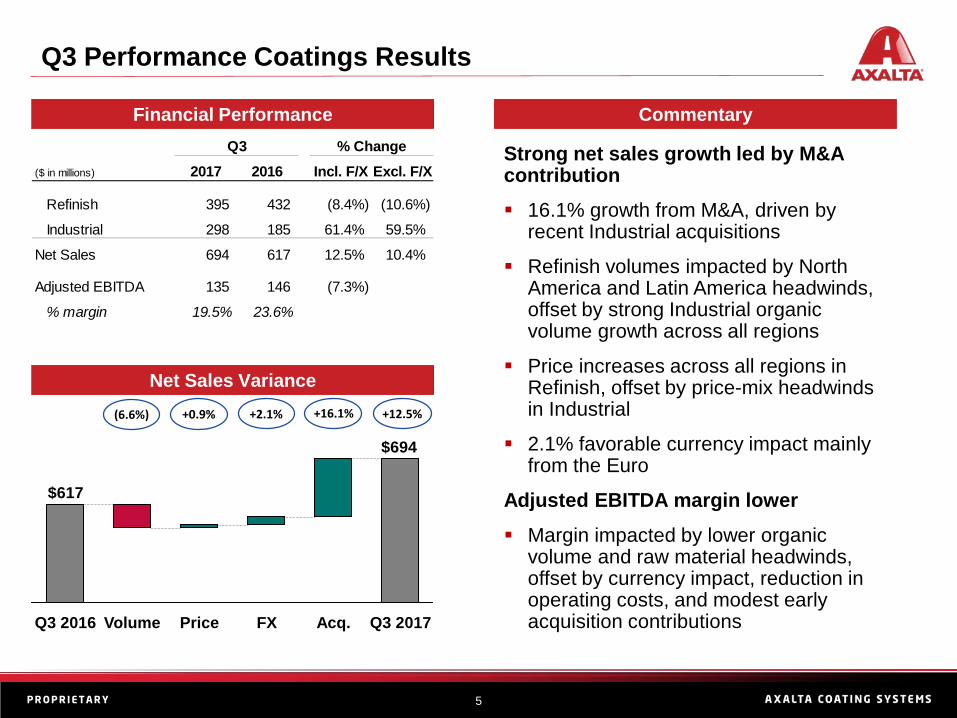
Strong net sales growth led by M&A contribution 16.1% growth from M&A, driven by
recent Industrial acquisitions
Refinish volumes impacted by North America and Latin America headwinds, offset by strong Industrial organic volume growth across all regions
Price increases across all regions in Refinish, offset by price-mix headwinds in Industrial
2.1% favorable currency impact mainly from the Euro
Adjusted EBITDA margin lower Margin impacted by lower organic
volume and raw material headwinds, offset by currency impact, reduction in operating costs, and modest early acquisition contributions
Q3($ in millions) 2017 2016 Incl. F/X Excl. F/X
Refinish 395 432 (8.4%) (10.6%)
Industrial 298 185 61.4% 59.5%
Net Sales 694 617 12.5% 10.4%
Adjusted EBITDA 135 146 (7.3%)
% margin 19.5% 23.6%
% Change

6PROPRIETARY
Q3 Transportation Coatings Results
Financial Performance Commentary
Net Sales Variance
Net sales led by Commercial Vehicle Solid Light Vehicle volume growth in
Latin America, offset by North America volume reduction; Commercial Vehicle growth led by North America and Asia Pacific
Lower average pricing in Light Vehicle reflecting previous concessions
1.4% favorable currency impact mainly from the Euro
Adjusted EBITDA margin lower Margin impact from lower average
selling prices and raw material headwinds, partially offset by reduction in operating costs
$398 $404
Acq.Price Q3 2017Q3 2016 FXVolume
+0.2% (3.0%) +1.4% +0.0% (1.4%)
($ in millions) 2017 2016 Incl. F/X Excl. F/X
Light Vehicle 310 321 (3.6%) (4.9%)
Commercial Vehicle 89 83 6.7% 5.2%
Net Sales 398 404 (1.4%) (2.8%)
Adjusted EBITDA 74 85 (12.2%)
% margin 18.7% 21.0%
Q3 % Change

7PROPRIETARY
Debt and Liquidity Summary
Capitalization Comments
Leverage ratio stable relative to last quarter due primarily to: Increased debt balances from Euro
denominated instruments from continued strength in the Euro
North American Industrial Wood acquisition financed and completed in June 2017 only contributes four months to LTM Adjusted EBITDA
LTM Adjusted EBITDA impacted by lower Q3 result versus prior year
Increase in cash balances partially offset noted headwinds above
(1) Assumes exchange rate of $1.177 USD/Euro(2) Total Net Debt = Total Debt minus Cash and Cash Equivalents(3) Total Net Leverage = Total Net Debt / LTM Adjusted EBITDA
($ in millions) @ 9/30/2017 Maturity
Cash and Cash Equivalents $589
Debt:
Revolver ($400 million capacity) - 2021
First Lien Term Loan (USD) 1,972 2024
First Lien Term Loan (EUR)(1) 464 2023
Total Senior Secured Debt $2,436
Senior Unsecured Notes (USD) 490 2024
Senior Unsecured Notes (EUR)(1) 388 2024
Senior Unsecured Notes (EUR)(1) 521 2025
Capital Leases 53
Other Borrowings 14
Total Debt $3,903Total Net Debt(2) $3,314
LTM Adjusted EBITDA $864
Total Net Leverage (3) 3.8x

8PROPRIETARY
Full Year 2017 Guidance
Full year guidance has been revised to reflect impacts from distributor working capital adjustments, raw material costs, and recent natural disasters
Net sales growth includes incremental M&A contribution from completed acquisitions
Margin headwinds from input cost inflation, certain pricing and mix differences
Tax rate, as adjusted, benefits from full year effect of actions completed in mid-2016
Free cash flow expectation incorporates reduced Adjusted EBITDA forecast
($ millions) Q2 Guidance Revised
Net Sales, ex FX 8-9% 6-7%
Tax Rate, As Adjusted 22-24% 22-24%
Free Cash Flow $440-480 $360-400Cash flow from operations less capex
Comments on Revised Guidance
Interest Expense ~$150 ~$150
Adjusted EBITDA $940-970 $870-900
Net Sales 7-8% 6-7%
Capex ~$130 ~$130
Diluted Shares (millions) 246-249 ~246
D&A $350 ~$350

Appendix

10PROPRIETARY
Full Year 2017 Assumptions
Global GDP growth of approximately 3.1%
Global industrial production growth of approximately 3.0%
Global auto build growth of approximately 1.9%
Headwinds from supply constrictions in some raw material categories i.e. Monomers, Polyester Resins and TiO2 more pronounced than inflation related to Oil
Currency2016
% Axalta Net Sales
2016 Average Rate
2017 Average Rate
Assumption
USD % Impactof F/X Rate
Change
US$ per Euro ~28% 1.11 1.13 2.1%
Chinese Yuan per US$ ~13% 6.65 6.81 (2.3%)
Brazilian Real per US$ ~3% 3.49 3.18 9.7%
Mexican Peso per US$ ~2% 18.68 18.76 (0.4%)
US$ per BritishPound ~2% 1.36 1.28 (5.4%)
Russian Ruble per US$ ~1% 67.03 58.21 15.1%
Turkish Lira per US$ ~1% 3.02 3.58 (15.6%)
Other ~50% N/A N/A 0.2%
Currency AssumptionsMacroeconomic Assumptions
11PROPRIETARY
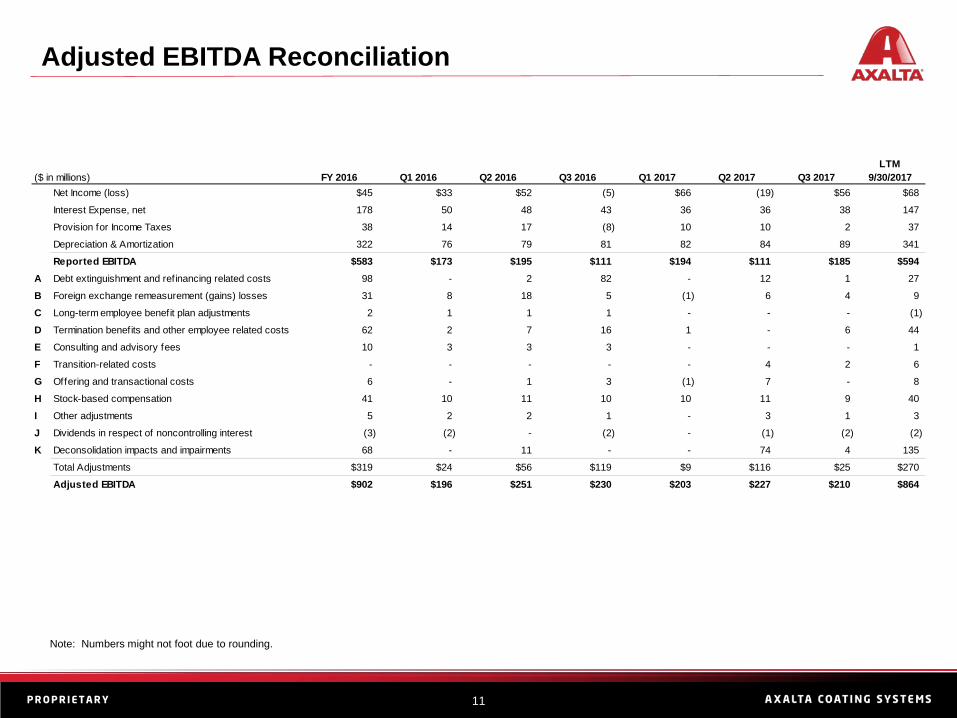
Adjusted EBITDA Reconciliation
Note: Numbers might not foot due to rounding.
($ in millions) FY 2016 Q1 2016 Q2 2016 Q3 2016 Q1 2017 Q2 2017 Q3 2017LTM
9/30/2017Net Income (loss) $45 $33 $52 (5) $66 (19) $56 $68
Interest Expense, net 178 50 48 43 36 36 38 147
Provision for Income Taxes 38 14 17 (8) 10 10 2 37
Depreciation & Amortization 322 76 79 81 82 84 89 341
Reported EBITDA $583 $173 $195 $111 $194 $111 $185 $594A Debt extinguishment and refinancing related costs 98 - 2 82 - 12 1 27
B Foreign exchange remeasurement (gains) losses 31 8 18 5 (1) 6 4 9
C Long-term employee benefit plan adjustments 2 1 1 1 - - - (1)
D Termination benefits and other employee related costs 62 2 7 16 1 - 6 44
E Consulting and advisory fees 10 3 3 3 - - - 1
F Transition-related costs - - - - - 4 2 6
G Offering and transactional costs 6 - 1 3 (1) 7 - 8
H Stock-based compensation 41 10 11 10 10 11 9 40
I Other adjustments 5 2 2 1 - 3 1 3
J Dividends in respect of noncontrolling interest (3) (2) - (2) - (1) (2) (2)
K Deconsolidation impacts and impairments 68 - 11 - - 74 4 135
Total Adjustments $319 $24 $56 $119 $9 $116 $25 $270
Adjusted EBITDA $902 $196 $251 $230 $203 $227 $210 $864

12PROPRIETARY
Adjusted EBITDA Reconciliation (cont’d)
A. During the year ended December 31, 2016 we amended our Credit Agreement and refinanced our indebtedness, resulting in losses of $88 million, and prepaid principal on our term loans, resulting in non-cash extinguishment losses of $10 million. In 2Q and 3Q 2016, we prepaid principal on the Term Loans and recorded non-cash losses on extinguishment of $2 million and $4 million, respectively. Additionally, in 3Q 2016 and 2Q 2017 we further amended our Credit Agreement and refinanced our indebtedness, resulting in losses of $78 million and $12 million, respectively. During 3Q 2017, we recorded $1 million resulting from changes in estimates associated with the refinancing of our term loans during 2Q 2017. We do not consider these to be indicative of our ongoing operating performance.
B. Eliminates foreign exchange gains and losses resulting from the remeasurement of assets and liabilities denominated in foreign currencies, net of impacts of our foreign currency instruments used to hedge our balance sheet exposures.
C. Eliminates the non-cash, non-service cost components of long-term employee benefits. D. Represents expenses primarily related to employee termination benefits and other employee-related costs associated with our Axalta Way initiatives, which
are not considered indicative of our ongoing operating performance.E. Represents fees paid to consultants for professional services primarily related to our Axalta Way initiatives, which are not considered indicative of our ongoing
operating performance. F. Represents integration costs related to the acquisition of the Industrial Wood business that was a carve-out business from Valspar. These amounts are not
considered indicative of our ongoing operating performance.G. Represents acquisition-related expenses, including changes in the fair value of contingent consideration, as well as costs associated with the 2016 secondary
offerings of our common shares by Carlyle, both of which are not considered indicative of our ongoing operating performance.H. Represents non-cash costs associated with stock-based compensation.I. Represents costs for certain non-operational or non-cash (gains) and losses unrelated to our core business and which we do not consider indicative of
ongoing operations, including equity investee dividends, indemnity losses (gains) associated with the Acquisition, losses (gains) on sale and disposal of property, plant and equipment, losses (gains) on the remaining foreign currency derivative instruments and non-cash fair value inventory adjustments associated with our business combinations.
J. Represents the payment of dividends to our joint venture partners by our consolidated entities that are not wholly owned, which are reflected to show cash operating performance of these entities on Axalta’s financial statements.
K. As a result of currency devaluations in Venezuela, during the year ended December 31, 2016, we recorded non-cash impairment charges relating to a real estate investment for $11 million and long-lived assets for $58 million. In conjunction with the deconsolidation of our Venezuelan subsidiary during 2Q 2017, we recorded a loss on deconsolidation of $71 million. In addition, during 2Q 2017 and 3Q 2017, we recorded non-cash impairment charges related to the closure and the sale of manufacturing facilities previously announced for closure of $3 million and $4 million respectively. We do not consider these to be indicative of our ongoing operating performance.
13PROPRIETARY
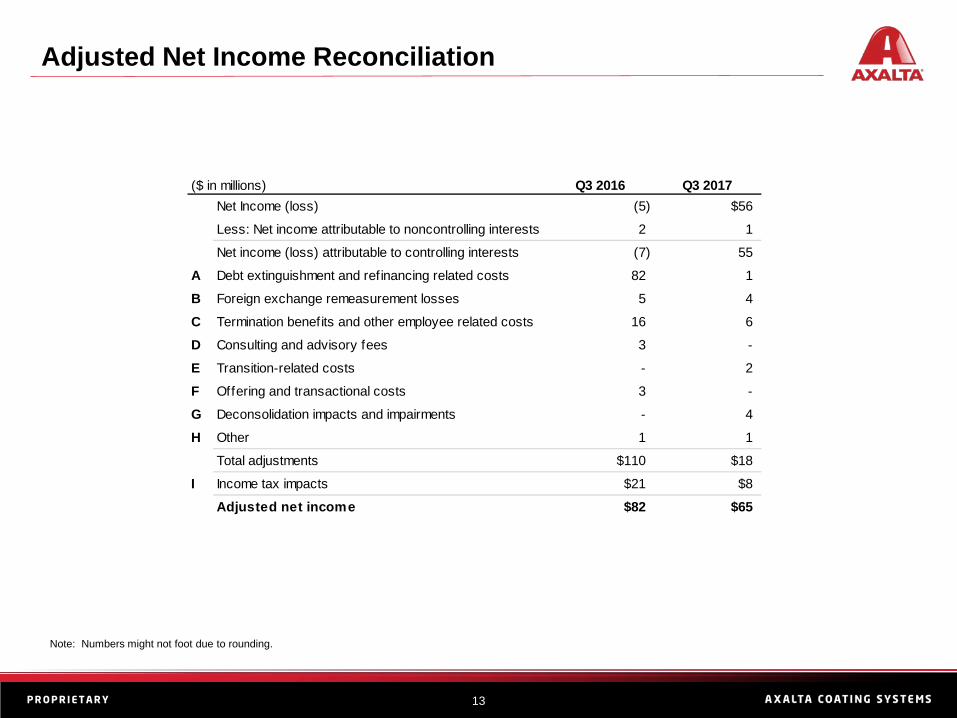
Adjusted Net Income Reconciliation
($ in millions) Q3 2016 Q3 2017Net Income (loss) (5) $56
Less: Net income attributable to noncontrolling interests 2 1
Net income (loss) attributable to controlling interests (7) 55
A Debt extinguishment and refinancing related costs 82 1
B Foreign exchange remeasurement losses 5 4
C Termination benefits and other employee related costs 16 6
D Consulting and advisory fees 3 -
E Transition-related costs - 2
F Offering and transactional costs 3 -
G Deconsolidation impacts and impairments - 4
H Other 1 1
Total adjustments $110 $18
I Income tax impacts $21 $8
Adjusted net income $82 $65
Note: Numbers might not foot due to rounding.

14PROPRIETARY
Adjusted Net Income Reconciliation (cont’d)
A. In 3Q 2016, we prepaid outstanding principal on our term loans, resulting in a non-cash loss on extinguishment of $4 million. We also amended our Credit Agreement and refinanced our indebtedness, resulting in additional losses of $78 million. During 3Q 2017, we recorded $1 million resulting from changes in estimates associated with the refinancing of our term loans during 2Q 2017. We do not consider these to be indicative of our ongoing operating performance.
B. Eliminates foreign exchange gains and losses resulting from the remeasurement of assets and liabilities denominated in foreign currencies, net of impacts of our foreign currency instruments used to hedge our balance sheet exposures.
C. Represents expenses primarily related to employee termination benefits and other employee-related costs associated with our Axalta Way initiatives, which are not considered indicative of our ongoing operating performance.
D. Represents fees paid to consultants for professional services primarily related to our Axalta Way initiatives, which are not considered indicative of our ongoing operating performance.
E. Represents integration costs related to the acquisition of the Industrial Wood business that was a carve-out business from Valspar. These amounts are not considered indicative of our ongoing operating performance.
F. Represents acquisition-related expenses, including changes in the fair value of contingent consideration, as well as costs associated with the 2016 secondary offerings of our common shares by Carlyle, both of which are not considered indicative of our ongoing operating performance.
G. During 3Q 2017, we recorded non-cash impairment charges related to the sale of a manufacturing facility previously announced for closure of $4 million. We do not consider this to be indicative of our ongoing operating performance.
H. Represents costs for non-cash fair value inventory adjustments associated with our business combinations, which we do not consider indicative of ongoing operations.
I. The income tax impacts are determined using the applicable rates in the taxing jurisdictions in which expense or income occurred and includes both current and deferred income tax expense (benefit) based on the nature of the non-GAAP performance measure. Additionally, there were no discrete items removed from our income tax expense for the 2Q 2017 and 2Q 2016.
