q3 2016 earnings release releases/2016... · 2016 q2 2016 q3 2016 free cash flow * operating...
TRANSCRIPT

Kristian Johansen Sven Børre Larsen
Q3 2016 Earnings Release
CEO CFO28 October 2016

©2016 TGS-NOPEC Geophysical Company ASA. All rights reserved.
All statements in this presentation other than statements of historical fact,
are forward-looking statements, which are subject to a number of risks,
uncertainties, and assumptions that are difficult to predict and are based
upon assumptions as to future events that may not prove accurate. These
factors include TGS’ reliance on a cyclical industry and principal
customers, TGS’ ability to continue to expand markets for licensing of
data, and TGS’ ability to acquire and process data products at costs
commensurate with profitability. Actual results may differ materially from
those expected or projected in the forward-looking statements. TGS
undertakes no responsibility or obligation to update or alter forward-
looking statements for any reason.
Forward-Looking Statements
2
©2016 TGS-NOPEC Geophysical Company ASA. All rights reserved.
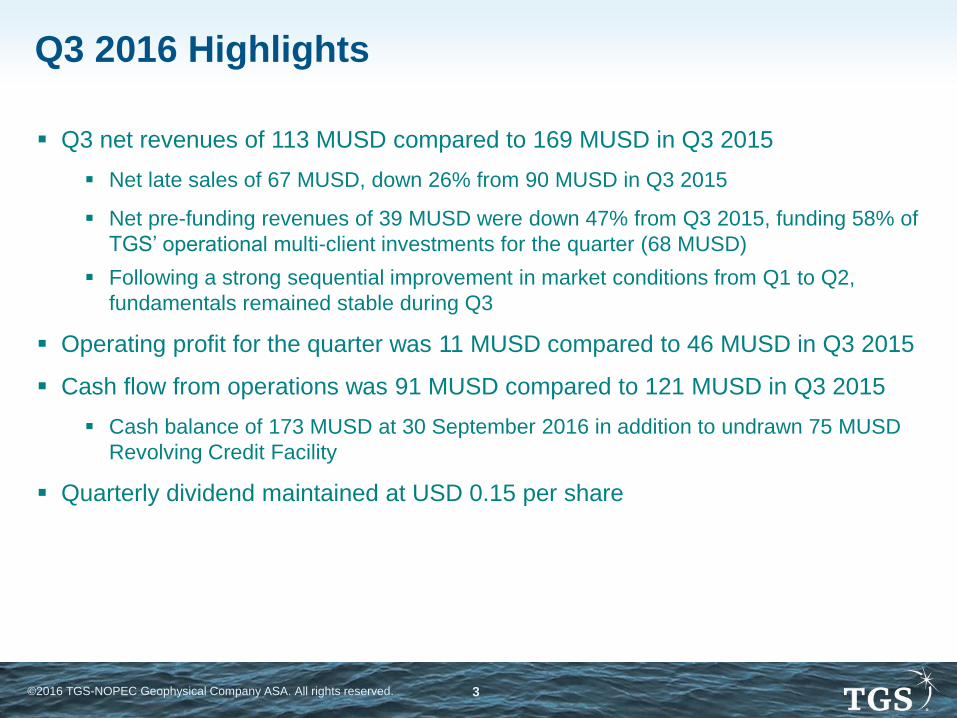
Q3 net revenues of 113 MUSD compared to 169 MUSD in Q3 2015
Net late sales of 67 MUSD, down 26% from 90 MUSD in Q3 2015
Net pre-funding revenues of 39 MUSD were down 47% from Q3 2015, funding 58% of
TGS’ operational multi-client investments for the quarter (68 MUSD)
Following a strong sequential improvement in market conditions from Q1 to Q2,
fundamentals remained stable during Q3
Operating profit for the quarter was 11 MUSD compared to 46 MUSD in Q3 2015
Cash flow from operations was 91 MUSD compared to 121 MUSD in Q3 2015
Cash balance of 173 MUSD at 30 September 2016 in addition to undrawn 75 MUSD
Revolving Credit Facility
Quarterly dividend maintained at USD 0.15 per share
Q3 2016 Highlights
3

©2016 TGS-NOPEC Geophysical Company ASA. All rights reserved.
North West African Atlantic Margin
NWAAM2017
Over 11,500 km of multi-client 2D seismic in
partnership with PGS
Designed to infill, extend and complement the
TGS NWAAM2012 2D survey which helped
with recent commercial discoveries in the
basin
A 12 km deep-tow streamer will enable the
recording of high quality broadband 2D seismic
data
Confirms TGS commitment to the leading
frontier basin in Africa, where TGS already has
over 28,000 km of 2D data and over 18,000
km2 of 3D data
New Project Announced – North West Africa
4
©2016 TGS-NOPEC Geophysical Company ASA. All rights reserved. 5
Operational Highlights

©2015 TGS-NOPEC Geophysical Company ASA. All rights reserved.
Q3 2016 Operations
6
Sanco Spirit 2D JV
Fugro Multibeam
Northern Explorer 2D
Aquila Explorer 2D
Hawk Explorer 2D
TDI Brooks Coring
Atlantic Explorer 2D JV
BGP Explorer 2D
Artemis Atlantic P-Cable
Ramform Sterling 3D JV
Akademik Lazarev 2D
WesternGeco Coil Crew

©2016 TGS-NOPEC Geophysical Company ASA. All rights reserved.
Revolution XII and XIII
~7,150 km2 (306 blocks) multi-client 3D survey
in collaboration with WesternGeco
Located in Green Canyon, Atwater Valley and
Ewing Bank protraction areas of the Central
Gulf of Mexico
Survey utilizes WesternGeco’s proprietary Q-
Marine* point-receiver marine seismic system
combined with the proprietary multi-vessel,
Dual Coil Shooting acquisition technique, which
will provide broadband, long-offset, full-azimuth
data
Track record of success in Central GOM
Expansion of TGS-WesternGeco WAZ surveys
in U.S Central GOM; first survey Freedom was
acquired in 2008
WAZ data has proven critical to improve
illumination and imaging of the sub-salt and
other complex geologic features
This part of the Gulf of Mexico continues to see
the highest activity level and benefits from
significant near-term lease turnover
Q3 Activity – U.S. Gulf of Mexico
*Mark of Schlumberger
7
©2016 TGS-NOPEC Geophysical Company ASA. All rights reserved.
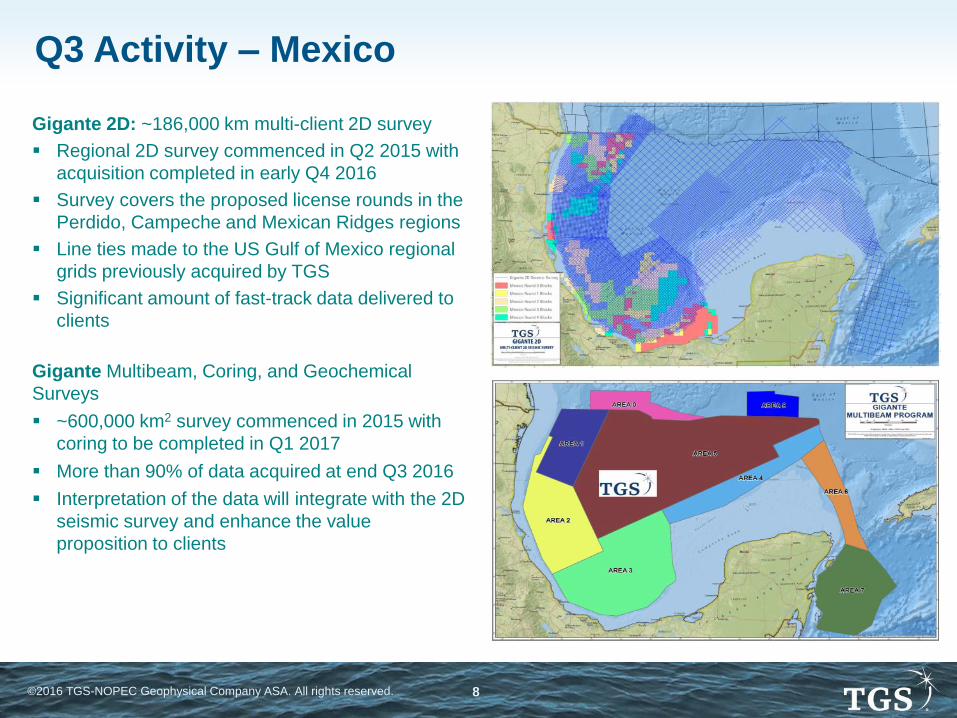
Gigante 2D: ~186,000 km multi-client 2D survey
Regional 2D survey commenced in Q2 2015 with
acquisition completed in early Q4 2016
Survey covers the proposed license rounds in the
Perdido, Campeche and Mexican Ridges regions
Line ties made to the US Gulf of Mexico regional
grids previously acquired by TGS
Significant amount of fast-track data delivered to
clients
Gigante Multibeam, Coring, and Geochemical
Surveys
~600,000 km2 survey commenced in 2015 with
coring to be completed in Q1 2017
More than 90% of data acquired at end Q3 2016
Interpretation of the data will integrate with the 2D
seismic survey and enhance the value
proposition to clients
Q3 Activity – Mexico
8

©2016 TGS-NOPEC Geophysical Company ASA. All rights reserved.
Newfoundland Labrador 2016 Season
38,000 km multi-client 2D survey in partnership
with PGS – data acquisition to complete in Q4
2016
~2,000 km2 multi-client 3D survey in
partnership with PGS – data acquisition
completed in Q3 2016
TGS-PGS JV library in this region will exceed
150,000 km of 2D data and 11,000 km2 of 3D
data in addition to 83,700 km of TGS vintage
data, an expansive well log library and
advanced multi-client interpretation products
A bright spot in an otherwise challenging
exploration market
Recent exploration success
Highly successful 2015 license round (nine
companies participated with CAD 1.2 billion
successful commitments)
Two 2016 Calls for Bids issued over
approximately 3.3 million hectares in Jeanne
d’Arc and Eastern Newfoundland regions (bids
due 9 November 2016)
Q3 Activity – East Canada
9
©2016 TGS-NOPEC Geophysical Company ASA. All rights reserved.
Q3 Activity – Australia and Greenland
10
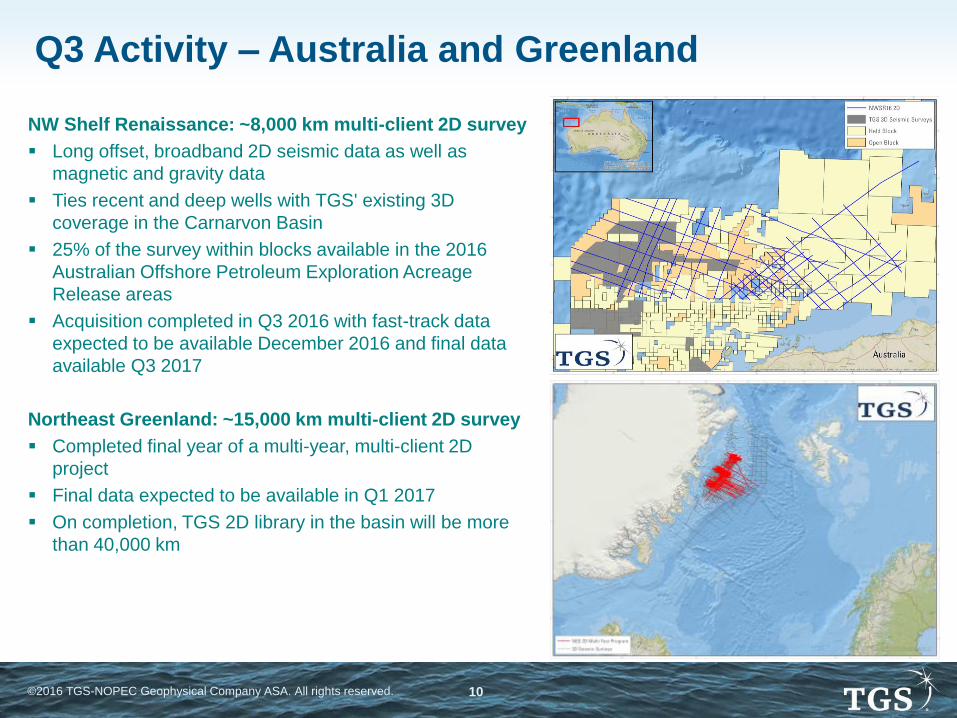
NW Shelf Renaissance: ~8,000 km multi-client 2D survey
Long offset, broadband 2D seismic data as well as
magnetic and gravity data
Ties recent and deep wells with TGS' existing 3D
coverage in the Carnarvon Basin
25% of the survey within blocks available in the 2016
Australian Offshore Petroleum Exploration Acreage
Release areas
Acquisition completed in Q3 2016 with fast-track data
expected to be available December 2016 and final data
available Q3 2017
Northeast Greenland: ~15,000 km multi-client 2D survey
Completed final year of a multi-year, multi-client 2D
project
Final data expected to be available in Q1 2017
On completion, TGS 2D library in the basin will be more
than 40,000 km
©2016 TGS-NOPEC Geophysical Company ASA. All rights reserved.
Strategic Library Acquisitions
11
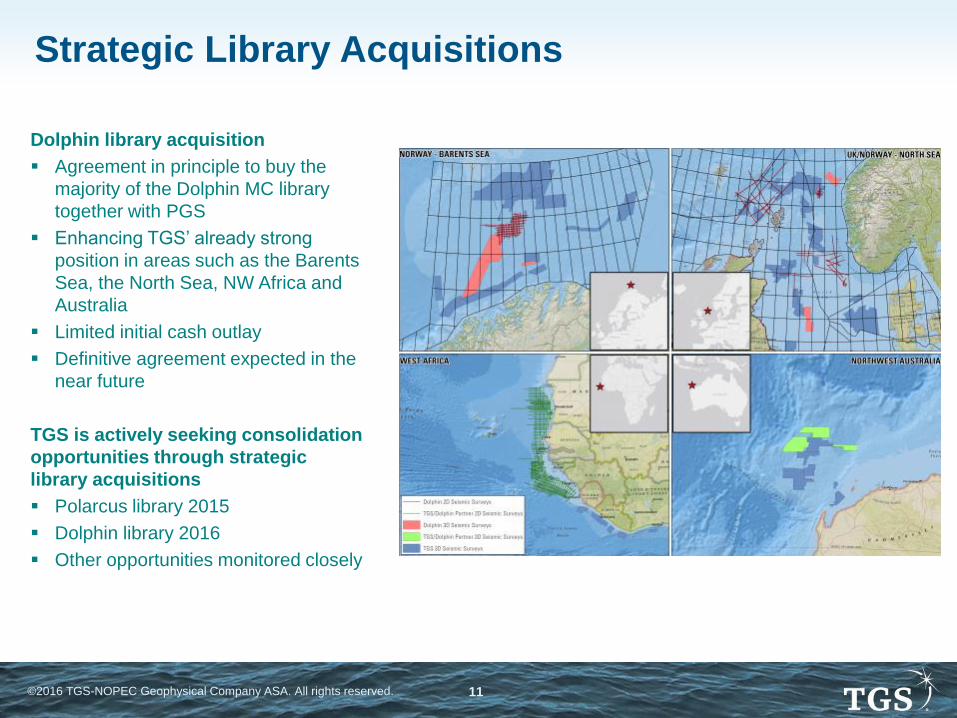
Dolphin library acquisition
Agreement in principle to buy the
majority of the Dolphin MC library
together with PGS
Enhancing TGS’ already strong
position in areas such as the Barents
Sea, the North Sea, NW Africa and
Australia
Limited initial cash outlay
Definitive agreement expected in the
near future
TGS is actively seeking consolidation
opportunities through strategic
library acquisitions
Polarcus library 2015
Dolphin library 2016
Other opportunities monitored closely

©2016 TGS-NOPEC Geophysical Company ASA. All rights reserved. 12
Financials

©2016 TGS-NOPEC Geophysical Company ASA. All rights reserved.
9
65 5 5
3 3
7
0
2
4
6
8
10
Q42014
Q12015
Q22015
Q32015
Q42015
Q12016
Q22016
Q32016
Proprietary revenues
226
72 82 90 90
3884 67
0
50
100
150
200
250
Q42014
Q12015
Q22015
Q32015
Q42015
Q12016
Q22016
Q32016
Late sales revenues
-26% Y/Y62
94
53
74
3723 26
39
0
20
40
60
80
100
Q42014
Q12015
Q22015
Q32015
Q42015
Q12016
Q22016
Q32016
Prefunding revenues
298
172140
169132
64114 113
0
50
100
150
200
250
300
Q42014
Q12015
Q22015
Q32015
Q42015
Q12016
Q22016
Q32016
Total revenues
Net Revenues
13
-47% Y/Y
37% Y/Y
-33% Y/Y
©2016 TGS-NOPEC Geophysical Company ASA. All rights reserved.
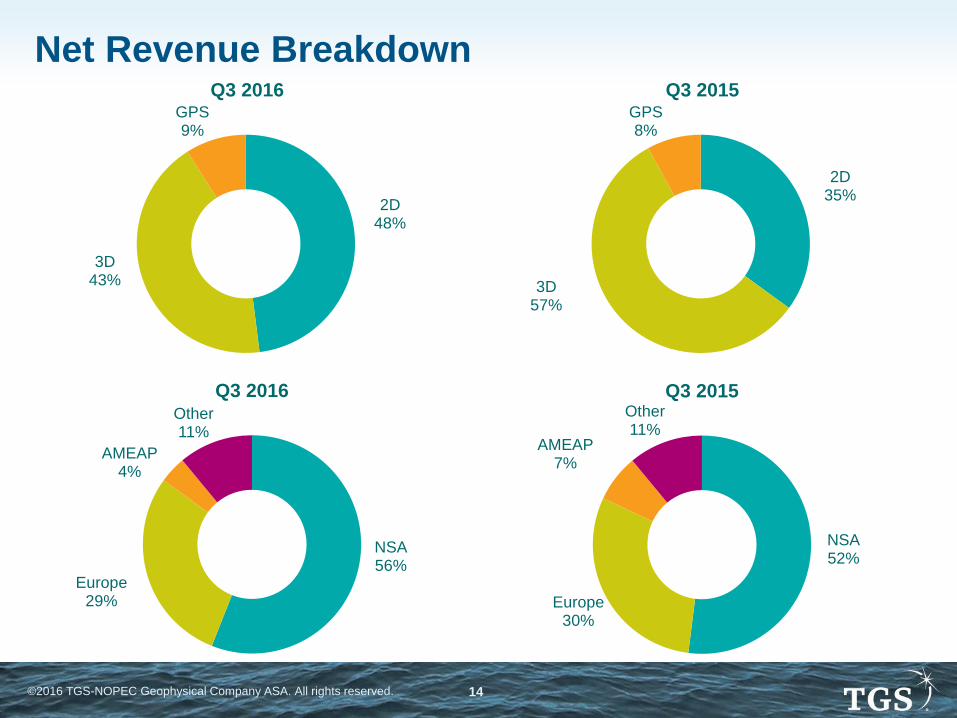
NSA52%
Europe30%
AMEAP7%
Other11%
Q3 2015
NSA56%
Europe29%
AMEAP4%
Other11%
Q3 2016
Net Revenue Breakdown
2D35%
3D57%
GPS8%
Q3 2015
2D48%
3D43%
GPS9%
Q3 2016
14
©2016 TGS-NOPEC Geophysical Company ASA. All rights reserved.
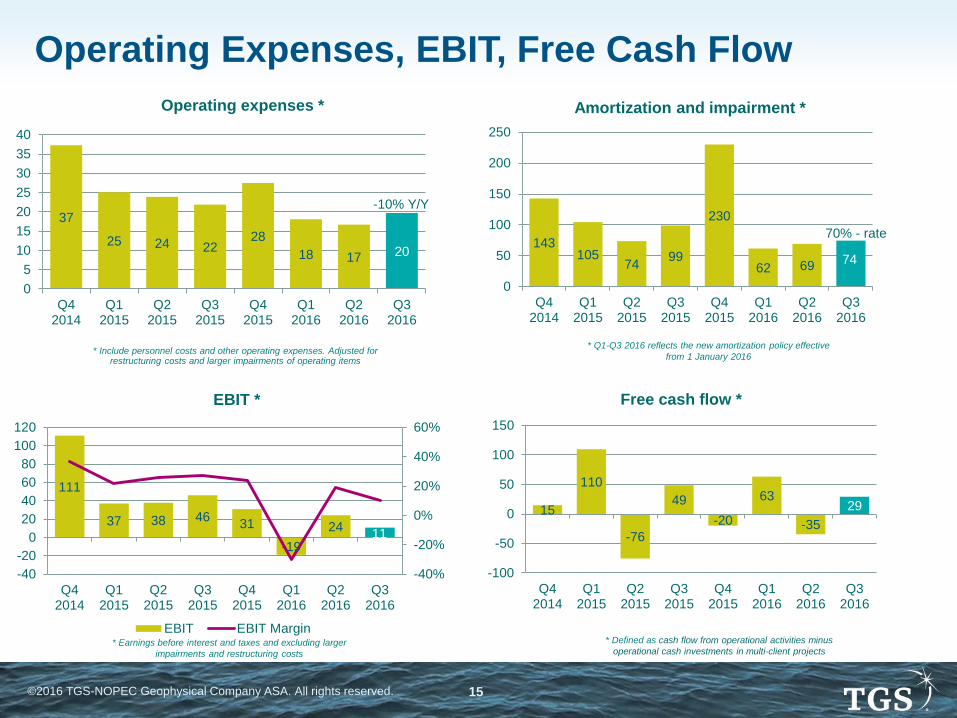
37
25 24 2228
18 17 20
0
5
10
15
20
25
30
35
40
Q42014
Q12015
Q22015
Q32015
Q42015
Q12016
Q22016
Q32016
Operating expenses *
-10% Y/Y
* Include personnel costs and other operating expenses. Adjusted for restructuring costs and larger impairments of operating items
143105
7499
230
62 6974
0
50
100
150
200
250
Q42014
Q12015
Q22015
Q32015
Q42015
Q12016
Q22016
Q32016
Amortization and impairment *
15
110
-76
49
-20
63
-35
29
-100
-50
0
50
100
150
Q42014
Q12015
Q22015
Q32015
Q42015
Q12016
Q22016
Q32016
Free cash flow *
Operating Expenses, EBIT, Free Cash Flow
15
70% - rate
111
37 38 4631
-19
2411
-40%
-20%
0%
20%
40%
60%
-40
-20
0
20
40
60
80
100
120
Q42014
Q12015
Q22015
Q32015
Q42015
Q12016
Q22016
Q32016
EBIT *
EBIT EBIT Margin
* Q1-Q3 2016 reflects the new amortization policy effective
from 1 January 2016
* Earnings before interest and taxes and excluding larger
impairments and restructuring costs
* Defined as cash flow from operational activities minus
operational cash investments in multi-client projects
©2016 TGS-NOPEC Geophysical Company ASA. All rights reserved.
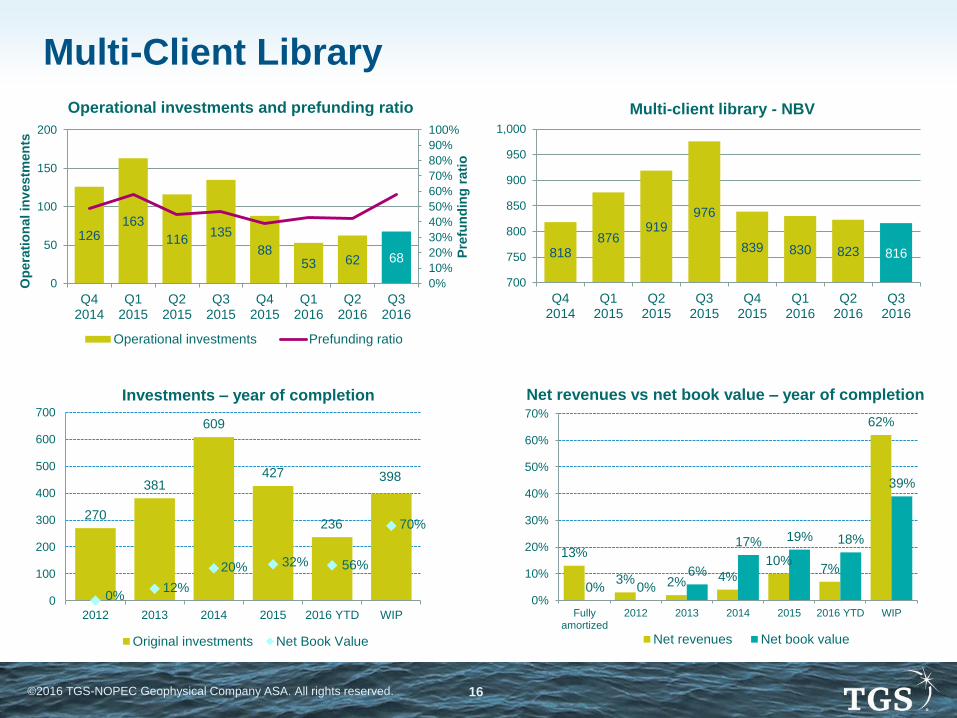
818876
919976
839 830 823 816
700
750
800
850
900
950
1,000
Q42014
Q12015
Q22015
Q32015
Q42015
Q12016
Q22016
Q32016
Multi-client library - NBV
126163
116135
8853 62 68
0%
10%
20%
30%
40%
50%
60%
70%
80%
90%
100%
0
50
100
150
200
Q42014
Q12015
Q22015
Q32015
Q42015
Q12016
Q22016
Q32016
Pre
fun
din
g r
ati
o
Op
era
tio
nal
inv
estm
en
ts
Operational investments and prefunding ratio
Operational investments Prefunding ratio
Multi-Client Library
16
13%
3% 2% 4%
10%7%
62%
0% 0%
6%
17% 19% 18%
39%
0%
10%
20%
30%
40%
50%
60%
70%
Fullyamortized
2012 2013 2014 2015 2016 YTD WIP
Net revenues Net book value
Net revenues vs net book value – year of completion
270
381
609
427
236
398
0
100
200
300
400
500
600
700
2012 2013 2014 2015 2016 YTD WIP
Original investments Net Book Value
20 %
32% 56%20%
0%12%
70%
Investments – year of completion
©2016 TGS-NOPEC Geophysical Company ASA. All rights reserved.
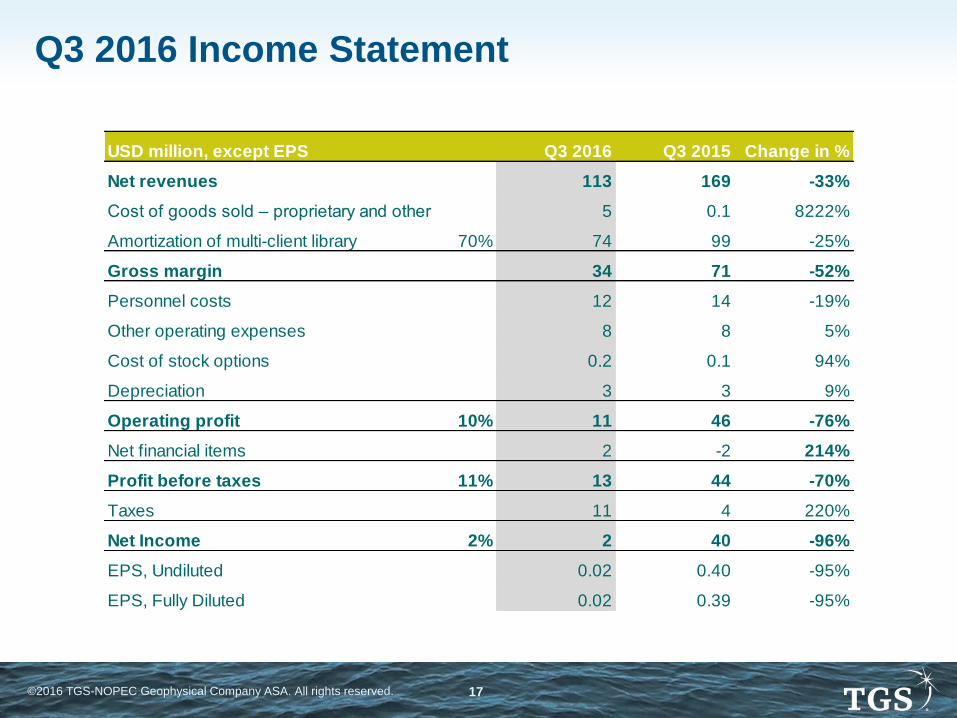
Q3 2016 Income Statement
17
USD million, except EPS Q3 2016 Q3 2015 Change in %
Net revenues 113 169 -33%
Cost of goods sold – proprietary and other 5 0.1 8222%
Amortization of multi-client library 70% 74 99 -25%
Gross margin 34 71 -52%
Personnel costs 12 14 -19%
Other operating expenses 8 8 5%
Cost of stock options 0.2 0.1 94%
Depreciation 3 3 9%
Operating profit 10% 11 46 -76%
Net financial items 2 -2 214%
Profit before taxes 11% 13 44 -70%
Taxes 11 4 220%
Net Income 2% 2 40 -96%
EPS, Undiluted 0.02 0.40 -95%
EPS, Fully Diluted 0.02 0.39 -95%
©2016 TGS-NOPEC Geophysical Company ASA. All rights reserved.
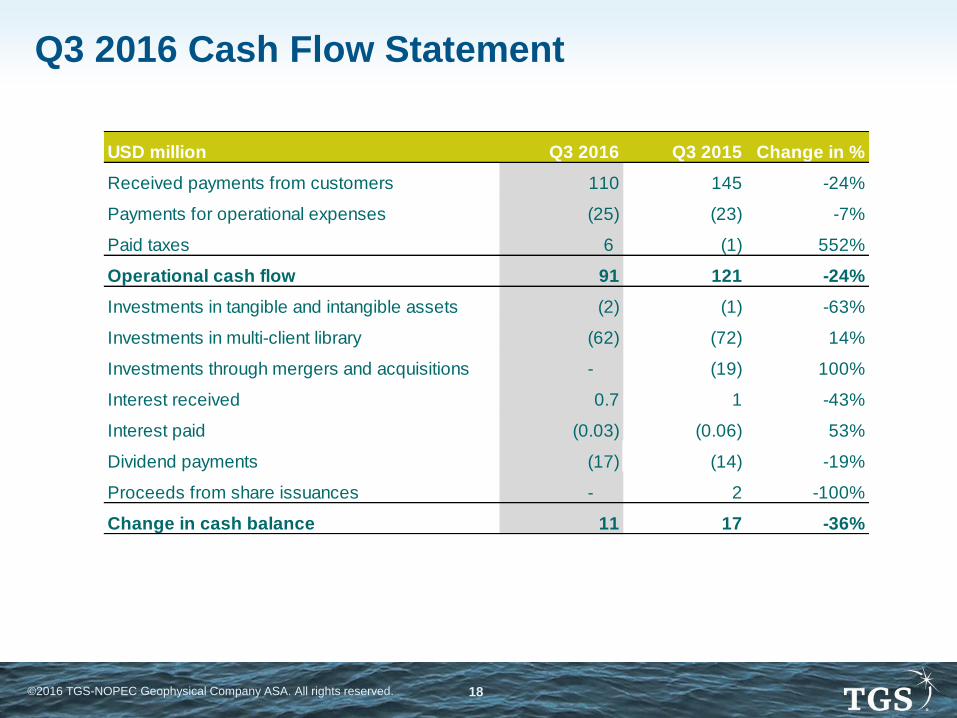
Q3 2016 Cash Flow Statement
18
USD million Q3 2016 Q3 2015 Change in %
Received payments from customers 110 145 -24%
Payments for operational expenses (25) (23) -7%
Paid taxes 6 (1) 552%
Operational cash flow 91 121 -24%
Investments in tangible and intangible assets (2) (1) -63%
Investments in multi-client library (62) (72) 14%
Investments through mergers and acquisitions - (19) 100%
Interest received 0.7 1 -43%
Interest paid (0.03) (0.06) 53%
Dividend payments (17) (14) -19%
Proceeds from share issuances - 2 -100%
Change in cash balance 11 17 -36%

©2016 TGS-NOPEC Geophysical Company ASA. All rights reserved.
Balance Sheet
The Company holds no interest-bearing debt
USD million Q3 2016 Q2 2016 Change in % Q4 2015
Assets
Cash and cash equivalents 173 162 7% 163
Other current assets 275 255 8% 308
Total current assets 449 417 8% 471
Intangible assets and deferred tax asset 88 92 -4% 90
Other non-current assets 21 16 27% 25
Multi-client library 816 823 -1% 839
Fixed assets 23 26 -11% 30
Total Assets 1,397 1,375 2% 1,455
Liabilities
Current liabilities 198 171 16% 218
Non-current liabilities 7 4 59% 6
Deferred tax liability 37 33 12% 33
Total Liabilities 242 208 16% 257
Equity 1,155 1,167 -1% 1,198
Total Liabilities and Equity 1,397 1,375 2% 1,455
19
©2016 TGS-NOPEC Geophysical Company ASA. All rights reserved.
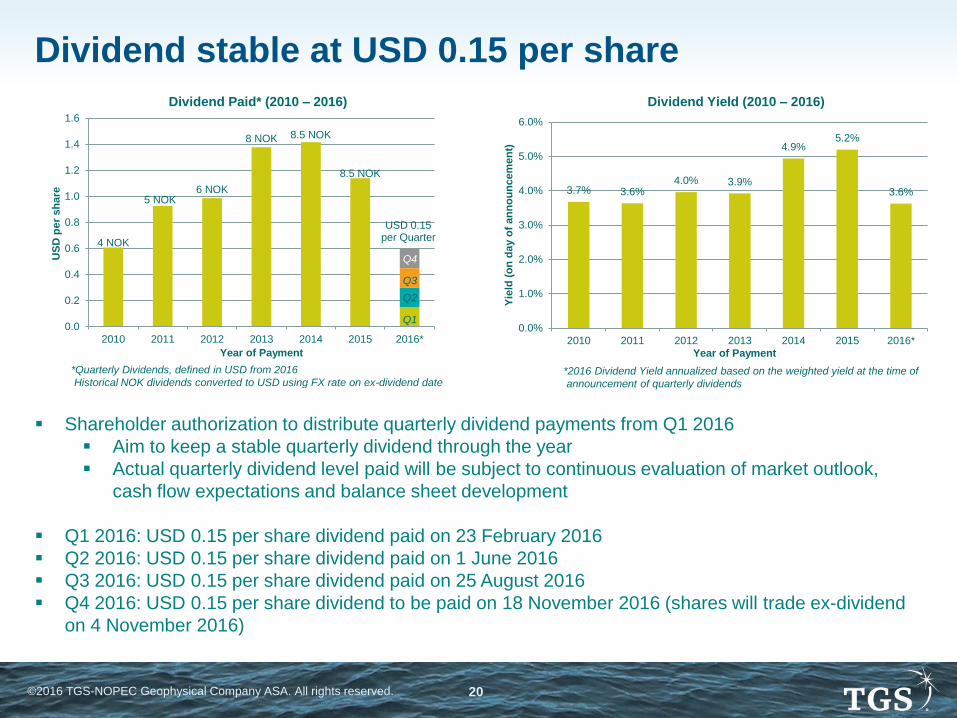
Dividend stable at USD 0.15 per share
Shareholder authorization to distribute quarterly dividend payments from Q1 2016
Aim to keep a stable quarterly dividend through the year
Actual quarterly dividend level paid will be subject to continuous evaluation of market outlook,
cash flow expectations and balance sheet development
Q1 2016: USD 0.15 per share dividend paid on 23 February 2016
Q2 2016: USD 0.15 per share dividend paid on 1 June 2016
Q3 2016: USD 0.15 per share dividend paid on 25 August 2016
Q4 2016: USD 0.15 per share dividend to be paid on 18 November 2016 (shares will trade ex-dividend
on 4 November 2016)
20
4 NOK
5 NOK6 NOK
8 NOK 8.5 NOK
8.5 NOK
USD 0.15per Quarter
0.0
0.2
0.4
0.6
0.8
1.0
1.2
1.4
1.6
2010 2011 2012 2013 2014 2015 2016*
US
D p
er
sh
are
Year of Payment
*Quarterly Dividends, defined in USD from 2016
Historical NOK dividends converted to USD using FX rate on ex-dividend date
Q1
Q2
Q3
Q4
3.7% 3.6%4.0% 3.9%
4.9%5.2%
3.6%
0.0%
1.0%
2.0%
3.0%
4.0%
5.0%
6.0%
2010 2011 2012 2013 2014 2015 2016*
Yie
ld (
on
da
y o
f an
no
un
cem
en
t)
Year of Payment
Dividend Paid* (2010 – 2016) Dividend Yield (2010 – 2016)
*2016 Dividend Yield annualized based on the weighted yield at the time of
announcement of quarterly dividends

©2016 TGS-NOPEC Geophysical Company ASA. All rights reserved. 21
Outlook

©2016 TGS-NOPEC Geophysical Company ASA. All rights reserved.
Second consecutive 20%+ decline in E&P spending expected this year
Most initial E&P Spending surveys indicate a further decline in offshore spending in 2017
Early sign of improvement – industry seismic late sales have recovered somewhat from the
low in Q1 16
Seismic demand likely to remain weak into 2017 with high volatility from quarter to quarter
Challenging Market for Exploration
22
Source: SEB Research Source: ABG Sundal Collier
7
16
23
3
-25
8
16
6
21
2723
26
1922
-8
1519
1411
2
-26-27
-10
-40
-30
-20
-10
0
10
20
30
40
199
5
199
6
199
7
199
8
199
9
200
0
200
1
200
2
200
3
200
4
200
5
200
6
200
7
200
8
200
9
201
0
201
1
201
2
201
3
201
4
201
5
201
6E
201
7E
Change in Global E&P Spending
Cha
ng
e y
ea
r-o
n-y
ea
r (%
)
0
100
200
300
400
500
600
MU
SD
Industry late sales
©2016 TGS-NOPEC Geophysical Company ASA. All rights reserved.
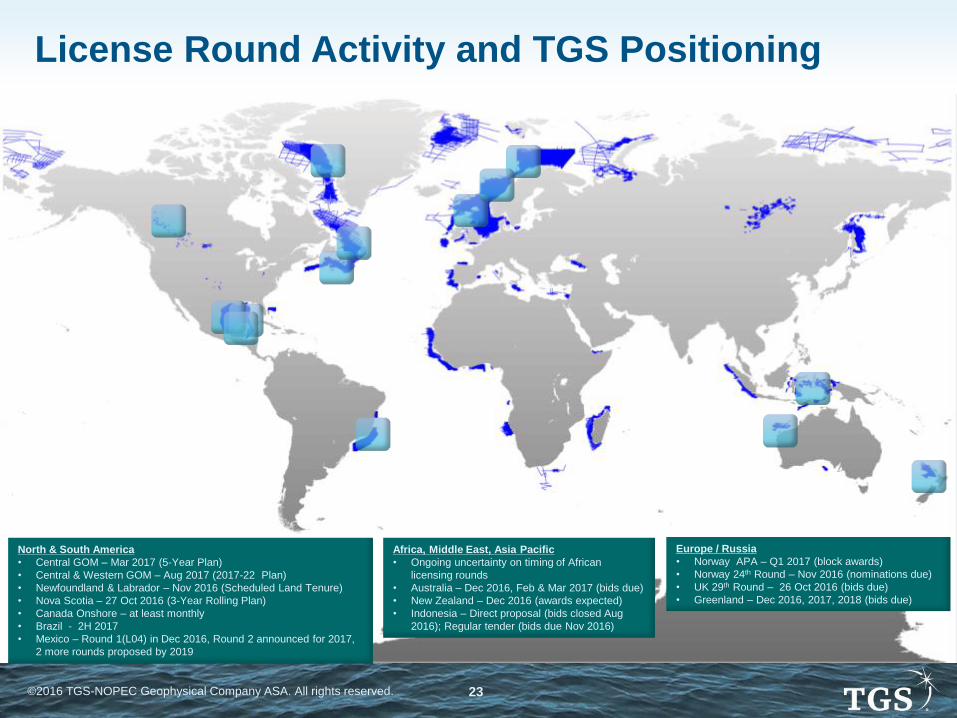
License Round Activity and TGS Positioning
23
Europe / Russia
• Norway APA – Q1 2017 (block awards)
• Norway 24th Round – Nov 2016 (nominations due)
• UK 29th Round – 26 Oct 2016 (bids due)
• Greenland – Dec 2016, 2017, 2018 (bids due)
Africa, Middle East, Asia Pacific
• Ongoing uncertainty on timing of African
licensing rounds
• Australia – Dec 2016, Feb & Mar 2017 (bids due)
• New Zealand – Dec 2016 (awards expected)
• Indonesia – Direct proposal (bids closed Aug
2016); Regular tender (bids due Nov 2016)
North & South America
• Central GOM – Mar 2017 (5-Year Plan)
• Central & Western GOM – Aug 2017 (2017-22 Plan)
• Newfoundland & Labrador – Nov 2016 (Scheduled Land Tenure)
• Nova Scotia – 27 Oct 2016 (3-Year Rolling Plan)
• Canada Onshore – at least monthly
• Brazil - 2H 2017
• Mexico – Round 1(L04) in Dec 2016, Round 2 announced for 2017,
2 more rounds proposed by 2019
©2016 TGS-NOPEC Geophysical Company ASA. All rights reserved.
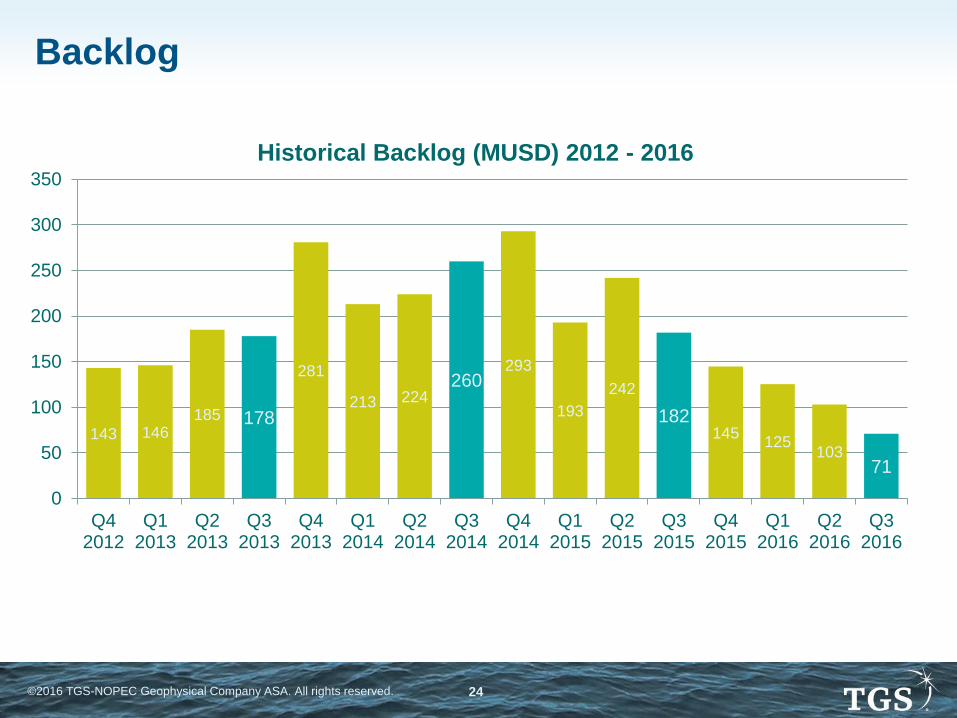
Backlog
143 146185
281
213 224
293
193
242
145125
103
178
260
182
71
0
50
100
150
200
250
300
350
Q42012
Q12013
Q22013
Q32013
Q42013
Q12014
Q22014
Q32014
Q42014
Q12015
Q22015
Q32015
Q42015
Q12016
Q22016
Q32016
Historical Backlog (MUSD) 2012 - 2016
24

©2015 TGS-NOPEC Geophysical Company ASA. All rights reserved.
2016 Projects ScheduleJan Feb Mar Apr May Jun Jul Aug Sep Oct Nov Dec
Akademik Lazarev
Aquila Explorer
Hawk Explorer
Osprey Explorer
Northern Explorer
Harrier Explorer
Fugro Multibeam
TDI Brooks Coring
Sanco Spirit
Atlantic Explorer
BGP Explorer
BGP Dong Fang Kan Tan 1
Artemis Atlantic P-Cable
Greenland
Mexico
2D
& O
the
r
EUR AMEAP
25
Mexico
Mexico
Mexico
Mexico
Mexico
Mexico
Ramform Sterling
WesternGeco Coil Crew
Canada JV
Mexico
25
Canada JV
Canada JV
Canada Crew Chickadee
Australia
Norway (Proprietary)
GOM
3D
La
nd
NSA
NWAAM

©2016 TGS-NOPEC Geophysical Company ASA. All rights reserved.
Summary
Q3 net revenues of 113 MUSD
Positive cash flow further strengthens balance sheet
Cash balance of 173 MUSD in addition to undrawn 75 MUSD Revolving Credit Facility
Quarterly dividend maintained at USD 0.15 per share
Continued challenging market conditions, but early signs of improvements
Long-term future of asset-light, focused multi-client business remains strong
Cost control, disciplined counter-cyclical investment and balance sheet strength positions TGS to
enhance its leading position
Updated 2016 guidance:
New operational multi-client investments of approximately 220 MUSD (down from 230 MUSD)
Additional multi-client investments expected from sales of existing surveys with risk sharing
arrangements
Multi-client investments are expected to be prefunded 40% to 45%
26

Thank you
©2016 TGS-NOPEC Geophysical Company ASA. All rights reserved.
www.tgs.com