q3 2011 - central/south america report
DESCRIPTION
TRANSCRIPT
A GLOBAL VIEW OF MOBILE ADVERTISING: Central & South America Regional Summary Q3
2011
InMobi Mobile Insights - Network Data
Release date: October 25th, 2011
ABOUT THE RESEARCH
Project Background
After launching in 2007 in Asia, InMobi quickly grew to become the world's largest independent mobile advertising network. In the third quarter of 2011, we served 138.4 billion impressions in 165 markets worldwide. With a physical presence in 5 continents, over 5,500 publisher partners, and a broad, independent market footprint, InMobi is well positioned to provide an objective, comprehensive, and representative view of the mobile advertising market.
Research Objectives
We have three goals with this research: 1. Help educate the market. Statistics and information about the state of mobile
advertising are lacking in most regions of the world. 2. Track consumer opinions regarding mobile advertising. With any emerging
medium, the consumer perspective is critical to overall market success. We see a need for trending across regions in this area.
3. Collaborate with industry thought leaders to increase market insight and improve information quality ongoing. As a global independent company, we value partnerships that will strengthen our understanding of the market. Researchers, thought-leaders, and analysts are encouraged to contact us and apply for full partner access.
Contact Information
www.inmobi.com/research [email protected] Twitter: @inmobi
Beginning July 2011, InMobi is moving towards quarterly data views which will highlight broader industry trends and provide an overview of the
global mobile advertising market.
NETWORK DATA
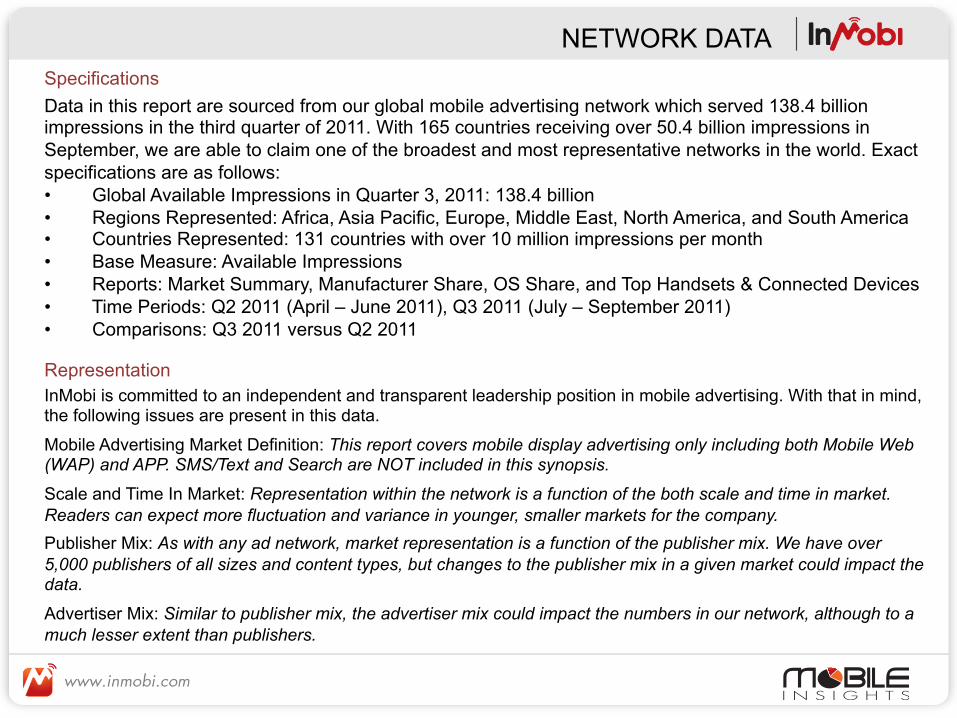
Data in this report are sourced from our global mobile advertising network which served 138.4 billion impressions in the third quarter of 2011. With 165 countries receiving over 50.4 billion impressions in September, we are able to claim one of the broadest and most representative networks in the world. Exact specifications are as follows: • Global Available Impressions in Quarter 3, 2011: 138.4 billion • Regions Represented: Africa, Asia Pacific, Europe, Middle East, North America, and South America • Countries Represented: 131 countries with over 10 million impressions per month • Base Measure: Available Impressions • Reports: Market Summary, Manufacturer Share, OS Share, and Top Handsets & Connected Devices • Time Periods: Q2 2011 (April – June 2011), Q3 2011 (July – September 2011) • Comparisons: Q3 2011 versus Q2 2011
InMobi is committed to an independent and transparent leadership position in mobile advertising. With that in mind, the following issues are present in this data.
Mobile Advertising Market Definition: This report covers mobile display advertising only including both Mobile Web (WAP) and APP. SMS/Text and Search are NOT included in this synopsis.
Scale and Time In Market: Representation within the network is a function of the both scale and time in market. Readers can expect more fluctuation and variance in younger, smaller markets for the company.
Publisher Mix: As with any ad network, market representation is a function of the publisher mix. We have over 5,000 publishers of all sizes and content types, but changes to the publisher mix in a given market could impact the data.
Advertiser Mix: Similar to publisher mix, the advertiser mix could impact the numbers in our network, although to a much lesser extent than publishers.
Specifications
Representation
Available Impression Volume & Composition
Q2 2011 Q3 2011 % Chg Global
Development Index
Total 3,472,152,363 5,934,615,710 70.9% n/a Smartphone 1,085,096,112 2,085,157,108 92.2% 73 Advanced 2,387,056,251 3,849,458,602 61.3% 132
Mobile Web 3,213,636,460 5,311,585,336 65.3% 113
App 258,515,903 623,030,374 141.0% 50
CENTRAL & SOUTH AMERICA SUMMARY
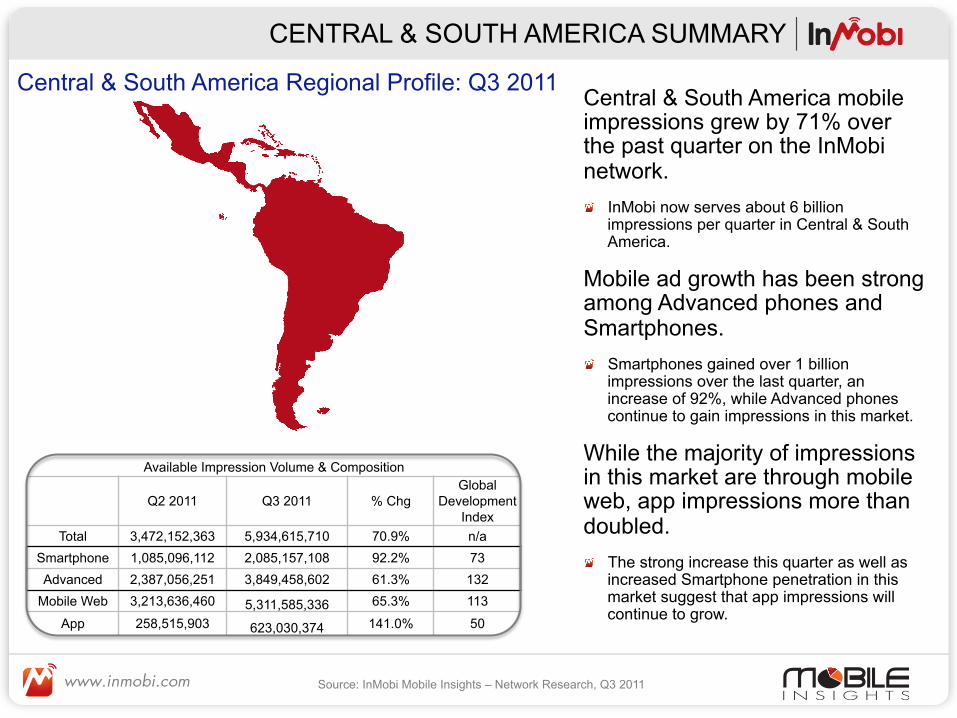
Central & South America mobile impressions grew by 71% over the past quarter on the InMobi network. " InMobi now serves about 6 billion
impressions per quarter in Central & South America.
Mobile ad growth has been strong among Advanced phones and Smartphones. " Smartphones gained over 1 billion
impressions over the last quarter, an increase of 92%, while Advanced phones continue to gain impressions in this market.
While the majority of impressions in this market are through mobile web, app impressions more than doubled. " The strong increase this quarter as well as
increased Smartphone penetration in this market suggest that app impressions will continue to grow.
Central & South America Regional Profile: Q3 2011
Source: InMobi Mobile Insights – Network Research, Q3 2011
CENTRAL & SOUTH AMERICA
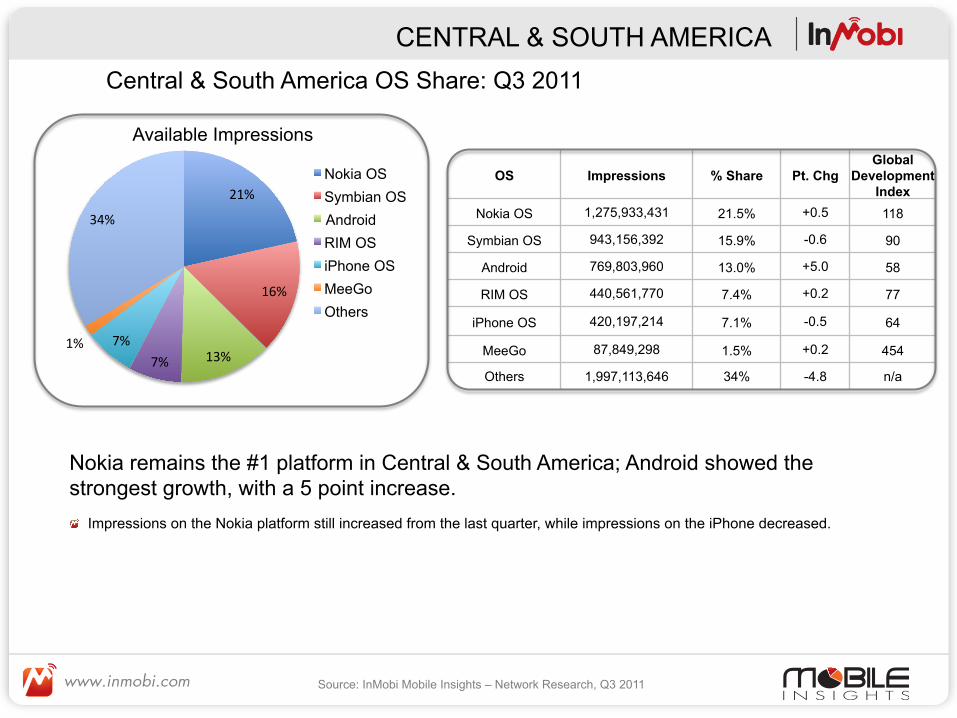
Nokia remains the #1 platform in Central & South America; Android showed the strongest growth, with a 5 point increase. " Impressions on the Nokia platform still increased from the last quarter, while impressions on the iPhone decreased.
Central & South America OS Share: Q3 2011
Available Impressions
21%
16%
13% 7% 7% 1%
34%
Nokia OS Symbian OS Android RIM OS iPhone OS MeeGo Others
OS Impressions % Share Pt. Chg Global
Development Index
Nokia OS 1,275,933,431 21.5% +0.5 118
Symbian OS 943,156,392 15.9% -0.6 90
Android 769,803,960 13.0% +5.0 58
RIM OS 440,561,770 7.4% +0.2 77
iPhone OS 420,197,214 7.1% -0.5 64
MeeGo 87,849,298 1.5% +0.2 454
Others 1,997,113,646 34% -4.8 n/a
Source: InMobi Mobile Insights – Network Research, Q3 2011
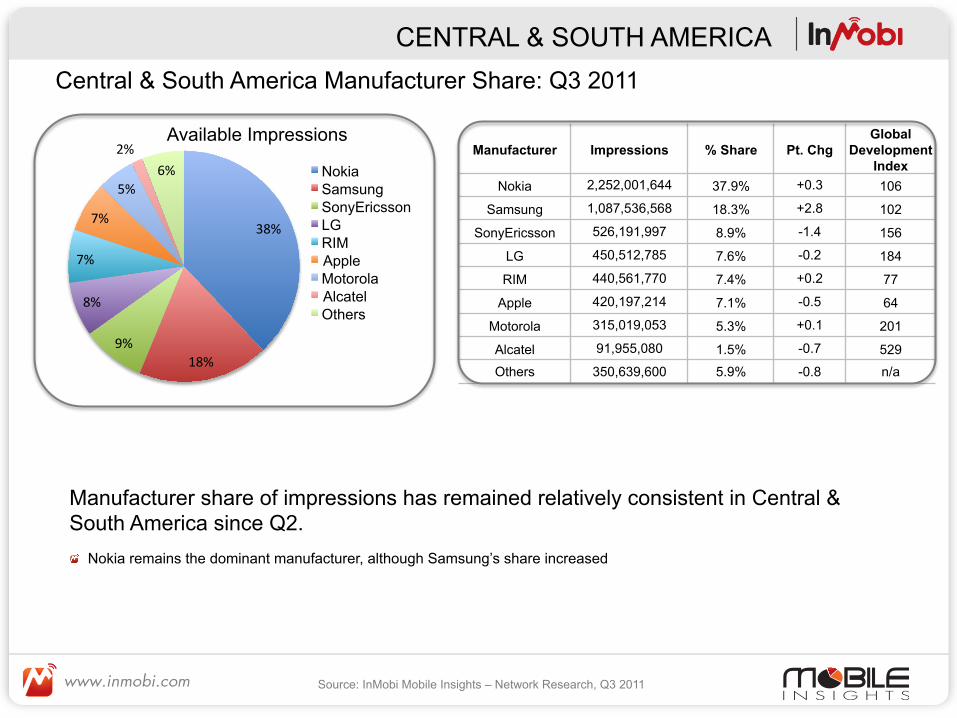
CENTRAL & SOUTH AMERICA Central & South America Manufacturer Share: Q3 2011
Available Impressions Manufacturer Impressions % Share Pt. Chg
Global Development
Index Nokia 2,252,001,644 37.9% +0.3 106
Samsung 1,087,536,568 18.3% +2.8 102
SonyEricsson 526,191,997 8.9% -1.4 156
LG 450,512,785 7.6% -0.2 184
RIM 440,561,770 7.4% +0.2 77
Apple 420,197,214 7.1% -0.5 64
Motorola 315,019,053 5.3% +0.1 201
Alcatel 91,955,080 1.5% -0.7 529
Others 350,639,600 5.9% -0.8 n/a
Manufacturer share of impressions has remained relatively consistent in Central & South America since Q2. " Nokia remains the dominant manufacturer, although Samsung’s share increased
Source: InMobi Mobile Insights – Network Research, Q3 2011
38%
18% 9%
8%
7%
7%
5%
2% 6% Nokia
Samsung SonyEricsson LG RIM Apple Motorola Alcatel Others
CENTRAL & SOUTH AMERICA
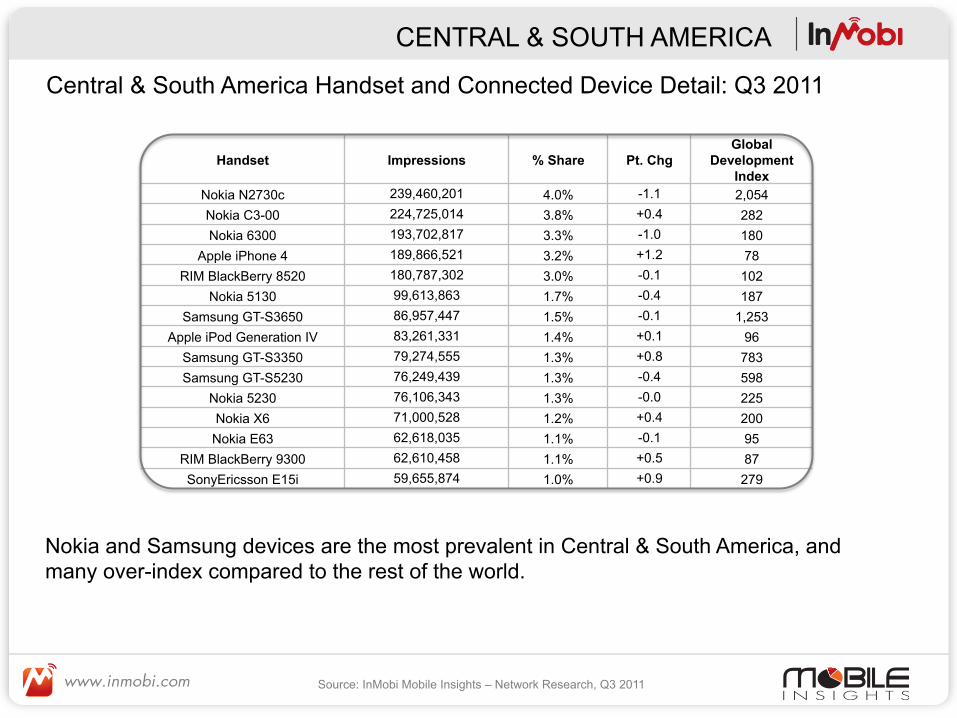
Central & South America Handset and Connected Device Detail: Q3 2011
Handset Impressions % Share Pt. Chg Global
Development Index
Nokia N2730c 239,460,201 4.0% -1.1 2,054 Nokia C3-00 224,725,014 3.8% +0.4 282 Nokia 6300 193,702,817 3.3% -1.0 180
Apple iPhone 4 189,866,521 3.2% +1.2 78 RIM BlackBerry 8520 180,787,302 3.0% -0.1 102
Nokia 5130 99,613,863 1.7% -0.4 187 Samsung GT-S3650 86,957,447 1.5% -0.1 1,253
Apple iPod Generation IV 83,261,331 1.4% +0.1 96 Samsung GT-S3350 79,274,555 1.3% +0.8 783 Samsung GT-S5230 76,249,439 1.3% -0.4 598
Nokia 5230 76,106,343 1.3% -0.0 225 Nokia X6 71,000,528 1.2% +0.4 200
Nokia E63 62,618,035 1.1% -0.1 95 RIM BlackBerry 9300 62,610,458 1.1% +0.5 87 SonyEricsson E15i 59,655,874 1.0% +0.9 279
Nokia and Samsung devices are the most prevalent in Central & South America, and many over-index compared to the rest of the world.
Source: InMobi Mobile Insights – Network Research, Q3 2011
CENTRAL & SOUTH AMERICA
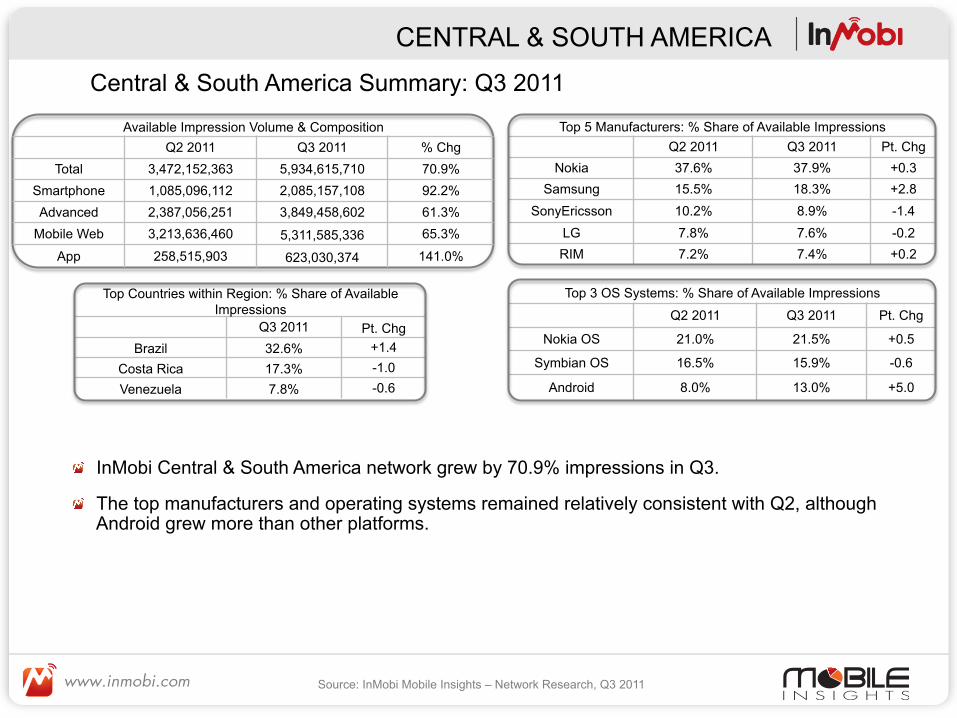
Central & South America Summary: Q3 2011
Top 5 Manufacturers: % Share of Available Impressions Q2 2011 Q3 2011 Pt. Chg
Nokia 37.6% 37.9% +0.3 Samsung 15.5% 18.3% +2.8
SonyEricsson 10.2% 8.9% -1.4 LG 7.8% 7.6% -0.2 RIM 7.2% 7.4% +0.2
Top 3 OS Systems: % Share of Available Impressions
Q2 2011 Q3 2011 Pt. Chg
Nokia OS 21.0% 21.5% +0.5
Symbian OS 16.5% 15.9% -0.6
Android 8.0% 13.0% +5.0
Available Impression Volume & Composition Q2 2011 Q3 2011 % Chg
Total 3,472,152,363 5,934,615,710 70.9% Smartphone 1,085,096,112 2,085,157,108 92.2% Advanced 2,387,056,251 3,849,458,602 61.3%
Mobile Web 3,213,636,460 5,311,585,336 65.3%
App 258,515,903 623,030,374 141.0%
Top Countries within Region: % Share of Available Impressions
Q3 2011 Pt. Chg Brazil 32.6% +1.4
Costa Rica 17.3% -1.0 Venezuela 7.8% -0.6
" InMobi Central & South America network grew by 70.9% impressions in Q3.
" The top manufacturers and operating systems remained relatively consistent with Q2, although Android grew more than other platforms.
Source: InMobi Mobile Insights – Network Research, Q3 2011
MEASURES AND TERM DEFINITIONS
Measures: Available Impressions: The total number of ads requests made to the InMobi network % Share (of Available Impressions): The % of total available impressions in the specified region allocated to the inventory type, device, manufacturer, or OS under analysis. Global Development Index: An index of the % share of the inventory type, device, manufacturer, or OS under analysis in the specified region or country relative to that same inventory type, device, manufacturer, or OS share globally. Regional Development Index: Global Development Index: An index of the % share of the inventory type, device, manufacturer, or OS under analysis in the specified country relative to that same inventory type, device, manufacturer, or OS share in the relevant region. % Chg: The percentage change in absolute value between two different time periods. Pt Chg: The difference between two share percentages for an inventory type, device, manufacturer, or OS under analysis in different time periods.
Definitions: Smartphone: Any impression served to an iPhone OS, Android OS, RIM OS, webOS, Windows Mobile OS, Linux Smartphone OS, Palm OS, Nokia N & E Series Phones, or Samsung Bada. Advanced: Any impression served to any OS or handset not included in the smart phone definition above. Mobile Web: Any impression served using Wireless Application Protocol (WAP) which is an open international standard for application-layer network communications in a wireless-communication environment. App (Application): Any impressions served to a mobile application resident on the consumer mobile device. Carrier: The mobile network operator (MNO), carrier service provider (CSP), wireless service provider, wireless carrier, or cellular company providing service for mobile phone subscriber served the impression. OS (Operating System): The system software (programs and data) running on the mobile devices that manages the hardware and provides common services for execution of various application software receiving the impression. Handsets and Connected Device: The make and model of the mobile device receiving the impression. Manufacturer: The OEM manufacturer of the mobile device receiving the impression. Other: An aggregation of any remaining impressions not specifically detailed previously. Typically an aggregation of everything under 1% share.
InMobi Regional Definitions: InMobi defines all regions per Wikipedia with the following modifications: “Asia Pacific” includes the 15 Oceania countries as listed in Wikipedia. “South America” includes South & Central Americas as listed in Wikipedia.
This data is part of a series of network reports that are released monthly. Additional regions and markets will be released throughout the quarter. Release Schedule Once a quarter InMobi will release a full data report which will include global, regional and country data views. The next full release is planned for mid January. Infographics with monthly data will be available in November and December. Monthly data updates including key information by market will be released via our mailing lists and website. While we move to a quarterly release schedule, we will still continue to release insightful data on key markets across regions on a monthly basis. These releases will shed light on emerging trends and unique developments specific to those key markets. Open Source Research: Getting Involved Objective industry analysts and thought-leaders are encouraged to comment, question, and participate. We will be sure to consider and update the research based on feedback and questions to improve the quality for all end users. To join our monthly research mailing list, contact us at [email protected] To download the full reports, visit us at www.InMobi.com/research
NEXT STEPS