q2_2012_report
DESCRIPTION
Q2 Home Sales Report-VirginiaTRANSCRIPT

VIRGINIA Home SAleS RepoRt se
cond
Qu
arte
r
2011
Published by Virginia association of reaLtors®, the advocate for real estate professionals and property owners in Virginia.
VIRGINIA Home SAleS RepoRt se
cond
Qu
arte
r
2011
Published by Virginia association of reaLtors®, the advocate for real estate professionals and property owners in Virginia.
VIRGINIA Home SAleS RepoRt se
cond
Qu
arte
r
2011
Published by Virginia association of reaLtors®, the advocate for real estate professionals and property owners in Virginia.
SECOND
QUARTER
2012
2012-Q2Virginia Quarterly Home Sales Report
Published by the Virginia Association of REALTORS® Page 2
0
2,000
4,000
6,000
8,000
10,000
12,000
January February March April May June July August September October November December
Num
ber
of S
ingl
e Fa
mily
, To
wnh
ome
and
Con
do S
ales
Month
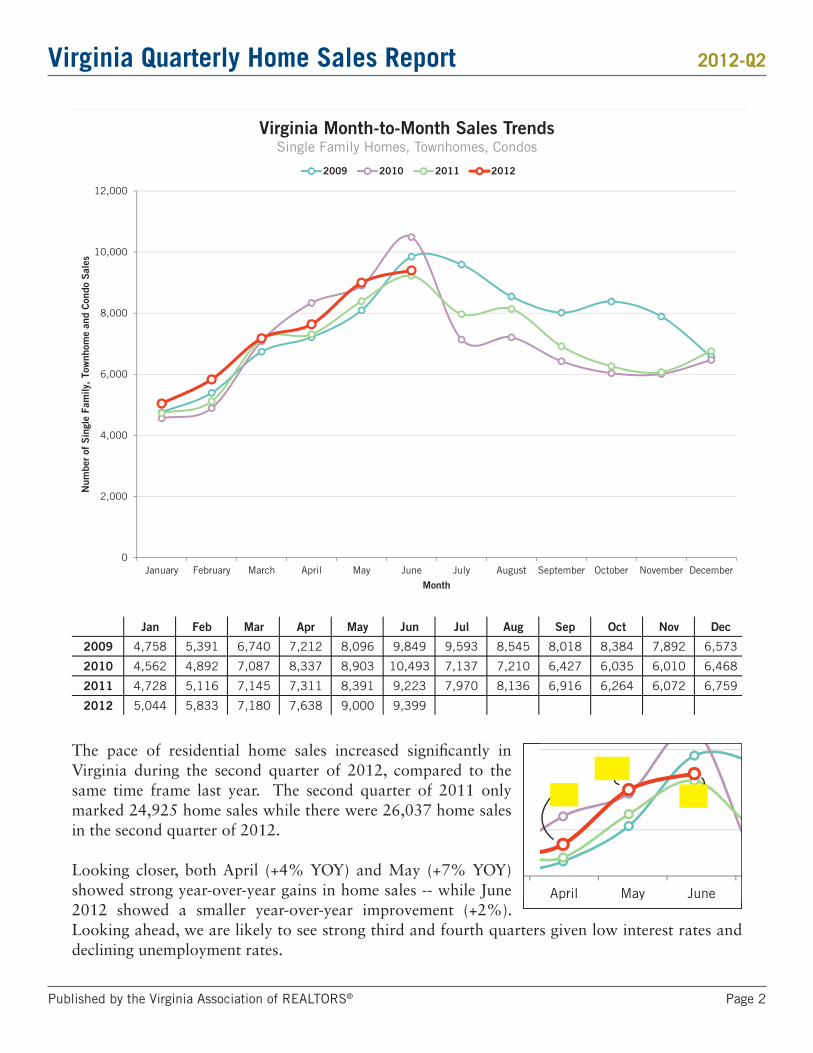
Virginia Month-to-Month Sales TrendsSingle Family Homes, Townhomes, Condos
2009 2010 2011 2012
Jan Feb Mar Apr May Jun Jul Aug Sep Oct Nov Dec
2009 4,758 5,391 6,740 7,212 8,096 9,849 9,593 8,545 8,018 8,384 7,892 6,573
2010 4,562 4,892 7,087 8,337 8,903 10,493 7,137 7,210 6,427 6,035 6,010 6,468
2011 4,728 5,116 7,145 7,311 8,391 9,223 7,970 8,136 6,916 6,264 6,072 6,759
2012 5,044 5,833 7,180 7,638 9,000 9,399
The pace of residential home sales increased significantly in Virginia during the second quarter of 2012, compared to the same time frame last year. The second quarter of 2011 only marked 24,925 home sales while there were 26,037 home sales in the second quarter of 2012.
Looking closer, both April (+4% YOY) and May (+7% YOY) showed strong year-over-year gains in home sales -- while June 2012 showed a smaller year-over-year improvement (+2%). Looking ahead, we are likely to see strong third and fourth quarters given low interest rates and declining unemployment rates.
0
2,000
4,000
6,000
8,000
10,000
12,000
January February March April May June July August September October November December
Num
ber
of S
ingl
e Fa
mily
, To
wnh
ome
and
Con
do S
ales
Month
Virginia Month-to-Month Sales TrendsSingle Family Homes, Townhomes, Condos
2009 2010 2011 2012
0
2,000
4,000
6,000
8,000
10,000
12,000
January February March April May June July August September October November December
Num
ber
of S
ingl
e Fa
mily
, To
wnh
ome
and
Con
do S
ales
Month
Virginia Month-to-Month Sales TrendsSingle Family Homes, Townhomes, Condos
2009 2010 2011 2012
+4%YOY
+2%YOY
+7%YOY
2012-Q2Virginia Quarterly Home Sales Report
Published by the Virginia Association of REALTORS® Page 3
25,157
26,156
22,849
16,541
27,733
20,774
18,513
16,930
23,37023,022
19,095
18,057
26,037
10,000
12,000
14,000
16,000
18,000
20,000
22,000
24,000
26,000
28,000
30,000
2009-Q2 2009-Q3 2009-Q4 2010-Q1 2010-Q2 2010-Q3 2010-Q4 2011-Q1 2011-Q2 2011-Q3 2011-Q4 2012-Q1 2012-Q2
Num
ber
of S
ingl
e Fa
mily
, To
wnh
ome
and
Con
do S
ales
Quarter
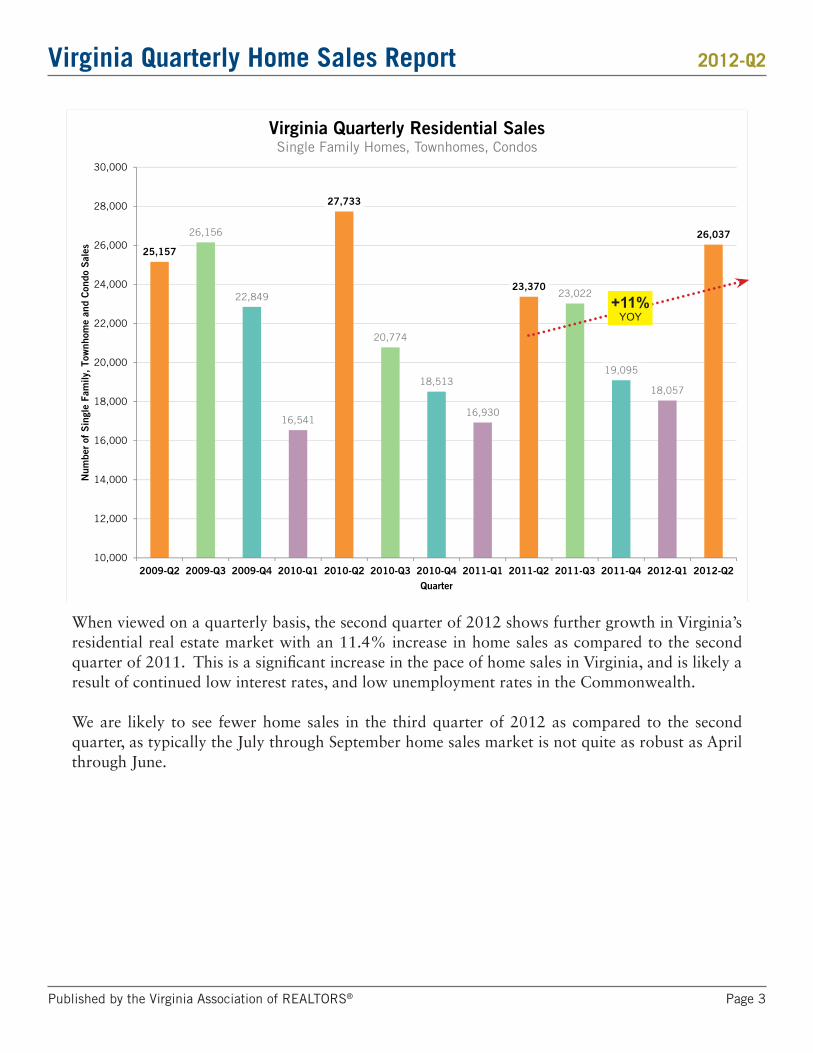
Virginia Quarterly Residential SalesSingle Family Homes, Townhomes, Condos
When viewed on a quarterly basis, the second quarter of 2012 shows further growth in Virginia’s residential real estate market with an 11.4% increase in home sales as compared to the second quarter of 2011. This is a significant increase in the pace of home sales in Virginia, and is likely a result of continued low interest rates, and low unemployment rates in the Commonwealth.
We are likely to see fewer home sales in the third quarter of 2012 as compared to the second quarter, as typically the July through September home sales market is not quite as robust as April through June.
+11%YOY

2012-Q2Virginia Quarterly Home Sales Report
Published by the Virginia Association of REALTORS® Page 4
88,127 87,843
91,051 90,703
93,279
87,897
83,561 83,950
79,587
81,835 82,41783,544
86,211
50,000
55,000
60,000
65,000
70,000
75,000
80,000
85,000
90,000
95,000
100,000
2009-Q2 2009-Q3 2009-Q4 2010-Q1 2010-Q2 2010-Q3 2010-Q4 2011-Q1 2011-Q2 2011-Q3 2011-Q4 2012-Q1 2012-Q2
Num
ber
of S
ingl
e Fa
mily
, To
wnh
ome
and
Con
do S
ales
Quarter
Virginia Annualized Residential SalesSingle Family Homes, Townhomes, Condos
When examining long term trends, it seems quite certain that we are finally seeing lasting improvement in the pace of home sales in Virginia. We have now seen steady increases in the annualized pace of home sales in Virginia for five quarters in a row.
Each data point on the graph above includes 12 months of home sales data, thus the 2012-Q2 figure (86,211 sales) includes home sales from 2011-Q3 through 2012-Q2. Using this rolling sum of home sales can provide a clearer indicator of long-term trends in Virginia’s housing market.
While this graph can take quite a long time to reveal market trends, when it finally does (now) there can be much greater certainty as to the conclusions.
Tax Credit BoostPost Tax-Credit Decline
Signs of Recovery!

2012-Q2Virginia Quarterly Home Sales Report
Published by the Virginia Association of REALTORS® Page 5
Region 2011-Q2 2012-Q2 Change
Central Valley 1,591 1,415 -11.1%
Central Virginia 3,700 4,057 +9.6%
Hampton Roads / Chesapeake Bay 5,755 5,843 +1.5%
Northern Virginia 11,215 12,145 +8.3%
Roanoke / Lynchburg / Blacksburg 1,844 1,878 +1.8%
Southside Virginia 486 391 -19.5%
Southwest Virginia 330 304 -7.9%
Central Valley-11.1%
Northern Virginia+8.3%
Roanoke / Lynchburg / Blacksburg+1.8%
Southwest Virginia-7.9% Southside Virginia
-19.5%
Hampton Roads /Chesapeake Bay
+1.5%
Central Virginia+9.6%
Regional Changes in Sales2011-Q2 vs. 2012-Q2 Units
The housing recovery varies regionally in Virginia, or at least when viewed through the lense of year-over-year changes in the pace of home sales. The two most highly populated areas of the Commonwealth (Northern Virginia and Central Virginia) both experienced significant increases in the pace of home sales over the past year (+8.3%, +9.6%). Other regions experienced anywhere from a 7.9% to 19.5% decline in the pace of home sales.
2012-Q2Virginia Quarterly Home Sales Report
Published by the Virginia Association of REALTORS® Page 6
$2
34
,00
0
$2
35
,00
0
$2
25
,00
0
$2
25
,00
0
$2
39
,90
0
$2
49
,90
0
$2
32
,00
0
$2
10
,00
0 $2
32
,50
0
$2
35
,00
0
$2
20
,00
0
$2
15
,00
0
$2
49
,90
0
$100,000
$150,000
$200,000
$250,000
$300,000
2009-Q2 2009-Q3 2009-Q4 2010-Q1 2010-Q2 2010-Q3 2010-Q4 2011-Q1 2011-Q2 2011-Q3 2011-Q4 2012-Q1 2012-Q2
Med
ian
Sal
es P
rice
Quarter
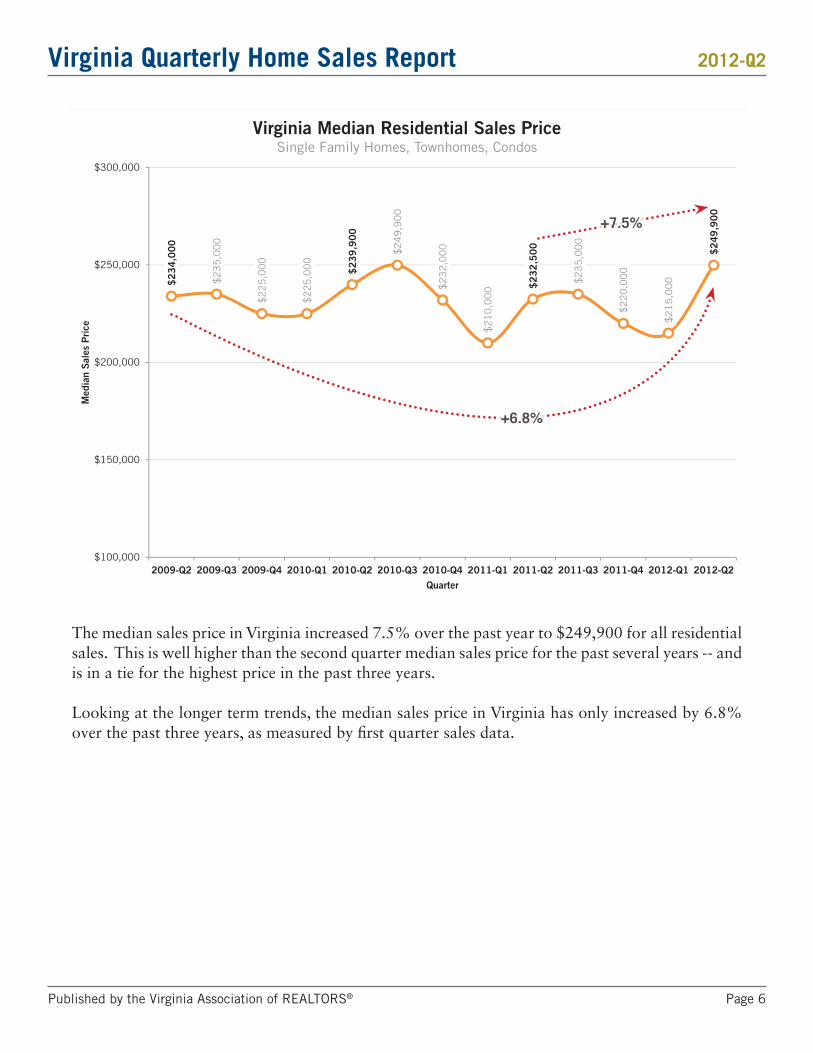
Virginia Median Residential Sales PriceSingle Family Homes, Townhomes, Condos
The median sales price in Virginia increased 7.5% over the past year to $249,900 for all residential sales. This is well higher than the second quarter median sales price for the past several years -- and is in a tie for the highest price in the past three years.
Looking at the longer term trends, the median sales price in Virginia has only increased by 6.8% over the past three years, as measured by first quarter sales data.
+6.8%
+7.5%
2012-Q2Virginia Quarterly Home Sales Report
Published by the Virginia Association of REALTORS® Page 7
Region 2011-Q2 2012-Q2 Change
Central Valley $212,000 $210,000 -0.9%
Central Virginia $179,900 $185,000 +2.8%
Hampton Roads / Chesapeake Bay $198,000 $205,000 +3.5%
Northern Virginia $332,136 $354,000 +6.6%
Roanoke / Lynchburg / Blacksburg $148,900 $155,000 +4.1%
Southside Virginia $74,450 $88,250 +18.5%
Southwest Virginia $105,500 $115,000 +9.0%
Roanoke / Lynchburg / Blacksburg+4.1%
Central Valley-0.9%
Northern Virginia+6.6%
Southwest Virginia+9.0% Southside Virginia
+18.5%
Hampton Roads /Chesapeake Bay
+3.5%
Central Virginia+2.8%
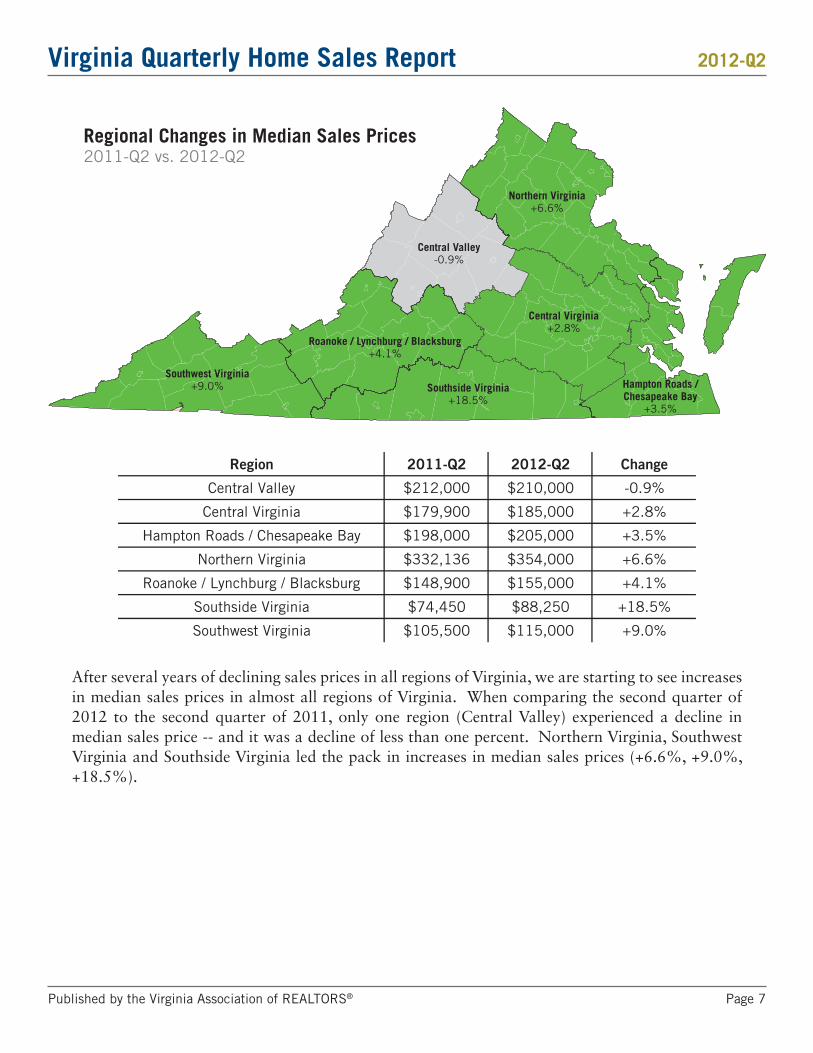
Regional Changes in Median Sales Prices2011-Q2 vs. 2012-Q2
After several years of declining sales prices in all regions of Virginia, we are starting to see increases in median sales prices in almost all regions of Virginia. When comparing the second quarter of 2012 to the second quarter of 2011, only one region (Central Valley) experienced a decline in median sales price -- and it was a decline of less than one percent. Northern Virginia, Southwest Virginia and Southside Virginia led the pack in increases in median sales prices (+6.6%, +9.0%, +18.5%).

2012-Q2Virginia Quarterly Home Sales Report
Published by the Virginia Association of REALTORS® Page 8
7,182
7,625
6,411
4,553
8,198
6,402
5,433
4,496
7,192
6,789
5,298
4,855
8,033
2,000
3,000
4,000
5,000
6,000
7,000
8,000
9,000
2009-Q2 2009-Q3 2009-Q4 2010-Q1 2010-Q2 2010-Q3 2010-Q4 2011-Q1 2011-Q2 2011-Q3 2011-Q4 2012-Q1 2012-Q2
Mill
ions
of
Dol
lars
of
Res
iden
tial
Sal
es
Quarter
Virginia Quarterly Residential Sales VolumeSingle Family Homes, Townhomes, Condos
This graph illustrates the number of millions of dollars of real estate sold during each quarter over the past three years. The volume of real estate sold in the second quarter of 2012 ($8.0B) marks an 11.7% increase from the second quarter of 2011 ($7.2B). This is only the second quarterly increase seen in recent years in sales volume in Virginia -- the result of both increased sales pace and stabilizing prices.
2012-Q2Virginia Quarterly Home Sales Report
Published by the Virginia Association of REALTORS® Page 9
96
8784
86
7982
91
104
94 93
100104
84
0
20
40
60
80
100
120
2009-Q2 2009-Q3 2009-Q4 2010-Q1 2010-Q2 2010-Q3 2010-Q4 2011-Q1 2011-Q2 2011-Q3 2011-Q4 2012-Q1 2012-Q2
Ave
rage
Day
s O
n M
arke
t
Quarter
Virginia Average Days On MarketSingle Family Homes, Townhomes, Condos
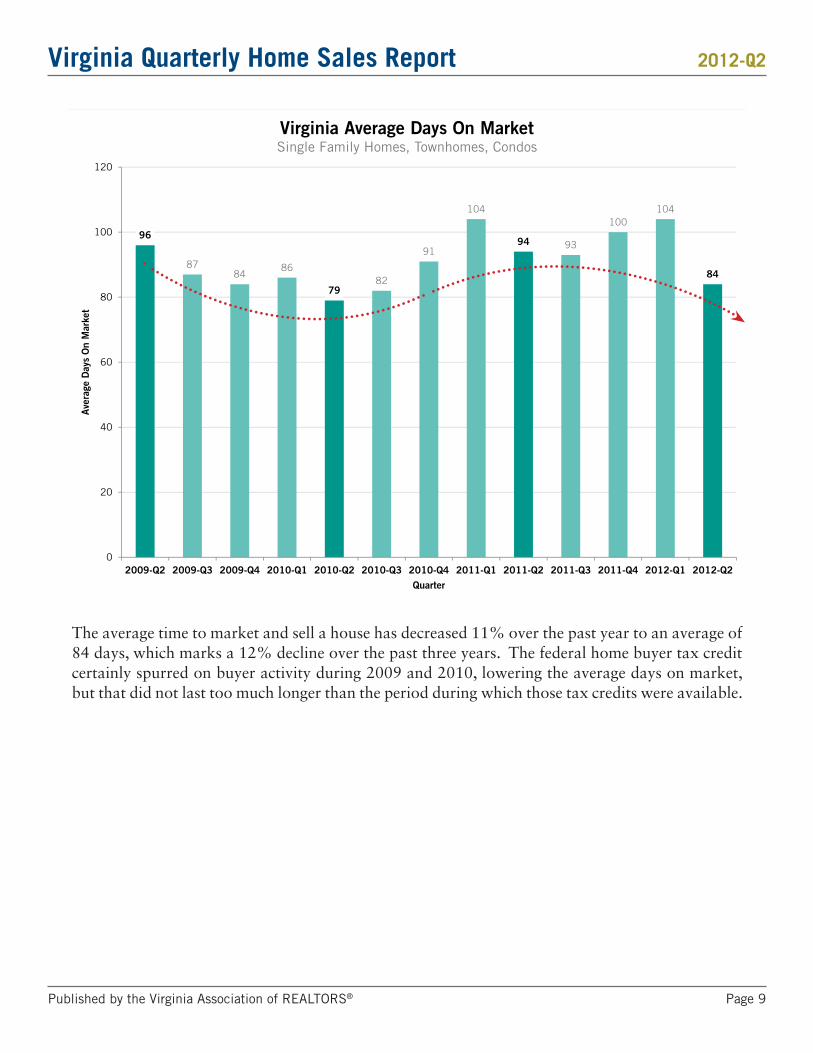
The average time to market and sell a house has decreased 11% over the past year to an average of 84 days, which marks a 12% decline over the past three years. The federal home buyer tax credit certainly spurred on buyer activity during 2009 and 2010, lowering the average days on market, but that did not last too much longer than the period during which those tax credits were available.

2012-Q2Virginia Quarterly Home Sales Report
Published by the Virginia Association of REALTORS® Page 10
3,012
6,956
5,886
3,936
2,309
2,840
691
299
68
40
3,522
7,053
5,456
3,500
1,974
2,387
665
278
60
30
0 500 1,000 1,500 2,000 2,500 3,000 3,500 4,000 4,500 5,000 5,500 6,000 6,500 7,000 7,500 8,000
0 - $100K
$100K - $200K
$200K - $300K
$300K - $400K
$400K - $500K
$500K - $750K
$750K - $1M
$1M - $1.5M
$1.5M - $2M
$2M +
Number of Single Family, Townhome and Condo Sales
Pri
ce R
ange
Virginia Price Distribution Of Residential Home SalesSingle Family Homes, Townhomes, Condos
2011-Q2 2012-Q2
+33%
+13%
+8%
+4%
+19%
+17%
+12%
+8%
-14%
-1%
Home sales increased in nearly every price range during the second quarter of 2012 in Virginia, as compared to the second quarter of 2011. Of note, the most affordable price range (under $100K) was the only price range to experience a significant decline in sales pace. This may be the result of overall increases in median sales prices which would be moving some under $100K properties up into the $100K - $200K price range.
2012-Q2Virginia Quarterly Home Sales Report
Published by the Virginia Association of REALTORS® Page 11
Region 2012-Q1 2012-Q2 Change
Central Valley 99 92 -7%
Central Virginia 435 408 -6%
Hampton Roads / Chesapeake Bay 582 551 -5%
Northern Virginia 1,159 974 -16%
Roanoke / Lynchburg / Blacksburg 107 157 +47%
Southside Virginia 53 55 +4%
Southwest Virginia 21 32 +52%
All of Virginia 2,456 2,269 -8%
Central Valley-7%
Northern Virginia-16%
Roanoke / Lynchburg / Blacksburg+47%
Southwest Virginia+52% Southside Virginia
+4%
Hampton Roads /Chesapeake Bay
-5%
Central Virginia-6%
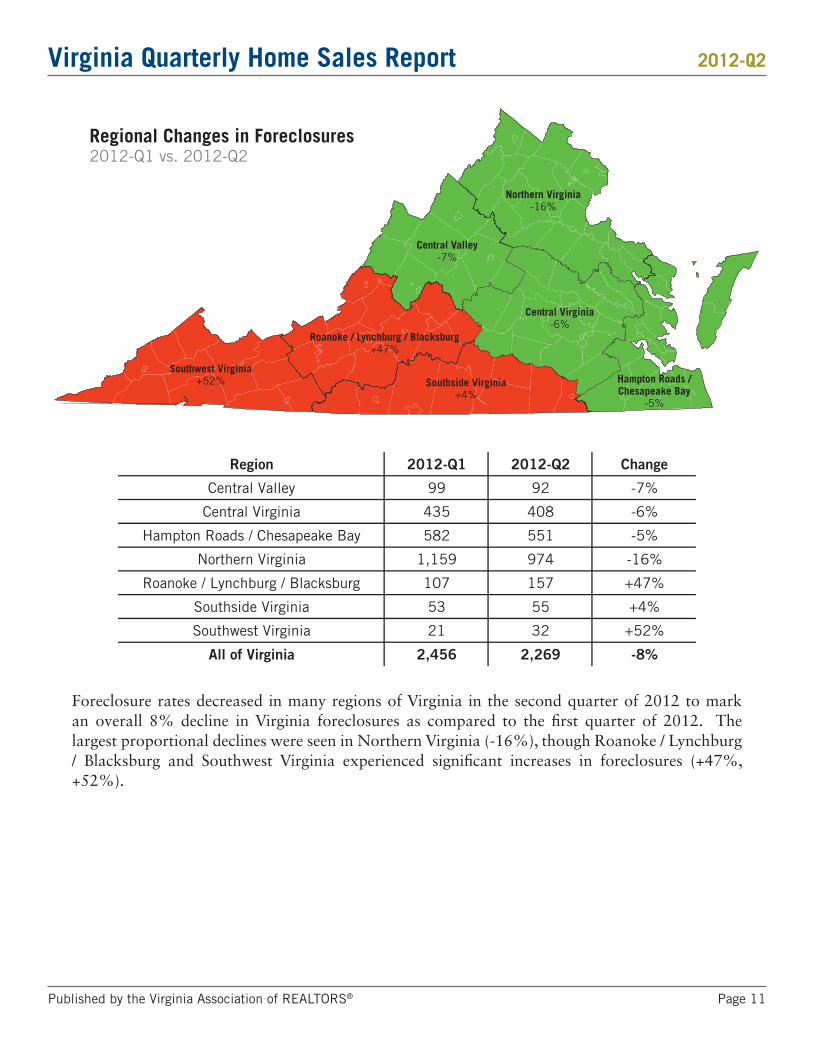
Regional Changes in Foreclosures2012-Q1 vs. 2012-Q2
Foreclosure rates decreased in many regions of Virginia in the second quarter of 2012 to mark an overall 8% decline in Virginia foreclosures as compared to the first quarter of 2012. The largest proportional declines were seen in Northern Virginia (-16%), though Roanoke / Lynchburg / Blacksburg and Southwest Virginia experienced significant increases in foreclosures (+47%, +52%).

2012-Q2Virginia Quarterly Home Sales Report
Published by the Virginia Association of REALTORS® Page 12
8,390 9,000
391,000444,000
0
100,000
200,000
300,000
400,000
500,000
600,000
0
2,000
4,000
6,000
8,000
10,000
12,000
14,000
16,000
May-11 Jun-11 Jul-11 Aug-11 Sep-11 Oct-11 Nov-11 Dec-11 Jan-12 Feb-12 Mar-12 Apr-12 May-12
Monthly Residential SalesVIRGINIA (All MLS-Reported Home Sales) UNITED STATES (Existing Home Sales)
$225,000
$249,000
$169,300$182,600
$100,000
$120,000
$140,000
$160,000
$180,000
$200,000
$220,000
$240,000
$50,000
$100,000
$150,000
$200,000
$250,000
$300,000
May-11 Jun-11 Jul-11 Aug-11 Sep-11 Oct-11 Nov-11 Dec-11 Jan-12 Feb-12 Mar-12 Apr-12 May-12
Monthly Residential Median Sales PriceVIRGINIA (All MLS-Reported Home Sales) UNITED STATES (Existing Home Sales)
Median home prices have increased in both Virginia and the United States over the past year (May 2011 to May 2012), though home values increased a bit more in Virginia (+11% during the past year) than in the entire United States (+8%).
The monthly variation in the pace of home sales is relatively consistent in Virginia as compared to the entire United States. May 2012 home sales increased 13% in the United States (existing home sales only) as compared to May 2011, while Virginia experienced a 7% increase.

2012-Q2Virginia Quarterly Home Sales Report
Published by the Virginia Association of REALTORS® Page 13
Unemployment Rates By Stateseasonally adjusted, May 2012
(U.S. rate = 8.2 percent)
14.0% and over
12.0% to 13.9%
10.0% to 11.9%
8.0% to 9.9%
6 0% t 7 9%
SOURCE: Bureau of Labor Statistics Local Area Unemployment Statistics
6.0% to 7.9%
4.0% to 5.9%
3.9% or below
7.2%6.9% 7.0%
7.4%7.0%
6.5% 6.4% 6.3%6.0%
6.5%6.1%
5.6% 5.6%
4%5%5%6%6%7%7%8%8%
2009-Q2 2009-Q3 2009-Q4 2010-Q1 2010-Q2 2010-Q3 2010-Q4 2011-Q1 2011-Q2 2011-Q3 2011-Q4 2012-Q1 2012-Q2
Virginia Unemployment RateSource: Bureau of Labor & Statistics
Virginia’s unemployment rate is at its lowest levels (5.6%) in more than three years, and Virginia currently has the 9th lowest unemployment rate in the country. It is encouraging news that an increasing number of Virginians are employed, as this bodes well for further stability and recovery in Virginia’s housing market.
2012-Q2 unemployment rate based on preliminary May 2012 data.
2012-Q2Virginia Quarterly Home Sales Report
Published by the Virginia Association of REALTORS® Page 14
5.42%
5.06%4.93% 4.97%
4.74%
4.35%
4.71%4.86%
4.51%
4.01% 3.95% 3.99%
3.66%
3.0%
3.5%
4.0%
4.5%
5.0%
5.5%
6.0%
2009-Q2 2009-Q3 2009-Q4 2010-Q1 2010-Q2 2010-Q3 2010-Q4 2011-Q1 2011-Q2 2011-Q3 2011-Q4 2012-Q1 2012-Q2
Average 30-Year Mortgage Interest RatesSource: FreddieMac
4.9%
4.5% 4.4% 4.3%4.2%
3.8%4.1% 4.1%
3.7%
3.3%3.0%
3.2%2.9%
2.0%
2.5%
3.0%
3.5%
4.0%
4.5%
5.0%
5.5%
2009-Q2 2009-Q3 2009-Q4 2010-Q1 2010-Q2 2010-Q3 2010-Q4 2011-Q1 2011-Q2 2011-Q3 2011-Q4 2012-Q1 2012-Q2
Average 15-Year Mortgage Interest RatesSource: FreddieMac
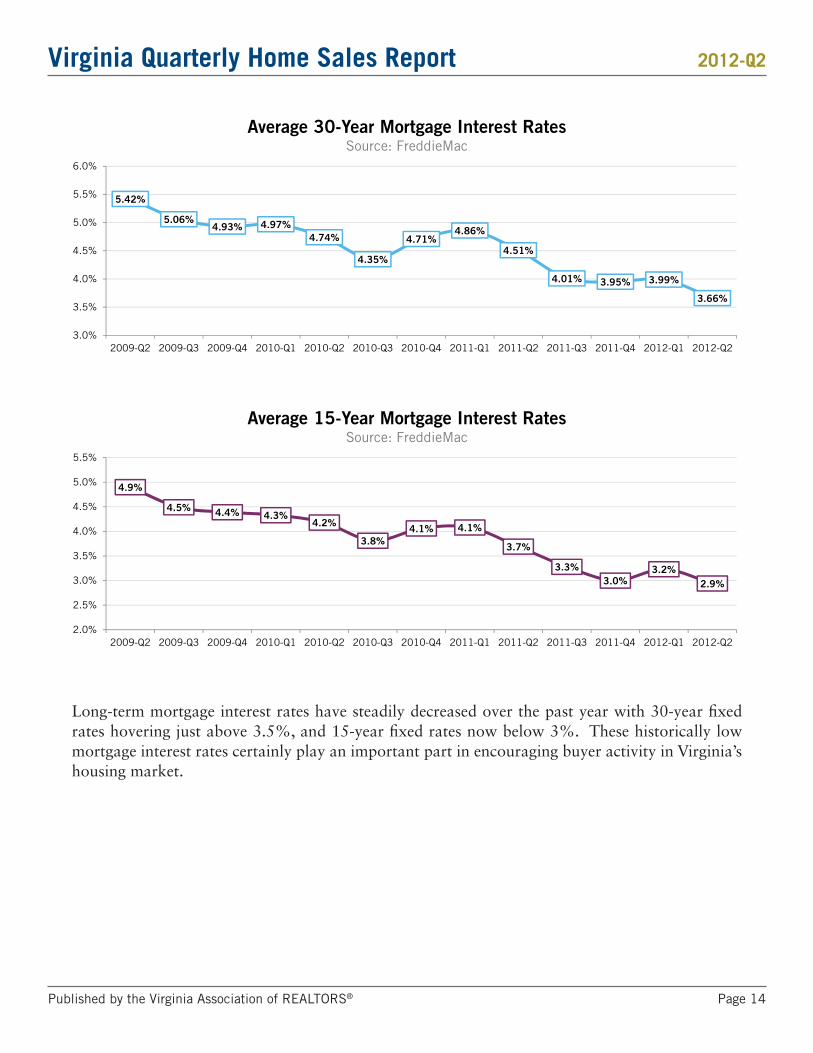
Long-term mortgage interest rates have steadily decreased over the past year with 30-year fixed rates hovering just above 3.5%, and 15-year fixed rates now below 3%. These historically low mortgage interest rates certainly play an important part in encouraging buyer activity in Virginia’s housing market.
2012-Q2Virginia Quarterly Home Sales Report
Published by the Virginia Association of REALTORS® Page 15
The Virginia Association of REALTORS® (VAR) is the business advocate for real estate professionals in Virginia. VAR represents more than 29,000 REALTORS active in all phases of real estate brokerage, management, development and appraisal. Our mission is to enhance our membership’s ability to achieve business success.
All inquiries regarding this report should be directed to:
Stacey Ricks, Director of Public RelationsVirginia Association of REALTORS®10231 Telegraph Road, Glen Allen, VA 23059(804) 249-5716 [email protected]/HomeSales
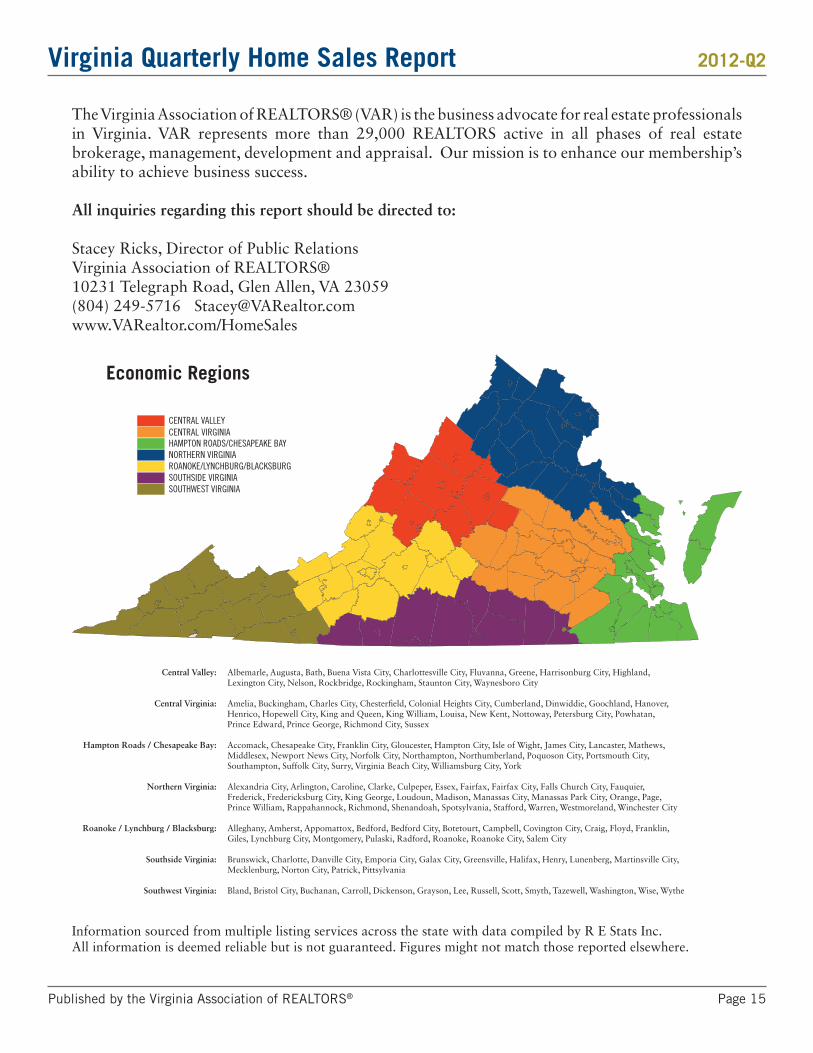
Economic Regions
Central Valley:
Central Virginia:
Hampton Roads / Chesapeake Bay:
Northern Virginia:
Roanoke / Lynchburg / Blacksburg:
Southside Virginia:
Southwest Virginia:
Albemarle, Augusta, Bath, Buena Vista City, Charlottesville City, Fluvanna, Greene, Harrisonburg City, Highland, Lexington City, Nelson, Rockbridge, Rockingham, Staunton City, Waynesboro City
Amelia, Buckingham, Charles City, Chester�eld, Colonial Heights City, Cumberland, Dinwiddie, Goochland, Hanover, Henrico, Hopewell City, King and Queen, King William, Louisa, New Kent, Nottoway, Petersburg City, Powhatan, Prince Edward, Prince George, Richmond City, Sussex
Accomack, Chesapeake City, Franklin City, Gloucester, Hampton City, Isle of Wight, James City, Lancaster, Mathews, Middlesex, Newport News City, Norfolk City, Northampton, Northumberland, Poquoson City, Portsmouth City, Southampton, Suffolk City, Surry, Virginia Beach City, Williamsburg City, York
Alexandria City, Arlington, Caroline, Clarke, Culpeper, Essex, Fairfax, Fairfax City, Falls Church City, Fauquier, Frederick, Fredericksburg City, King George, Loudoun, Madison, Manassas City, Manassas Park City, Orange, Page, Prince William, Rappahannock, Richmond, Shenandoah, Spotsylvania, Stafford, Warren, Westmoreland, Winchester City
Alleghany, Amherst, Appomattox, Bedford, Bedford City, Botetourt, Campbell, Covington City, Craig, Floyd, Franklin, Giles, Lynchburg City, Montgomery, Pulaski, Radford, Roanoke, Roanoke City, Salem City
Brunswick, Charlotte, Danville City, Emporia City, Galax City, Greensville, Halifax, Henry, Lunenberg, Martinsville City, Mecklenburg, Norton City, Patrick, Pittsylvania
Bland, Bristol City, Buchanan, Carroll, Dickenson, Grayson, Lee, Russell, Scott, Smyth, Tazewell, Washington, Wise, Wythe
Information sourced from multiple listing services across the state with data compiled by R E Stats Inc.All information is deemed reliable but is not guaranteed. Figures might not match those reported elsewhere.