q2 fy18 investor presentation -...
TRANSCRIPT

Q2 FY18
INVESTOR PRESENTATION
November 2017
Q2 FY18 RESULTS UPDATE
3
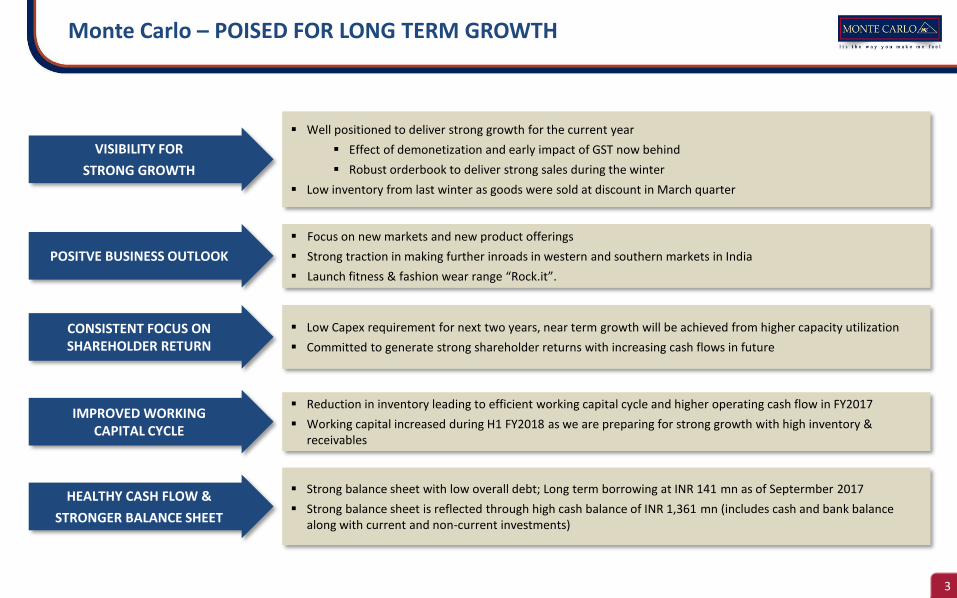
Monte Carlo – POISED FOR LONG TERM GROWTH
▪ Well positioned to deliver strong growth for the current year
▪ Effect of demonetization and early impact of GST now behind
▪ Robust orderbook to deliver strong sales during the winter
▪ Low inventory from last winter as goods were sold at discount in March quarter
▪ Reduction in inventory leading to efficient working capital cycle and higher operating cash flow in FY2017
▪ Working capital increased during H1 FY2018 as we are preparing for strong growth with high inventory & receivables
▪ Strong balance sheet with low overall debt; Long term borrowing at INR 141 mn as of Septermber 2017
▪ Strong balance sheet is reflected through high cash balance of INR 1,361 mn (includes cash and bank balance along with current and non-current investments)
▪ Focus on new markets and new product offerings
▪ Strong traction in making further inroads in western and southern markets in India
▪ Launch fitness & fashion wear range “Rock.it”.
▪ Low Capex requirement for next two years, near term growth will be achieved from higher capacity utilization
▪ Committed to generate strong shareholder returns with increasing cash flows in future
VISIBILITY FOR
STRONG GROWTH
IMPROVED WORKING CAPITAL CYCLE
HEALTHY CASH FLOW &
STRONGER BALANCE SHEET
CONSISTENT FOCUS ON SHAREHOLDER RETURN
POSITVE BUSINESS OUTLOOK
4
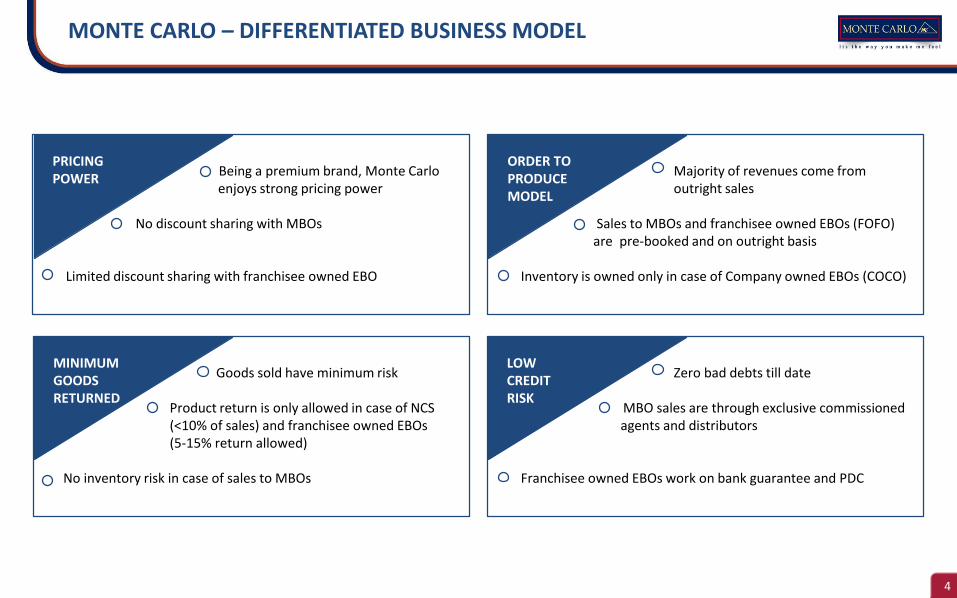
Majority of revenues come from outright sales
basis Sales to MBOs and franchisee owned EBOs (FOFO)
are pre-booked and on outright basis
Inventory is owned only in case of Company owned EBOs (COCO)
ORDER TO PRODUCE MODEL
Zero bad debts till date
MBO sales are through exclusive commissioned agents and distributors
Franchisee owned EBOs work on bank guarantee and PDC
LOW CREDITRISK
Being a premium brand, Monte Carlo enjoys strong pricing power
No discount sharing with MBOs
Limited discount sharing with franchisee owned EBO
PRICINGPOWER
Goods sold have minimum riskas
Product return is only allowed in case of NCS(<10% of sales) and franchisee owned EBOs (5-15% return allowed)
No inventory risk in case of sales to MBOs
MINIMUM GOODS RETURNED
MONTE CARLO – DIFFERENTIATED BUSINESS MODEL

5
Note – *Previous year figures have been recast as per Indian Accounting Standards to make them comparable with current year figures# EBIDTA W/O Other Income, Cash PAT = PAT + Depreciation* Revenues includes sale of raw materials (Fabric & Yarn) but doesn’t include other income. Fabric & Yarn sales: Q2 FY17 – Rs 253 Mn, Q2 FY18 – Rs 313 Mn &
H1 FY17 – Rs 376.8 Mn, H1 FY18 – Rs 432 Mn
1,2601,377
Q2 FY17 Q2 FY18
246 25920.0% 18.8%
Q2 FY17 Q2 FY18
EBIDTA EBIDTA Margin %
135 156
196 20810.9% 11.3%
Q2 FY17 Q2 FY18
PAT Cash PAT PAT Margin %
Q2 FY18 YoY ANALYSIS
REVENUES * EBIDTA & EBIDTA MARGIN% # PAT, CASH PAT & PAT MARGIN %
In Rs Mn
Q2 FY18 – RESULT HIGHLIGHTS
H1 FY18 YoY ANALYSIS
REVENUES * EBIDTA & EBIDTA MARGIN% # PAT, CASH PAT & PAT MARGIN %
In Rs Mn
2,017 2,042
H1 FY17 H1 FY18
345 34317.1% 16.8%
H1 FY17 H1 FY18
EBIDTA EBIDTA Margin %
167 208
288 3128.3% 10.2%
H1 FY17 H1 FY18
PAT Cash PAT PAT Margin %
MBO – Multi Brand Outlet, EBO – Exclusive Brand OutletCOCO – Company own Company operated, FOFO – Franchise own Franchise operated
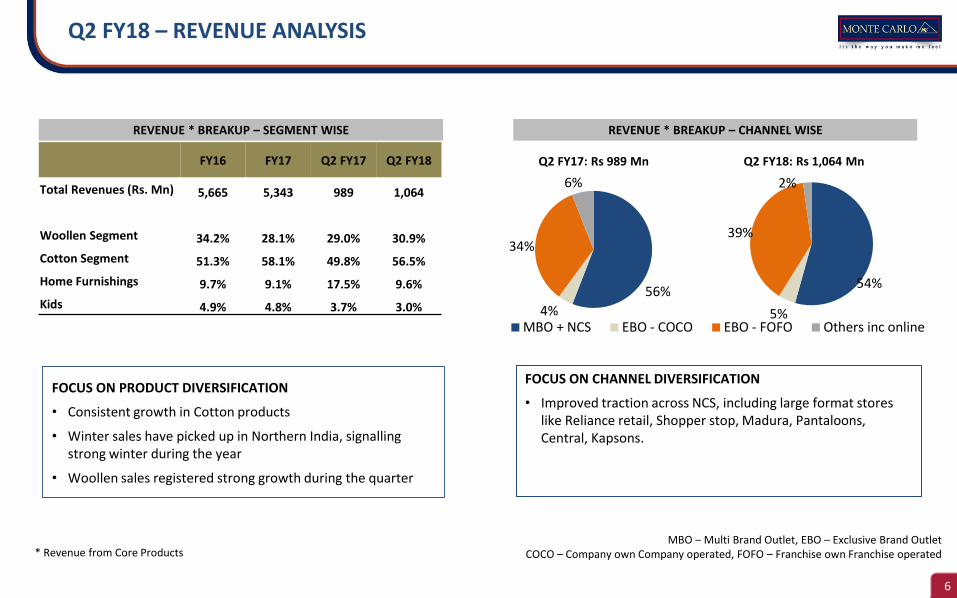
REVENUE * BREAKUP – SEGMENT WISE
56%
4%
34%
6%
MBO + NCS EBO - COCO EBO - FOFO Others inc online
REVENUE * BREAKUP – CHANNEL WISE
54%
5%
39%
2%
Q2 FY17: Rs 989 Mn
* Revenue from Core Products
FOCUS ON CHANNEL DIVERSIFICATION
• Improved traction across NCS, including large format stores like Reliance retail, Shopper stop, Madura, Pantaloons, Central, Kapsons.
Q2 FY18 – REVENUE ANALYSIS
FOCUS ON PRODUCT DIVERSIFICATION
• Consistent growth in Cotton products
• Winter sales have picked up in Northern India, signalling strong winter during the year
• Woollen sales registered strong growth during the quarter
6
Q2 FY18: Rs 1,064 MnFY16 FY17 Q2 FY17 Q2 FY18
Total Revenues (Rs. Mn) 5,665 5,343 989 1,064
Woollen Segment 34.2% 28.1% 29.0% 30.9%
Cotton Segment 51.3% 58.1% 49.8% 56.5%
Home Furnishings 9.7% 9.1% 17.5% 9.6%
Kids 4.9% 4.8% 3.7% 3.0%

52%25%
9%
5%
9%
North East Central South West
FOCUS ON REGIONAL DIVERSIFICATION
• Strategic focus to build a pan India presence
• Central region is contributing 12% of the overall sales for the quarter
REVENUE * BREAKUP – REGION WISE
54%25%
12%
4% 6%
Q2 FY17: Rs 989 Mn Q2 FY18: Rs 1,064 Mn
* Revenue from Core Products
Q2 FY18 – REVENUE ANALYSIS
7
8
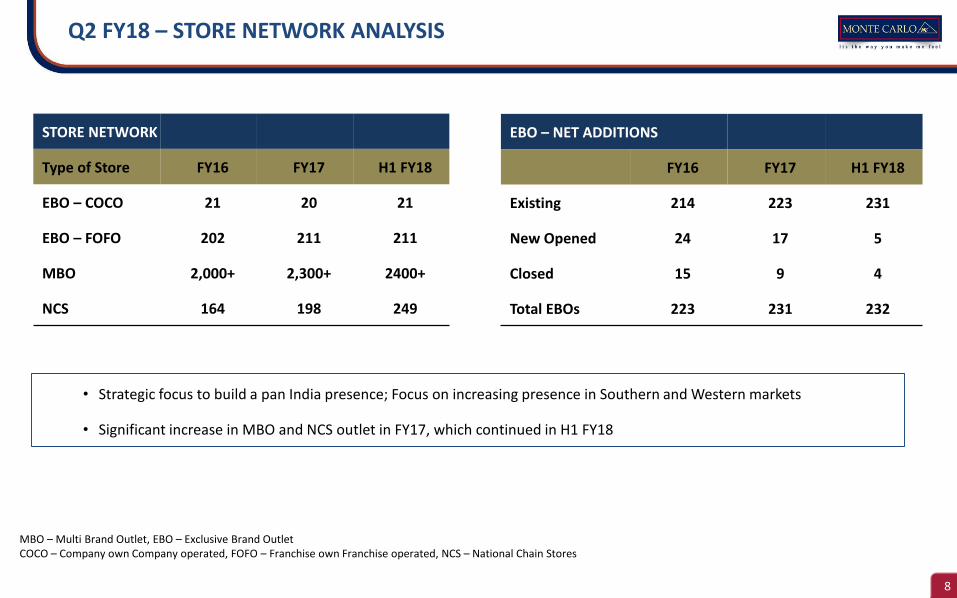
• Strategic focus to build a pan India presence; Focus on increasing presence in Southern and Western markets
• Significant increase in MBO and NCS outlet in FY17, which continued in H1 FY18
STORE NETWORK
Type of Store FY16 FY17 H1 FY18
EBO – COCO 21 20 21
EBO – FOFO 202 211 211
MBO 2,000+ 2,300+ 2400+
NCS 164 198 249
EBO – NET ADDITIONS
FY16 FY17 H1 FY18
Existing 214 223 231
New Opened 24 17 5
Closed 15 9 4
Total EBOs 223 231 232
MBO – Multi Brand Outlet, EBO – Exclusive Brand OutletCOCO – Company own Company operated, FOFO – Franchise own Franchise operated, NCS – National Chain Stores
Q2 FY18 – STORE NETWORK ANALYSIS
9
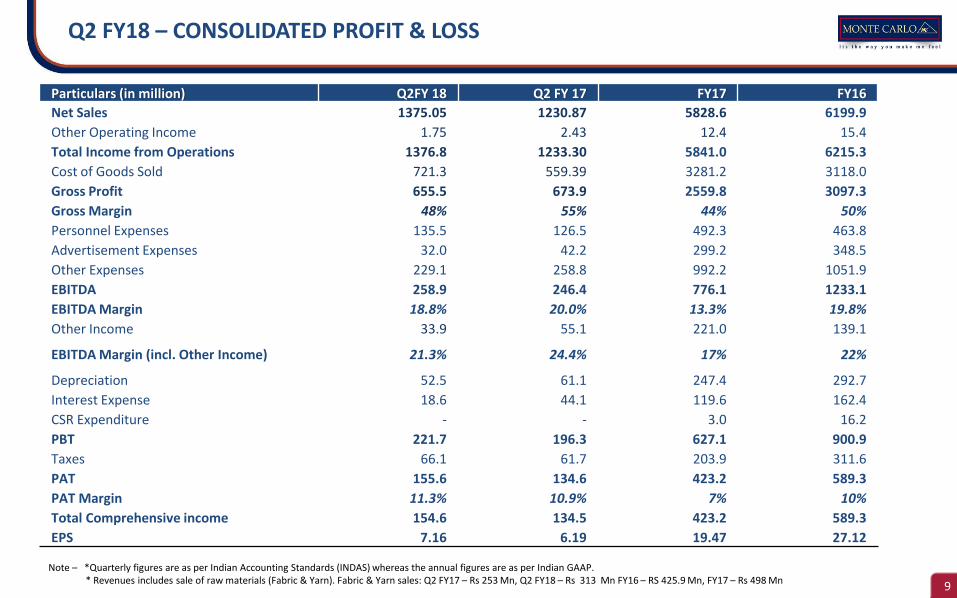
Q2 FY18 – CONSOLIDATED PROFIT & LOSS
Note – *Quarterly figures are as per Indian Accounting Standards (INDAS) whereas the annual figures are as per Indian GAAP.* Revenues includes sale of raw materials (Fabric & Yarn). Fabric & Yarn sales: Q2 FY17 – Rs 253 Mn, Q2 FY18 – Rs 313 Mn FY16 – RS 425.9 Mn, FY17 – Rs 498 Mn
Particulars (in million) Q2FY 18 Q2 FY 17 FY17 FY16
Net Sales 1375.05 1230.87 5828.6 6199.9
Other Operating Income 1.75 2.43 12.4 15.4
Total Income from Operations 1376.8 1233.30 5841.0 6215.3
Cost of Goods Sold 721.3 559.39 3281.2 3118.0
Gross Profit 655.5 673.9 2559.8 3097.3
Gross Margin 48% 55% 44% 50%
Personnel Expenses 135.5 126.5 492.3 463.8
Advertisement Expenses 32.0 42.2 299.2 348.5
Other Expenses 229.1 258.8 992.2 1051.9
EBITDA 258.9 246.4 776.1 1233.1
EBITDA Margin 18.8% 20.0% 13.3% 19.8%
Other Income 33.9 55.1 221.0 139.1
EBITDA Margin (incl. Other Income) 21.3% 24.4% 17% 22%
Depreciation 52.5 61.1 247.4 292.7
Interest Expense 18.6 44.1 119.6 162.4
CSR Expenditure - - 3.0 16.2
PBT 221.7 196.3 627.1 900.9
Taxes 66.1 61.7 203.9 311.6
PAT 155.6 134.6 423.2 589.3
PAT Margin 11.3% 10.9% 7% 10%
Total Comprehensive income 154.6 134.5 423.2 589.3
EPS 7.16 6.19 19.47 27.12
10
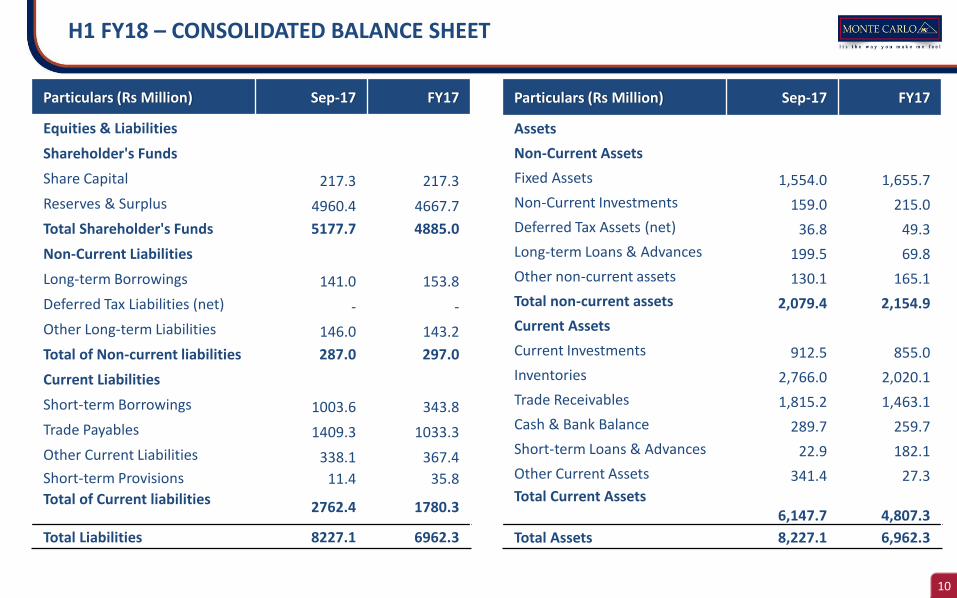
H1 FY18 – CONSOLIDATED BALANCE SHEET
Particulars (Rs Million) Sep-17 FY17
Equities & Liabilities
Shareholder's Funds
Share Capital 217.3 217.3
Reserves & Surplus 4960.4 4667.7
Total Shareholder's Funds 5177.7 4885.0
Non-Current Liabilities
Long-term Borrowings 141.0 153.8
Deferred Tax Liabilities (net) - -
Other Long-term Liabilities 146.0 143.2
Total of Non-current liabilities 287.0 297.0
Current Liabilities
Short-term Borrowings 1003.6 343.8
Trade Payables 1409.3 1033.3
Other Current Liabilities 338.1 367.4
Short-term Provisions 11.4 35.8
Total of Current liabilities 2762.4 1780.3
Total Liabilities 8227.1 6962.3
Particulars (Rs Million) Sep-17 FY17
Assets
Non-Current Assets
Fixed Assets 1,554.0 1,655.7
Non-Current Investments 159.0 215.0
Deferred Tax Assets (net) 36.8 49.3
Long-term Loans & Advances 199.5 69.8
Other non-current assets 130.1 165.1
Total non-current assets 2,079.4 2,154.9
Current Assets
Current Investments 912.5 855.0
Inventories 2,766.0 2,020.1
Trade Receivables 1,815.2 1,463.1
Cash & Bank Balance 289.7 259.7
Short-term Loans & Advances 22.9 182.1
Other Current Assets 341.4 27.3
Total Current Assets6,147.7 4,807.3
Total Assets 8,227.1 6,962.3
11
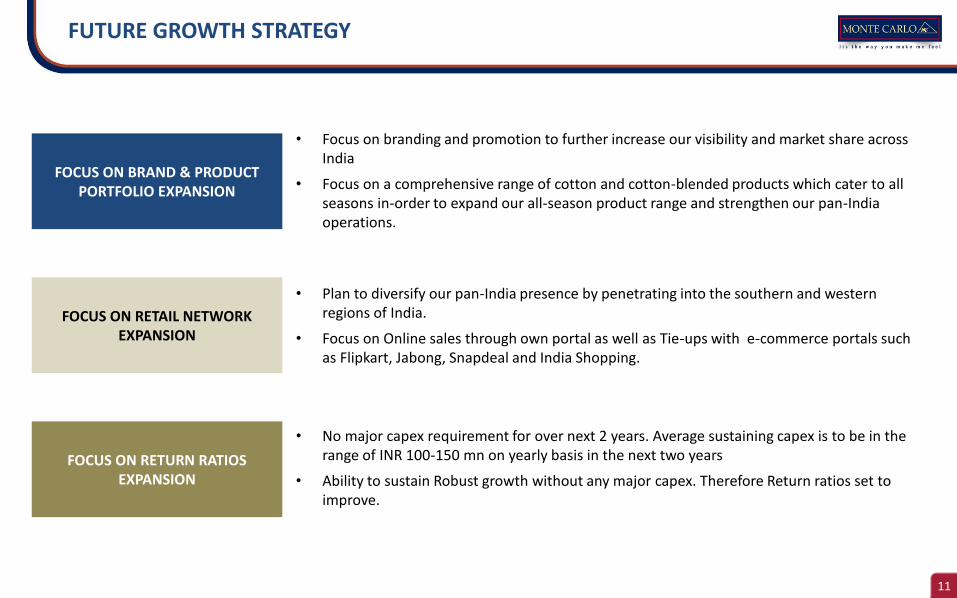
• Plan to diversify our pan-India presence by penetrating into the southern and western regions of India.
• Focus on Online sales through own portal as well as Tie-ups with e-commerce portals such as Flipkart, Jabong, Snapdeal and India Shopping.
FOCUS ON RETAIL NETWORK EXPANSION
FOCUS ON RETURN RATIOS EXPANSION
• No major capex requirement for over next 2 years. Average sustaining capex is to be in the range of INR 100-150 mn on yearly basis in the next two years
• Ability to sustain Robust growth without any major capex. Therefore Return ratios set to improve.
FOCUS ON BRAND & PRODUCT PORTFOLIO EXPANSION
• Focus on branding and promotion to further increase our visibility and market share across India
• Focus on a comprehensive range of cotton and cotton-blended products which cater to all seasons in-order to expand our all-season product range and strengthen our pan-India operations.
FUTURE GROWTH STRATEGY
COMPANY OVERVIEW
13
RECOGNISED BRAND &
DIVERSE PRODUCT PORTFOLIO
WIDE-SPREAD REACH & PRESENCE
KEY FINANCIALS
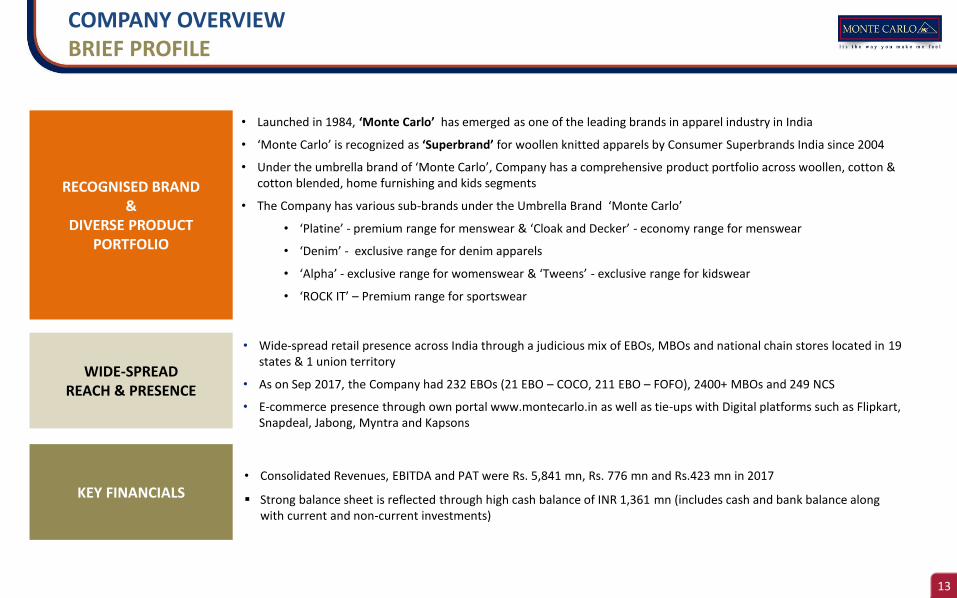
• Launched in 1984, ‘Monte Carlo’ has emerged as one of the leading brands in apparel industry in India
• ‘Monte Carlo’ is recognized as ‘Superbrand’ for woollen knitted apparels by Consumer Superbrands India since 2004
• Under the umbrella brand of ‘Monte Carlo’, Company has a comprehensive product portfolio across woollen, cotton & cotton blended, home furnishing and kids segments
• The Company has various sub-brands under the Umbrella Brand ‘Monte Carlo’
• ‘Platine’ - premium range for menswear & ‘Cloak and Decker’ - economy range for menswear
• ‘Denim’ - exclusive range for denim apparels
• ‘Alpha’ - exclusive range for womenswear & ‘Tweens’ - exclusive range for kidswear
• ‘ROCK IT’ – Premium range for sportswear
• Wide-spread retail presence across India through a judicious mix of EBOs, MBOs and national chain stores located in 19 states & 1 union territory
• As on Sep 2017, the Company had 232 EBOs (21 EBO – COCO, 211 EBO – FOFO), 2400+ MBOs and 249 NCS
• E-commerce presence through own portal www.montecarlo.in as well as tie-ups with Digital platforms such as Flipkart, Snapdeal, Jabong, Myntra and Kapsons
• Consolidated Revenues, EBITDA and PAT were Rs. 5,841 mn, Rs. 776 mn and Rs.423 mn in 2017
▪ Strong balance sheet is reflected through high cash balance of INR 1,361 mn (includes cash and bank balance along with current and non-current investments)
COMPANY OVERVIEWBRIEF PROFILE
14
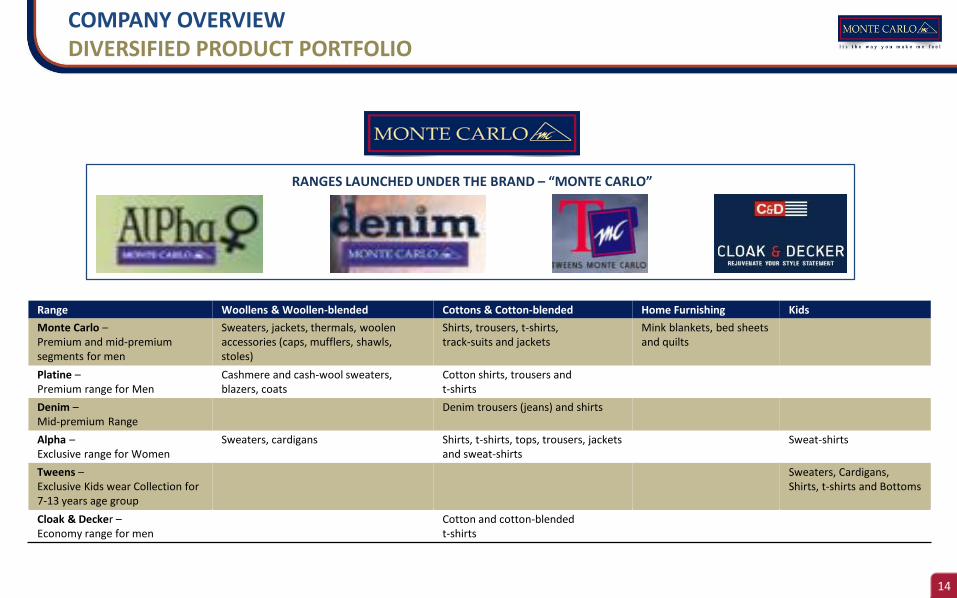
Range Woollens & Woollen-blended Cottons & Cotton-blended Home Furnishing Kids
Monte Carlo –Premium and mid-premium segments for men
Sweaters, jackets, thermals, woolen accessories (caps, mufflers, shawls,stoles)
Shirts, trousers, t-shirts, track-suits and jackets
Mink blankets, bed sheets and quilts
Platine –Premium range for Men
Cashmere and cash-wool sweaters, blazers, coats
Cotton shirts, trousers and t-shirts
Denim –Mid-premium Range
Denim trousers (jeans) and shirts
Alpha –Exclusive range for Women
Sweaters, cardigans Shirts, t-shirts, tops, trousers, jackets and sweat-shirts
Sweat-shirts
Tweens –Exclusive Kids wear Collection for 7-13 years age group
Sweaters, Cardigans,Shirts, t-shirts and Bottoms
Cloak & Decker –Economy range for men
Cotton and cotton-blended t-shirts
RANGES LAUNCHED UNDER THE BRAND – “MONTE CARLO”
COMPANY OVERVIEWDIVERSIFIED PRODUCT PORTFOLIO
15
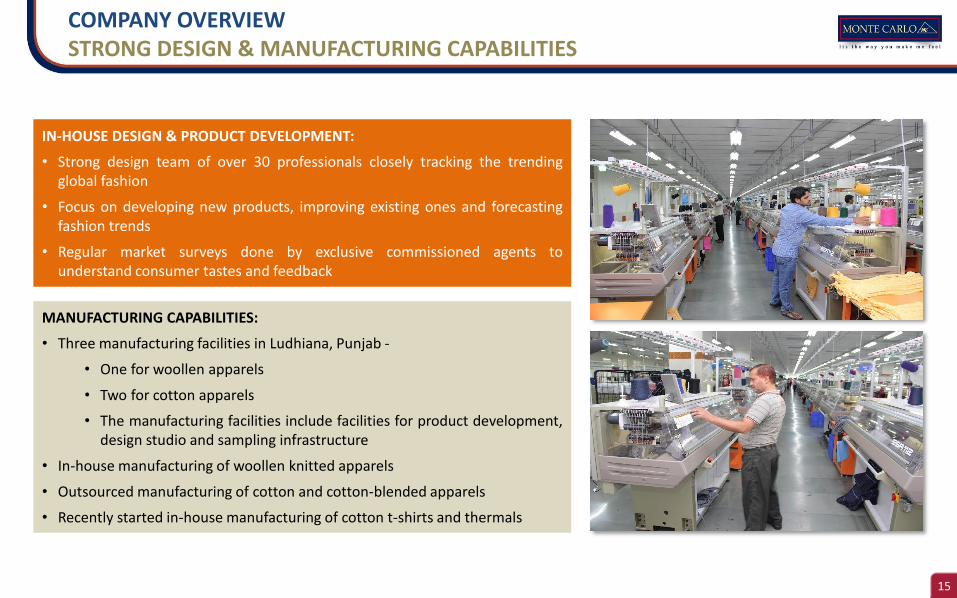
IN-HOUSE DESIGN & PRODUCT DEVELOPMENT:
• Strong design team of over 30 professionals closely tracking the trendingglobal fashion
• Focus on developing new products, improving existing ones and forecastingfashion trends
• Regular market surveys done by exclusive commissioned agents tounderstand consumer tastes and feedback
MANUFACTURING CAPABILITIES:
• Three manufacturing facilities in Ludhiana, Punjab -
• One for woollen apparels
• Two for cotton apparels
• The manufacturing facilities include facilities for product development,design studio and sampling infrastructure
• In-house manufacturing of woollen knitted apparels
• Outsourced manufacturing of cotton and cotton-blended apparels
• Recently started in-house manufacturing of cotton t-shirts and thermals
COMPANY OVERVIEWSTRONG DESIGN & MANUFACTURING CAPABILITIES

16
Bihar 33
MP 11Gujarat 6
Maharashtra 6 Orissa 1
Over 20 stores
10 to 20 stores
Less than 10 stores
WB 8C hhattisgarh 2
N agaland 1
Manipur 1Tripura 1
J&K 3
Punjab 37
UP 30
Haryana 21 Uttarakhand 6
Assam 1
Delhi 12
MBO – Multi Brand Outlet, EBO – Exclusive Brand OutletCOCO – Company own Company operated, FOFO – Franchise own Franchise operated, NCS – National Chain Stores
PAN INDIA PRESENCE ACROSS 19 STATES & 1 UNION TERRITORY
HP 10
Jharkhand 8
Rajasthan 22
STORE NETWORK
Type of Store FY16 FY17 Q2 FY18
EBO – COCO 21 20 21
EBO – FOFO 202 211 211
MBO 2,000+ 2,300+ 2400+
NCS 164 198 249
COMPANY OVERVIEWOUR RETAIL PRESENCE
AP 1Karnataka 7
Kerela 1T Nadu 2
17
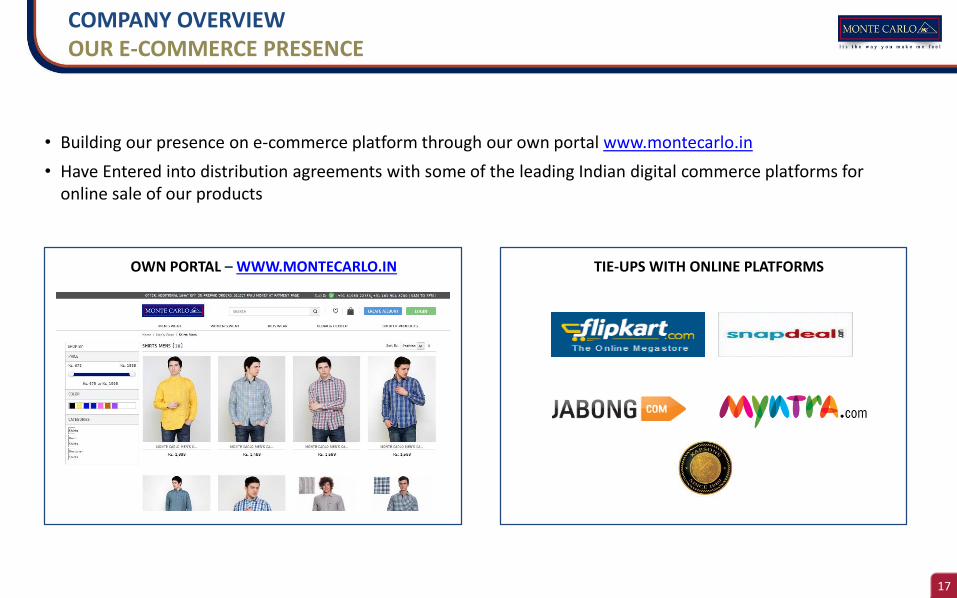
TIE-UPS WITH ONLINE PLATFORMSOWN PORTAL – WWW.MONTECARLO.IN
• Building our presence on e-commerce platform through our own portal www.montecarlo.in
• Have Entered into distribution agreements with some of the leading Indian digital commerce platforms for online sale of our products
COMPANY OVERVIEWOUR E-COMMERCE PRESENCE

18
• Product development & Sampling process
• Design process is finalised
• Sample sets sent to our commissioned agents (CA)
• Commissioned agents display the samples to dealers and distributors
• Company organizes fashion shows to showcase proposed products to the MBOs
• CAs procure orders from MBOs and act as an interface between the Company and MBOs
• The dealers and distributors of the MBOs place orders with the CAs
• Pre-booking of orders from MBOs and franchise EBOs
• Production of pre-ordered designs commences
• Dispatching of winter wear products EBOs and MBOs
• Peak Inventory in September, at the beginning of the winter season
DESIGNING IS AN ONGOING PROCESS THROUGHOUT THE YEAR FOR BOTH COTTON AND WOOLLEN GARMENTS
PRODUCTION OF PLAIN AND BASIC DESIGNS CONTINUE THROUGHOUT THE YEAR FOR BOTH WOOLLEN AND COTTON GARMENTS
BUSINESS CYCLE FOR WINTER SEASON SALES
BUSINESS CYCLE FOR SUMMER SEASON SALES
JANUARY FEBRUARY - MARCH APRIL MAY TILL JULYAUGUST
ONWARDS
AUGUST SEPTEMBER- OCTOBER OCTOBER NOVEMBER TILL JANUARYFEBRUARY ONWARDS
COMPANY OVERVIEWUNDERSTANDING OUR BUSINESS MODEL
19
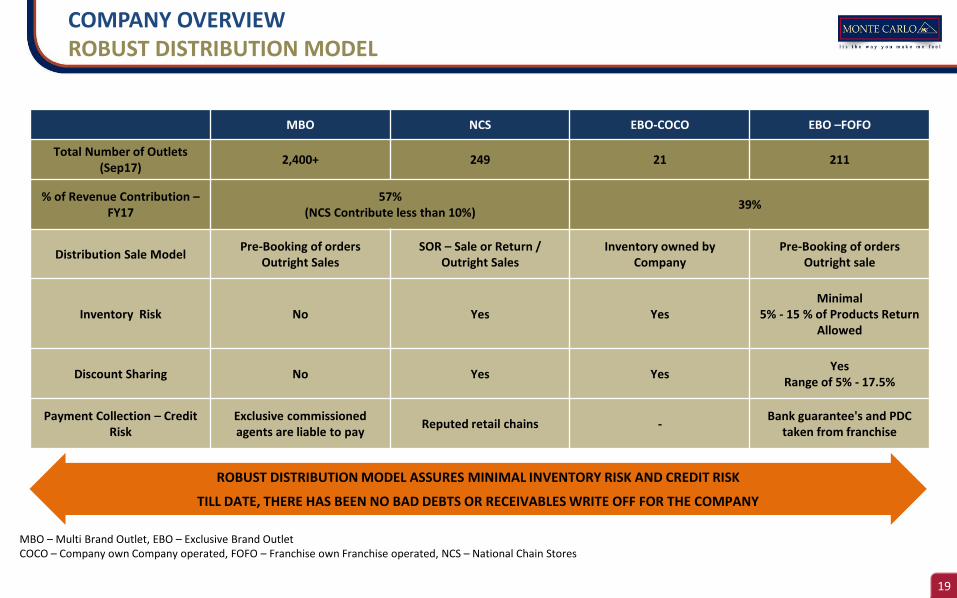
MBO NCS EBO-COCO EBO –FOFO
Total Number of Outlets (Sep17)
2,400+ 249 21 211
% of Revenue Contribution –FY17
57% (NCS Contribute less than 10%)
39%
Distribution Sale ModelPre-Booking of orders
Outright SalesSOR – Sale or Return /
Outright SalesInventory owned by
CompanyPre-Booking of orders
Outright sale
Inventory Risk No Yes YesMinimal
5% - 15 % of Products Return Allowed
Discount Sharing No Yes YesYes
Range of 5% - 17.5%
Payment Collection – Credit Risk
Exclusive commissioned agents are liable to pay
Reputed retail chains -Bank guarantee's and PDC
taken from franchise
MBO – Multi Brand Outlet, EBO – Exclusive Brand OutletCOCO – Company own Company operated, FOFO – Franchise own Franchise operated, NCS – National Chain Stores
ROBUST DISTRIBUTION MODEL ASSURES MINIMAL INVENTORY RISK AND CREDIT RISK
TILL DATE, THERE HAS BEEN NO BAD DEBTS OR RECEIVABLES WRITE OFF FOR THE COMPANY
COMPANY OVERVIEWROBUST DISTRIBUTION MODEL
20
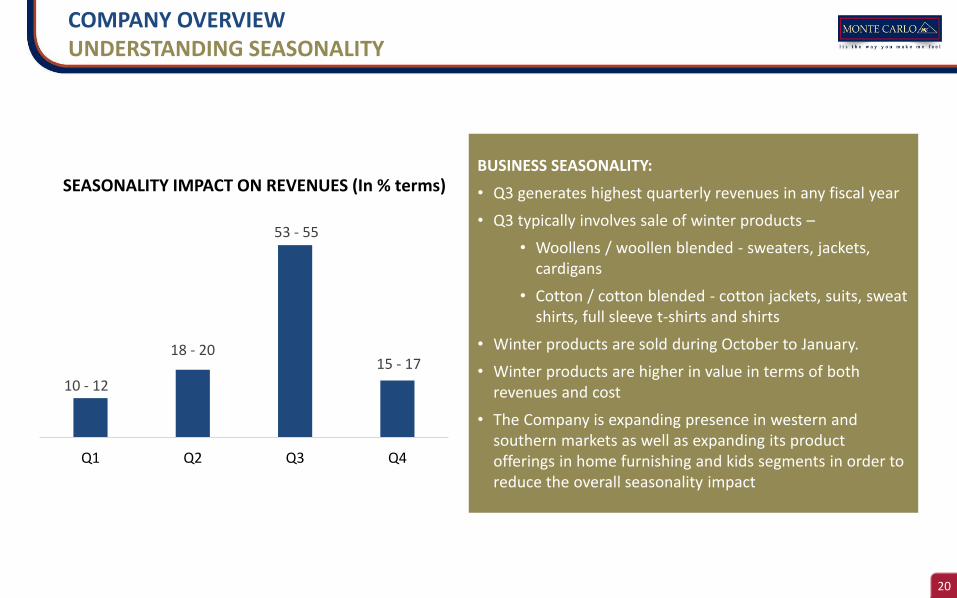
10 - 12
18 - 20
53 - 55
15 - 17
Q1 Q2 Q3 Q4
SEASONALITY IMPACT ON REVENUES (In % terms)BUSINESS SEASONALITY:
• Q3 generates highest quarterly revenues in any fiscal year
• Q3 typically involves sale of winter products –
• Woollens / woollen blended - sweaters, jackets, cardigans
• Cotton / cotton blended - cotton jackets, suits, sweat shirts, full sleeve t-shirts and shirts
• Winter products are sold during October to January.
• Winter products are higher in value in terms of both revenues and cost
• The Company is expanding presence in western and southern markets as well as expanding its product offerings in home furnishing and kids segments in order to reduce the overall seasonality impact
COMPANY OVERVIEWUNDERSTANDING SEASONALITY
21
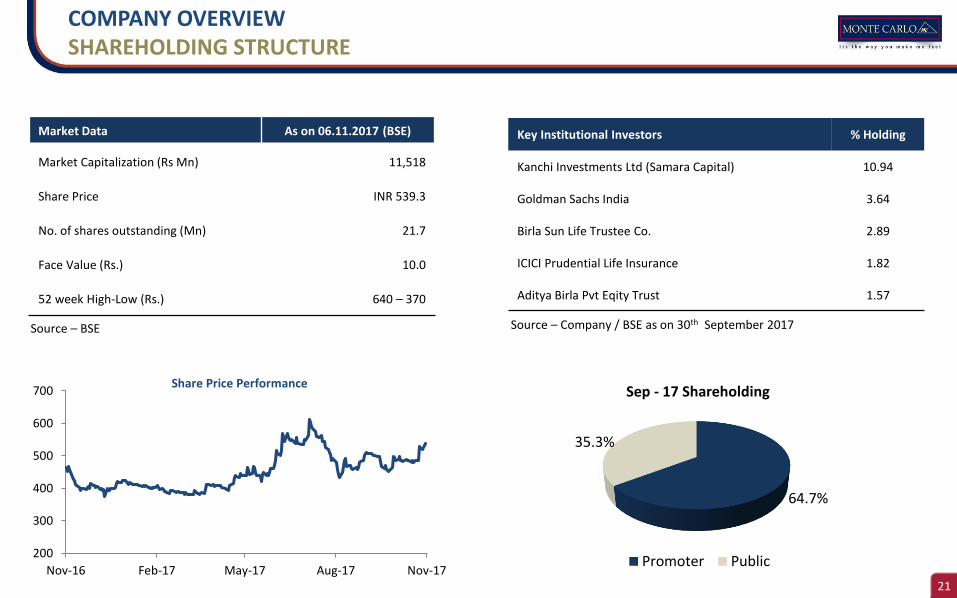
COMPANY OVERVIEWSHAREHOLDING STRUCTURE
Key Institutional Investors % Holding
Kanchi Investments Ltd (Samara Capital) 10.94
Goldman Sachs India 3.64
Birla Sun Life Trustee Co. 2.89
ICICI Prudential Life Insurance 1.82
Aditya Birla Pvt Eqity Trust 1.57
Market Data As on 06.11.2017 (BSE)
Market Capitalization (Rs Mn) 11,518
Share Price INR 539.3
No. of shares outstanding (Mn) 21.7
Face Value (Rs.) 10.0
52 week High-Low (Rs.) 640 – 370
64.7%
35.3%
Sep - 17 Shareholding
Promoter Public
Source – Company / BSE as on 30th September 2017Source – BSE
200
300
400
500
600
700
Nov-16 Feb-17 May-17 Aug-17 Nov-17
Share Price Performance
22
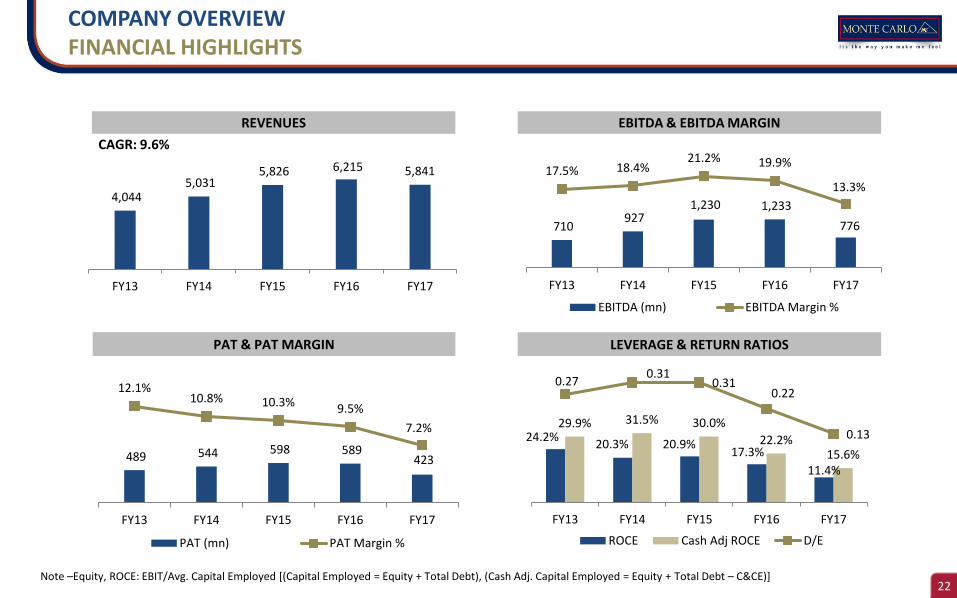
4,044 5,031
5,826 6,215 5,841
FY13 FY14 FY15 FY16 FY17
710 927
1,230 1,233
776
17.5% 18.4%21.2% 19.9%
13.3%
FY13 FY14 FY15 FY16 FY17
EBITDA (mn) EBITDA Margin %
489 544 598 589 423
12.1%10.8% 10.3% 9.5%
7.2%
FY13 FY14 FY15 FY16 FY17
PAT (mn) PAT Margin %
REVENUES EBITDA & EBITDA MARGIN
PAT & PAT MARGIN
24.2%20.3% 20.9%
17.3%
11.4%
29.9% 31.5% 30.0%
22.2%15.6%
0.270.31
0.310.22
0.13
FY13 FY14 FY15 FY16 FY17
ROCE Cash Adj ROCE D/E
CAGR: 9.6%
LEVERAGE & RETURN RATIOS
Note –Equity, ROCE: EBIT/Avg. Capital Employed [(Capital Employed = Equity + Total Debt), (Cash Adj. Capital Employed = Equity + Total Debt – C&CE)]
COMPANY OVERVIEWFINANCIAL HIGHLIGHTS
23
Ravindra BhandariIR ConsultantEmail : [email protected] No : +91 92836 14197
Dinesh GognaDirectorEmail : [email protected]
DISCLAIMER
This presentation and the following discussion may contain “forward looking
statements” by Monte Carlo Fashions Ltd (“MCFL” or the Company) that are not
historical in nature. These forward looking statements, which may include statements
relating to future results of operations, financial condition, business prospects, plans
and objectives, are based on the current beliefs, assumptions, expectations, estimates,
and projections of the management of MCFL about the business, industry and markets
in which MCFL operates.
These statements are not guarantees of future performance, and are subject to known
and unknown risks, uncertainties, and other factors, some of which are beyond MCFL’s
control and difficult to predict, that could cause actual results, performance or
achievements to differ materially from those in the forward looking statements. Such
statements are not, and should not be construed, as a representation as to future
performance or achievements of MCFL.
In particular, such statements should not be regarded as a projection of future
performance of MCFL. It should be noted that the actual performance or achievements
of MCFL may vary significantly from such statements.
FOR FURTHER QUERIES