q2 2017 roadshow - ein führender spezialchemie-konzern ... · q2 2017 roadshow the road ahead ......
TRANSCRIPT
Q2 2017 RoadshowThe road ahead – expanding our strengths
Matthias Zachert, CEO
2
Safe harbor statement
The information included in this presentation is being provided for informational purposes only and does not constitute an offer to sell, or a solicitation of an offer to purchase, securities of LANXESS AG. No public market exists for the securities of LANXESS AG in the United States.
This presentation contains certain forward-looking statements, including assumptions, opinions, expectations and views of the company or cited from third party sources. Various known and unknown risks, uncertainties and other factors could cause the actual results, financial position, development or performance of LANXESS AG to differ materially from the estimations expressed or implied herein. LANXESS AG does not guarantee that the assumptions underlying such forward-looking statements are free from errors nor does it accept any responsibility for the future accuracy of the opinions expressed in this presentation or the actual occurrence of the forecast developments. No representation or warranty (expressed or implied) is made as to, and no reliance should be placed on, any information, estimates, targets and opinions, contained herein, and no liability whatsoever is accepted as to any errors, omissions or misstatements contained herein, and accordingly, no representative of LANXESS AG or any of its affiliated companies or any of such person's officers, directors or employees accept any liability whatsoever arising directly or indirectly from the use of this document.
3
Agenda
Expanding our strengths
Q2 2017 and guidance – Performing in the new LANXESS structure
Backup
4
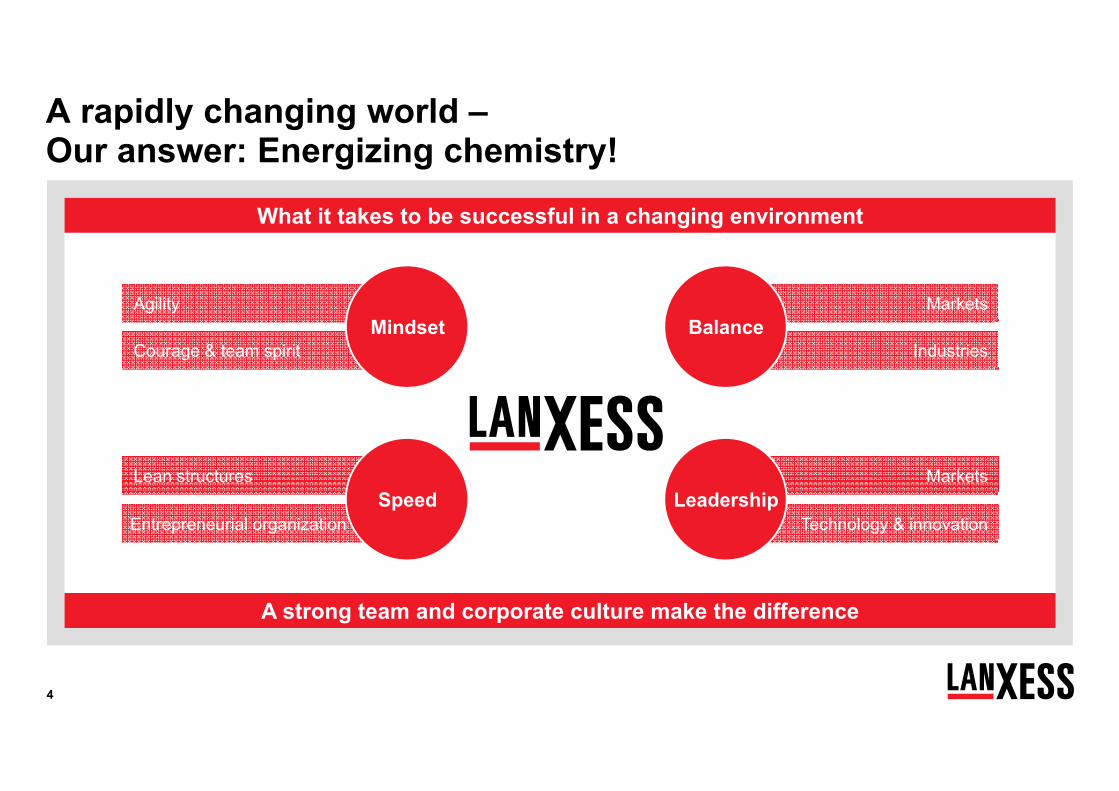
A rapidly changing world –Our answer: Energizing chemistry!
What it takes to be successful in a changing environment
A strong team and corporate culture make the difference
Markets
IndustriesBalance
Markets
Technology & innovationLeadership
Lean structures
Entrepreneurial organizationSpeed
Courage & team spirit
AgilityMindset
5
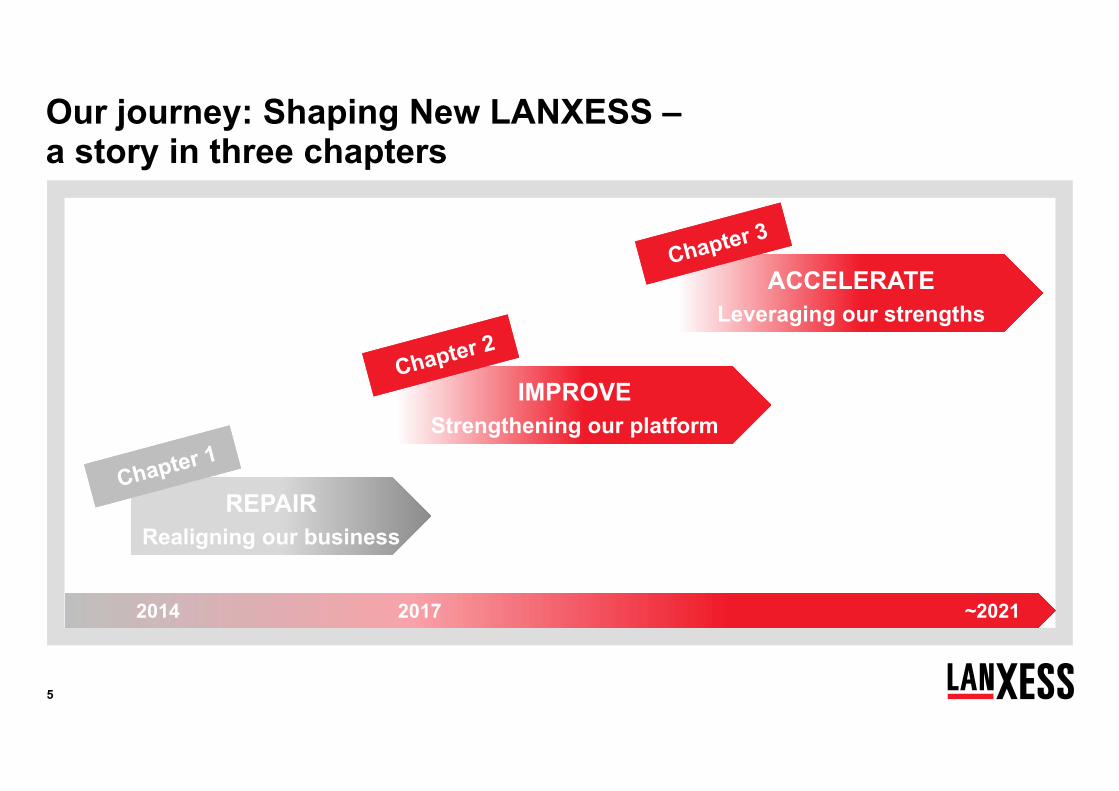
Our journey: Shaping New LANXESS –a story in three chapters
REPAIRRealigning our business
REPAIRRealigning our business
IMPROVEStrengthening our platform
IMPROVEStrengthening our platform
ACCELERATELeveraging our strengths
ACCELERATELeveraging our strengths
2014 2017 ~2021
6
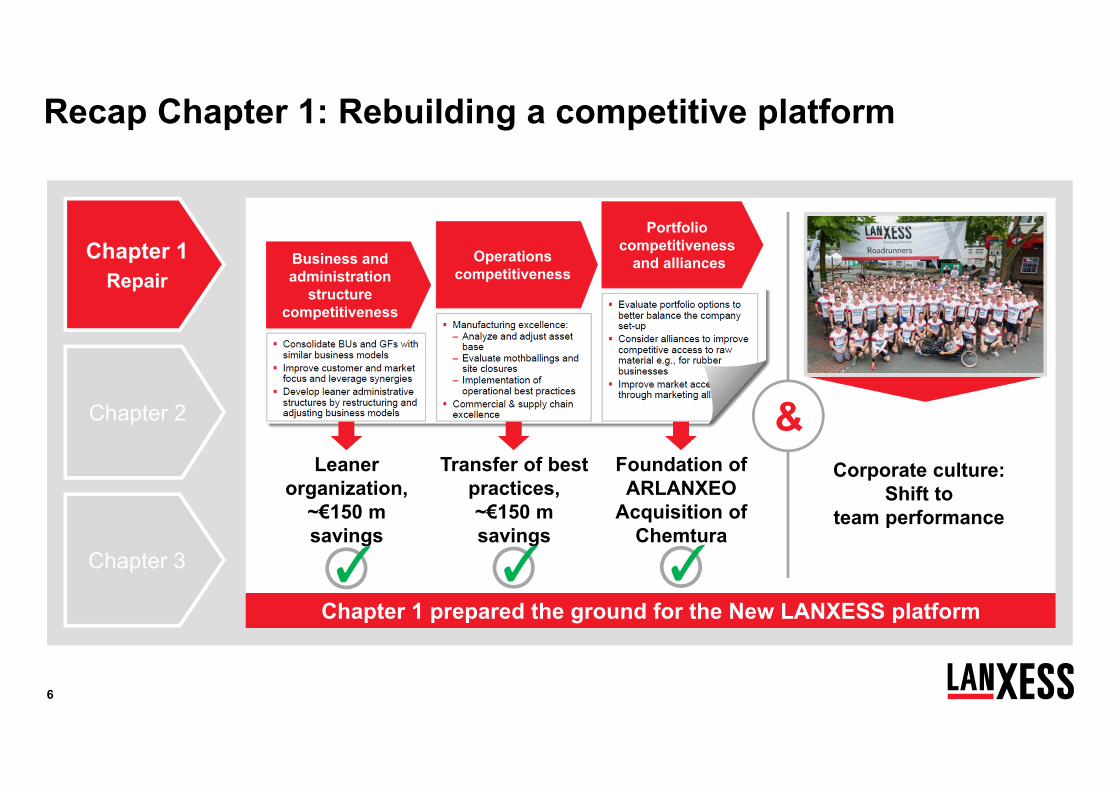
Recap Chapter 1: Rebuilding a competitive platform
Chapter 3
Chapter 2
Chapter 1Repair
Chapter 1 prepared the ground for the New LANXESS platform
Corporate culture: Shift to
team performance
Leaner organization,
~€150 m savings
Transfer of best practices,~€150 m savings
Foundation of ARLANXEO
Acquisition of Chemtura
&
✓ ✓ ✓
Business and administration
structure competitiveness
Portfolio competitiveness
and alliancesOperationscompetitiveness
7
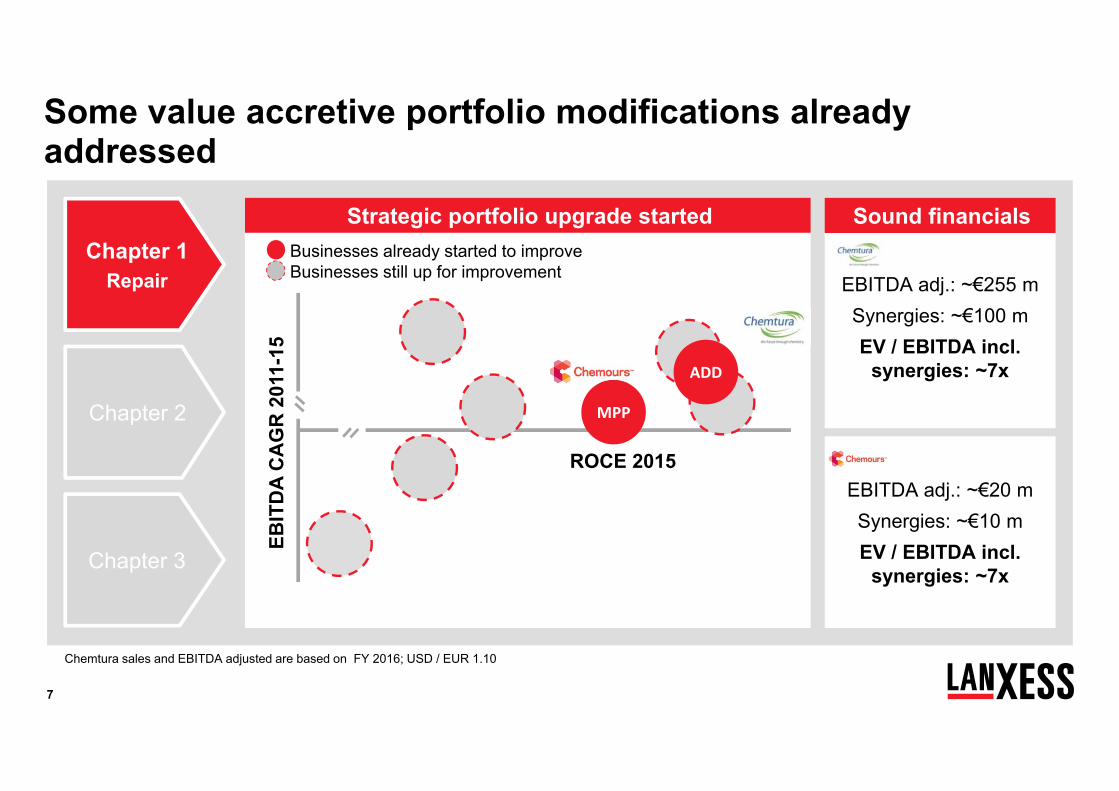
EBITDA adj.: ~€20 mSynergies: ~€10 m EV / EBITDA incl.
synergies: ~7x
ADD
MPP
Some value accretive portfolio modifications already addressed
EBIT
DA
CA
GR
201
1-15
ROCE 2015
EBITDA adj.: ~€255 mSynergies: ~€100 m EV / EBITDA incl.
synergies: ~7x
Chemtura sales and EBITDA adjusted are based on FY 2016; USD / EUR 1.10
Businesses already started to improveBusinesses still up for improvement
Strategic portfolio upgrade started Sound financials
Chapter 3
Chapter 2
Chapter 1Repair
8
SGOAIIHPM
IPG
LEA
LPT
MPP
ADD
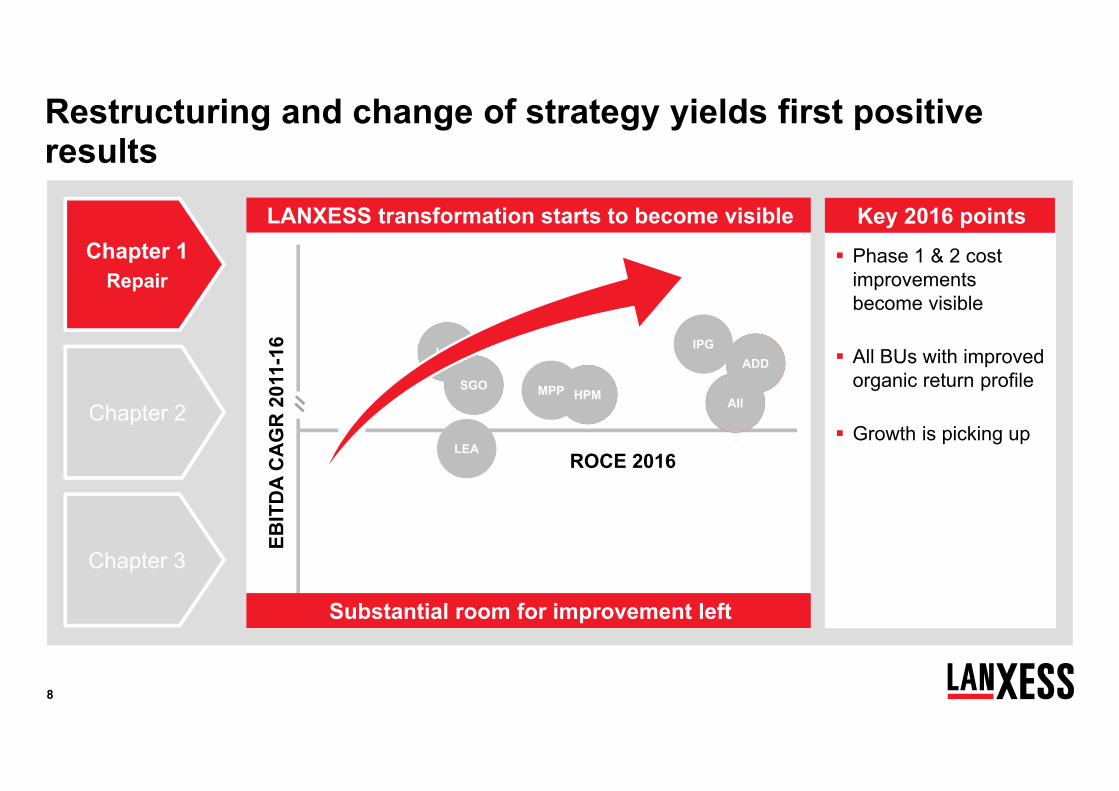
Phase 1 & 2 cost improvements become visible
All BUs with improved organic return profile
Growth is picking up
Restructuring and change of strategy yields first positive results
LANXESS transformation starts to become visible Key 2016 points
Substantial room for improvement left
EBIT
DA
CA
GR
201
1-16
ROCE 2016
Chapter 3
Chapter 2
Chapter 1Repair
9
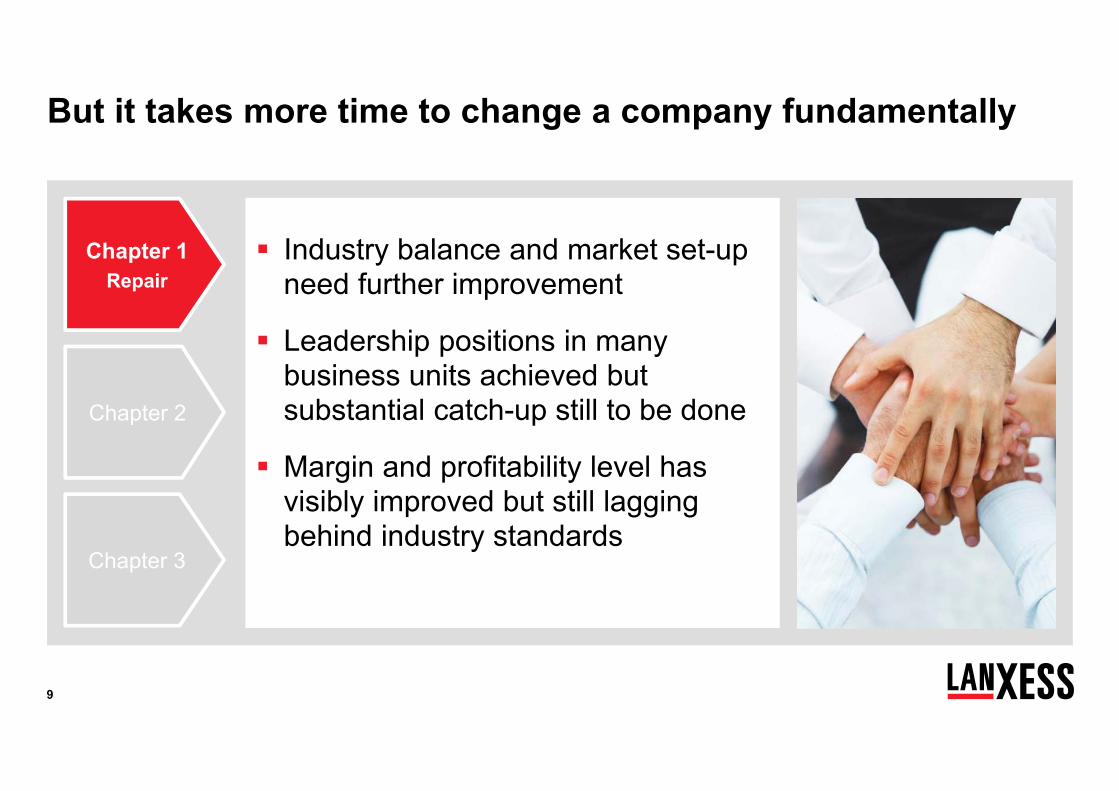
Industry balance and market set-up need further improvement
Leadership positions in many business units achieved but substantial catch-up still to be done
Margin and profitability level has visibly improved but still lagging behind industry standards
But it takes more time to change a company fundamentally
Chapter 3
Chapter 2
Chapter 1Repair
10
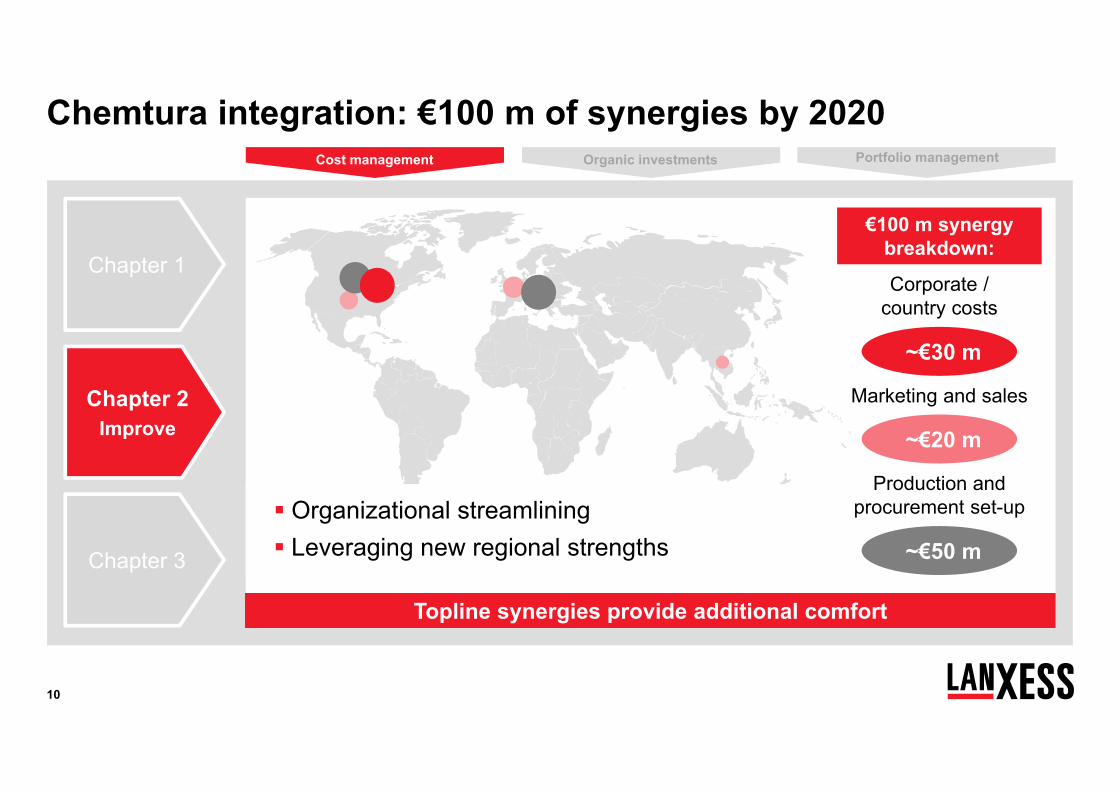
Chemtura integration: €100 m of synergies by 2020
~€30 m
Corporate / country costs
~€20 m
Marketing and sales
~€50 m
Production and procurement set-up Organizational streamlining
Leveraging new regional strengths
Topline synergies provide additional comfort
€100 m synergy breakdown:
Cost management Organic investments Portfolio management
Chapter 3
Chapter 2Improve
Chapter 1
11
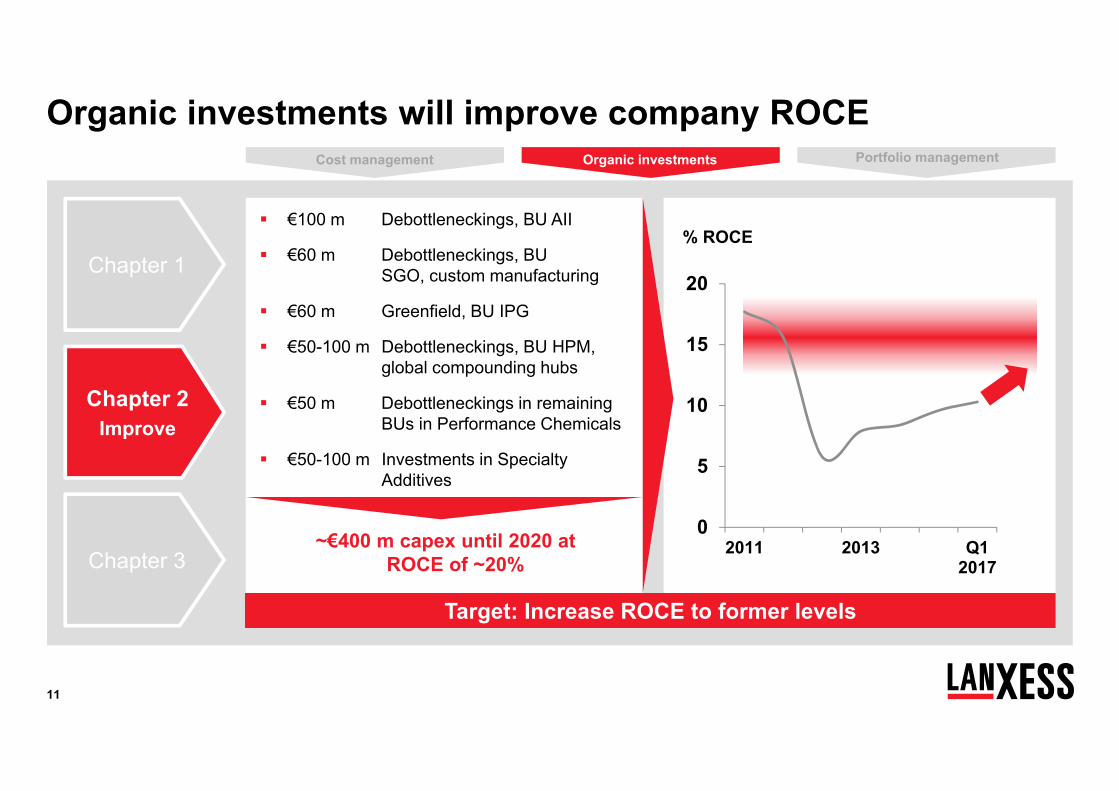
Organic investments will improve company ROCE
€100 m Debottleneckings, BU AII
€60 m Debottleneckings, BU SGO, custom manufacturing
€60 m Greenfield, BU IPG
€50-100 m Debottleneckings, BU HPM, global compounding hubs
€50 m Debottleneckings in remaining BUs in Performance Chemicals
€50-100 m Investments in Specialty Additives
Target: Increase ROCE to former levels
0
5
10
15
20
2011 2013 Q12017
% ROCE
Cost management Organic investments Portfolio management
Chapter 3
Chapter 2Improve
Chapter 1
~€400 m capex until 2020 at ROCE of ~20%
12
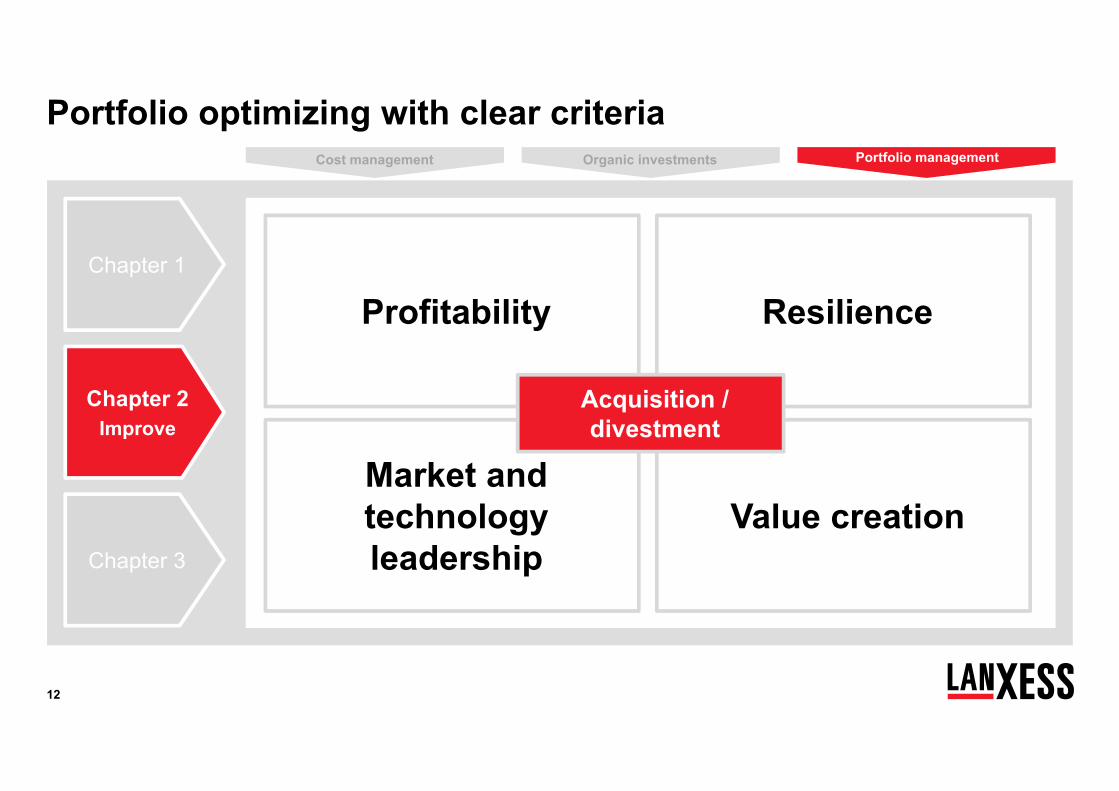
Portfolio optimizing with clear criteria
ResilienceProfitability
Value creationMarket and technology leadership
Acquisition / divestment
Organic investments Portfolio managementCost management
Chapter 3
Chapter 2Improve
Chapter 1
13
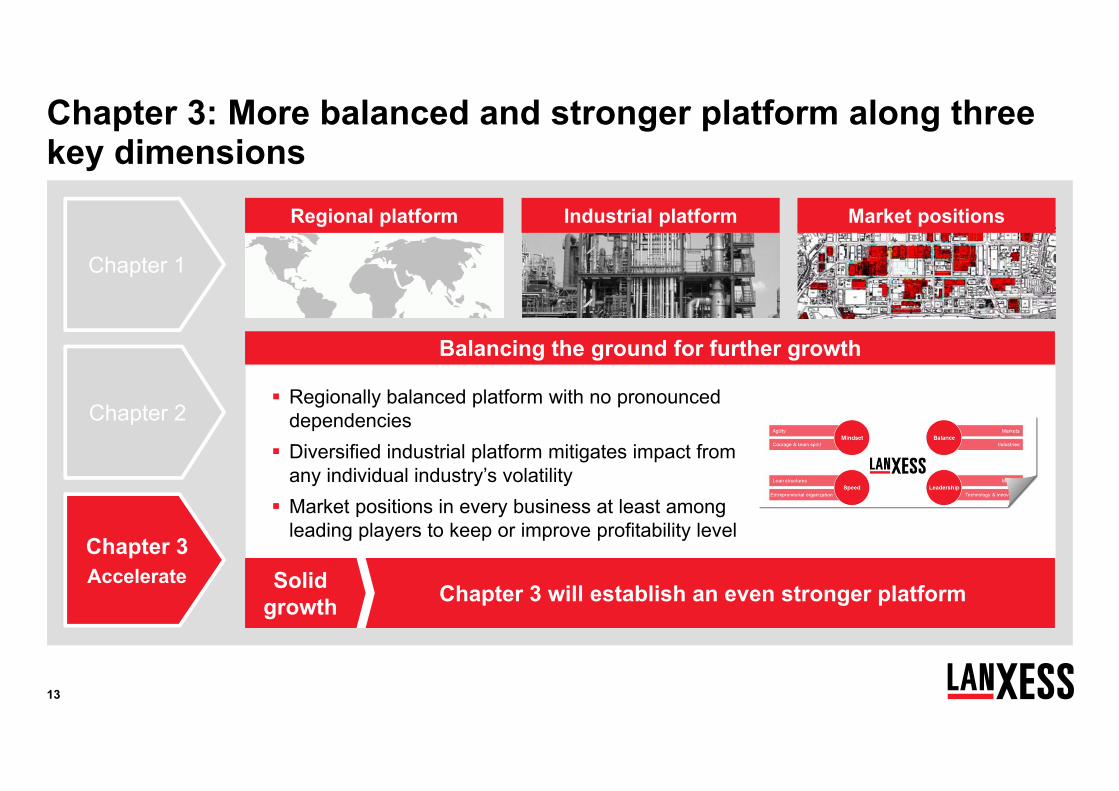
Regionally balanced platform with no pronounced dependencies
Diversified industrial platform mitigates impact from any individual industry’s volatility
Market positions in every business at least among leading players to keep or improve profitability level
Balancing the ground for further growth
Chapter 3: More balanced and stronger platform along three key dimensions
Regional platform Industrial platform Market positions
Chapter 3 will establish an even stronger platformSolidgrowth
Chapter 3Accelerate
Chapter 2
Chapter 1
14
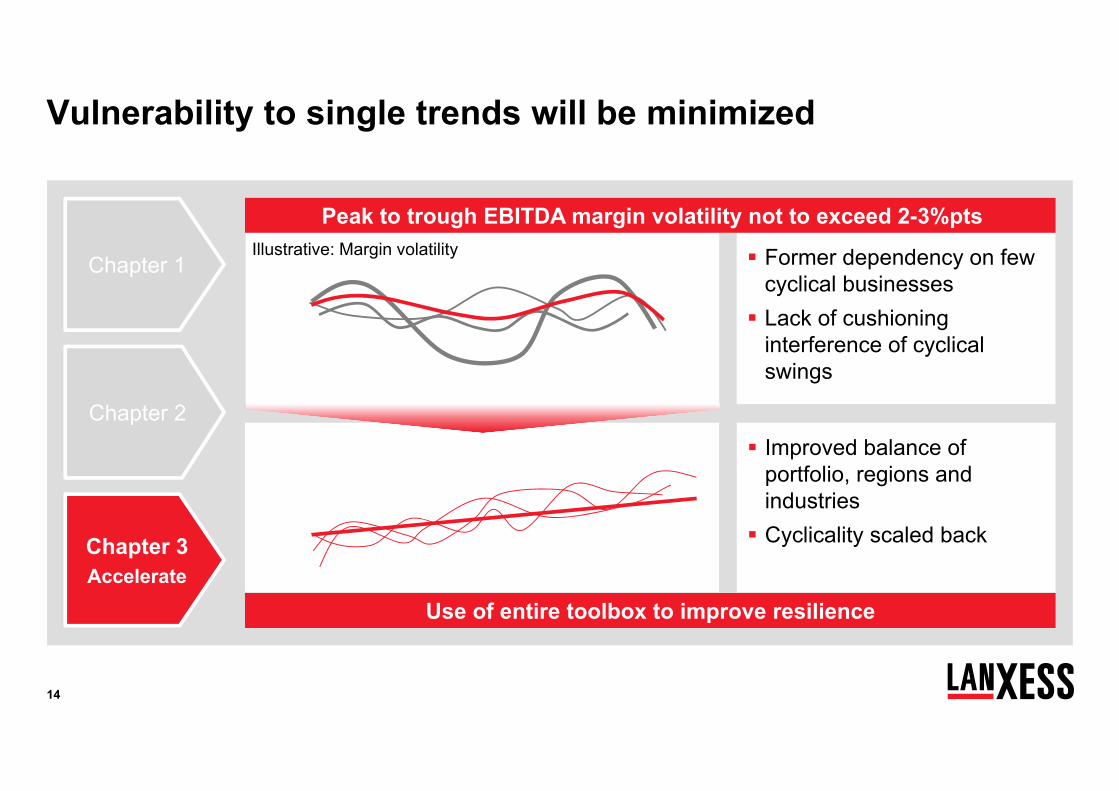
Former dependency on few cyclical businesses Lack of cushioning
interference of cyclical swings
Vulnerability to single trends will be minimized
Use of entire toolbox to improve resilience
Illustrative: Margin volatility
Improved balance of portfolio, regions and industries Cyclicality scaled back
Peak to trough EBITDA margin volatility not to exceed 2-3%pts
Chapter 3Accelerate
Chapter 2
Chapter 1
15
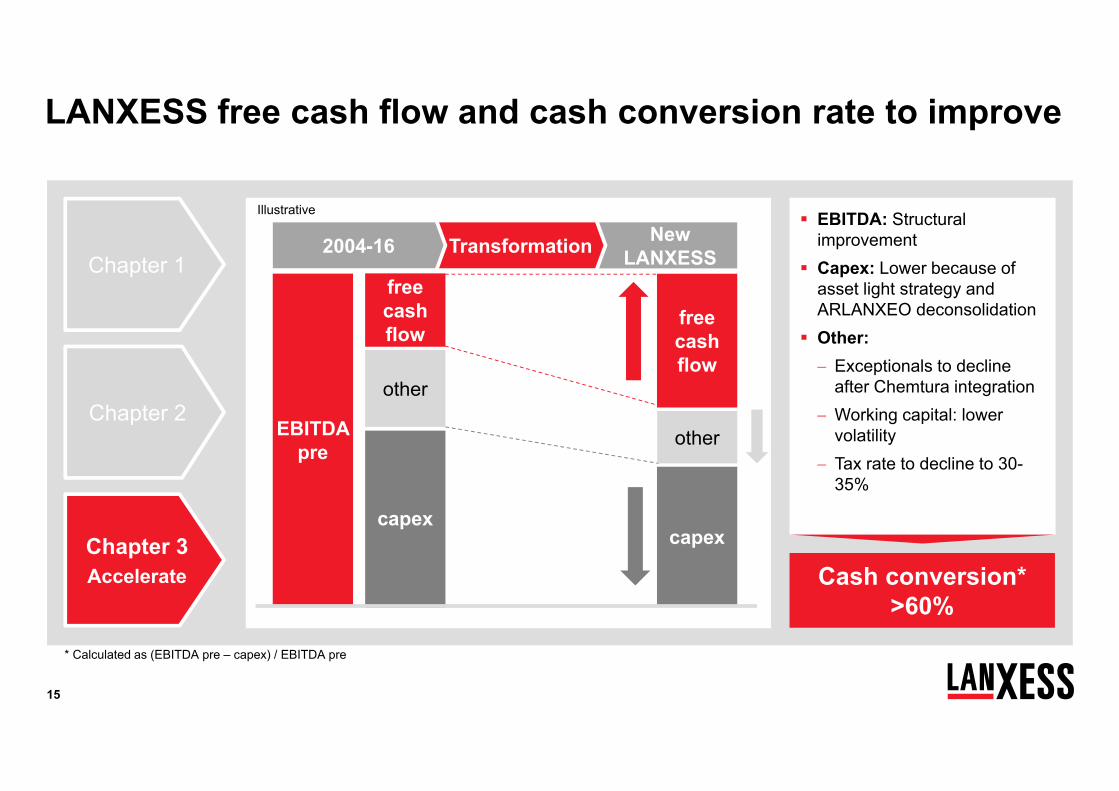
LANXESS free cash flow and cash conversion rate to improve
freecash flow
capex
other
EBITDA pre
capex
freecash flow
EBITDA: Structural improvement
Capex: Lower because of asset light strategy and ARLANXEO deconsolidation
Other: Exceptionals to decline
after Chemtura integration Working capital: lower
volatility Tax rate to decline to 30-
35%
New LANXESSTransformation2004-16
Cash conversion* >60%
other
Illustrative
* Calculated as (EBITDA pre – capex) / EBITDA pre
Chapter 3Accelerate
Chapter 2
Chapter 1
16
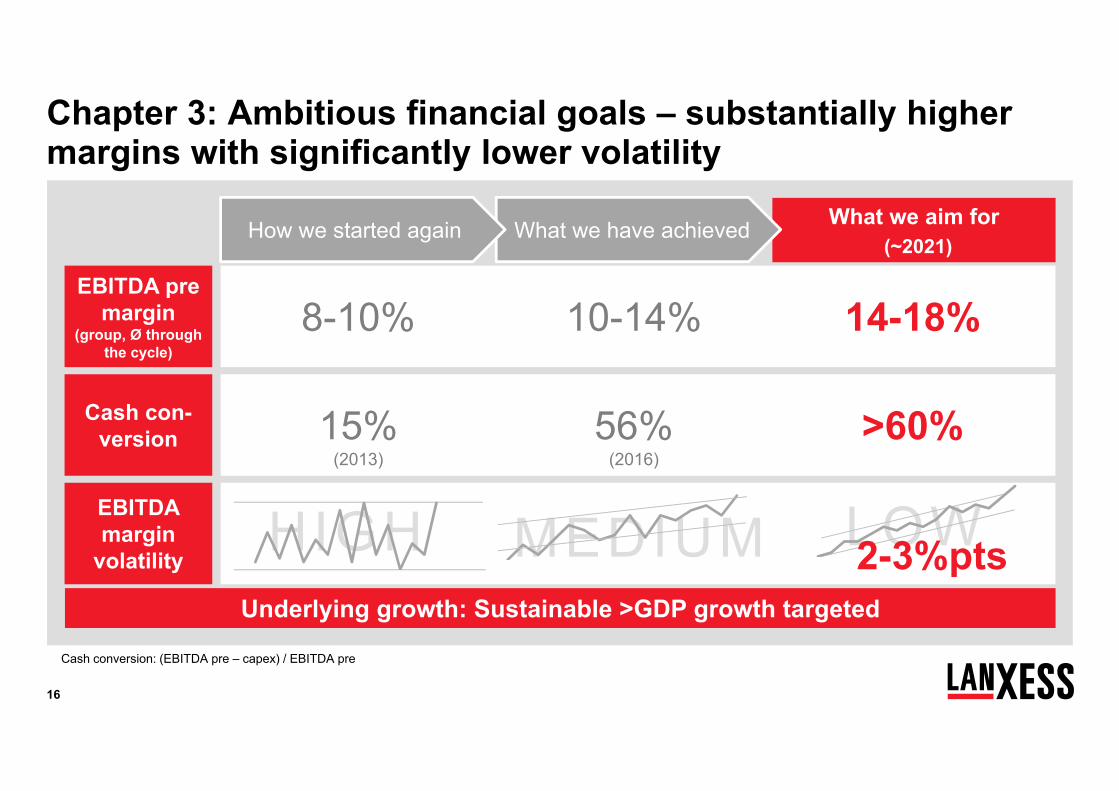
Chapter 3: Ambitious financial goals – substantially higher margins with significantly lower volatility
EBITDA pre margin
(group, Ø through the cycle)
EBITDA margin
volatility
Cash con-version
HIGH MEDIUM
8-10% 10-14% 14-18%
15%(2013)
56%(2016)
>60%
Underlying growth: Sustainable >GDP growth targeted
Cash conversion: (EBITDA pre – capex) / EBITDA pre
What we aim for(~2021)
What we have achievedHow we started again
LOW2-3%pts
17
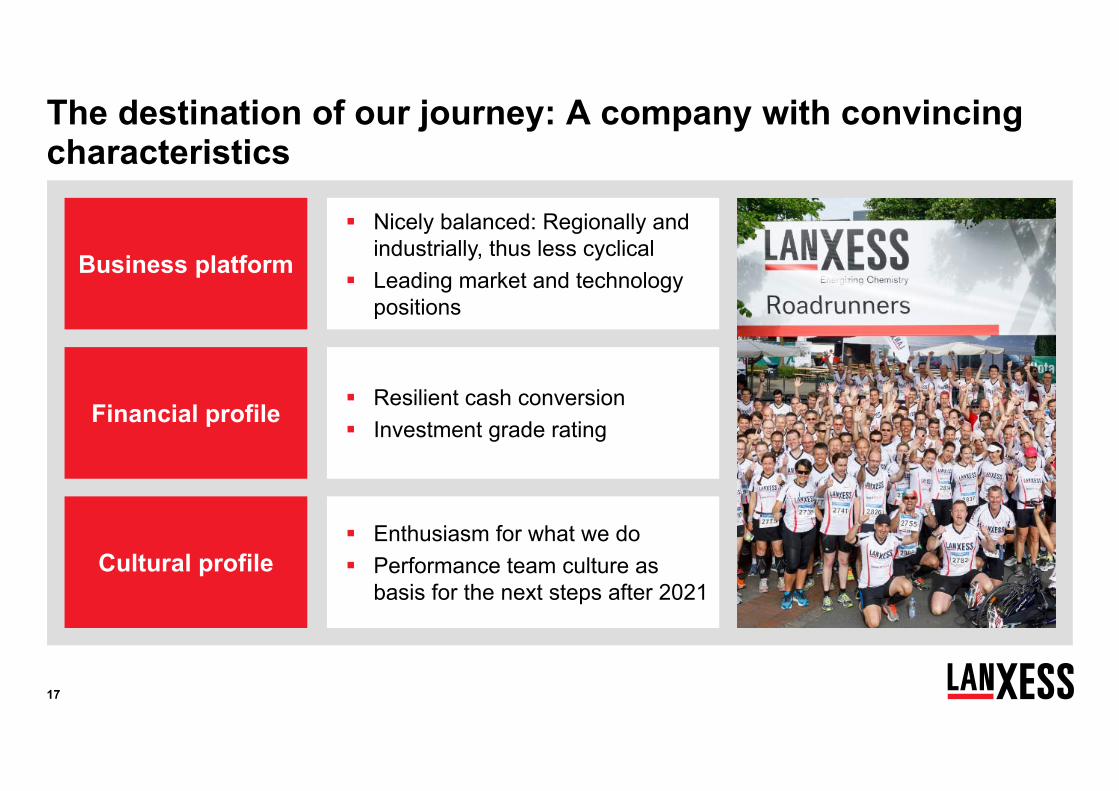
Nicely balanced: Regionally and industrially, thus less cyclical
Leading market and technology positions
The destination of our journey: A company with convincing characteristics
Business platform
Financial profile
Cultural profile
Resilient cash conversion Investment grade rating
Enthusiasm for what we do Performance team culture as
basis for the next steps after 2021
18
Agenda
Expanding our strengths
Q2 2017 and guidance – Performing in the new LANXESS structure
Backup
19
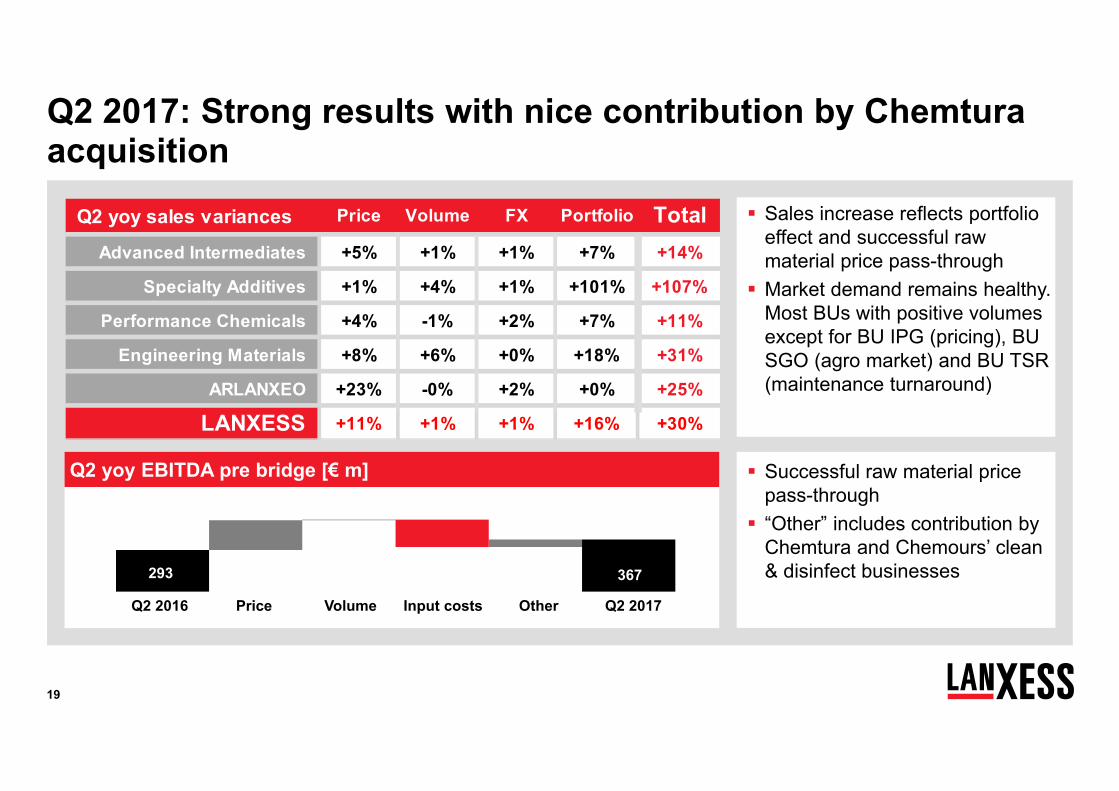
Q2 yoy sales variances Price Volume FX Portfolio TotalAdvanced Intermediates +5% +1% +1% +7% +14%
Specialty Additives +1% +4% +1% +101% +107%
Performance Chemicals +4% -1% +2% +7% +11%
Engineering Materials +8% +6% +0% +18% +31%
ARLANXEO +23% -0% +2% +0% +25%
LANXESS +11% +1% +1% +16% +30%
Successful raw material price pass-through “Other” includes contribution by
Chemtura and Chemours’ clean & disinfect businesses
Sales increase reflects portfolio effect and successful raw material price pass-through Market demand remains healthy.
Most BUs with positive volumes except for BU IPG (pricing), BU SGO (agro market) and BU TSR (maintenance turnaround)
Q2 2017: Strong results with nice contribution by Chemturaacquisition
746293 367
Price Q2 2017Q2 2016 Volume Input costs Other
Q2 yoy EBITDA pre bridge [€ m]
20
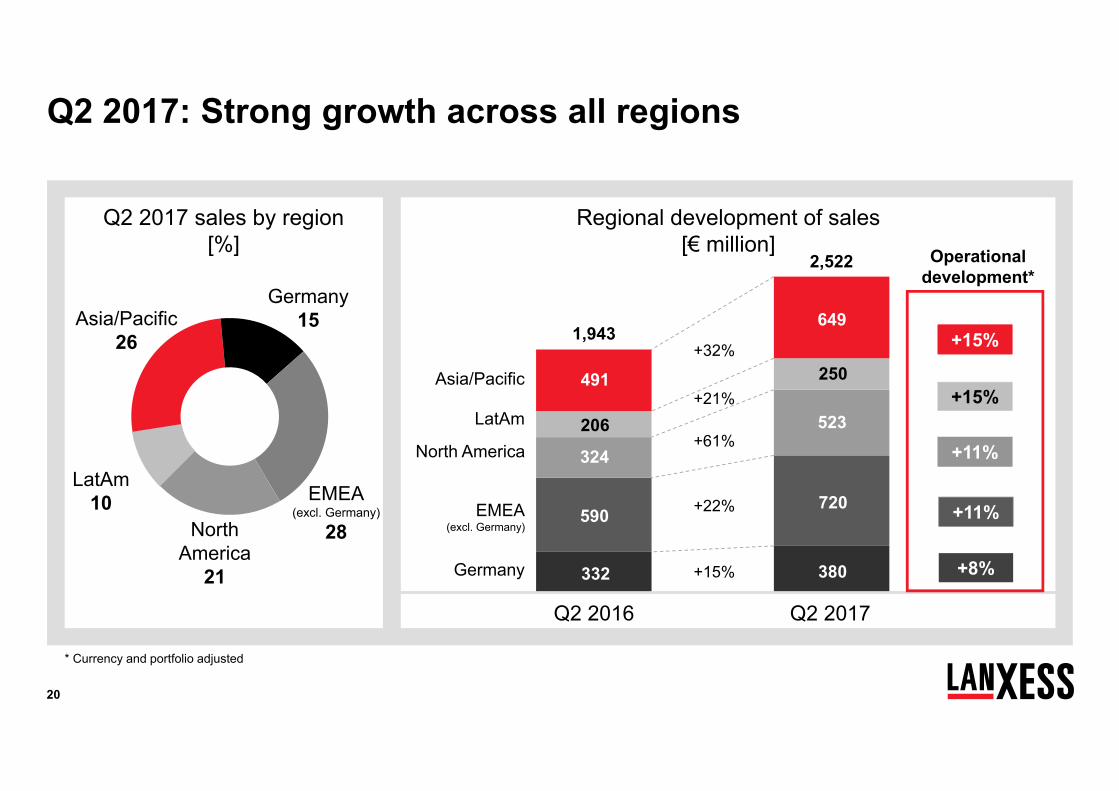
+21%
+15%
+22%
+32%
Regional development of sales[€ million] Operational
development*
EMEA(excl. Germany)
North America
Germany
Asia/Pacific
Q2 2016 Q2 2017
2,522
1,943649
380
523
720
250
+61%
+15%
+11%
+11%
+8%
+15%LatAm
EMEA(excl. Germany)
28NorthAmerica
21
Q2 2017 sales by region [%]
Q2 2017: Strong growth across all regions
491
332
324
590
206
* Currency and portfolio adjusted
LatAm10
Asia/Pacific26
Germany15
21
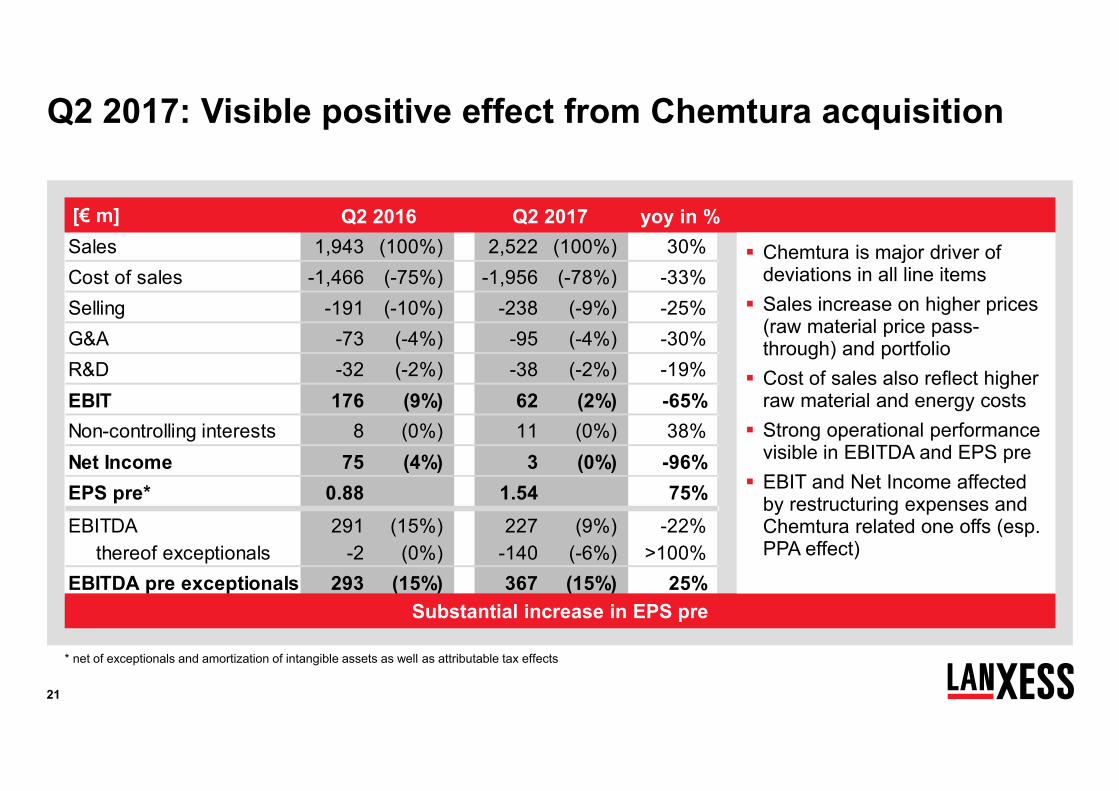
Q2 2017: Visible positive effect from Chemtura acquisition
Sales 1,943 (100%) 2,522 (100%) 30%Cost of sales -1,466 (-75%) -1,956 (-78%) -33%Selling -191 (-10%) -238 (-9%) -25%G&A -73 (-4%) -95 (-4%) -30%R&D -32 (-2%) -38 (-2%) -19%EBIT 176 (9%) 62 (2%) -65%Non-controlling interests 8 (0%) 11 (0%) 38%Net Income 75 (4%) 3 (0%) -96%EPS pre* 0.88 1.54 75%EBITDA 291 (15%) 227 (9%) -22% thereof exceptionals -2 (0%) -140 (-6%) >100%EBITDA pre exceptionals 293 (15%) 367 (15%) 25%
Substantial increase in EPS pre
Q2 2016 Q2 2017 yoy in %[€ m]
* net of exceptionals and amortization of intangible assets as well as attributable tax effects
Chemtura is major driver of deviations in all line items Sales increase on higher prices
(raw material price pass-through) and portfolio Cost of sales also reflect higher
raw material and energy costs Strong operational performance
visible in EBITDA and EPS pre EBIT and Net Income affected
by restructuring expenses and Chemtura related one offs (esp. PPA effect)

22
Advanced Intermediates: Catch-up in raw material cost pass-through drives earnings
BU AII with strong raw material-driven price increase and Chemtura Organometallics business contribution
Volume growth in BU AII held backby maintenance turnaround
Weak agro chemical demand dampens BU SGO EBITDA benefits from catch up on raw material cost pass-
through, partly mitigated by freight and energy costs
[€ m] Q2 2016 Q2 2017 ∆
+5% +1% +1% +7%
Price Volume Currency Portfolio(approximate numbers)
505443
Q2 2017Q2 2016
Sales 443 505 14%EBIT 63 65 3%Depr./Amort. 25 29 16%EBITDA pre exceptionals 88 97 10% Margin 19.9% 19.2%Capex 22 33 50%
906 1,023 13%127 130 2%
50 55 10%177 188 6%
19.5% 18.4%31 49 58%
Q2 sales bridge yoy [€ m] Q2 yoy effects
H1 2016 H1 2017 ∆
23
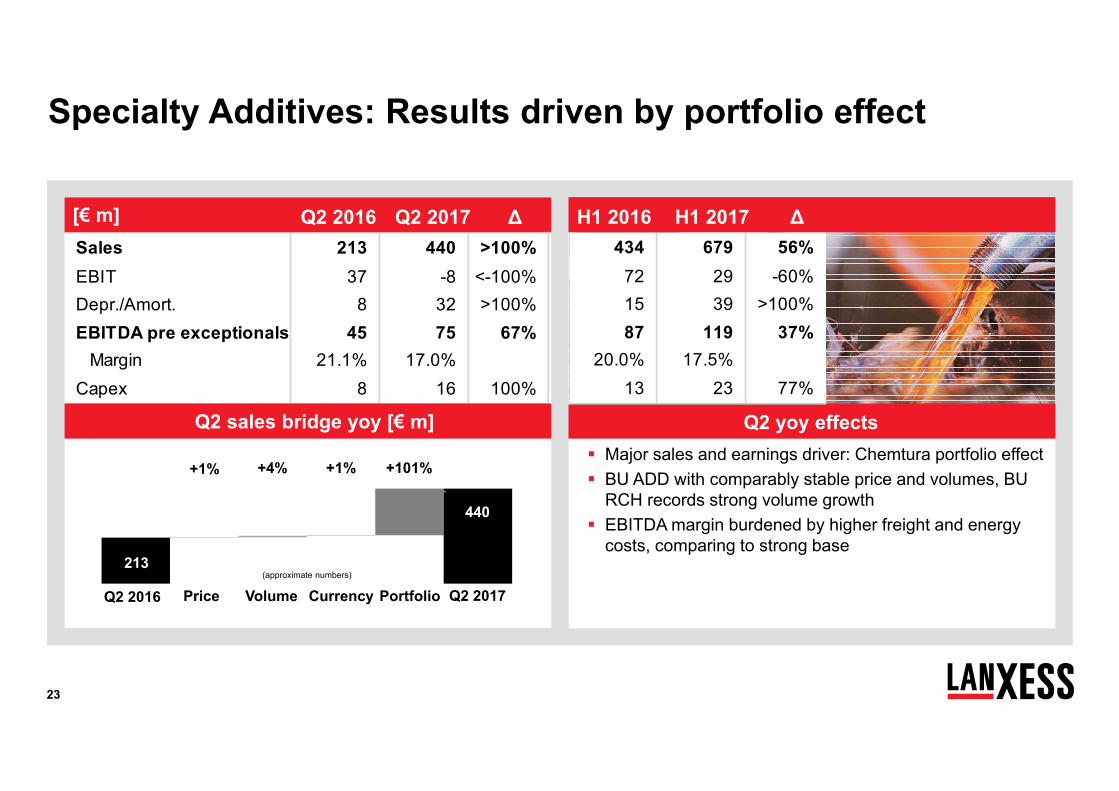
Specialty Additives: Results driven by portfolio effect
Major sales and earnings driver: Chemtura portfolio effect BU ADD with comparably stable price and volumes, BU
RCH records strong volume growth EBITDA margin burdened by higher freight and energy
costs, comparing to strong base
[€ m] Q2 2016 Q2 2017 ∆
+1% +4% +1% +101%
Price Volume Currency Portfolio(approximate numbers)
440
213
Q2 2017Q2 2016
Q2 yoy effectsQ2 yoy effects
434 679 56%72 29 -60%15 39 >100%87 119 37%
20.0% 17.5%13 23 77%
Sales 213 440 >100%EBIT 37 -8 <-100%Depr./Amort. 8 32 >100%EBITDA pre exceptionals 45 75 67% Margin 21.1% 17.0%Capex 8 16 100%
H1 2016 H1 2017 ∆
Q2 sales bridge yoy [€ m]
24
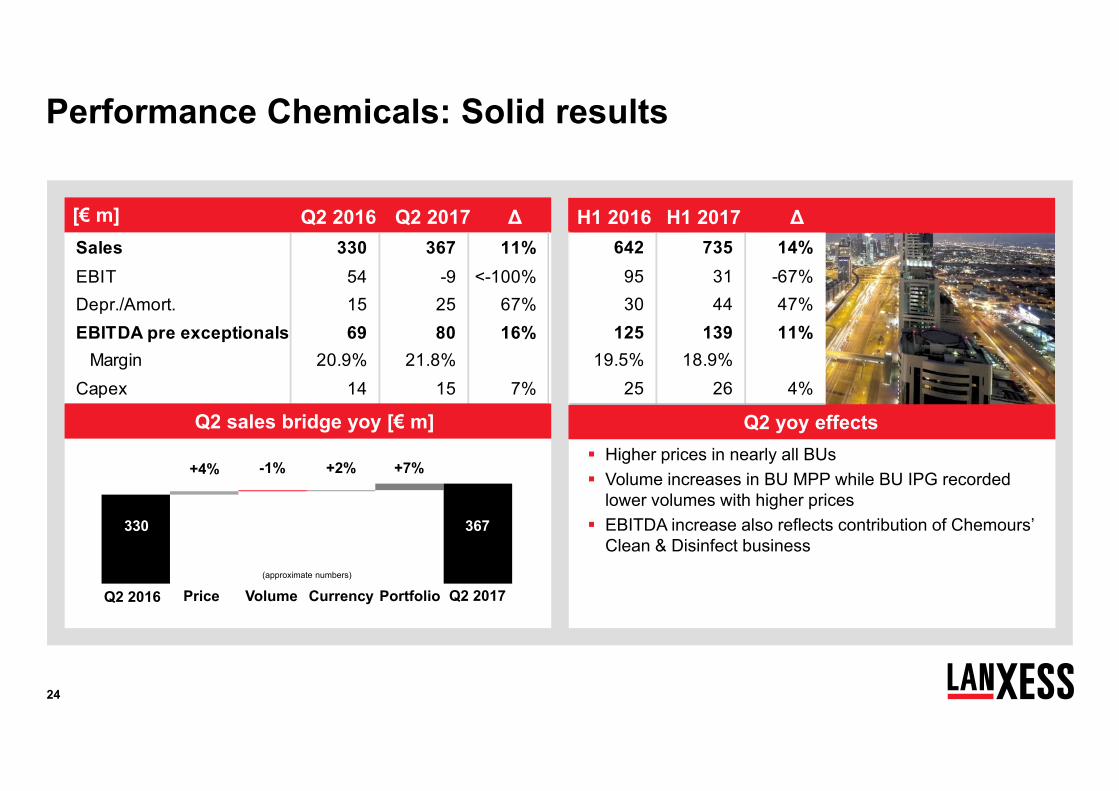
Performance Chemicals: Solid results
[€ m]
Higher prices in nearly all BUs Volume increases in BU MPP while BU IPG recorded
lower volumes with higher prices EBITDA increase also reflects contribution of Chemours’
Clean & Disinfect business
Q4 2015 Q4 2016 ∆
+4% -1% +2% +7%
Price Volume Currency Portfolio(approximate numbers)
367330
Q2 2017Q2 2016
Q2 yoy effects
[€ m] Q2 2016 Q2 2017 ∆ H1 2016 H1 2017 ∆Sales 330 367 11%EBIT 54 -9 <-100%Depr./Amort. 15 25 67%EBITDA pre exceptionals 69 80 16% Margin 20.9% 21.8%Capex 14 15 7%
642 735 14%95 31 -67%30 44 47%
125 139 11%19.5% 18.9%
25 26 4%
Q2 sales bridge yoy [€ m]
25
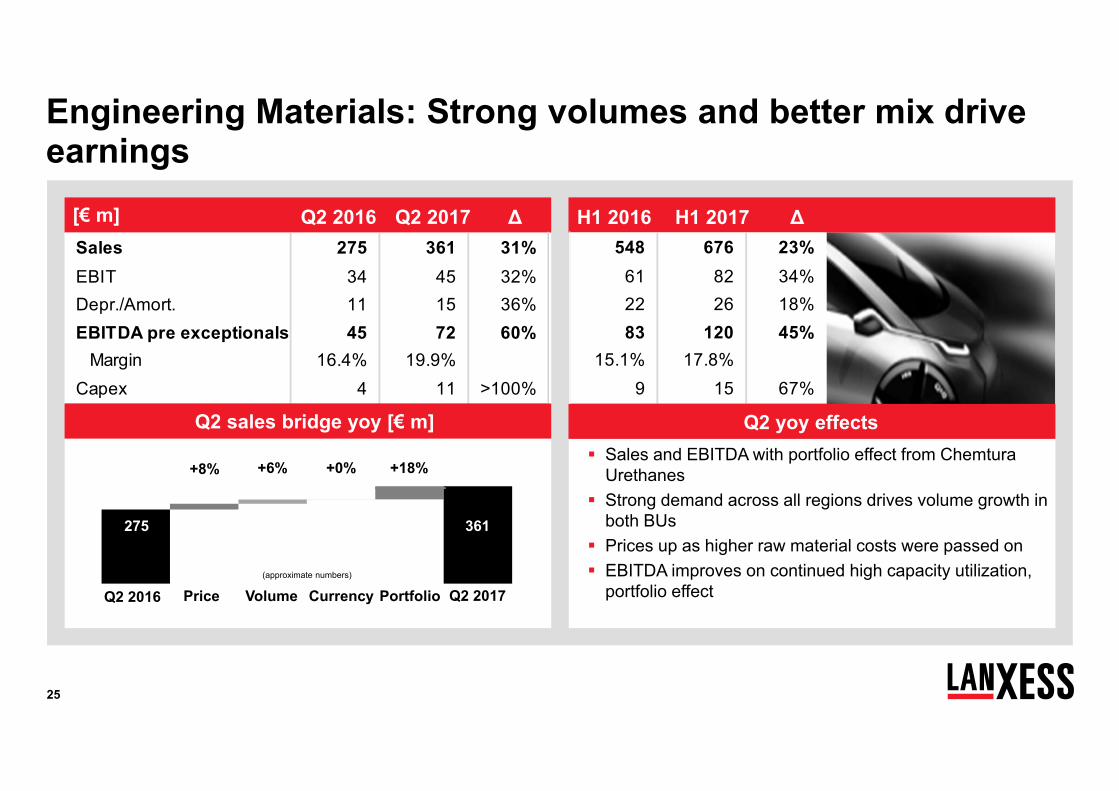
Engineering Materials: Strong volumes and better mix drive earnings
Q4 2015 Q4 2016 ∆[€ m]
Sales and EBITDA with portfolio effect from ChemturaUrethanes
Strong demand across all regions drives volume growth in both BUs
Prices up as higher raw material costs were passed on EBITDA improves on continued high capacity utilization,
portfolio effect
+8% +6% +0% +18%
Price Volume Currency Portfolio(approximate numbers)
361275
Q2 2017Q2 2016
[€ m] Q2 2016 Q2 2017 ∆ H1 2016 H1 2017 ∆Sales 275 361 31%EBIT 34 45 32%Depr./Amort. 11 15 36%EBITDA pre exceptionals 45 72 60% Margin 16.4% 19.9%Capex 4 11 >100%
548 676 23%61 82 34%22 26 18%83 120 45%
15.1% 17.8%9 15 67%
Q2 yoy effectsQ2 sales bridge yoy [€ m]
26
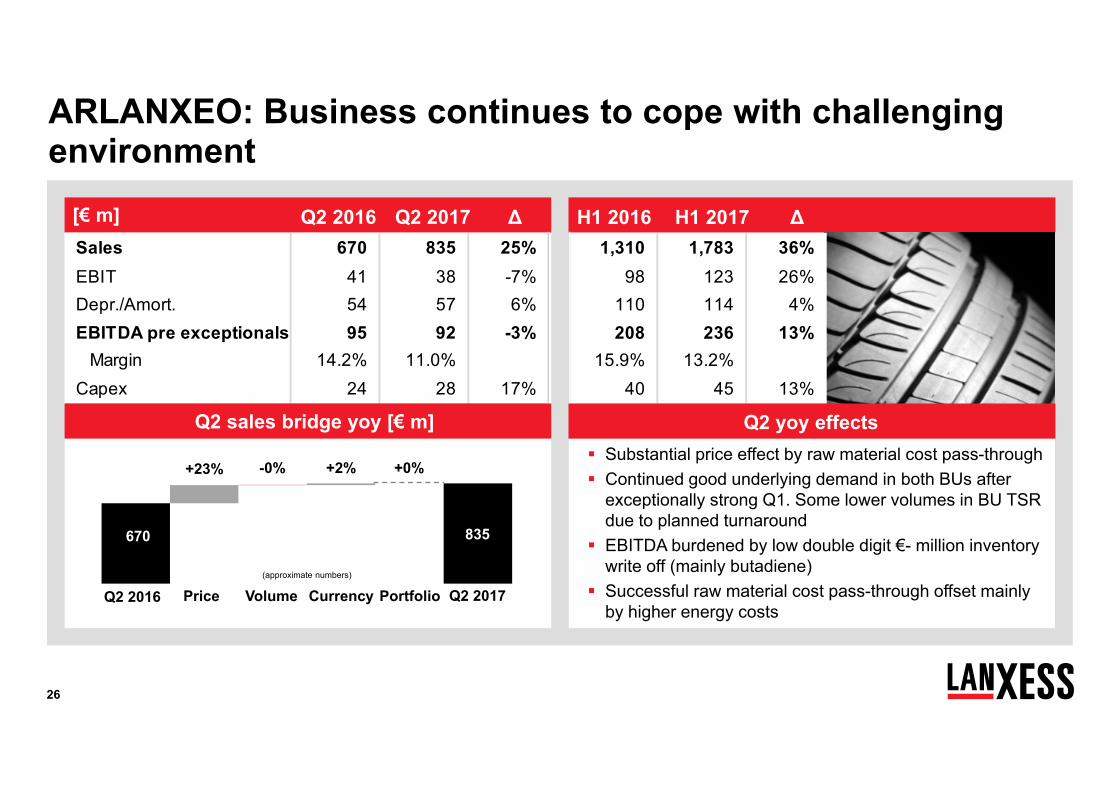
ARLANXEO: Business continues to cope with challenging environment
Q4 2015 Q4 2016 ∆[€ m]
Substantial price effect by raw material cost pass-through Continued good underlying demand in both BUs after
exceptionally strong Q1. Some lower volumes in BU TSR due to planned turnaround
EBITDA burdened by low double digit €- million inventory write off (mainly butadiene)
Successful raw material cost pass-through offset mainly by higher energy costs
FY 2015 FY 2016 ∆
+23% -0% +2% +0%
Price Volume Currency Portfolio Q2 2017Q2 2016(approximate numbers)
835670
[€ m] Q2 2016 Q2 2017 ∆
update
H1 2016 H1 2017 ∆Sales 670 835 25%EBIT 41 38 -7%Depr./Amort. 54 57 6%EBITDA pre exceptionals 95 92 -3% Margin 14.2% 11.0%Capex 24 28 17%
1,310 1,783 36%98 123 26%
110 114 4%208 236 13%
15.9% 13.2%40 45 13%
Q2 sales bridge yoy [€ m] Q2 yoy effects
27
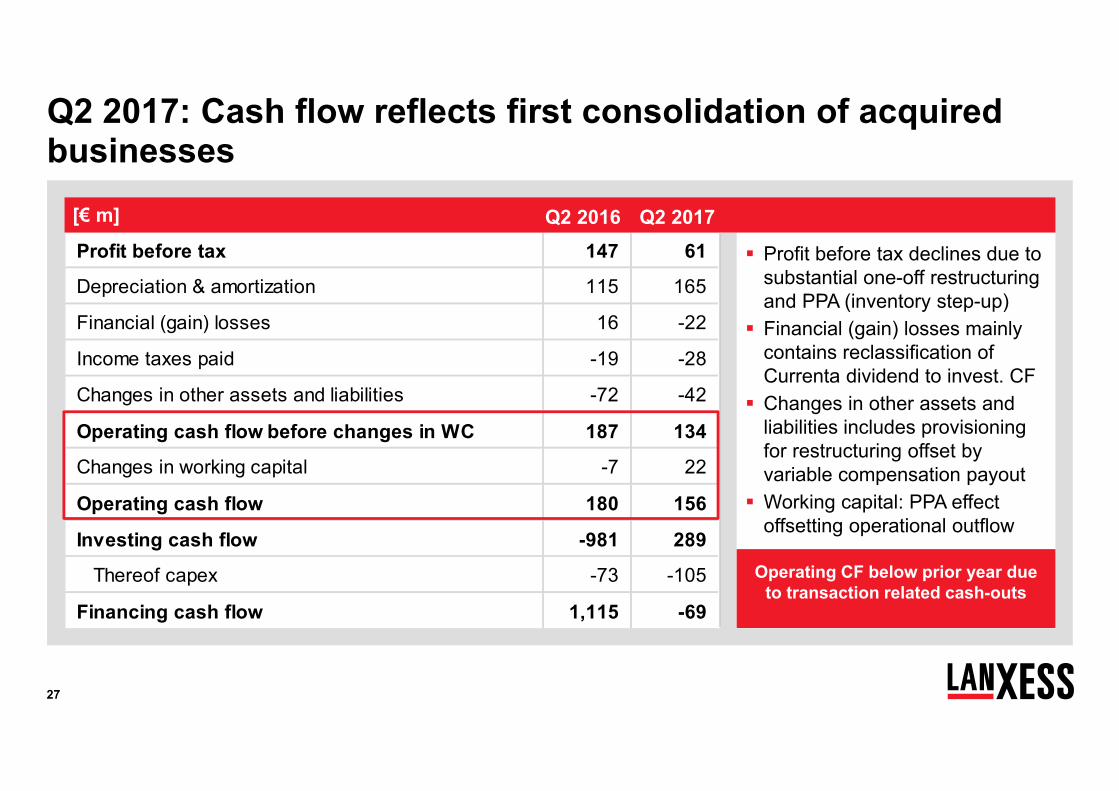
Q2 2017: Cash flow reflects first consolidation of acquired businesses
Profit before tax declines due to substantial one-off restructuring and PPA (inventory step-up)
Financial (gain) losses mainly contains reclassification of Currenta dividend to invest. CF
Changes in other assets and liabilities includes provisioning for restructuring offset by variable compensation payout
Working capital: PPA effect offsetting operational outflow
Profit before tax 147 61
Depreciation & amortization 115 165
Financial (gain) losses 16 -22
Income taxes paid -19 -28
Changes in other assets and liabilities -72 -42
Operating cash flow before changes in WC 187 134
Changes in working capital -7 22
Operating cash flow 180 156
Investing cash flow -981 289
Thereof capex -73 -105
Financing cash flow 1,115 -69
[€ m][€ m][€ m] Q2 2016 Q2 2017
Operating CF below prior year due to transaction related cash-outs
28
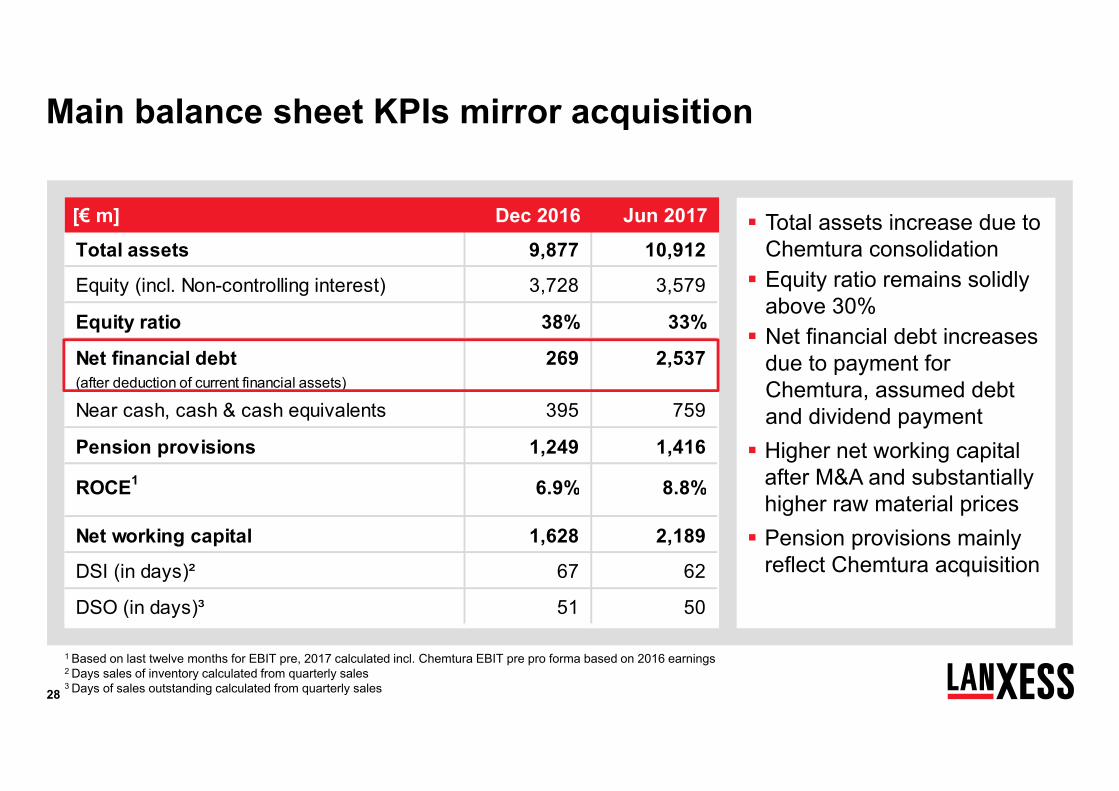
Main balance sheet KPIs mirror acquisition
Total assets increase due to Chemtura consolidation Equity ratio remains solidly
above 30% Net financial debt increases
due to payment for Chemtura, assumed debt and dividend payment Higher net working capital
after M&A and substantially higher raw material prices Pension provisions mainly
reflect Chemtura acquisition
1 Based on last twelve months for EBIT pre, 2017 calculated incl. Chemtura EBIT pre pro forma based on 2016 earnings2 Days sales of inventory calculated from quarterly sales3 Days of sales outstanding calculated from quarterly sales
Total assets 9,877 10,912
Equity (incl. Non-controlling interest) 3,728 3,579
Equity ratio 38% 33%
Net financial debt 269 2,537(after deduction of current financial assets)
Near cash, cash & cash equivalents 395 759
Pension provisions 1,249 1,416
ROCE1 6.9% 8.8%
Net working capital 1,628 2,189
DSI (in days)² 67 62
DSO (in days)³ 51 50
Dec 2016[€ m] Jun 2017
29
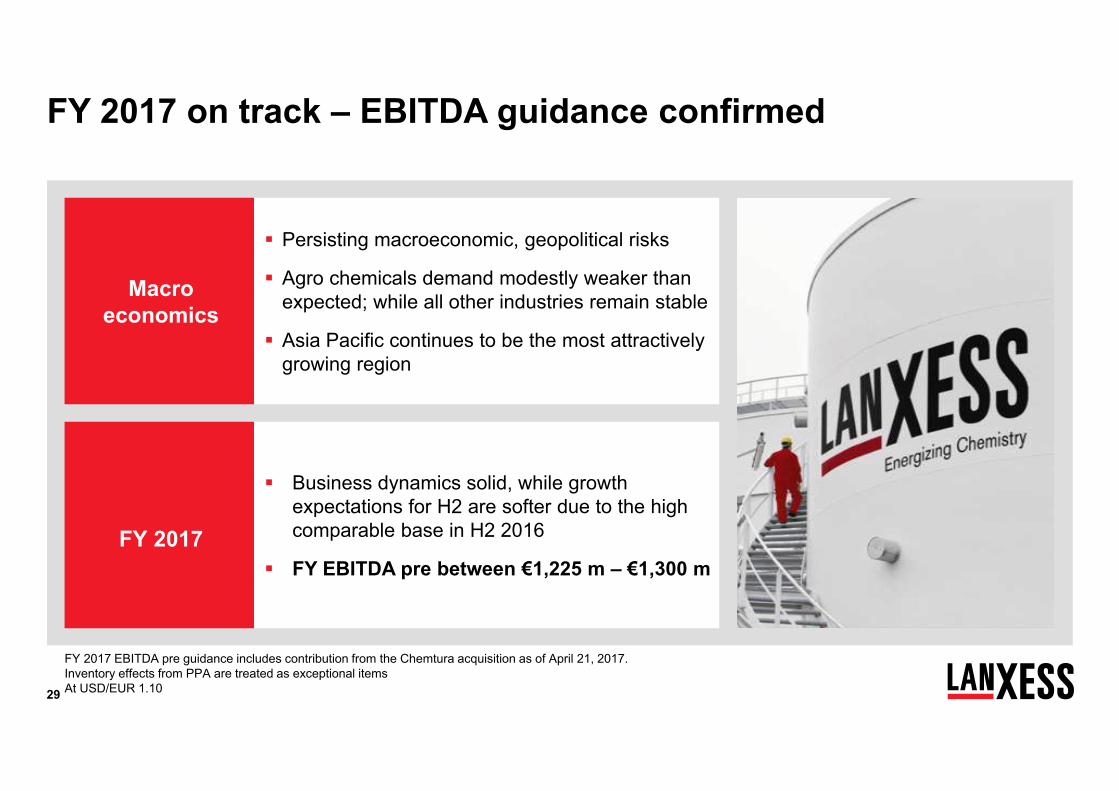
Macro economics
Persisting macroeconomic, geopolitical risks
Agro chemicals demand modestly weaker than expected; while all other industries remain stable
Asia Pacific continues to be the most attractively growing region
FY 2017 on track – EBITDA guidance confirmed
FY 2017 EBITDA pre guidance includes contribution from the Chemtura acquisition as of April 21, 2017. Inventory effects from PPA are treated as exceptional itemsAt USD/EUR 1.10
FY 2017
Business dynamics solid, while growth expectations for H2 are softer due to the high comparable base in H2 2016
FY EBITDA pre between €1,225 m – €1,300 m
30
Agenda
Expanding our strengths
Q2 2017 and guidance – Performing in the new LANXESS structure
Backup

Backup
32
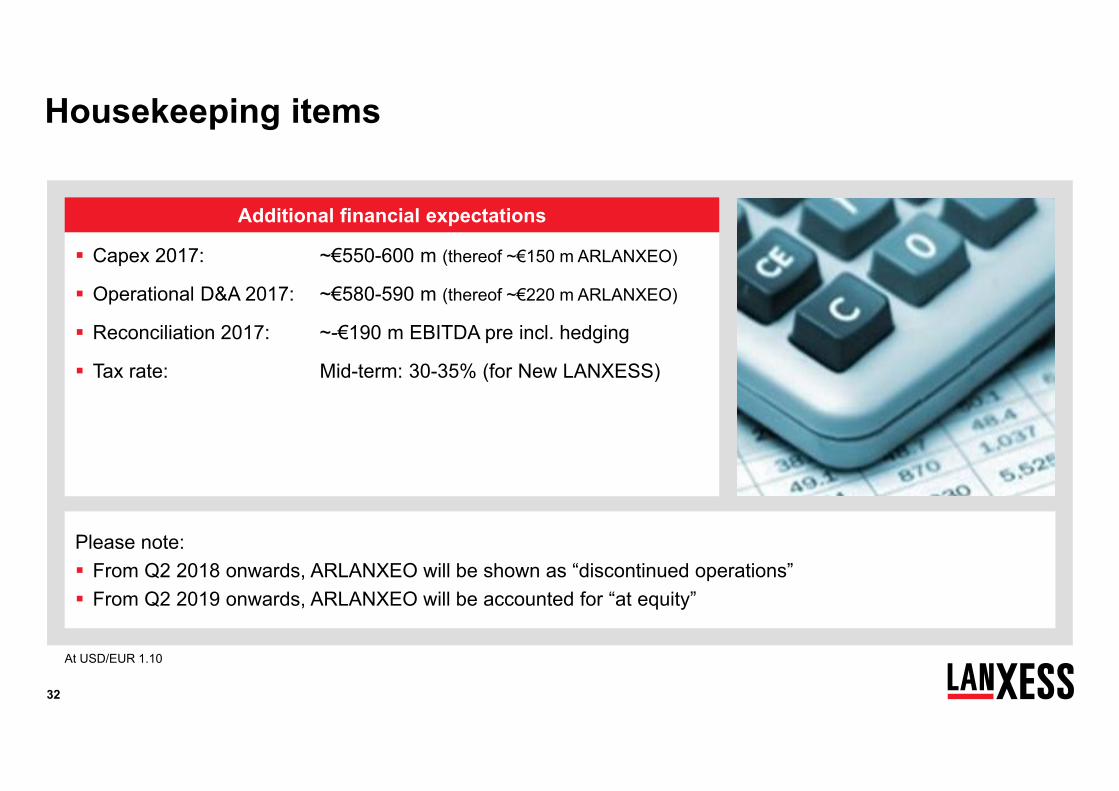
Additional financial expectations
Housekeeping items
Capex 2017: ~€550-600 m (thereof ~€150 m ARLANXEO)
Operational D&A 2017: ~€580-590 m (thereof ~€220 m ARLANXEO)
Reconciliation 2017: ~-€190 m EBITDA pre incl. hedging
Tax rate: Mid-term: 30-35% (for New LANXESS)
At USD/EUR 1.10
Please note: From Q2 2018 onwards, ARLANXEO will be shown as “discontinued operations” From Q2 2019 onwards, ARLANXEO will be accounted for “at equity”
33
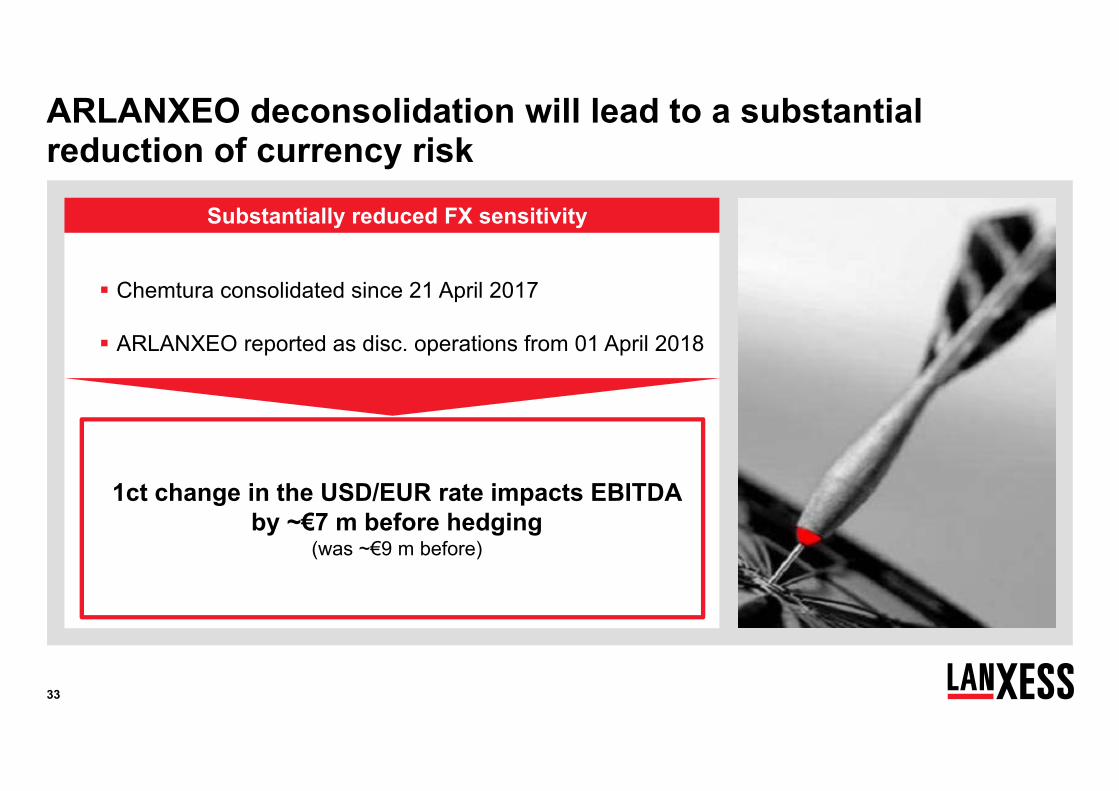
ARLANXEO deconsolidation will lead to a substantial reduction of currency risk
Chemtura consolidated since 21 April 2017
ARLANXEO reported as disc. operations from 01 April 2018
Substantially reduced FX sensitivity
1ct change in the USD/EUR rate impacts EBITDA by ~€7 m before hedging
(was ~€9 m before)
34
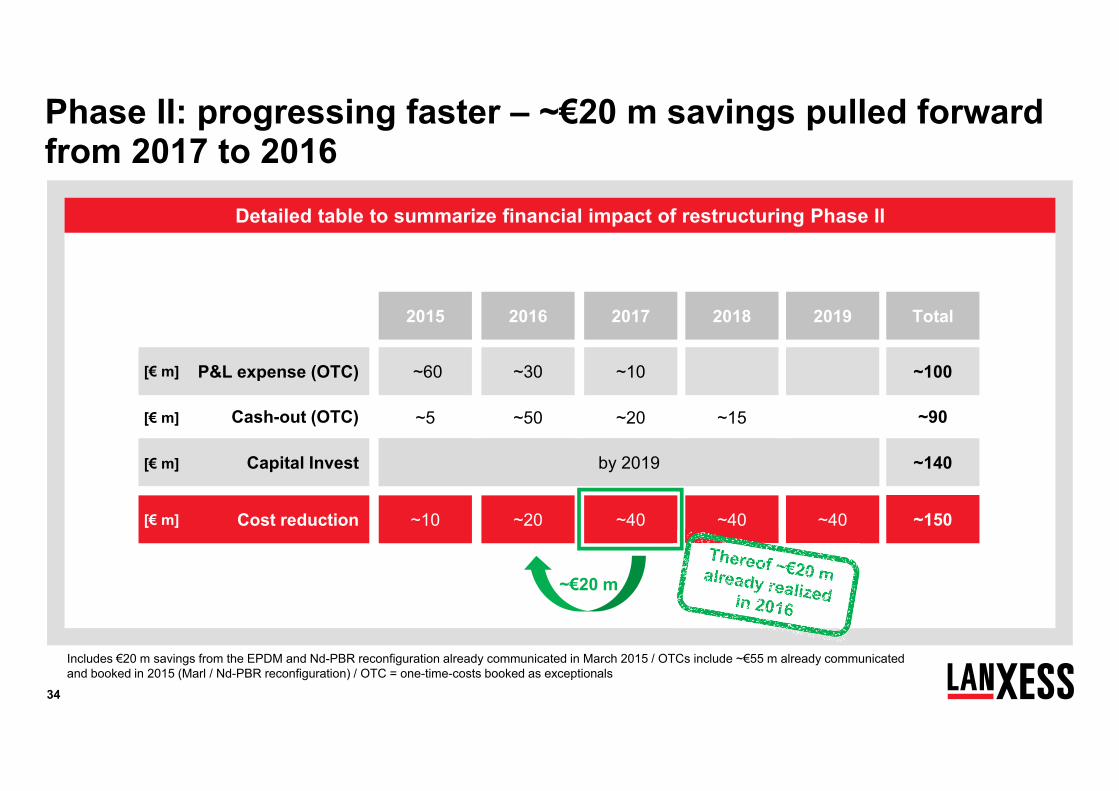
Phase II: progressing faster – ~€20 m savings pulled forward from 2017 to 2016
~20~50~5Cash-out (OTC) ~15
201720162015 2018
~10~30~60P&L expense (OTC)
Capital Invest
~40~20~10Cost reduction ~40
Detailed table to summarize financial impact of restructuring Phase II
[€ m]
[€ m]
[€ m]
[€ m]
2019
~40
Includes €20 m savings from the EPDM and Nd-PBR reconfiguration already communicated in March 2015 / OTCs include ~€55 m already communicated and booked in 2015 (Marl / Nd-PBR reconfiguration) / OTC = one-time-costs booked as exceptionals
~150
~90
~140
Total
~100
by 2019
~€20 m
35
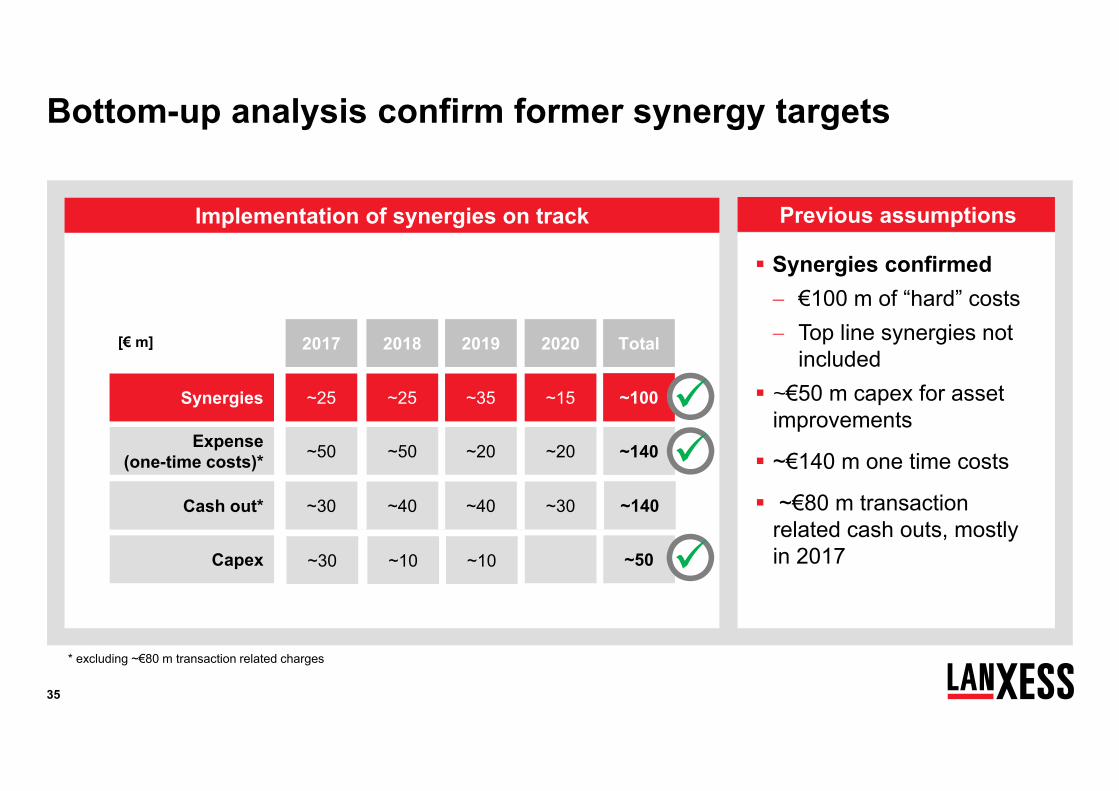
Bottom-up analysis confirm former synergy targets
20182017 2019
Implementation of synergies on track
[€ m] 2020
~25~25Synergies ~35 ~15 ~100
~10~30Capex ~10 ~50
Total
Synergies confirmed €100 m of “hard” costs Top line synergies not
included ~€50 m capex for asset
improvements
~€140 m one time costs
~€80 m transaction related cash outs, mostly in 2017
Previous assumptions
* excluding ~€80 m transaction related charges
~50~50Expense (one-time costs)* ~20 ~20 ~140
not providedCash out* ~40~30Cash out* ~40 ~30 ~140
36
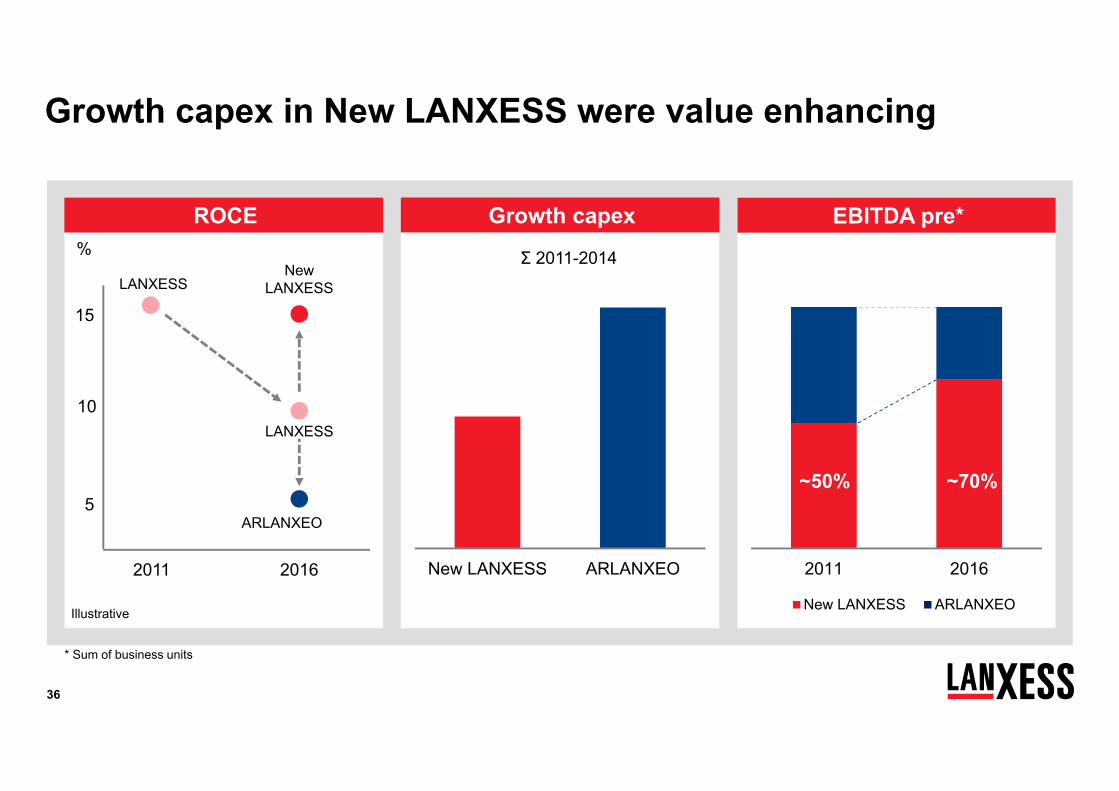
2011 2016
New LANXESS ARLANXEO
~50% ~70%
* Sum of business units
New LANXESS ARLANXEO2011 2016
15
10
5
New LANXESS
ARLANXEO
%
LANXESS
LANXESS
EBITDA pre*Growth capexROCE
Σ 2011-2014
Growth capex in New LANXESS were value enhancing
Illustrative
37
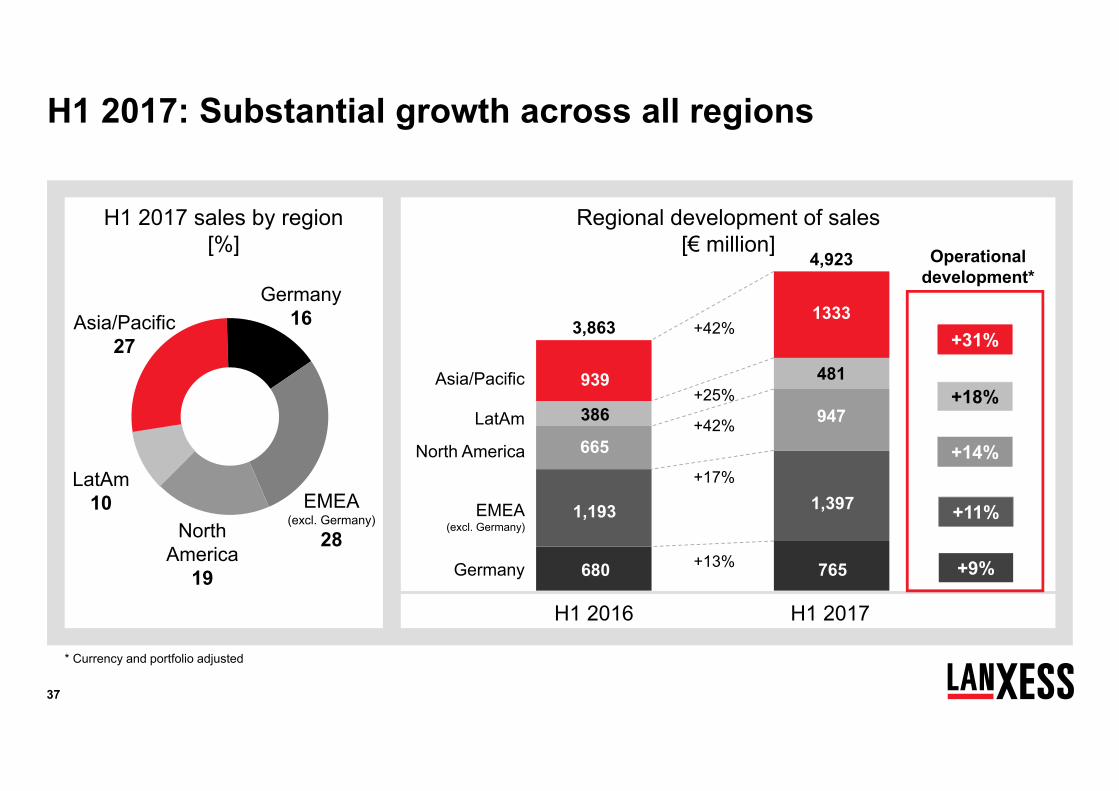
+25%
+13%
+17%
+42%
Regional development of sales[€ million] Operational
development*
EMEA(excl. Germany)
North America
Germany
Asia/Pacific
H1 2016 H1 2017
4,923
3,8631333
765
947
1,397
481
+42%
+31%
+14%
+11%
+9%
+18%LatAm
EMEA(excl. Germany)
28NorthAmerica
19
H1 2017 sales by region [%]
939
680
665
1,193
386
* Currency and portfolio adjusted
LatAm10
Asia/Pacific27
Germany16
H1 2017: Substantial growth across all regions

38
670 835
275361330367213
440443
505
Q2 2017: Strong operational and M&A driven increase in sales and EBITDA
Total group sales including reconciliation
Sales EBITDA pre
Q2 2016 Q2 2017
1,943
+30%
+107%
+25%
[€ m]
95 92
45 7269
8045
7588
97
-49 -49
Q2 2016 Q2 2017
293
367+25%
-3%
+10%
+16%
[€ m]
Advanced Intermediates Engineering MaterialsPerformance Chemicals ReconciliationARLANXEO
+14%
+67%New LANXESS
HPMURE
TSRHPE
SGO AII
MPP
IPGLEA
LPT
+31%
RCH
ADD
Specialty Additives
2,522
+11%+60%
39
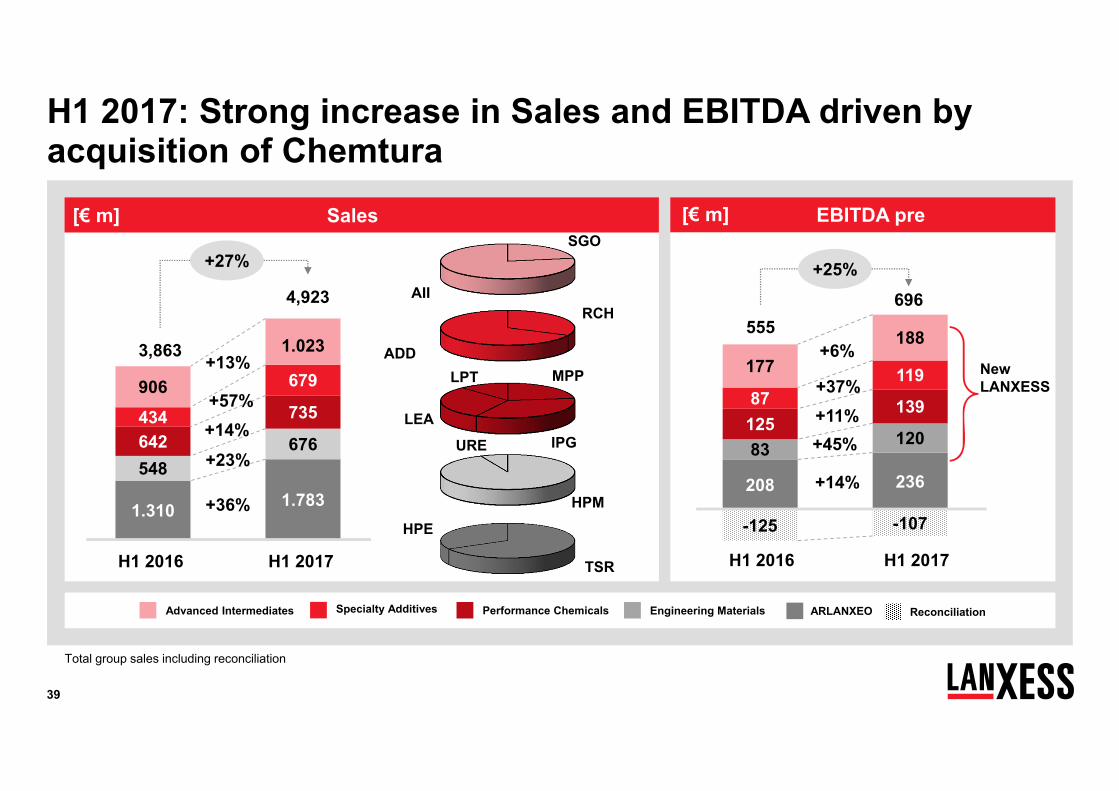
1.310 1.783
548676642735434
679906
1.023
H1 2017: Strong increase in Sales and EBITDA driven by acquisition of Chemtura
Total group sales including reconciliation
Sales EBITDA pre
H1 2016 H1 2017
3,863
+27%
+57%
+36%
[€ m]
208 236
83 120125
13987119177188
-125 -107
H1 2016 H1 2017
555696
+25%
+14%
+6%
+11%
[€ m]
Advanced Intermediates Engineering MaterialsPerformance Chemicals
+13%+37%
New LANXESS
HPM
URE
SGO
AII
MPP
IPGLEA
LPT
+23%
RCH
ADD
Specialty Additives
4,923
+14%+45%
TSR
HPE
ReconciliationARLANXEO
40
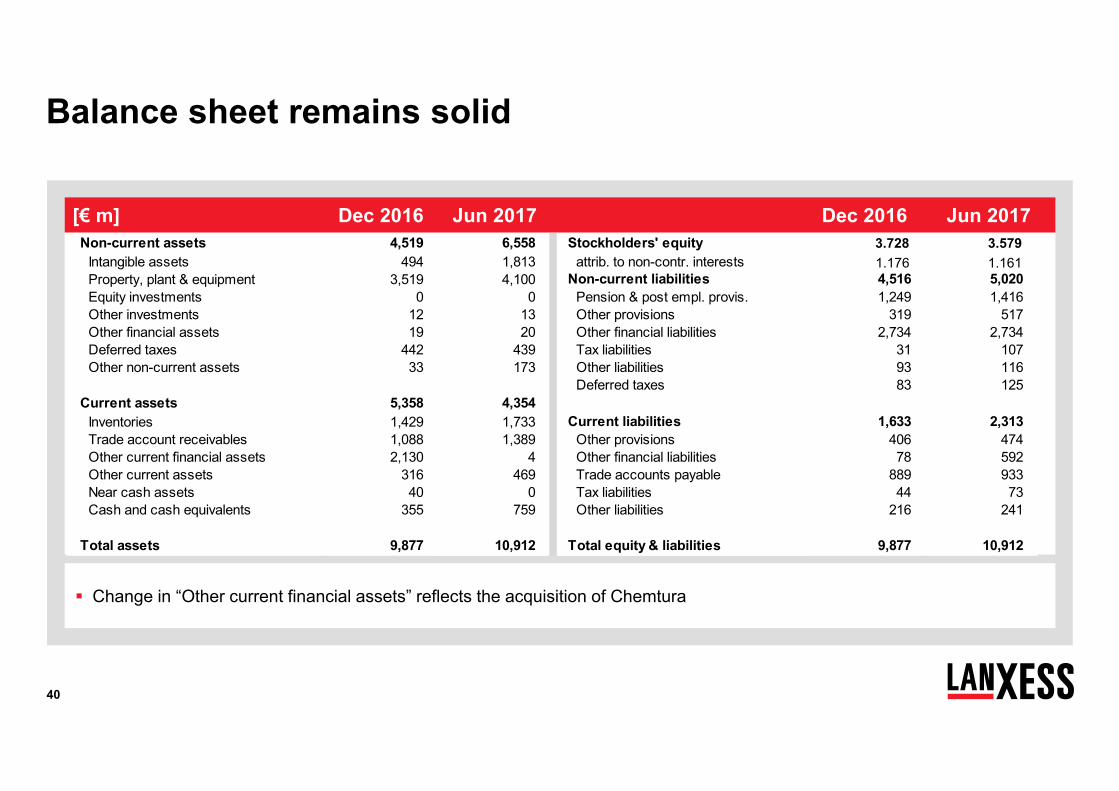
Change in “Other current financial assets” reflects the acquisition of Chemtura
Balance sheet remains solid
Non-current assets 4,519 6,558 Stockholders' equity 3,728 3,579Intangible assets 494 1,813 attrib. to non-contr. interests 1,176 1,161Property, plant & equipment 3,519 4,100 Non-current liabilities 4,516 5,020Equity investments 0 0 Pension & post empl. provis. 1,249 1,416Other investments 12 13 Other provisions 319 517Other financial assets 19 20 Other financial liabilities 2,734 2,734Deferred taxes 442 439 Tax liabilities 31 107Other non-current assets 33 173 Other liabilities 93 116
Deferred taxes 83 125Current assets 5,358 4,354
Inventories 1,429 1,733 Current liabilities 1,633 2,313Trade account receivables 1,088 1,389 Other provisions 406 474Other current financial assets 2,130 4 Other financial liabilities 78 592Other current assets 316 469 Trade accounts payable 889 933Near cash assets 40 0 Tax liabilities 44 73Cash and cash equivalents 355 759 Other liabilities 216 241
Total assets 9,877 10,912 Total equity & liabilities 9,877 10,912
[€ m] Dec 2016 Dec 2016Jun 2017 Jun 20173.5793.728
1.176 1.161
41
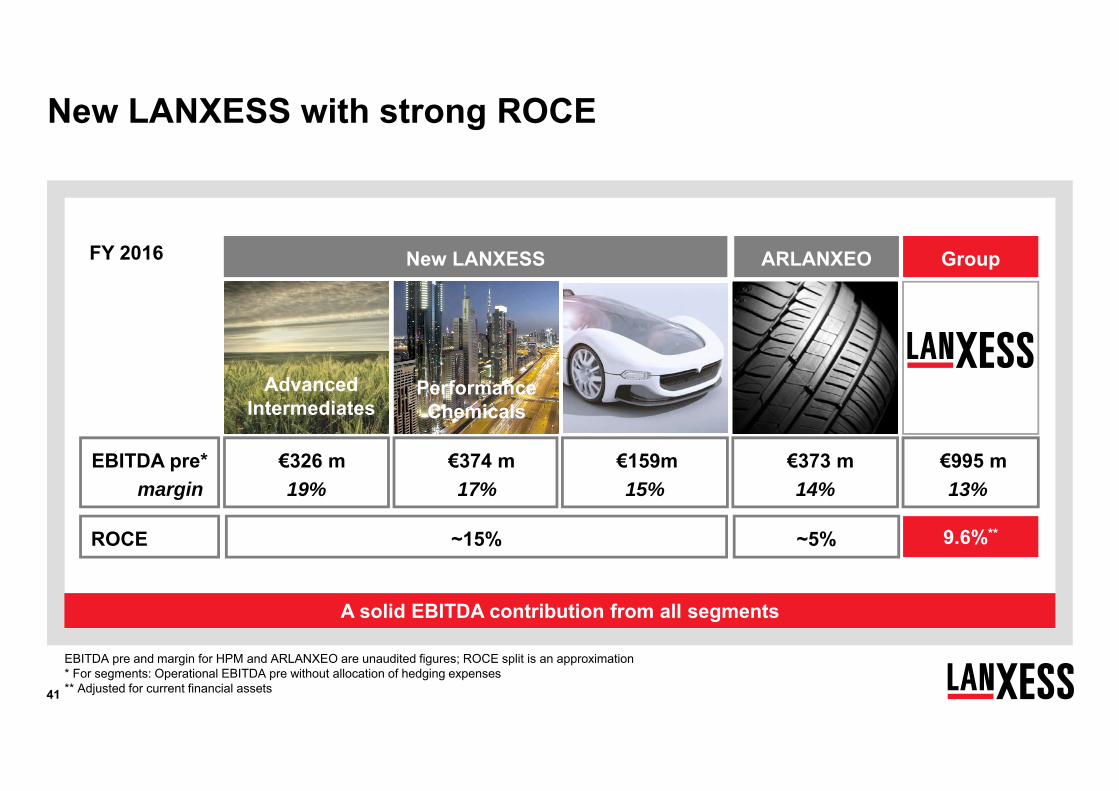
New LANXESS with strong ROCE
New LANXESS ARLANXEO
Advanced Intermediates
Performance Chemicals
High Performance
Materials
Group
EBITDA pre*margin
€326 m19%
€374 m17%
ROCE ~15% ~5% 9.6%**
€995 m13%
€159m15%
€373 m14%
EBITDA pre and margin for HPM and ARLANXEO are unaudited figures; ROCE split is an approximation * For segments: Operational EBITDA pre without allocation of hedging expenses** Adjusted for current financial assets
A solid EBITDA contribution from all segments
FY 2016

42
Further potential for portfolio optimization
* Reporting segment after acquisition of Chemtura** ARLANXEO fully consolidated by LANXESS for the first three years (as of April 1, 2016)
First steps of portfolio optimization have been initiated in parts of LANXESS’ portfolio
Strategic directive for further portfolio optimization is already set
Ongoing implementation
AdvancedIntermediates
Advanced Industrial Intermediates
Saltigo
Tire & Specialty Rubbers
High Performance ElastomersARLANXEO**
Material Protection Products
Inorganic PigmentsLeather
Liquid Purification Technologies
PerformanceChemicals
High Performance MaterialsEngineering
MaterialsUrethane Systems*
SpecialtyAdditives*
Additives
Rhein Chemie
Sales: > €500 m Sales: €200 m – 500 m Sales: < €200 m

43
LANXESS has formed five strong segments
Additives
Rhein Chemie
AdvancedIntermediates ARLANXEOPerformance
ChemicalsEngineering
MaterialsSpecialtyAdditives
High Performance Materials
Urethane Systems
Petr. Additives &Great Lakes Solut.
Advanced Industrial Intermediates
Saltigo
Organometallics
Material ProtectionProducts
Inorganic Pigments
Leather Chemicals
Liquid Purification Technologies
Tire & Specialty Rubbers
High Performance Elastomers
Reporting structure after Chemtura acquisition
LANXESS Business Units Former Chemtura Business Units
Newly formed
44
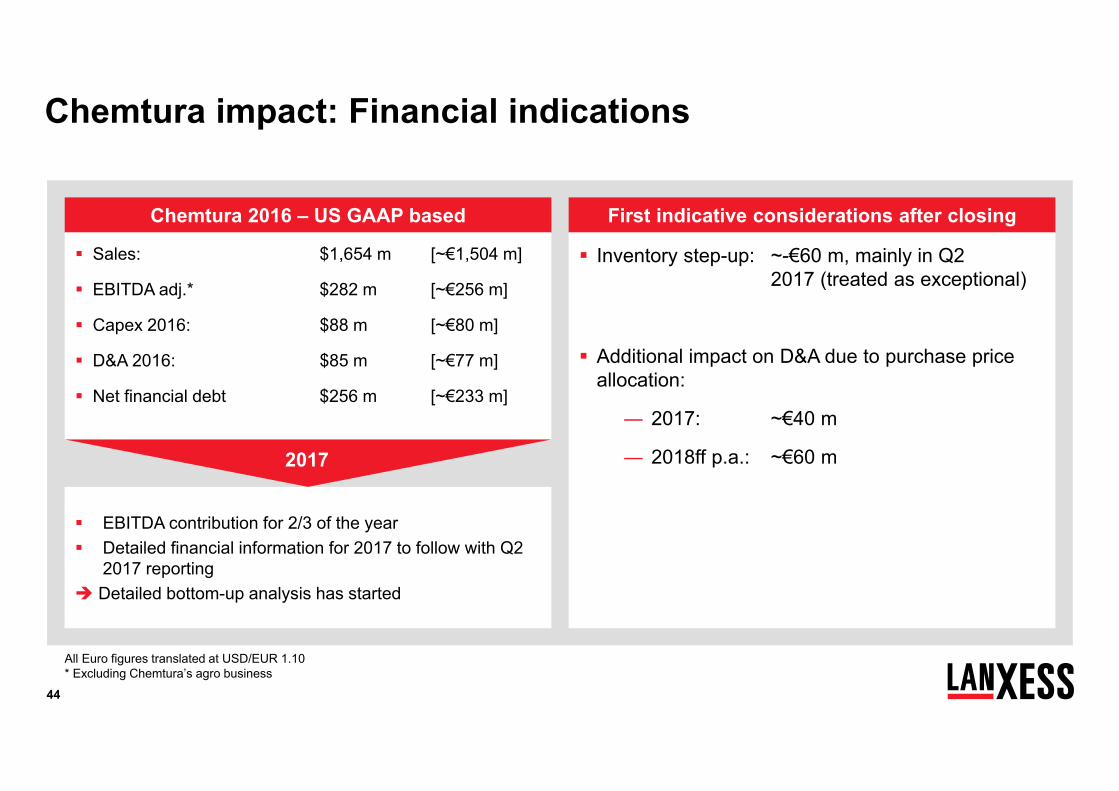
Chemtura 2016 – US GAAP based
Chemtura impact: Financial indications
Sales: $1,654 m [~€1,504 m]
EBITDA adj.* $282 m [~€256 m]
Capex 2016: $88 m [~€80 m]
D&A 2016: $85 m [~€77 m]
Net financial debt $256 m [~€233 m]
All Euro figures translated at USD/EUR 1.10* Excluding Chemtura’s agro business
First indicative considerations after closing
Inventory step-up: ~-€60 m, mainly in Q2 2017 (treated as exceptional)
Additional impact on D&A due to purchase price allocation:
― 2017: ~€40 m
― 2018ff p.a.: ~€60 m
EBITDA contribution for 2/3 of the year Detailed financial information for 2017 to follow with Q2
2017 reporting Detailed bottom-up analysis has started
2017
45
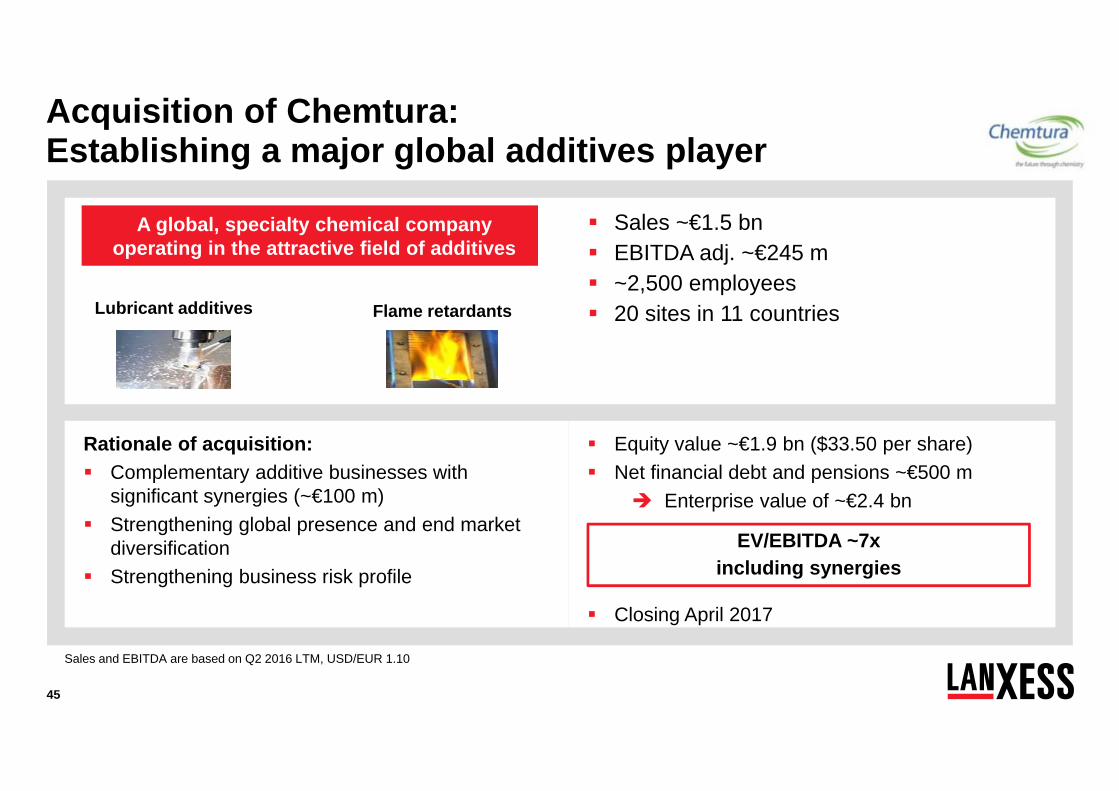
Acquisition of Chemtura: Establishing a major global additives player
Sales ~€1.5 bn EBITDA adj. ~€245 m ~2,500 employees 20 sites in 11 countries
Equity value ~€1.9 bn ($33.50 per share) Net financial debt and pensions ~€500 m
Enterprise value of ~€2.4 bn
Closing April 2017
Rationale of acquisition: Complementary additive businesses with
significant synergies (~€100 m) Strengthening global presence and end market
diversification Strengthening business risk profile
Sales and EBITDA are based on Q2 2016 LTM, USD/EUR 1.10
Flame retardantsLubricant additives
A global, specialty chemical company operating in the attractive field of additives
EV/EBITDA ~7xincluding synergies
46
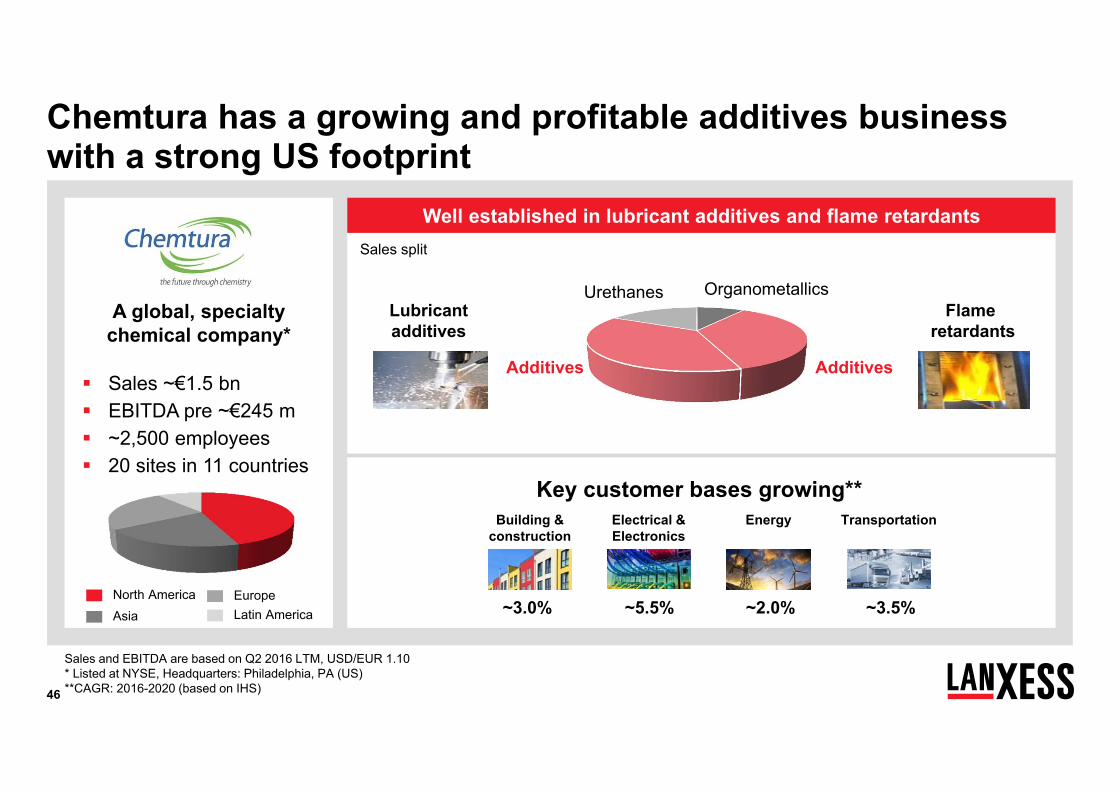
Sales ~€1.5 bn EBITDA pre ~€245 m ~2,500 employees 20 sites in 11 countries
Chemtura has a growing and profitable additives business with a strong US footprint
Well established in lubricant additives and flame retardants
Sales and EBITDA are based on Q2 2016 LTM, USD/EUR 1.10* Listed at NYSE, Headquarters: Philadelphia, PA (US)**CAGR: 2016-2020 (based on IHS)
Additives
OrganometallicsUrethanes
Additives
Flameretardants
Lubricant additives
North AmericaAsia
EuropeLatin America
A global, specialty chemical company*
Building & construction
Electrical & Electronics
Energy Transportation
~3.0% ~5.5% ~2.0% ~3.5%
Key customer bases growing**
Sales split
47
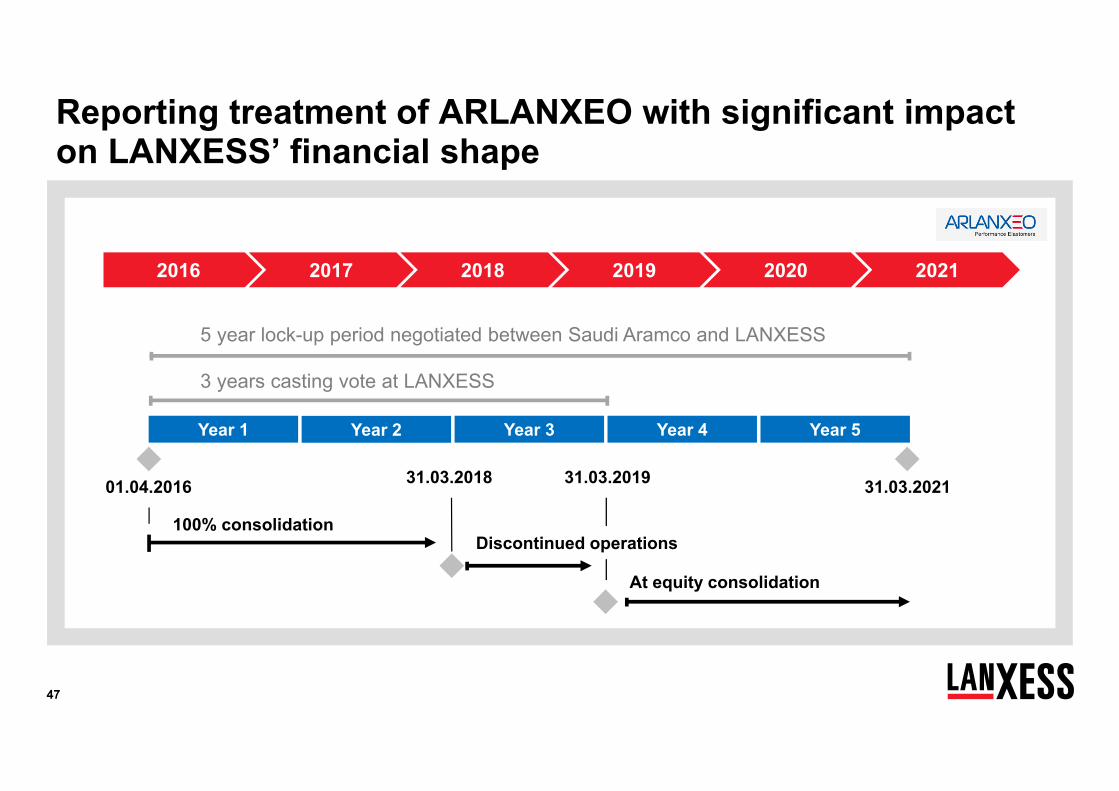
2016 2017 2018 2019 2020 2021
Year 1
01.04.2016 31.03.201931.03.2018 31.03.2021
Year 2 Year 3 Year 4 Year 5
100% consolidation
At equity consolidation
Discontinued operations
Reporting treatment of ARLANXEO with significant impact on LANXESS’ financial shape
5 year lock-up period negotiated between Saudi Aramco and LANXESS
3 years casting vote at LANXESS
48
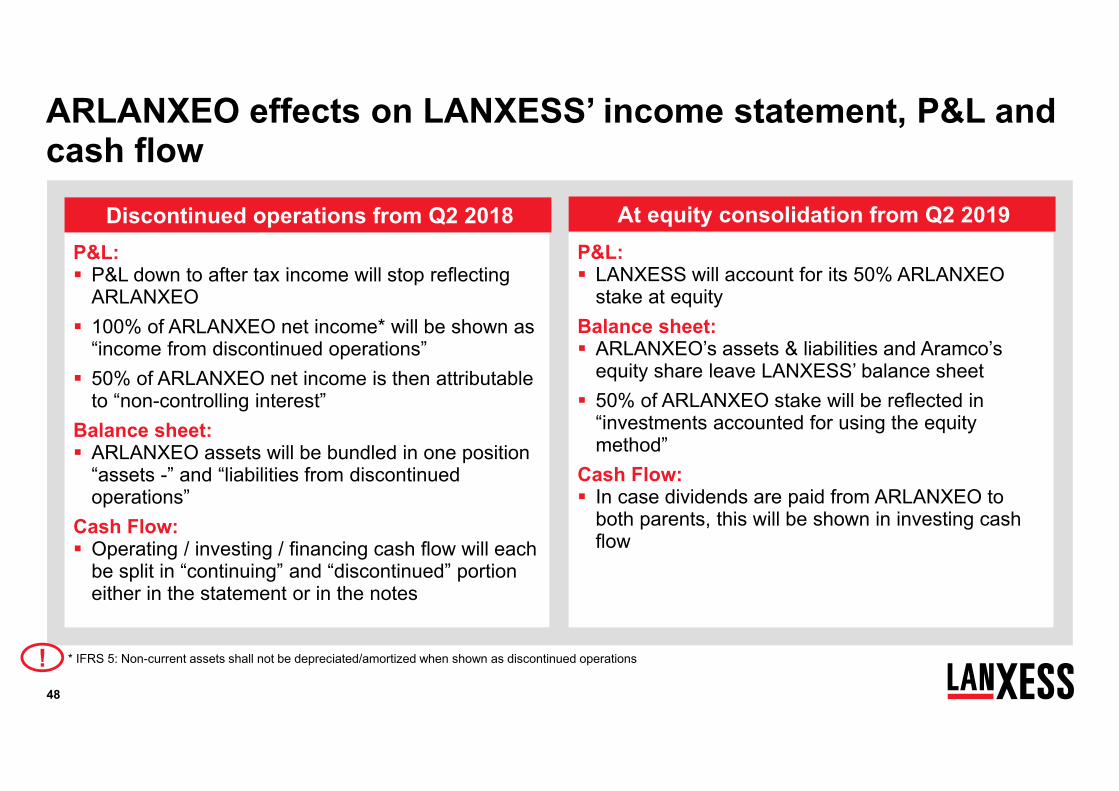
ARLANXEO effects on LANXESS’ income statement, P&L and cash flow
P&L: LANXESS will account for its 50% ARLANXEO
stake at equityBalance sheet: ARLANXEO’s assets & liabilities and Aramco’s
equity share leave LANXESS’ balance sheet 50% of ARLANXEO stake will be reflected in
“investments accounted for using the equity method”
Cash Flow: In case dividends are paid from ARLANXEO to
both parents, this will be shown in investing cash flow
Discontinued operations from Q2 2018 At equity consolidation from Q2 2019 P&L: P&L down to after tax income will stop reflecting
ARLANXEO 100% of ARLANXEO net income* will be shown as
“income from discontinued operations” 50% of ARLANXEO net income is then attributable
to “non-controlling interest”Balance sheet: ARLANXEO assets will be bundled in one position
“assets -” and “liabilities from discontinued operations”
Cash Flow: Operating / investing / financing cash flow will each
be split in “continuing” and “discontinued” portion either in the statement or in the notes
* IFRS 5: Non-current assets shall not be depreciated/amortized when shown as discontinued operations!
49
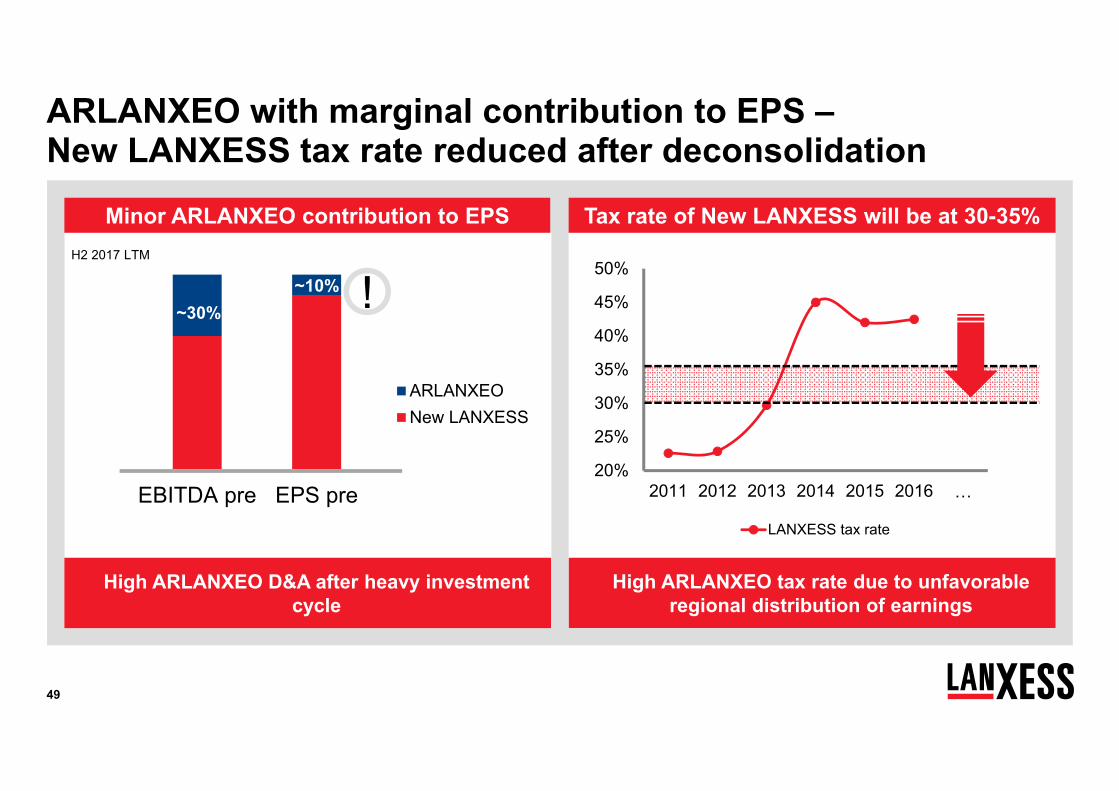
EBITDA pre EPS pre
ARLANXEONew LANXESS
ARLANXEO with marginal contribution to EPS –New LANXESS tax rate reduced after deconsolidation
Minor ARLANXEO contribution to EPS
!~30%~10%
H2 2017 LTM
Tax rate of New LANXESS will be at 30-35%
20%
25%
30%
35%
40%
45%
50%
2011 2012 2013 2014 2015 2016 …
LANXESS tax rate
High ARLANXEO D&A after heavy investment cycle
High ARLANXEO tax rate due to unfavorableregional distribution of earnings
50
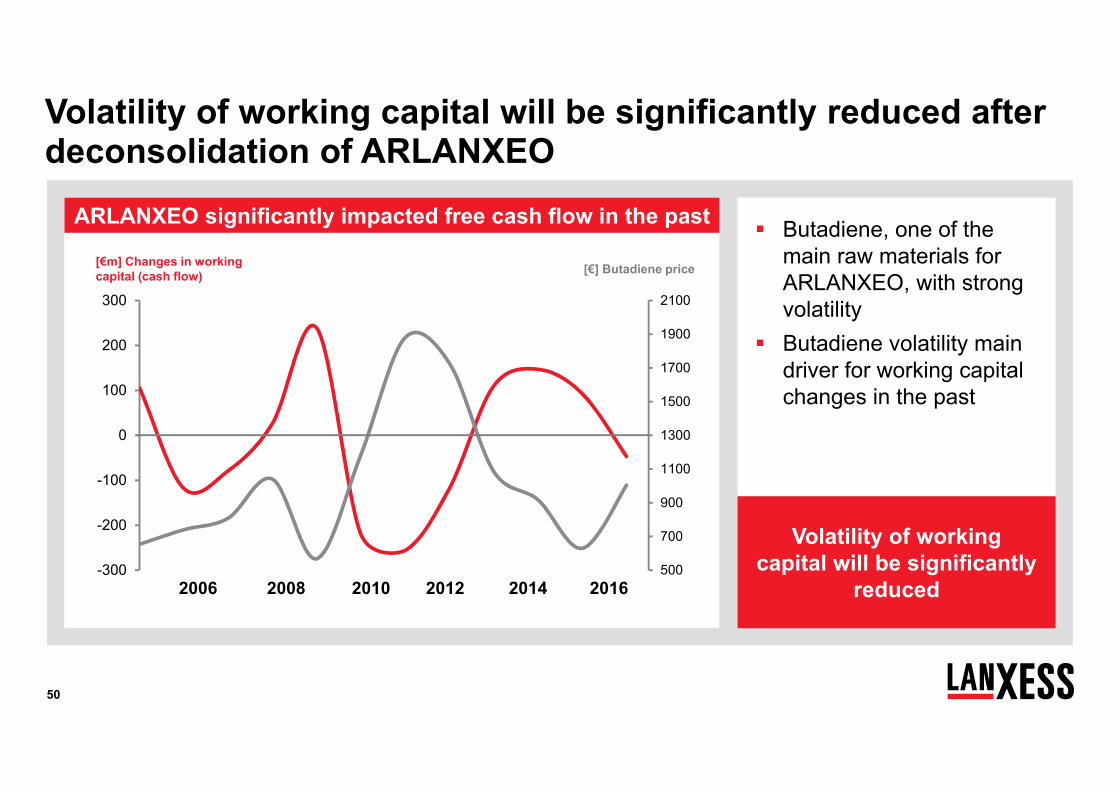
Volatility of working capital will be significantly reduced after deconsolidation of ARLANXEO
500
700
900
1100
1300
1500
1700
1900
2100
-300
-200
-100
0
100
200
300
2006 2008 2010 2012 2014 2016
[€m] Changes in workingcapital (cash flow) [€] Butadiene price
Butadiene, one of the main raw materials for ARLANXEO, with strong volatility
Butadiene volatility main driver for working capital changes in the past
Volatility of working capital will be significantly
reduced
ARLANXEO significantly impacted free cash flow in the past
51
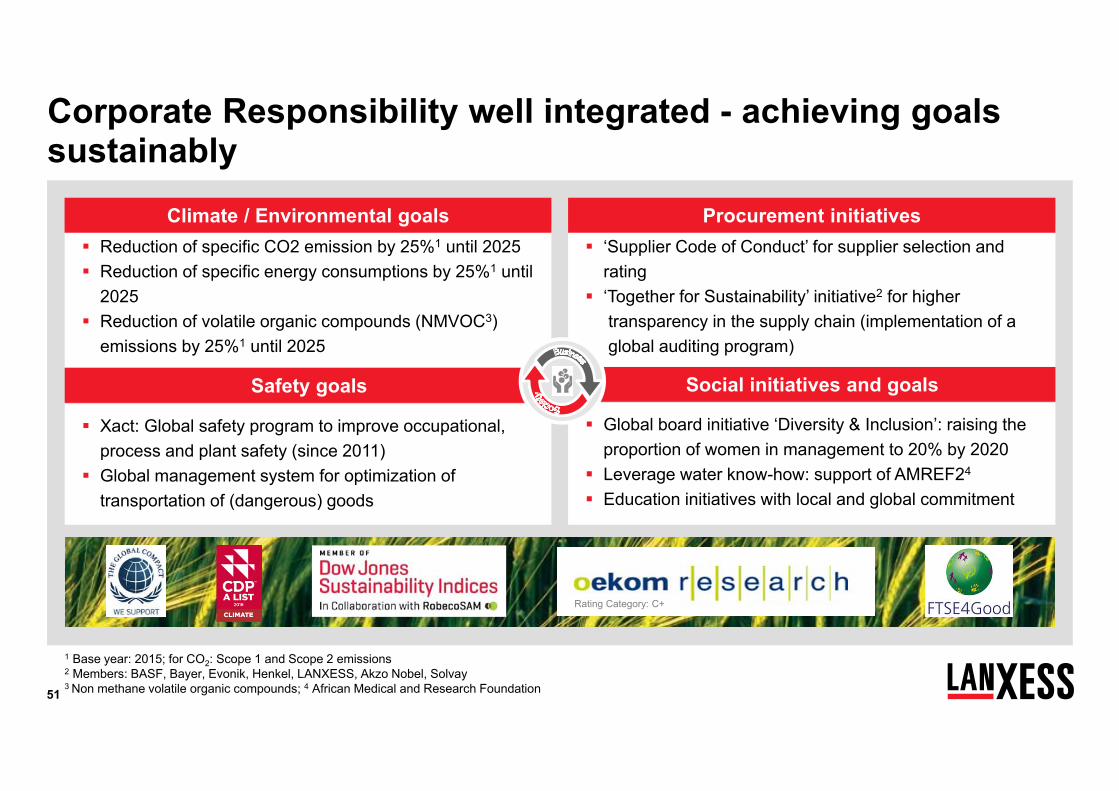
Xact: Global safety program to improve occupational, process and plant safety (since 2011)
Global management system for optimization of transportation of (dangerous) goods
Safety goals Social initiatives and goals
Reduction of specific CO2 emission by 25%1 until 2025 Reduction of specific energy consumptions by 25%1 until
2025 Reduction of volatile organic compounds (NMVOC3)
emissions by 25%1 until 2025
‘Supplier Code of Conduct’ for supplier selection and rating
‘Together for Sustainability’ initiative2 for higher transparency in the supply chain (implementation of a global auditing program)
Corporate Responsibility well integrated - achieving goals sustainably
Climate / Environmental goals Procurement initiatives
Rating Category: C+
Global board initiative ‘Diversity & Inclusion’: raising the proportion of women in management to 20% by 2020
Leverage water know-how: support of AMREF24
Education initiatives with local and global commitment
1 Base year: 2015; for CO2: Scope 1 and Scope 2 emissions 2 Members: BASF, Bayer, Evonik, Henkel, LANXESS, Akzo Nobel, Solvay3 Non methane volatile organic compounds; 4 African Medical and Research Foundation
52
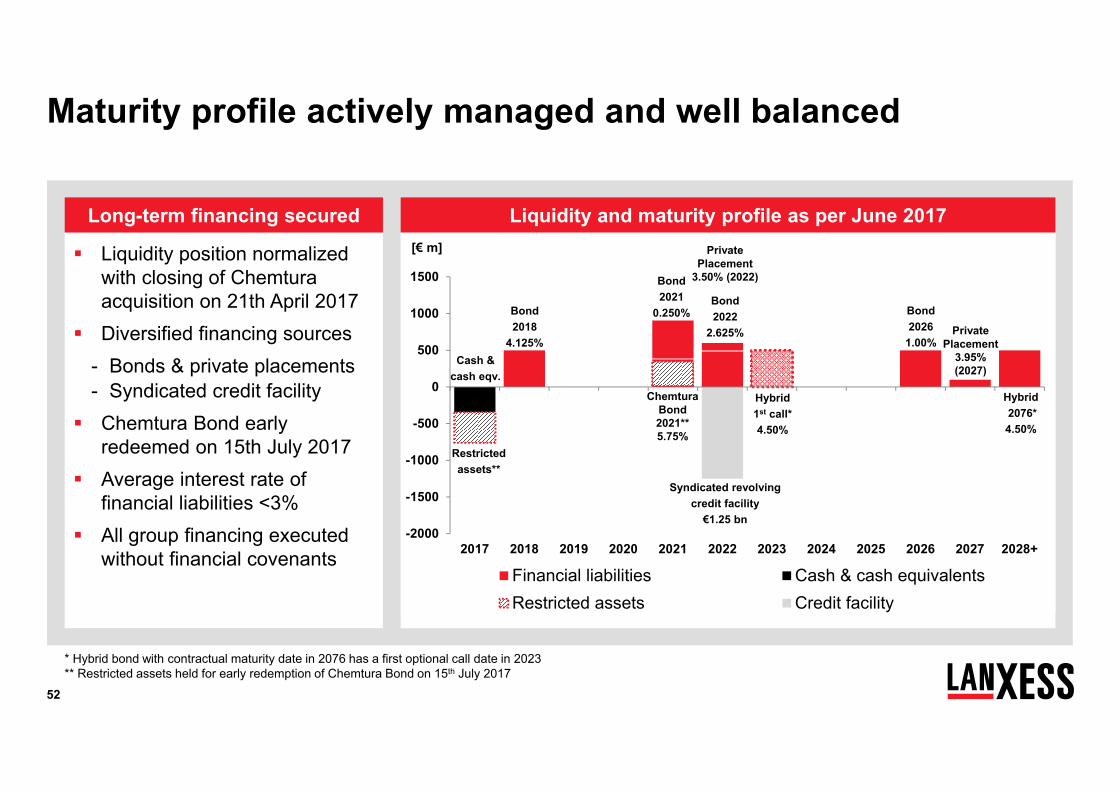
Maturity profile actively managed and well balanced
Liquidity position normalized with closing of Chemtura acquisition on 21th April 2017
Diversified financing sources- Bonds & private placements- Syndicated credit facility
Chemtura Bond early redeemed on 15th July 2017
Average interest rate of financial liabilities <3%
All group financing executed without financial covenants
Long-term financing secured
-2000
-1500
-1000
-500
0
500
1000
1500
2017 2018 2019 2020 2021 2022 2023 2024 2025 2026 2027 2028+
Financial liabilities Cash & cash equivalentsRestricted assets Credit facility
Syndicated revolving credit facility
€1.25 bn
Bond 2018
4.125%
[€ m]
Bond 2022
2.625%
Liquidity and maturity profile as per June 2017
PrivatePlacement
3.95% (2027)
PrivatePlacement
3.50% (2022)
Hybrid2076*4.50%
Bond 2021
0.250%
Cash & cash eqv.
* Hybrid bond with contractual maturity date in 2076 has a first optional call date in 2023** Restricted assets held for early redemption of Chemtura Bond on 15th July 2017
Bond 2026
1.00%
Hybrid1st call*4.50%
ChemturaBond2021**5.75%
Restrictedassets**

53
A word on pensions: Mind the assets
0,0%
1,0%
2,0%
3,0%
4,0%
5,0%
6,0%
7,0%
-400
0
400
800
1.200
1.600
2008 2010 2012 2014 2016
RoW Germany Tax asset & overfunding
DiscountRate Germany
Pension provision less deferred tax asset [€m] Pension Provision€1,416 m
At 4% discount rate gross pension provision declines to €1.0bn
Tax asset of €272 m and plan asset of €60 m*
~€3.60 / share
*as per 30 June 2017
442 529 522
1,047
736 790581
995 9571,085
applicable tax rate
Pension provision net of tax and plan assets
€1,085 m
54
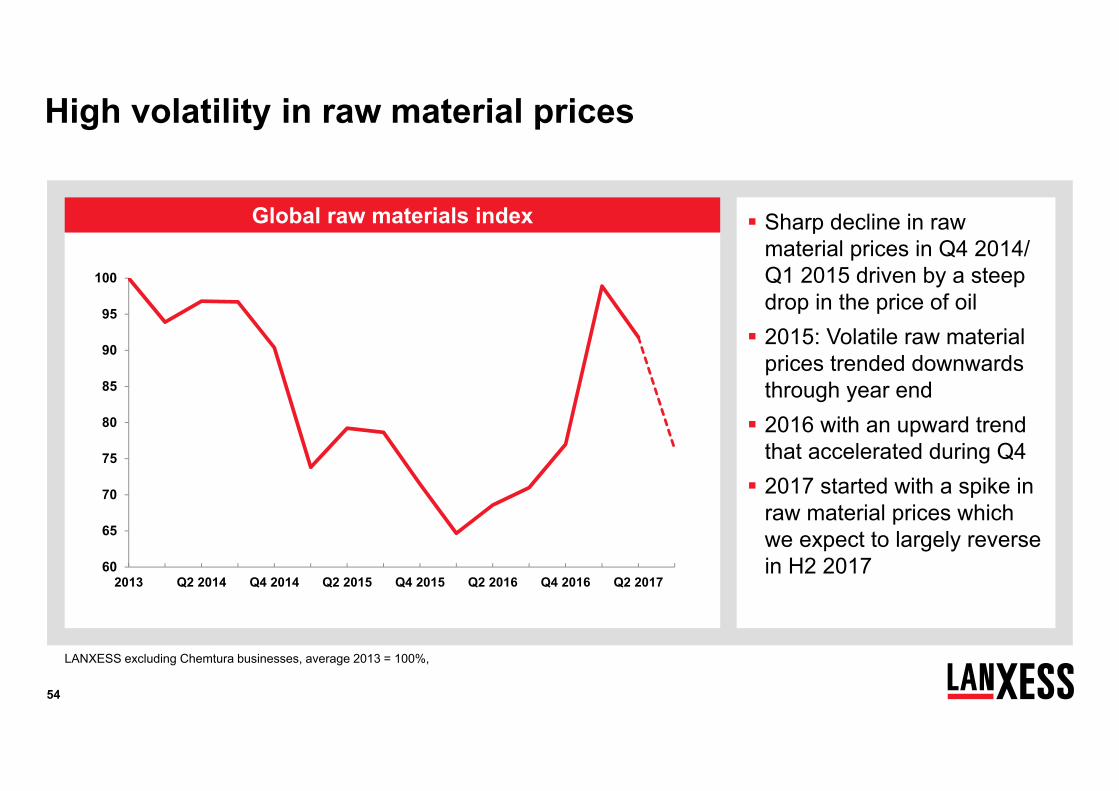
Global raw materials index
High volatility in raw material prices
Sharp decline in raw material prices in Q4 2014/ Q1 2015 driven by a steep drop in the price of oil 2015: Volatile raw material
prices trended downwards through year end 2016 with an upward trend
that accelerated during Q4 2017 started with a spike in
raw material prices which we expect to largely reverse in H2 2017
LANXESS excluding Chemtura businesses, average 2013 = 100%,
60
65
70
75
80
85
90
95
100
2013 Q2 2014 Q4 2014 Q2 2015 Q4 2015 Q2 2016 Q4 2016 Q2 2017
55
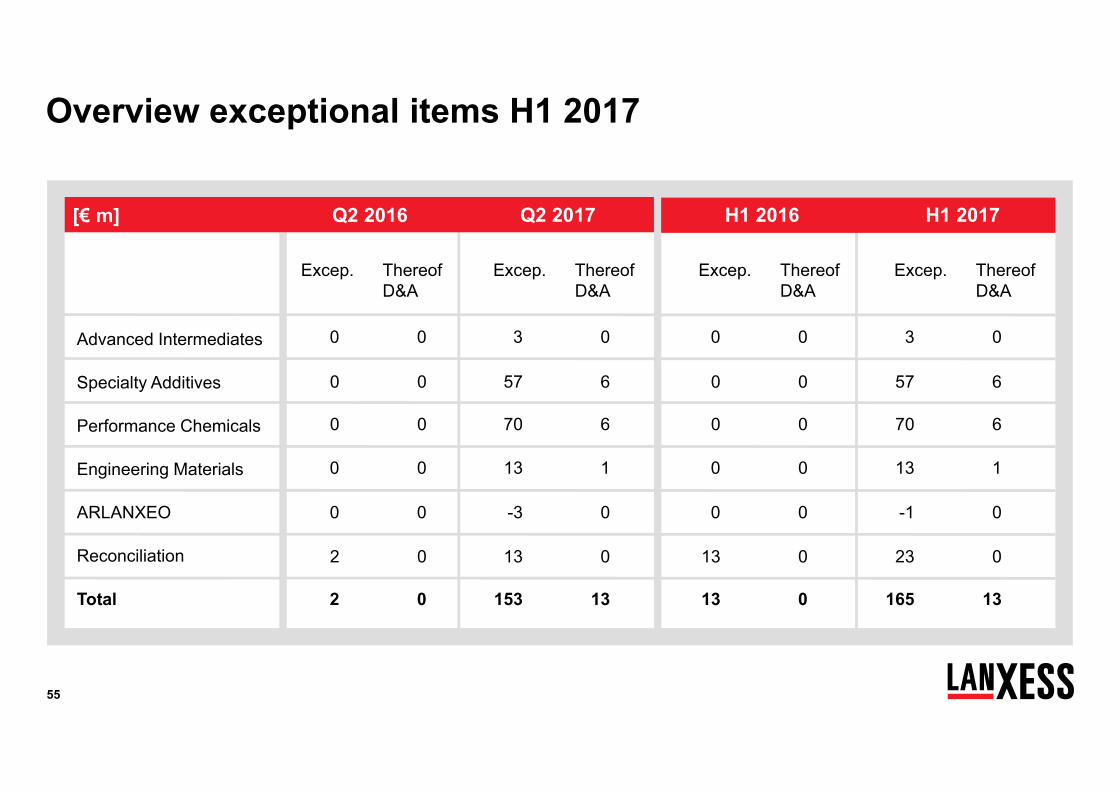
Overview exceptional items H1 2017
Excep.
Advanced Intermediates
Performance Chemicals
Reconciliation
Total
Thereof D&A
Q2 2016 Q2 2017[€ m] FY 2015 FY 2016
Excep. Thereof D&A
Excep. Thereof D&A
Excep. Thereof D&A
0 0
0 0
0 0
2 0
Engineering Materials
2 0
3 0
70 6
-3 0
153 13
13 0
0 0
0 0
0 0
13 0
13 0
3 0
70 6
-1 0
165 13
23 0
ARLANXEO
0 0 13 1 0 0 13 1
H1 2017H1 2016
Specialty Additives 0 0 57 6 0 0 57 6
56
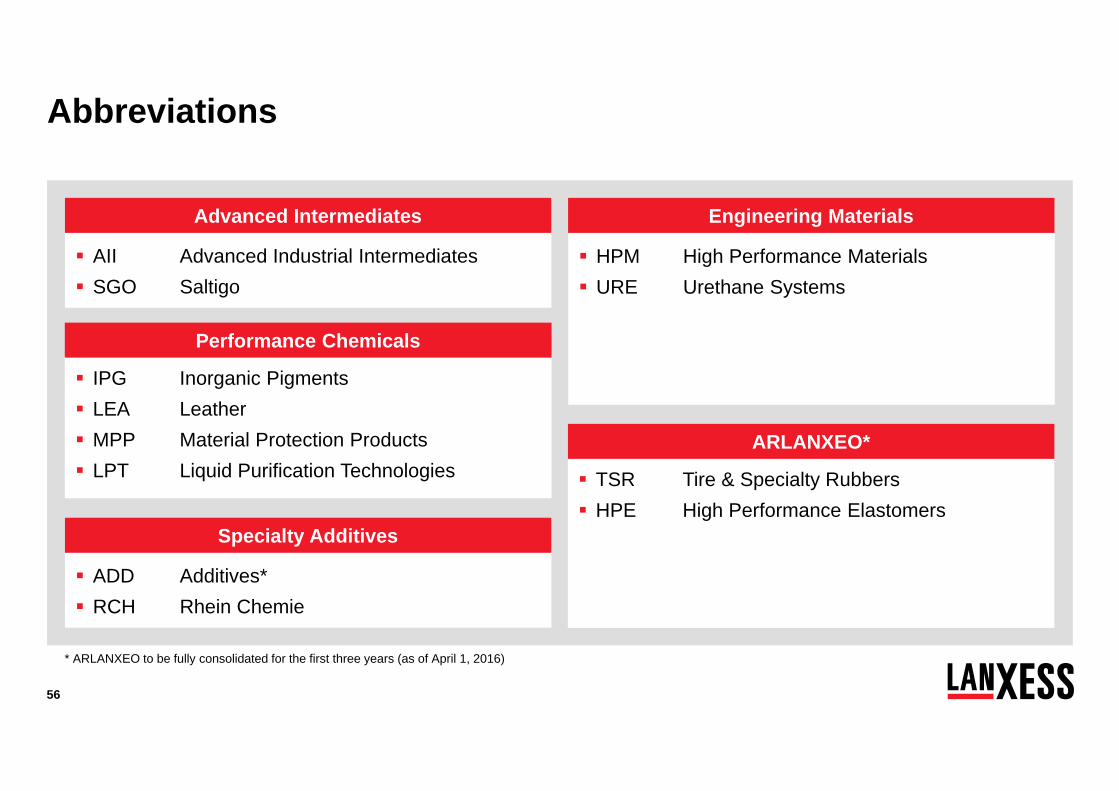
AII Advanced Industrial Intermediates SGO Saltigo
IPG Inorganic Pigments LEA Leather MPP Material Protection Products LPT Liquid Purification Technologies
Abbreviations
HPM High Performance Materials URE Urethane Systems
Engineering Materials
Performance Chemicals
Advanced Intermediates
TSR Tire & Specialty Rubbers HPE High Performance Elastomers
ARLANXEO*
ADD Additives* RCH Rhein Chemie
Specialty Additives
* ARLANXEO to be fully consolidated for the first three years (as of April 1, 2016)
57
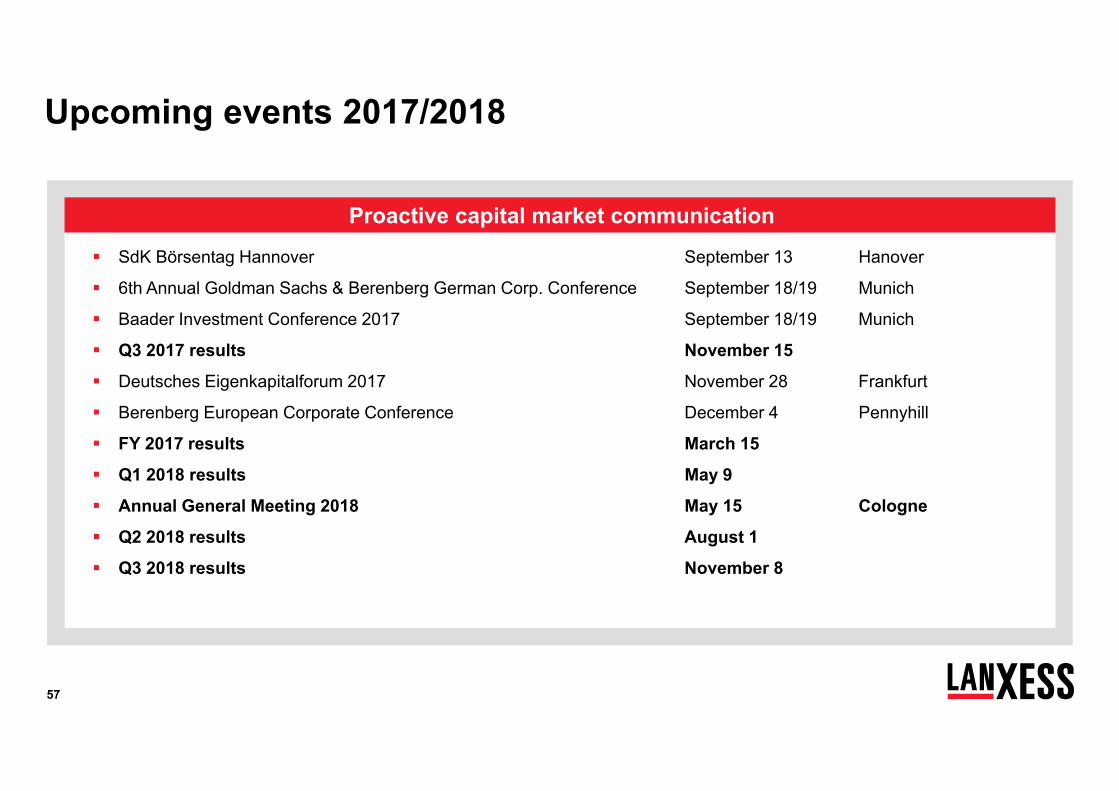
SdK Börsentag Hannover September 13 Hanover
6th Annual Goldman Sachs & Berenberg German Corp. Conference September 18/19 Munich
Baader Investment Conference 2017 September 18/19 Munich
Q3 2017 results November 15
Deutsches Eigenkapitalforum 2017 November 28 Frankfurt
Berenberg European Corporate Conference December 4 Pennyhill
FY 2017 results March 15
Q1 2018 results May 9
Annual General Meeting 2018 May 15 Cologne
Q2 2018 results August 1
Q3 2018 results November 8
Proactive capital market communication
Upcoming events 2017/2018
58
Contact details Investor Relations
Oliver Stratmann
Head of Treasury & Investor Relations
Tel. : +49-221 8885 9611Fax. : +49-221 8885 5400Mobile : +49-175 30 49611Email : [email protected]
Annika Klaus
Assistant to Oliver Stratmann
Tel. : +49-221 8885 9834Fax. : +49-221 8885 4944Mobile : +49-151 74613059Email : [email protected]
Katharina ForsterInstitutional Investors / Analysts / AGM
Tel. : +49-221 8885 1035Mobile : +49-151 7461 2789Email : [email protected]
Ulrike RockelHead of Investor Relations
Tel. : +49-221 8885 5458Mobile : +49-175 30 50458Email : [email protected]
LANXESS IR website
Jens UsslerInstitutional Investors / Analysts
Tel. : +49-221 8885 7344Mobile : +49-151 7461 2913Email : [email protected]
Thorsten ZimmermannInstitutional Investors / Analysts
Tel. : +49-221 8885 5249Mobile : +49-151 7461 2969Email : [email protected]