q2 2016 results - amazon web...
TRANSCRIPT
Stefan Borgas | President & CEO
August 10, 2016
Q2 2016 Results

2
Important Legal Notes
Disclaimer and Safe Harbor for Forward-Looking Statements The information contained herein in this presentation or delivered or to be delivered to you during our presentation does not constitute an offer, expressed or implied, or a recommendation to do any transaction in Israel Chemicals Ltd. (“ICL” or “Company”) securities or in any securities of its affiliates or subsidiaries. This presentation and/or other oral or written statements made by ICL during its presentation or from time to time, may contain forward-looking statements within the meaning of the United States Private Securities Litigation Reform Act of 1995 and other applicable securities laws. Whenever words such as "believe," "expect," "anticipate," "intend," "plan," "estimate", “predict” or similar expressions are used, the Company is making forward-looking statements. Such forward-looking statements may include, but are not limited to, those that discuss strategies, goals, financial outlooks, corporate initiatives, existing or new products, existing or new markets, operating efficiencies, or other non-historical matters. Because such statements deal with future events and are based on ICL’s current expectations, they could be impacted or be subject to various risks and uncertainties, including those discussed in the "Risk Factors" section and elsewhere in our Annual Report on Form 20-F for the year ended December 31, 2015, and in subsequent filings with the Tel Aviv Securities Exchange (TASE) and/or the U.S. Securities and Exchange Commission (SEC). Therefore actual results, performance or achievements of the Company could differ materially from those described in or implied by such forward-looking statements. Although the Company believes that the expectations reflected in such forward-looking statements are based on reasonable assumptions, it can provide no assurance that expectations will be achieved. Except as otherwise required by law, ICL disclaims any intention or obligation to update or revise any forward-looking statements, which speak only as of the date hereof, whether as a result of new information, future events or circumstances or otherwise. Readers, listeners and viewers are cautioned to consider these risks and uncertainties and to not place undue reliance on such information. Certain market and/or industry data used in this presentation were obtained from internal estimates and studies, where appropriate, as well as from market research and publicly available information. Such information may include data obtained from sources believed to be reliable, however ICL disclaims the accuracy and completeness of such information which is not guaranteed. Internal estimates and studies, which we believe to be reliable, have not been independently verified. We cannot assure that such data is accurate or complete. Included in this presentation are certain non-GAAP financial measures, such as Adjusted Operating income and Adjusted Net income, designed to complement the financial information presented in accordance with U.S. GAAP because management believes such measures are useful to investors. These non-GAAP financial measures should be considered only as supplemental to, and not superior to, financial measures provided in accordance with GAAP. Please refer to our quarterly Report on Form 6-F for the quarter ended June 30, 2016 filed with TASE and the SEC for a reconciliation of the non-GAAP financial measures included in this presentation to the most directly comparable financial measures prepared in accordance with GAAP.
3
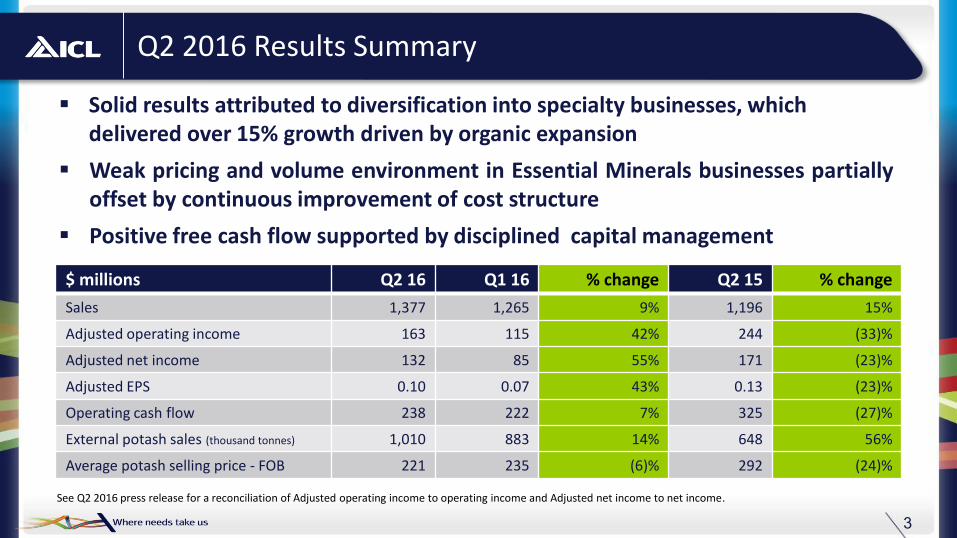
Q2 2016 Results Summary
$ millions Q2 16 Q1 16 % change Q2 15 % change
Sales 1,377 1,265 9% 1,196 15%
Adjusted operating income 163 115 42% 244 (33)%
Adjusted net income 132 85 55% 171 (23)%
Adjusted EPS 0.10 0.07 43% 0.13 (23)%
Operating cash flow 238 222 7% 325 (27)%
External potash sales (thousand tonnes) 1,010 883 14% 648 56%
Average potash selling price - FOB 221 235 (6)% 292 (24)%
Solid results attributed to diversification into specialty businesses, which delivered over 15% growth driven by organic expansion
Weak pricing and volume environment in Essential Minerals businesses partially offset by continuous improvement of cost structure
Positive free cash flow supported by disciplined capital management
See Q2 2016 press release for a reconciliation of Adjusted operating income to operating income and Adjusted net income to net income.

Business Environment & Major Developments
Competitive market environment continued to negatively impact potash and phosphate results
Second half potash business is expected to experience higher volumes and lower average prices
Second half 2016 phosphate results expected to improve, supported by volume growth and the contribution of the efficiency plan in our Chinese JV (YPH)
Strong performance of ICL Industrial Products supported by higher volumes, lower raw material costs, efficiency gains and new products contributions
Growth in specialty minerals, fire safety and oil additives business lines (P2S5) contributed to improved results of ICL Advanced Additives
ICL Food Specialties benefited from dairy protein sales growth, geographical expansion and new products, which compensated for intensive competition in North America
ICL Specialty Fertilizers demonstrated stability despite commodity headwinds, owing to higher volumes sold and expanding Chinese footprint
Essential Minerals $ million Q2 2016 Q2 2015
Sales* 597 480
Adj. O/I** 90 176
Specialty Solutions $ million Q2 2016 Q2 2015
Sales* 842 718
Adj. O/I** 162 137
4
* Including inter-business units sales
** Excluding G&A and unallocated expenses

5
Increasing Contribution of Specialty Solutions
36% 64%
Essential Minerals Specialty Solutions
56% 44%
Essential Minerals Specialty Solutions
Q2 2015 Q2 2016
See Q2 2016 reports for a reconciliation of Adjusted operating income to operating income.
Excluding G&A and unallocated expenses
Adjusted operating income

6
Divisional Evolution of Sales and Adjusted Operating Income
Sales Operating Income
See Q2 2016 press release for a reconciliation of Adjusted operating income to operating income and Adjusted net income to net income.
Excluding G&A and unallocated expenses
0
100
200
300
400
500
600
700
800
900
Q1 2015 Q2 2015 Q3 2015 Q4 2015 Q1 2016 Q2 2016
Essential Minerals Specialty Solutions
0
50
100
150
200
250
Q1 2015 Q2 2015 Q3 2015 Q4 2015 Q1 2016 Q2 2016
Essential Minerals Specialty Solutions

754 680
1,025 871
881 945
526 613
2014A 2015A 2020E
Food specialties
Advanced Additives
Industrial Products
Specialty Fertilizers
341 318
2014A 2015A 2020E
Specialty Solutions Business Units’ Targeted Top and Bottom Line Growth
7
Sales ($M)
Food Specialties 7-9%
Advanced Additives 3-5%
Industrial Products 4-7%
Specialty Fertilizers (Incl. NOP) 10-15%
CAGR 2015-2020 Sales
Adjusted Operating Income ($M)
CAGR 2015-2020
~9-13%
Excluding G&A and unallocated expenses, including inter-BU sales
CAGR 2015-2020
~5-10%

Financial Results
Kobi Altman CFO

9
Resilience Despite Weak Commodity Markets
Q2 2016 Sales Q2 2016 Adjusted operating income
Numbers may not add up due to rounding and set offs
$ millions Q2 16 Q1 16 % change Q2 15 % change
Sales 1,377 1,265 9% 1,196 15%
Adjusted operating income 163 115 42% 244 (33)%
Net income 120 66 82% 75 60%
Adjusted net income 132 85 55% 171 (23)%
Cash flow from operations 238 222 7% 325 (27)%
Capital Expenditures 154 187 (18)% 251 (39)%
Free cash flow 85 38 124% 170 (50)%
See Q2 2016 financial reports for a reconciliation of Adjusted operating income to operating income and Adjusted net income to net income.
* Strike impact Q1 2015
95 163 149*
48 33
119 15 8 20
1,196 1,377
253 130 3 40 46 119

10
Essential Minerals Bridge Analysis
Sales ($M) Adjusted Operating income ($M)
See Q2 2016 financial reports for a reconciliation of Adjusted operating income to operating income and Adjusted net income to net income.
Numbers may not add due to rounding and set offs
* Strike impact Q2 2015
Excluding G&A and unallocated expenses
480 597
194
126 1
115
91
68 90
108*
38
28
115
22 15

11
Specialty Solutions Bridge Analysis
Sales ($M) Adjusted Operating income ($M)
See Q2 2016 financial reports for a reconciliation of Adjusted operating income to operating income and Adjusted net income to net income. Numbers may not add due to rounding and set offs
* Strike impact Q2 2015
Excluding G&A and unallocated expenses
96
162
41*
17 14
5 11
718 842
65 46 15 7 2 11

Thank You

Appendix

Essential Minerals Division

15
ICL Dead Sea
~3,500 Employees Worldwide
ICL UK
Potash & Magnesium Business Unit
~70%
Potash & Magnesium 2015 Sales of total ICL sales*
* Not including inter-segment sales
~30%
ICL Magnesium
ICL Ethiopia**
** Project under evaluation
ICL Iberia

16
ICL Rotem
ICL Turkey
~3,500 Employees Worldwide
ICL Germany
ICL The Netherlands
Phosphates Business Unit – the Source of Our Integrated Value Chain
85%
Phosphate 2015 Sales of total ICL sales*
*Not including inter-segment sales
YPH JV
15%
Cajati, Brazil

Specialty Solutions Division

18
ICL Haifa
Fuentes
Nutrisi Everris
ICL Specialty Fertilizers Business Unit
45% 33%
Americas* - 18% Asia* - 9%
MEA* - 24%
*Of 2015 sales **including inter-business unit sales
YPH JV
Manufacturing site
Pending
Office
Specialty Fertilizers 2015 Sales of total ICL sales*
~$700M
~1,000 Employees Worldwide
60% 19%
9%
8% 4%
Revenue by product (2015)
Specialty Agriculture
OrnamentalHorticulture Turf and Amenity
Chemicals
Europe* - 49%
19
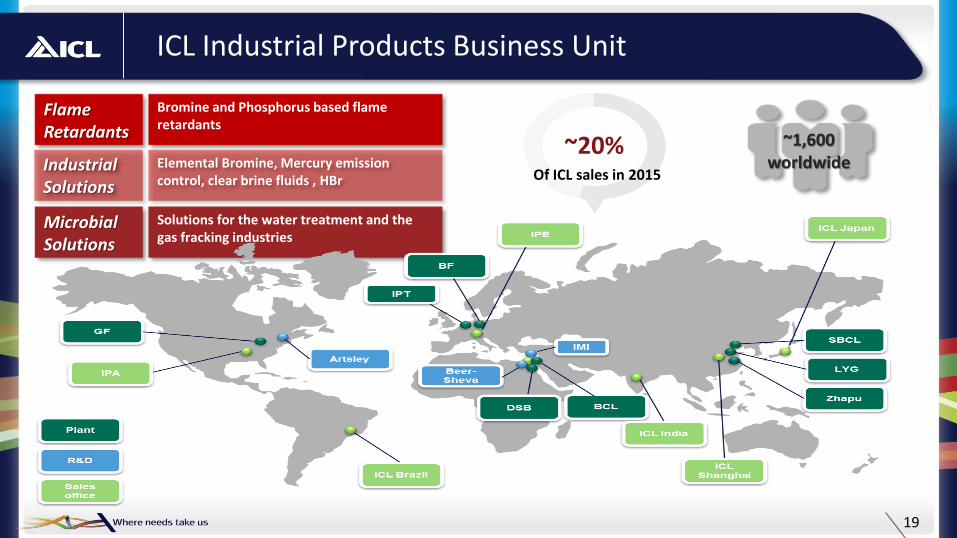
ICL Industrial Products Business Unit
~1,600 worldwide
Of ICL sales in 2015
~20%
Bromine and Phosphorus based flame retardants
Elemental Bromine, Mercury emission control, clear brine fluids , HBr
Solutions for the water treatment and the gas fracking industries
Flame Retardants
Microbial Solutions
Industrial Solutions
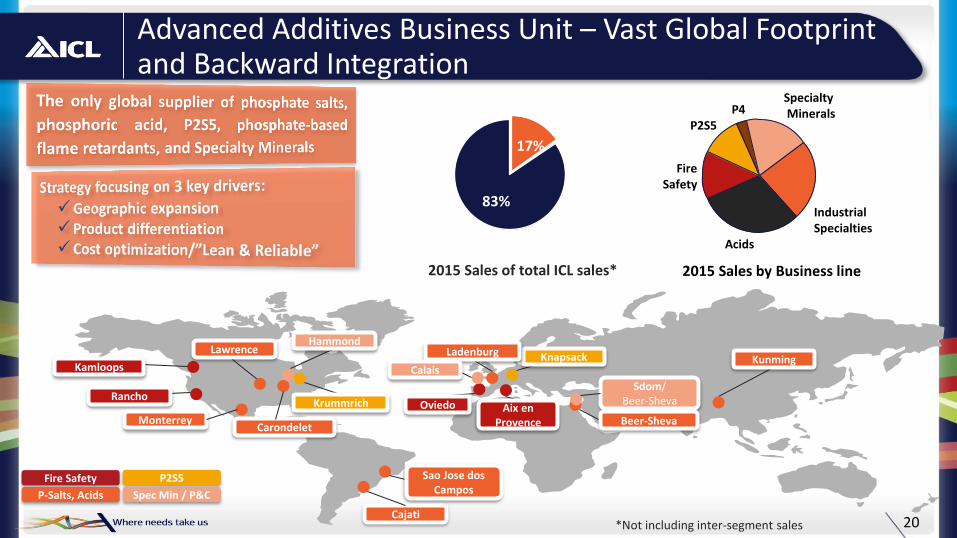
Advanced Additives Business Unit – Vast Global Footprint and Backward Integration
20
Fire Safety
P-Salts, Acids
P2S5
Spec Min / P&C
Fire Safety
Acids
Industrial Specialties
Specialty Minerals P4
P2S5
2015 Sales by Business line 2015 Sales of total ICL sales*
83%
17%
*Not including inter-segment sales
Kamloops
Rancho Krummrich
Sao Jose dos Campos
Kunming Knapsack Lawrence
Carondelet
Aix en Provence
Oviedo
Sdom/ Beer-Sheva
Monterrey Beer-Sheva
Ladenburg
Calais
Hammond
Cajati
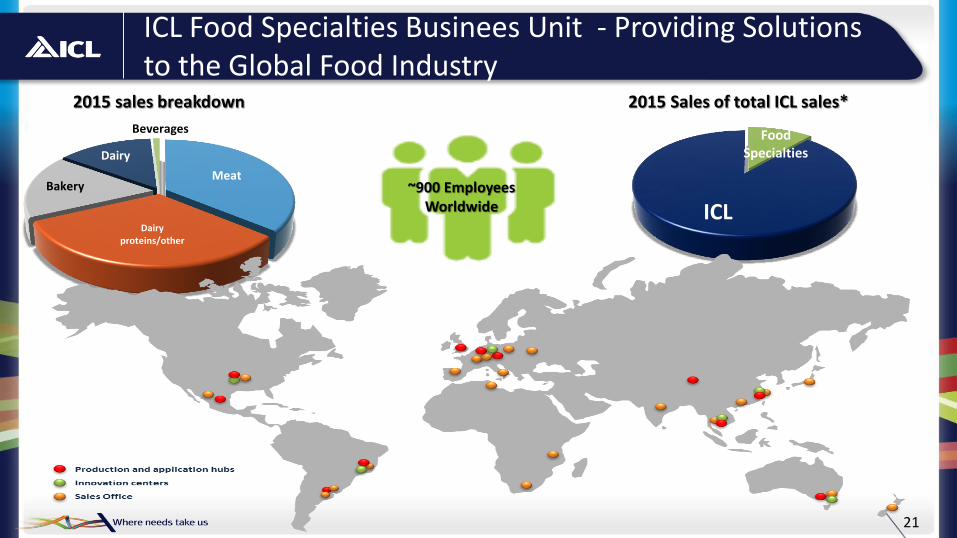
Meat
Dairy proteins/other
Bakery
Dairy
Beverages Food Specialties
ICL
21
ICL Food Specialties Businees Unit - Providing Solutions to the Global Food Industry
2015 sales breakdown
~900 Employees Worldwide
2015 Sales of total ICL sales*

22
Essential Minerals: Business Units Performance
Potash Phosphates
See Q2 2016 press release for a reconciliation of Adjusted operating income to operating income and Adjusted net income to net income.
Excluding G&A expenses and unallocated expenses
200
220
240
260
280
300
320
340
Q1 2015 Q2 2015 Q3 2015 Q4 2015 Q1 2016 Q2 2016
Sales
0
100
200
300
400
500
0
50
100
150
200
250
300
350
400
450
500
Q1 2015 Q2 2015 Q3 2015 Q4 2015 Q1 2016 Q2 2016
Sales Adjusted Operatind Income

23
Specialty Solutions: Business Units’ Sales Performance
Industrial Products Specialty Fertilizers
Including inter-business unit sales
100
150
200
250
300
Q1 2015 Q2 2015 Q3 2015 Q4 2015 Q1 2016 Q2 2016
100
120
140
160
180
200
Q1 2015 Q2 2015 Q3 2015 Q4 2015 Q1 2016 Q2 2016
100
150
200
250
300
Q1 2015 Q2 2015 Q3 2015 Q4 2015 Q1 2016 Q2 2016
100
120
140
160
180
Q1 2015 Q2 2015 Q3 2015 Q4 2015 Q1 2016 Q2 2016
Advanced Additives Food Specialties

24
Essential Minerals’ Business Unit Sales
Potash & Magnesium ($M) Phosphates ($M)
Numbers may not add due to rounding and set offs
254 299
194
83
65 1
See Q2 2016 financial reports for a reconciliation of Adjusted operating income to operating income and Adjusted net income to net income.
249 319
126
2 32 26

25
Potash Business Stand-Alone Bridge Analysis
Sales ($M) Adjusted Operating income ($M)
See Q2 2016 financial reports for a reconciliation of Adjusted operating income to operating income and Adjusted net income to net income.
Numbers may not add due to rounding and set offs
* Strike impact Q2 2015
238 285
179
79
51 2
Excluding G&A and unallocated expenses
44 65
100*
9 2 7
79
26
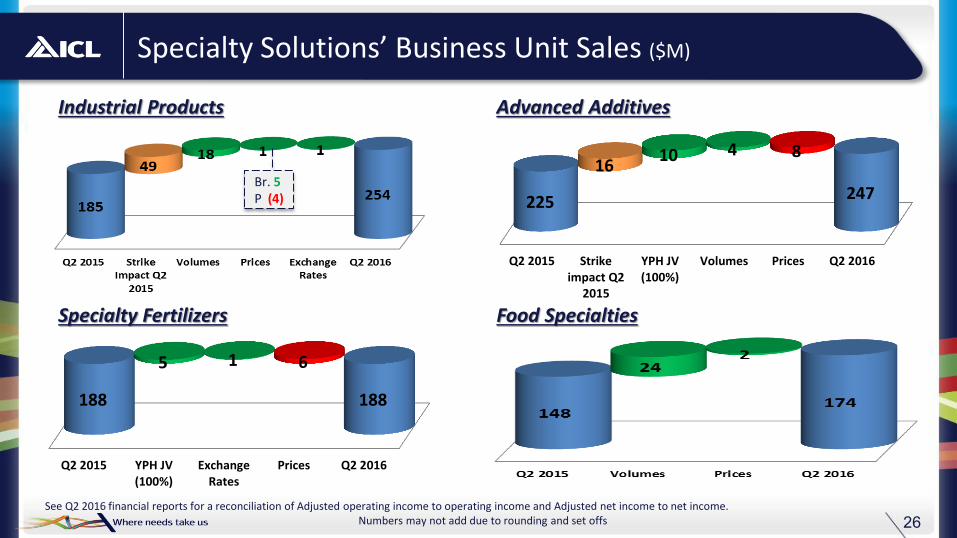
Specialty Solutions’ Business Unit Sales ($M)
Numbers may not add due to rounding and set offs See Q2 2016 financial reports for a reconciliation of Adjusted operating income to operating income and Adjusted net income to net income.
Industrial Products Advanced Additives
Specialty Fertilizers Food Specialties
Br. 5 P (4)
Q2 2015 Strikeimpact Q2
2015
YPH JV(100%)
Volumes Prices Q2 2016
225 247
16 10 4 8
Q2 2015 YPH JV(100%)
ExchangeRates
Prices Q2 2016
188 188
5 1 6