q2 2015 financial results - rns submit to the current status of the company and its business, ......
TRANSCRIPT

Q2 2015 Financial Results

DISCLAIMER
This presentation includes statements data, forecasts, goals and Company plans that are "forward-looking statements“, as defined in the Securities Law - 1968, whose occurrence is not certain and which are not solely in the Company's control. These forward-looking statements are included, inter alia, in discussions of strategy, objectives, goals, plans, events, future intentions or other information relating to future events or issues whose occurrence is not certain.
By their nature, forward-looking statements involve risk and uncertainty. Whether the forward looking information occurs or not is affected, inter alia, by risk factors characteristic to the Company's operations and developments in the general environment and external factors which impact the Frutarom Group and its area of activities.
This forward looking information could include facts and data based on the Company's subjective assessment, including with regards to the current status of the Company and its business, the current situation in the industry in which the Frutarom Group operates, macro-financial facts and information, all as are known to the Company on the date on which this presentation was prepared, some of which were given to the Company by external sources, the content of which was not independently examined by the Company, and therefore the Company is not responsible for their verity.
This presentation must be read together with the Company's periodic and immediate reports, and was not meant to replace the need for study of reports the Company has published, including, inter alia, the Company's periodic report for 2013, published on March 2014, and the Company's periodic reports subsequently published. These reports could include, inter alia, updates to the information regarding the Company's activities or of the forward looking statements appearing in this presentation.
Subject to the requirements of applicable law, the Company does not intend to update any industry information or forward-looking statements appearing in this presentation, and is not required to publish any additional presentations for its shareholders in future.
It is to be emphasized that the financial estimations and the pro-forma figures included in this presentation are based on figures which were not audited or reviewed by an auditor and therefore the actual results may differ from these financial estimations.
2

Frutarom - A Leading Fast Growing Global Flavor and Fine Ingredient House
Global company Broad product
portfolio Public company
Financial success since 2000
•Sales in over 150 countries •19,000 customers • A Top 10 flavor
house
•43,000 products •Over 4,000 raw
materials • Innovative
pipeline
•Listed on London & TLV Stock Exchanges •From $13M to
approx. $2.2 market cap
•10.1x growth in sales (CAGR 18%) •16.8x growth in
EBITDA •21.9x growth in net
profit
3

Frutarom - A Profitable Growth Story
4

Frutarom - A Global Company • 2000-2014 Sales CAGR of 18%
Sales office Acquisition
2006 2007 2009 2012 1990-2000 2003-2004 2011 2001-2002 2013 2005
1996 Tel Aviv stock exchange
IFF FS
Adumim
Raychan
Rieber
EAFI
Savoury Flavours
Oxford
Belmay
Jupiter
FSI Corona
Nesse
CH Hansen DE
CH Hansen IT
Etol
Mylner
Aromco
FSI OH
Acatris
Flachsmann Tohar
Meer
Rayner HK F&F
CPL Aroma
Flavour Key
Baltimore
Botanicare Kunshan
AM Todd
Russia
Canada
Turkey
France
Mexico
Ukraine
Poland
Kazakhstan
Hong Kong
Costa Rica
Czech Rep.
S. Africa
India
Brazil
Gewurzmuller
Abaco
Rad
London stock
exchange
JannDeRee
PTI
Aroma
Hagelin
2014
Citrasource
Montana
2015
Ingrenat
Food Blenders
5
Sonarome
BSA
Taiga
Vitiva
Foote&Jenks
Taura
Scandia

Sales & Marketing – 74 Offices
Production – 44 Sites
R&D – 44 Labs
Frutarom - A Global Company We provide our customers with global and local support
Belgium
Brazil
China
Denmark
France
Germany
India
Indonesia
Israel
Italy
Kazakhstan
Mexico
Netherlands
Norway
Poland
Serbia
Singapore
Slovakia
Slovenia
South Africa
Turkey
Ukraine
UK South
UK North
Corona, CA New Jersey
Cincinnati, OH Switzerland
Moscow Saint Petersburg
Perm Saratov
Hong Kong
Costa Rica
Georgia
Guatemala
Novosibirsk Belarus
Moldova
Florida
Peru
Chile
6
Australia
New Zealand
Canada
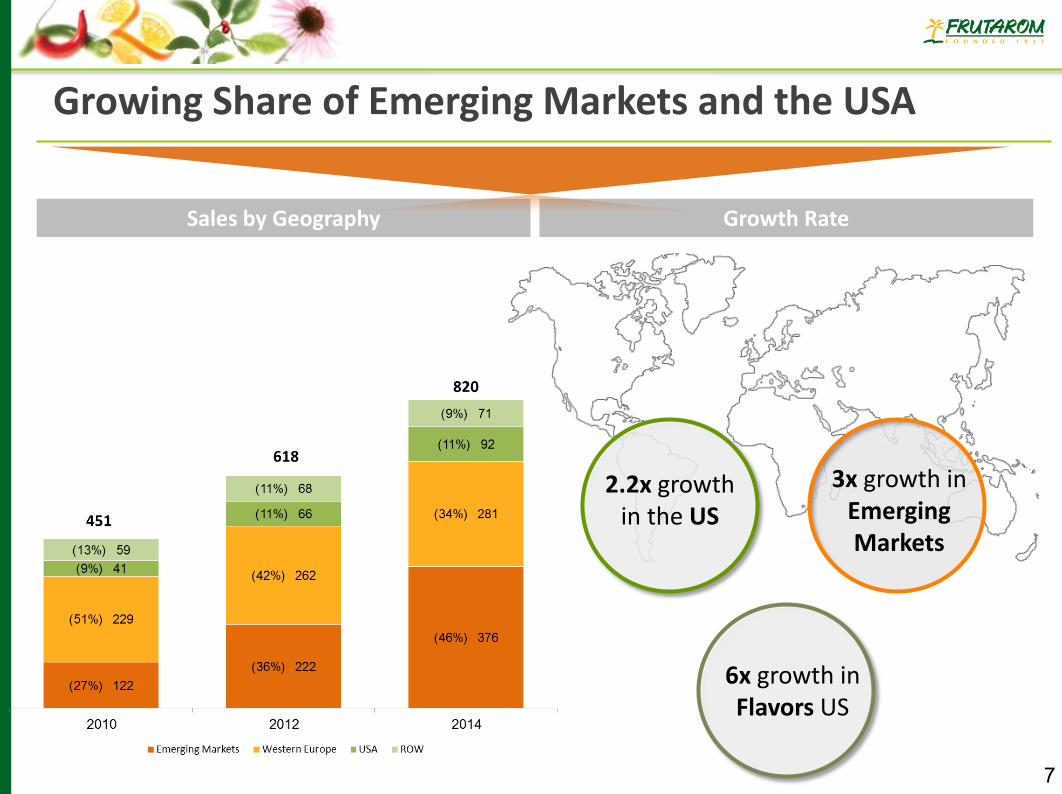
Growth Rate
Growing Share of Emerging Markets and the USA
Sales by Geography
3x growth in Emerging Markets
2.2x growth in the US
6x growth in Flavors US
7
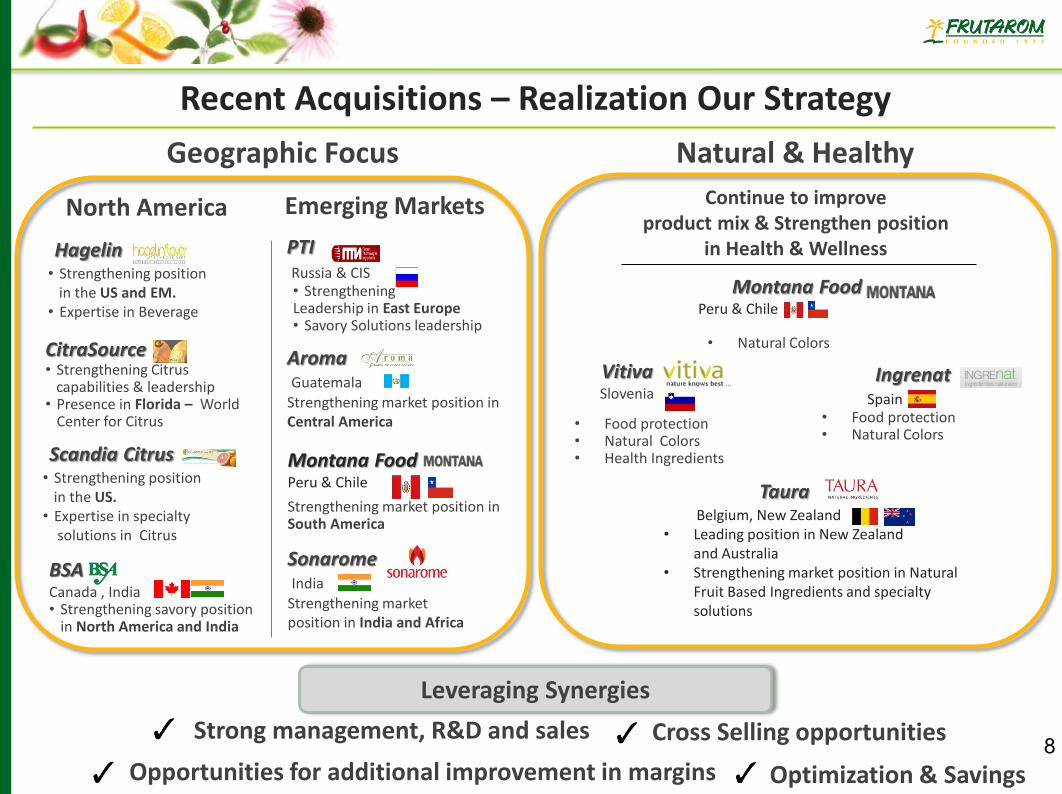
Hagelin • Strengthening position in the US and EM. • Expertise in Beverage
CitraSource • Strengthening Citrus capabilities & leadership • Presence in Florida – World
Center for Citrus
Recent Acquisitions – Realization Our Strategy
Continue to improve product mix & Strengthen position
in Health & Wellness
Geographic Focus Natural & Healthy
Emerging Markets
PTI Russia & CIS
• Strengthening Leadership in East Europe • Savory Solutions leadership
Aroma Guatemala
Strengthening market position in Central America
Vitiva Slovenia
• Food protection • Natural Colors • Health Ingredients
Montana Food Peru & Chile
Montana Food Peru & Chile
Strengthening market position in South America
• Natural Colors
Ingrenat Spain
• Food protection • Natural Colors
Opportunities for additional improvement in margins 8
North America
BSA Canada , India • Strengthening savory position
in North America and India
Sonarome India Strengthening market position in India and Africa
Leveraging Synergies
Strong management, R&D and sales
Taura Belgium, New Zealand • Leading position in New Zealand
and Australia • Strengthening market position in Natural
Fruit Based Ingredients and specialty solutions
Scandia Citrus • Strengthening position in the US. • Expertise in specialty solutions in Citrus
Cross Selling opportunities
Optimization & Savings
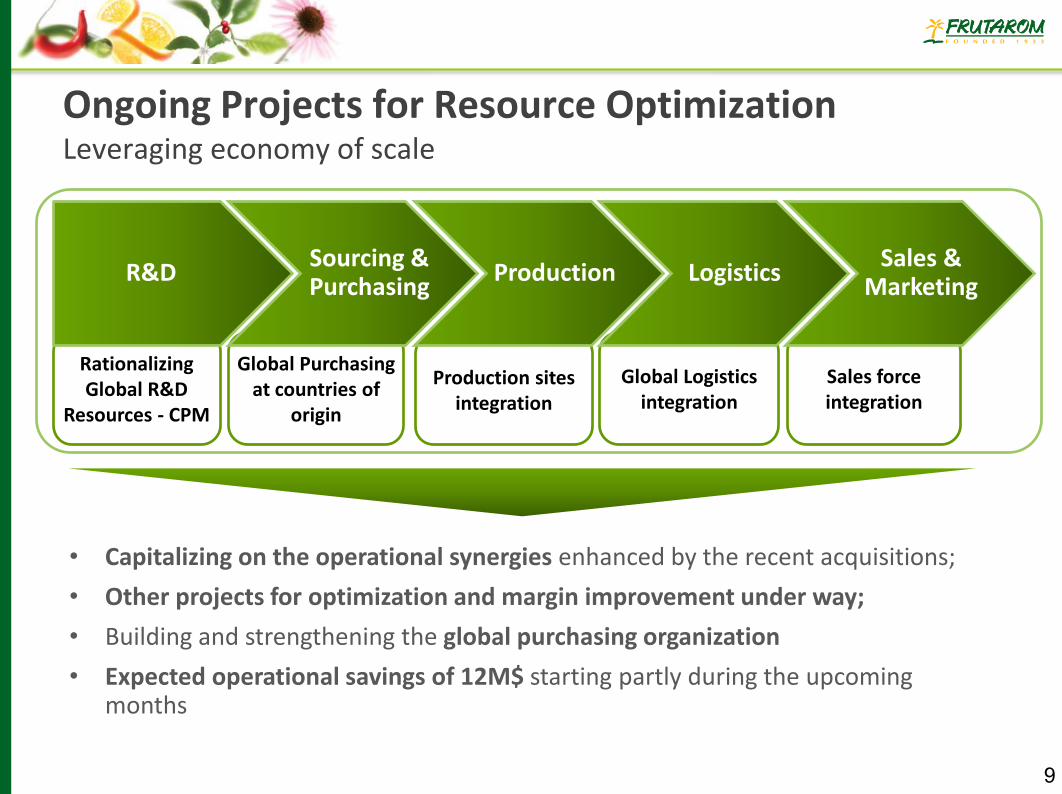
Ongoing Projects for Resource Optimization Leveraging economy of scale
Rationalizing Global R&D
Resources - CPM
Global Purchasing at countries of
origin
Production sites integration
Global Logistics integration
Sales force integration
Production Sourcing & Purchasing
Logistics Sales &
Marketing R&D
• Capitalizing on the operational synergies enhanced by the recent acquisitions;
• Other projects for optimization and margin improvement under way;
• Building and strengthening the global purchasing organization
• Expected operational savings of 12M$ starting partly during the upcoming months
9

10
H1 Business Update -
1 Pro-forma growth - Assuming acquisitions performed in 2015 had been consolidated in the appropriate parallel period of 2014 and that Montana Food,
acquired during the fourth quarter of 2014, had been consolidated as of January 1, 2014.
• Continuous growth in above industry average rate
• H1 YoY LFL growth1 of 6.1%; Q2 YoY LFL growth1 of 4.8%
• Improving value proposition to costumers through expansion of products portfolio and leverage of Cross-Selling
• Nine acquisitions in 2015 with yearly sales of 125M$; Five acquisitions during Q2 2015 with yearly sales of 97M$
• Geographic focus on high growth spots - Continues strengthening position in North-America and India; First strategic acquisition in Asia-Pacific; Deepening position in Citrus field and Savory Solutions in North-America
• Strategic acquisitions with product & technology focus - Entering into growing and profitable fields such as natural colors and food protection by natural solutions
• Strong future acquisition pipeline
• After undergoing internal growth averaging 4.4% in 2014 and 5.3% in Q1 2015, Q2 2015 sales were affected by some stockpiling of inventory among a number of customers who temporarily reduced their purchases
• H1 YoY LFL growth of 0.2%; Q2 YoY LFL sales declined 4.9%
• Customers have recently resumed placing orders and their rate of purchases is expected to grow in the upcoming months
• Continue working towards optimizing resources to create operational savings and strengthening competitive position • Strengthening global purchasing system while utilizing the increased purchasing power with emphasis on turning to source
countries for the purchase of raw materials • Expected operational savings of 12M$ starting partly during the upcoming months • Non-recurring expenses of 2.2M$ related to operational efficiency and in connection with acquisitions
M&A
FLAVORS
FINE INGREDIENTS
OPTIMIZATION &
SAVINGS

11
H1 Business Update -
• Strengthening position in India through Sonarome and BSA acquisitions • Deepening penetration to the Asia Pacific region through Taura acquisition
• Entering Canadian Market with the acquisition of BSA • Construction has been completed on new state-of-the-art plant in China which features sophisticated laboratories for
R&D and applications
• H1/2015 - Equity/Assets ~ 46%; Net Financial Debt/Assets ~ 26% • Solid balance sheet supports future M&A activity in line with growth strategy • Acquired companies mainly during mid-end Q2/2015 already consolidated in balance sheet ; Will start to contribute
to sales and profitability starting Q3/2015
• USD considerably strengthening against most other global currencies continued during Q/2 2015 • The effect of currencies on reported USD sales was 14.4% in Q2 2015 and 14.0% in H1 2015 • Exposure to currency fluctuations is reduced by the fact that raw material purchases and operational expenditures in
various countries also paid for in most cases in the respective local currencies • Currency affect on reported USD-based results is expected to reduced at the beginning in Q4 2015 if exchange rates
remain at their current levels
FINANCIAL POSITION
GLOBAL PRESENCE
CURRENCY HEADWIND
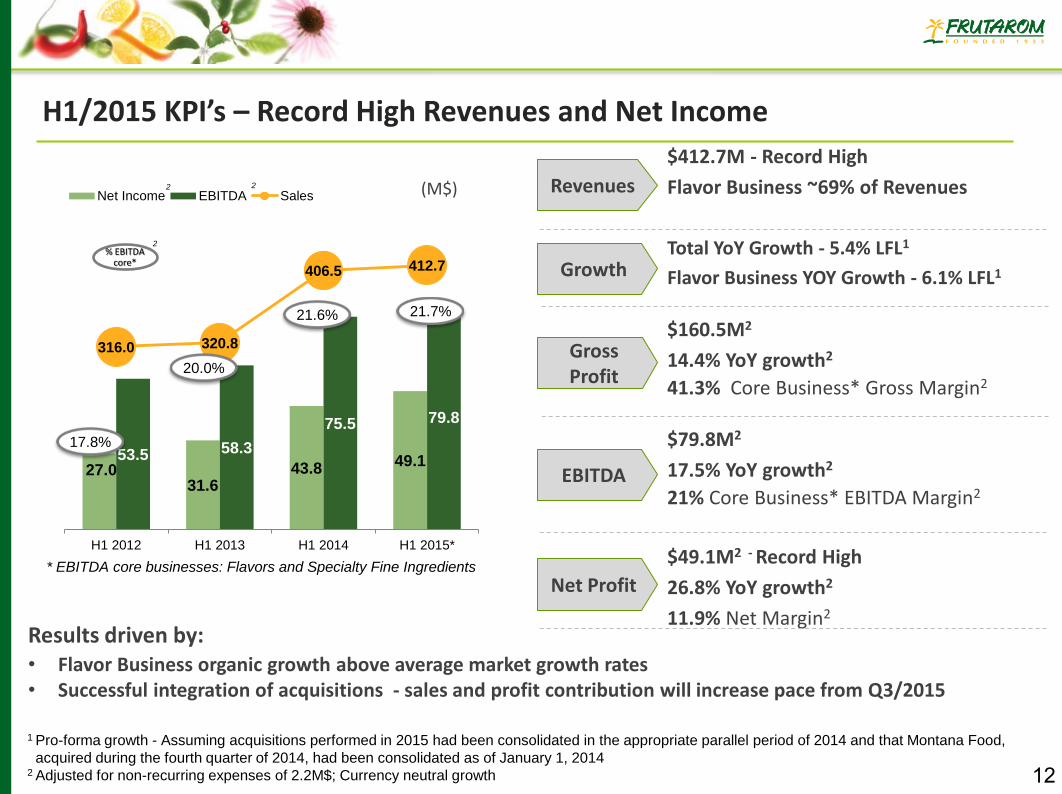
H1/2015 KPI’s – Record High Revenues and Net Income
* EBITDA core businesses: Flavors and Specialty Fine Ingredients
$412.7M - Record High
Flavor Business ~69% of Revenues
Total YoY Growth - 5.4% LFL1
Flavor Business YOY Growth - 6.1% LFL1
$160.5M2
14.4% YoY growth2
41.3% Core Business* Gross Margin2
$79.8M2
17.5% YoY growth2
21% Core Business* EBITDA Margin2
$49.1M2 - Record High
26.8% YoY growth2
11.9% Net Margin2
Gross Profit
EBITDA
Growth
Revenues
Net Profit
1 Pro-forma growth - Assuming acquisitions performed in 2015 had been consolidated in the appropriate parallel period of 2014 and that Montana Food,
acquired during the fourth quarter of 2014, had been consolidated as of January 1, 2014 2 Adjusted for non-recurring expenses of 2.2M$; Currency neutral growth
12
(M$) 2 2
Results driven by: • Flavor Business organic growth above average market growth rates • Successful integration of acquisitions - sales and profit contribution will increase pace from Q3/2015
2
27.0 31.6
43.8 49.1 53.5 58.3
75.5 79.8
316.0 320.8
406.5 412.7
H1 2012 H1 2013 H1 2014 H1 2015*
Net Income EBITDA Sales
% EBITDA core*
17.8%
20.0%
21.6% 21.7%
17.0%
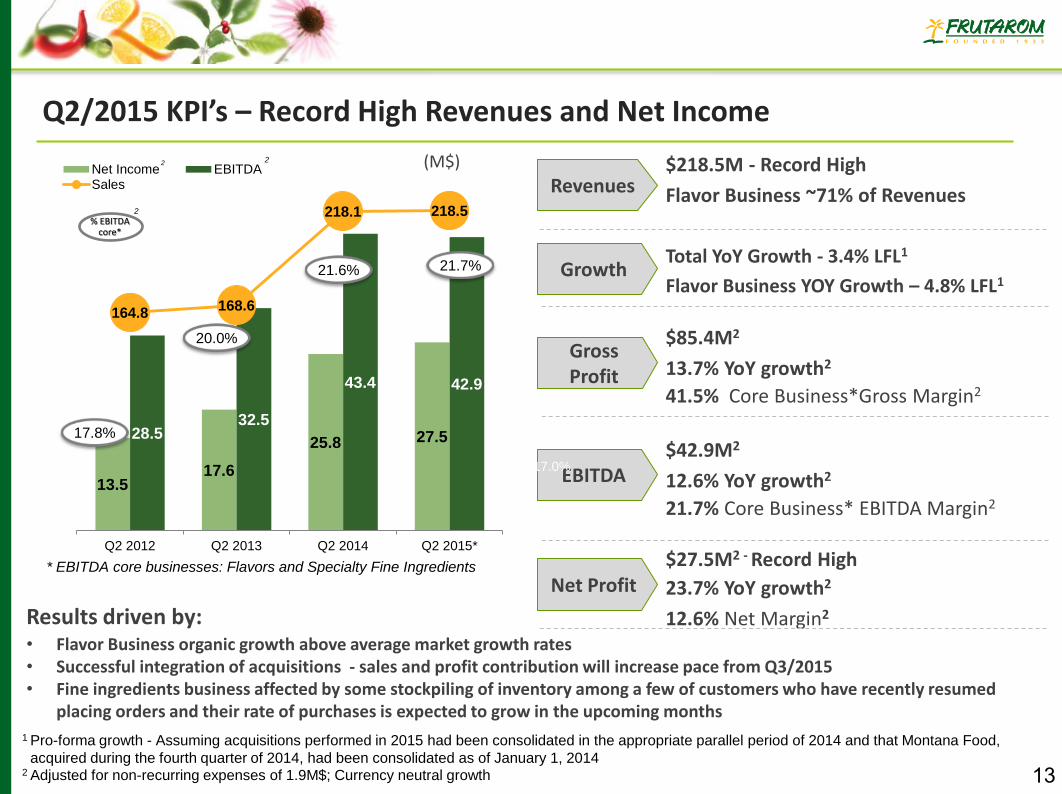
Q2/2015 KPI’s – Record High Revenues and Net Income
* EBITDA core businesses: Flavors and Specialty Fine Ingredients
$218.5M - Record High
Flavor Business ~71% of Revenues
Total YoY Growth - 3.4% LFL1
Flavor Business YOY Growth – 4.8% LFL1
$85.4M2
13.7% YoY growth2
41.5% Core Business*Gross Margin2
$42.9M2
12.6% YoY growth2
21.7% Core Business* EBITDA Margin2
$27.5M2 - Record High
23.7% YoY growth2
12.6% Net Margin2
Gross Profit
EBITDA
Growth
Revenues
Net Profit
1 Pro-forma growth - Assuming acquisitions performed in 2015 had been consolidated in the appropriate parallel period of 2014 and that Montana Food,
acquired during the fourth quarter of 2014, had been consolidated as of January 1, 2014 2 Adjusted for non-recurring expenses of 1.9M$; Currency neutral growth
Results driven by: • Flavor Business organic growth above average market growth rates • Successful integration of acquisitions - sales and profit contribution will increase pace from Q3/2015 • Fine ingredients business affected by some stockpiling of inventory among a few of customers who have recently resumed
placing orders and their rate of purchases is expected to grow in the upcoming months
13
2 2
2
13.5 17.6
25.8 27.5 28.5 32.5
43.4 42.9
164.8 168.6
218.1 218.5
Q2 2012 Q2 2013 Q2 2014 Q2 2015*
Net Income EBITDASales
% EBITDA core*
17.8%
20.0%
21.6% 21.7%
17.0%
(M$)

Above-Industry Organic Growth
Frutarom’s Strategic Goals
Over $1.5 billion in revenues by 2020
Proven Acquisition
Track Record
Margin Expansion
Continue successful strategy of combining rapid profitable organic growth with strategic acquisitions
Over 22% EBITDA in our core business by 2020
Over $1.5 billion in revenues by 2020
* Given current product mix
*
14

Maintain Positive Outlook for 2015-2016
Profitable internal growth in core business
Focus on innovative, health oriented, natural product mix
Successful integration of the recent acquisitions
Additional projects to improve efficiency and merge activities and operations
Strengthening & leveraging global purchasing
Strong acquisitions pipeline
15

Frutarom’s Vision
To Be The Preferred Partner For Tasty And Healthy Success