q1 - lee & associates: commercial real estate services · pdf fileq1 2017 houston office...
TRANSCRIPT

Q12017 HOUSTON
OFFICEMARKETREPORT
Q1 2017 Houston Office Market Overview
A Look Ahead
Trending Now
15.8%Vacancy
Numbers at a Glance
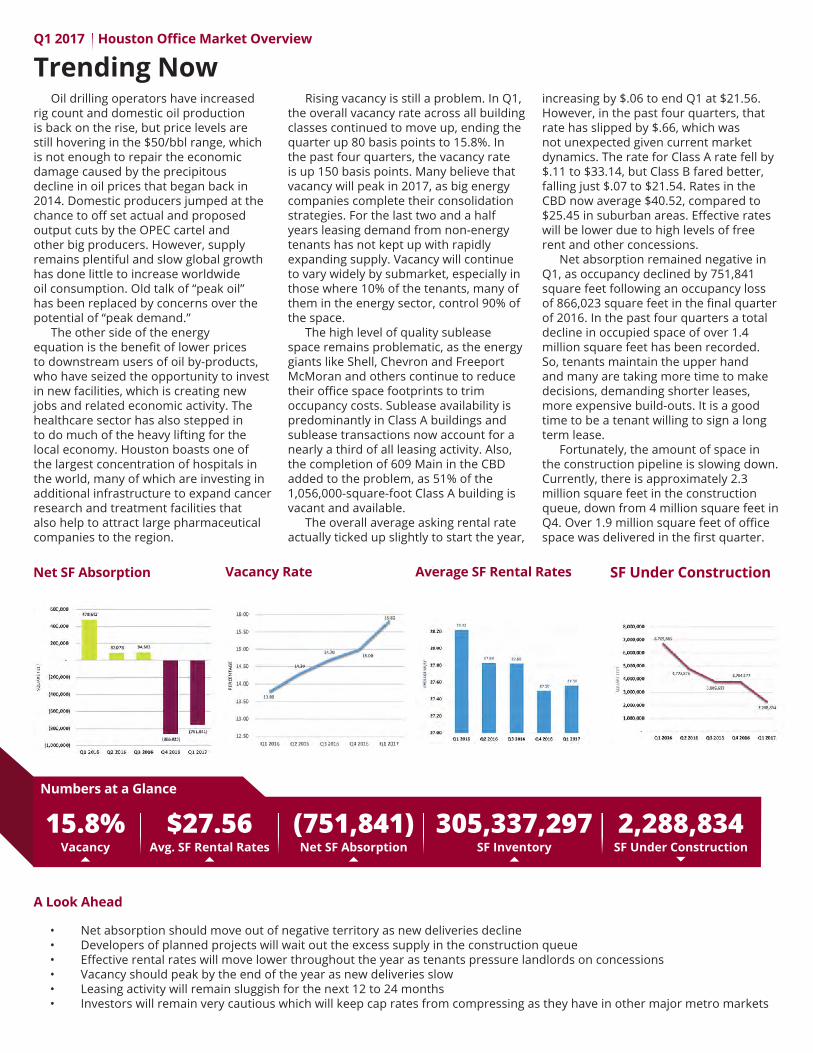
Net SF Absorption Average SF Rental RatesVacancy Rate SF Under Construction
Oil drilling operators have increased rig count and domestic oil production is back on the rise, but price levels are still hovering in the $50/bbl range, which is not enough to repair the economic damage caused by the precipitous decline in oil prices that began back in 2014. Domestic producers jumped at the chance to off set actual and proposed output cuts by the OPEC cartel and other big producers. However, supply remains plentiful and slow global growth has done little to increase worldwide oil consumption. Old talk of “peak oil” has been replaced by concerns over the potential of “peak demand.”
The other side of the energy equation is the benefit of lower prices to downstream users of oil by-products, who have seized the opportunity to invest in new facilities, which is creating new jobs and related economic activity. The healthcare sector has also stepped in to do much of the heavy lifting for the local economy. Houston boasts one of the largest concentration of hospitals in the world, many of which are investing in additional infrastructure to expand cancer research and treatment facilities that also help to attract large pharmaceutical companies to the region.
Rising vacancy is still a problem. In Q1, the overall vacancy rate across all building classes continued to move up, ending the quarter up 80 basis points to 15.8%. In the past four quarters, the vacancy rate is up 150 basis points. Many believe that vacancy will peak in 2017, as big energy companies complete their consolidation strategies. For the last two and a half years leasing demand from non-energy tenants has not kept up with rapidly expanding supply. Vacancy will continue to vary widely by submarket, especially in those where 10% of the tenants, many of them in the energy sector, control 90% of the space.
The high level of quality sublease space remains problematic, as the energy giants like Shell, Chevron and Freeport McMoran and others continue to reduce their office space footprints to trim occupancy costs. Sublease availability is predominantly in Class A buildings and sublease transactions now account for a nearly a third of all leasing activity. Also, the completion of 609 Main in the CBD added to the problem, as 51% of the 1,056,000-square-foot Class A building is vacant and available.
The overall average asking rental rate actually ticked up slightly to start the year,
increasing by $.06 to end Q1 at $21.56. However, in the past four quarters, that rate has slipped by $.66, which was not unexpected given current market dynamics. The rate for Class A rate fell by $.11 to $33.14, but Class B fared better, falling just $.07 to $21.54. Rates in the CBD now average $40.52, compared to $25.45 in suburban areas. Effective rates will be lower due to high levels of free rent and other concessions.
Net absorption remained negative in Q1, as occupancy declined by 751,841 square feet following an occupancy loss of 866,023 square feet in the final quarter of 2016. In the past four quarters a total decline in occupied space of over 1.4 million square feet has been recorded. So, tenants maintain the upper hand and many are taking more time to make decisions, demanding shorter leases, more expensive build-outs. It is a good time to be a tenant willing to sign a long term lease.
Fortunately, the amount of space in the construction pipeline is slowing down. Currently, there is approximately 2.3 million square feet in the construction queue, down from 4 million square feet in Q4. Over 1.9 million square feet of office space was delivered in the first quarter.
• Net absorption should move out of negative territory as new deliveries decline• Developers of planned projects will wait out the excess supply in the construction queue• Effective rental rates will move lower throughout the year as tenants pressure landlords on concessions• Vacancy should peak by the end of the year as new deliveries slow• Leasing activity will remain sluggish for the next 12 to 24 months• Investors will remain very cautious which will keep cap rates from compressing as they have in other major metro markets
$27.56Avg. SF Rental Rates
(751,841)Net SF Absorption
305,337,297SF Inventory
2,288,834SF Under Construction

Q1 2017 Houston Office Market Stats
MarketExisting Inventory Vacancy
"YTD Net Absorption"
"YTD Deliveries"
"Under Const SF"
"Quoted Rates"#
Blds Total RBA Direct SF Total SF Vac %
Austin County 33 207,976 3,318 3,318 1.6% (2,688) 0 0 $12.38
Bellaire 80 4,953,817 421,697 432,829 8.7% 9,589 0 0 $24.56
CBD 161 50,429,579 7,750,000 8,567,471 17.0% (637,025) 0 $40.52
E Fort Bend Co/Sugar. 375 9,664,514 805,004 908,549 9.4% 4,821 28,249 230,599 $26.69
FM 1960/Champions 233 4,148,619 636,862 644,333 15.5% 5,979 0 36,435 $14.40
FM 1960/Hwy 249 363 7,821,754 711,793 796,541 10.2% (7,395) 24,760 8,750 $23.70
FM 1960/I-45 North 101 2,485,734 528,576 531,970 21.4% 3,069 0 0 $18.49
Galleria/Uptown 65 16,718,567 2,618,898 2,827,987 16.9% (161,131) 0 104,579 $35.43
Greenspoint/IAH 53 3,370,128 598,956 598,956 17.8% 2,880 0 0 $19.70
Greenspoint/N Belt W. 117 10,869,263 3,998,028 4,636,698 42.7% 30,796 0 0 $20.09
Greenway Plaza 270 12,873,718 1,511,722 1,544,853 12.0% (31,209) 0 192,893 $33.47
Gulf Freeway/Pasaden. 579 7,272,678 694,668 694,668 9.6% 16,501 0 82,800 $20.36
I-10 East 120 1,185,101 280,711 280,711 23.7% (10,382) 0 0 $17.75
Katy Freeway East 258 11,874,042 1,130,582 1,237,701 10.4% 65,307 50,000 $26.22
Katy Freeway West 253 28,343,730 4,516,481 6,097,151 21.5% (67,866) 0 86,255 $27.87
Katy/Grand Parkway W 361 5,615,605 776,516 776,856 13.8% 37,111 43,986 255,738 $27.34
Kingwood/Humble 207 3,296,186 228,404 237,134 7.2% 105,708 44,450 $21.40
Midtown 511 9,487,616 965,504 993,264 10.5% (20,471) 0 0 $28.34
NASA/Clear Lake 496 10,406,101 1,542,140 1,594,793 15.3% (67,105) 0 26,800 $19.84
North Loop West 311 6,055,226 891,699 915,809 15.1% (84,212) 3,600 15,000 $23.89
Northeast Near 134 2,158,452 92,233 92,233 4.3% 44,698 0 85,000 $19.37
Northwest Far 127 4,361,965 830,306 838,603 19.2% (4,455) 0 0 $17.11
Northwest Near 54 1,898,234 114,580 114,580 6.0% (3,042) 0 0 $15.58
Post Oak Park 43 4,775,644 933,967 966,051 20.2% 244,013 0 $33.53
Richmond/Fountainvie. 114 2,163,428 329,129 329,129 15.2% (3,289) 0 0 $17.25
Riverway 23 3,084,567 401,145 433,658 14.1% (29,279) 0 0 $30.46
San Felipe/Voss 49 5,342,003 897,362 903,481 16.9% (4,477) 0 0 $29.63
San Jacinto County 3 39,139 0 0 0.0% 0 0 0 $0.00
South 226 2,817,004 247,348 247,348 8.8% 15,032 10,394 323,728 $23.11
South Hwy 35 142 782,614 49,532 49,532 6.3% (3,859) 0 0 $16.33
South Main/Medical C. 226 12,240,564 827,725 837,938 6.8% (45,784) 0 0 $26.89
Southwest Beltway 8 186 7,592,860 1,024,839 1,059,993 14.0% (46,497) 0 60,000 $17.63
Southwest/Hillcroft 107 5,344,261 637,592 639,092 12.0% 8,240 0 0 $16.39
West Belt 102 6,714,055 1,040,456 1,331,976 19.8% (63,698) 0 0 $25.66
Westchase 135 18,454,625 3,126,768 3,807,691 20.6% (96,375) 10,000 187,011 $28.84
Woodlands 565 20,487,928 2,126,496 2,234,484 10.9% 44,654 25,501 498,796 $29.76
Totals 7,183 305,337,297 43,291,037 48,207,381 15.8% (751,841) 1,921,321 2,288,834 $27.56Source: CoStar Group Inc.
The Houston Office market ended the first quarter 2017 with a vacancy rate of 15.8%. The vacancy rate was up over the previous quarter, with net absorption totaling negative (751,841) square feet in the first quarter. Vacant sublease space decreased in the quarter, ending the quarter at
4,916,344 square feet. Rental rates ended the first quarter at $27.56, an increase over the previous quarter. A total of 19 buildings delivered to the market in the quarter totaling 1,921,321 square feet, with 2,288,834 square feet still under construction at the end of the quarter.

Follow us on:
Q12017
9805 Katy Freeway, Suite 800Houston, Texas 77024 | 713.744.7400www.Lee-Associates.com/Houston
The information and details contained herein have been obtained from third-party sources believed to be reliable; however, DFW Lee & Associates, LLC - Houston Office has not independently verified its accuracy. DFW Lee & Associates, LLC - Houston Office makes no representations, guarantees, or express or implied warranties of any kind regarding the accuracy or completeness of the information and details provided herein, including but not limited to the implied warranty of suitability and fitness for a particular purpose.
Interested parties should perform their own due diligence regarding the accuracy of the information. The information provided herein, including any sale or lease terms, is being provided subject to errors, omissions, changes of price or conditions, prior sale or lease, and withdrawal without notice, by third-party data source providers.
The Houston Office Market Report compiles relevant market data by using a third-party database for the proprietary analysis of specific office properties in the Houston Area.
© Copyright 2017 DFW Lee & Associates, LLC - Houston Office. All rights reserved.
About This Report
About Lee & AssociatesLee & Associates-Houston is a fully-integrated commercial real estate firm that creatively responds to a client’s search for new, more functional space. Newly established in Houston, Lee & Associates is part of a national team of brokers with more than 60 office locations in cities across the U.S. and Canada. Our Houston team, comprised of 31 brokers, associates and partners, operates within every facet of the local commercial real estate market and offers exceptional representation to real estate investors, builders, buyers and tenants searching for quality results and the perfect space. With an unsurpassed network of experienced brokers across the nation, Lee & Associates-Houston is uniquely qualified to support its clients’ commercial real estate needs in the local, national and international markets.