q1 interim report - fuchs2 the first three months of 2012 at a glance group amounts in € million 1...
TRANSCRIPT

FUCHS PETROLUB AG
Q1 INTERIM REPORT
AS AT MARCH 31, 2012
Sales revenues and earnings increased again Earnings before interest and tax up 7.6 % to € 72.5 million
Positive outlook for 2012
2
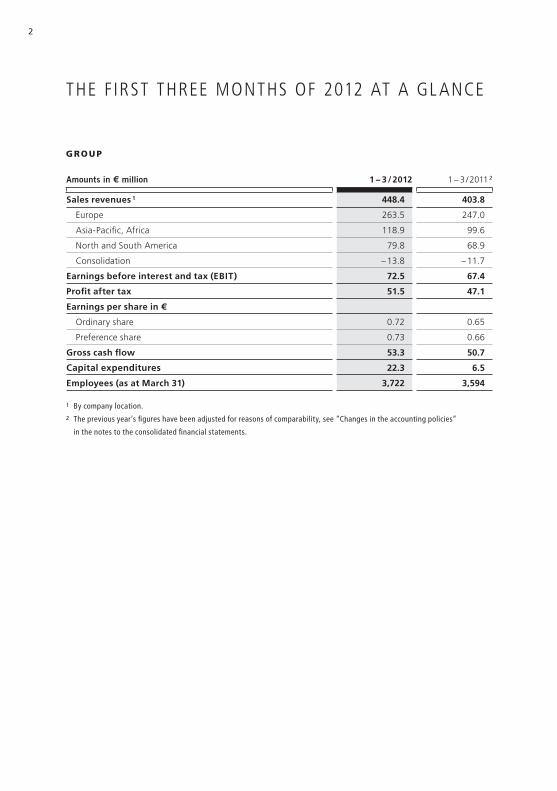
THE FIRST THREE MONTHS OF 2012 AT A GL ANCE
GROU P
Amounts in € million 1 − 3 / 2012 1 − 3 / 2011 2
Sales revenues 1 448.4 403.8
Europe 263.5 247.0
Asia-Pacifi c, Africa 118.9 99.6
North and South America 79.8 68.9
Consolidation – 13.8 – 11.7
Earnings before interest and tax (EBIT) 72.5 67.4
Profi t after tax 51.5 47.1
Earnings per share in €
Ordinary share 0.72 0.65
Preference share 0.73 0.66
Gross cash fl ow 53.3 50.7
Capital expenditures 22.3 6.5
Employees (as at March 31) 3,722 3,594
1 By company location.
2 The previous year’s fi gures have been adjusted for reasons of comparability, see “Changes in the accounting policies”
in the notes to the consolidated fi nancial statements.

3
The fi rst three months of 2012 at a glance
Letter to our shareholders
Group management report
Environment
Sales revenues up in all regions
Development of sales revenues by region
Earnings
Net assets and fi nancial position
Capital expenditure and investments in companies
Statement of cash fl ows
Research and development
Employees
Opportunities and risks
Business transactions with related companies and persons
Outlook
The FUCHS shares
Financial report of the Group
Income statement
Statement of comprehensive income
Balance sheet
Statement of changes in shareholders’ equity
Statement of cash fl ows
Segments
Notes to the interim consolidated fi nancial statements
Financial calendar
Disclaimer
02
04
06
06
07
07
08
09
10
10
11
12
12
12
13
14
15
15
16
17
18
20
21
22
30
31
CONTENTS
4
LET TER TO OUR SHAREHOLDERS
DEAR SHAREHOLDERS ,
The FUCHS PETROLUB Group recorded a 9 % increase in profi t after tax to over € 51 million in the fi rst quarter of 2012. This is a new record. In a generally positive economic environment, sales revenues increased 11 % on a comparable basis to € 448 million. All three global regions contributed to this growth in sales revenues. The encouraging and ongoing development in North America, Australia and Eastern Europe is worthy of particular note here.
Our focus remains on profi table growth, and our growth offensive is bearing fruit here. Work on the construction of new facilities in China and Russia is also in full swing. Staff are currently in the process of moving into the Technology Center in Mannheim. In the last few months, raw material costs have been rising sharply again. We are attempting to counteract this trend by price adjustments.
With an equity ratio of 67 % and a liquidity surplus of € 82 million, we have a solid balance sheet. We are in a position to fi nance the growth in sales revenues, con-tinue to invest in our infrastructure, review external growth opportunities, and pay dividends of € 70 million.
5
We anticipate sales revenues and earnings to increase overall in 2012. However, this is based on the assumption that the fi nancial crisis in Europe, any geopolitical tensions and increasing raw material prices will not have a severely negative impact on the global economy. We are striving to exceed the excellent € 264 million earnings before interest and tax we achieved in the previous year. However, the earnings recorded in the fi rst quarter cannot simply be extrapolated over the full year.
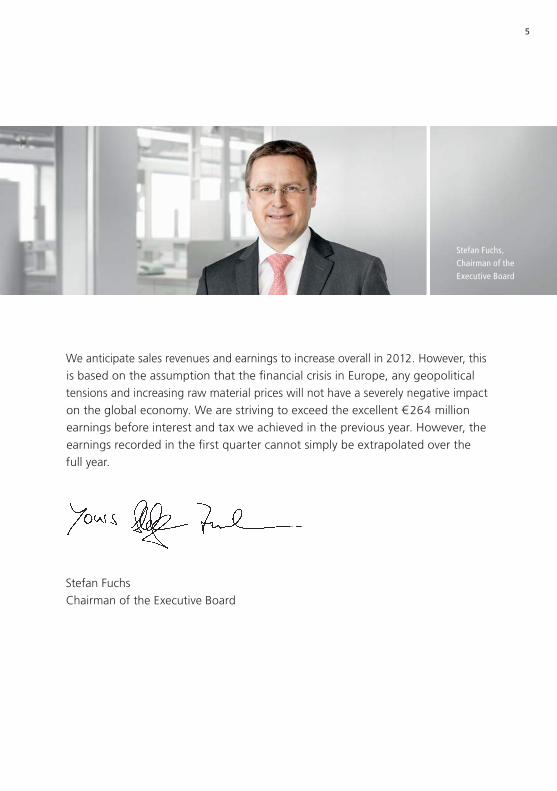
Stefan FuchsChairman of the Executive Board
Stefan Fuchs,
Chairman of the
Executive Board

6
GROUP MANAGEMENT REPORT
ENVIRONM ENT
In early 2012 the global economy has provided for a mixed but generally more friendly out-look than was the case just a few months ago. Although the euro zone is still on the edge of a slight recession, tensions in the fi nancial markets caused by fears of a crisis have been eased since the start of 2012 by the extended liquidity measures implemented by the ECB. The emerging countries appear to be relatively robust. The economic recovery in the US has stabilized in the last few quarters. For Germany, many economists are expecting a further slight increase in gross domestic product (GDP) in the fi rst quarter of 2012. According to a joint diagnosis of leading economic research institutes published in April, German GDP is likely to increase by 0.9 % for the year.
According to data published by the World Steel Association, global steel production increased by 0.6 % in the fi rst two months of 2012 compared to the same period of the previous year. Crude steel production in Germany in the fi rst three months of 2012 was 4.8 % below the level recorded in the fi rst quarter of 2011, although it has been increasing every month since the start of the year. In light of an improved order situation, the German Steel Trade Association (WV Stahl) is also anticipating continued recovery for the second quarter.
The German Engineering Federation (VDMA) has revised its original production forecast for the German engineering sector for the fi nancial year 2012 from 4 % to 0 %. This downward correction was made due to a decline in the number of new orders received. For the time period from December 2011 to February 2012, this fi gure was 11 % below the same period in the previous year.
According to the German Association of the Automotive Industry (VDA), the German auto-motive market was in good shape in the fi rst quarter of 2012. New car registrations increased by 1.4 % up to March, while exports and production remained at the very high levels of the previous year.
German chemicals production declined by 3.4 % up to February 2012, while overall sector sales revenues increased by 0.8 % in the same time period. For the full year 2012, the Association of the German Chemical Industry (VCI) is predicting stagnating production in Germany, accom-panied by an increase in sales revenues and production costs of 1 % in each case.
On the basis of the mixed economic framework, we are expecting slight growth in global lubricant consumption for 2012.

7
SALES REVENU ES U P IN ALL REGIONS
The FUCHS PETROLUB Group increased its sales revenues in all regions in the fi rst quarter of 2012. Outside Europe, sales volumes rose while benefi cial exchange rate movements also resulted in further growth. In addition to this, all regions recorded price and mix-related increases in sales revenues.
Overall, revenues of € 448.4 million (403.8) were recorded, which represents an increase of 11.0 % compared to the same quarter of the previous year.
Summary of the factors affecting sales revenues:
DEVELOPM ENT OF SALES REVENU ES BY REGION
1 The previous year’s fi gures have been adjusted for reasons of comparability, see “Changes in the accounting policies”
in the notes to the consolidated fi nancial statements.
In the Europe region, sales revenues increased by €16.5 million or 6.7 % to € 263.5 million (247.0) due to price adjustments and product mix. The companies in Germany, Great Britain, Russia and Poland were the main contributors to these increases. Currency translation effects canceled each other out within the region.
€ million %
Organic growth 35.0 8.7
External growth 0.4 0.1
Currency translation effects 9.2 2.3
Growth in sales revenues 44.6 11.0
in € million
First quarter of
2012
First quarter of
2011 1Organic growth
External growth
Exchange rate effects
Total change
absolute
Total change
in %
Europe 263.5 247.0 16.1 0.4 0.0 16.5 6.7
Asia-Pacifi c, Africa 118.9 99.6 12.5 0.0 6.8 19.3 19.4
North and
South America 79.8 68.9 8.5 0.0 2.4 10.9 15.8
Consolidation – 13.8 – 11.7 – 2.1 – – – 2.1 –
Total 448.4 403.8 35.0 0.4 9.2 44.6 11.0

8
With growth of €19.3 million or 19.4 % to €118.9 million (99.6), Asia-Pacifi c, Africa recorded the strongest regional growth. Our company in Australia was in particular able to increase its sales and revenues signifi cantly. Beside this, sales revenues in the region also increased due to currency conversion effects.
The strong dynamics of the previous quarters in the sub-region of North America also con-tinued into the start of 2012. The entire North and South America region therefore recorded above-average growth of 15.8 % or €10.9 million to € 79.8 million (68.9). The strength of the US dollar also had a positive effect when converted into the Group currency of euros.
EARNINGS
The FUCHS PETROLUB Group increased its gross profi t in the fi rst three months of the year by € 9.6 million or 6.3 % to €161.9 million (152.3). The signifi cant increases in raw material prices observed during the course of 2011 were a key contributor to the increases in sales revenues (+ 11 %). The material and production costs for our lubricants (cost of sales) increased more than proportionate by 13.9 %. This caused the gross margin to decline. At 36.1 % it therefore did not reach the previous year’s level of 37.7 %, although it is still above the level recorded in the fourth quarter of 2011 (35.8 %).
The Group was able to compensate for infl ation-based increases in personnel and other direct costs, and also managed to cover the additional personnel and infrastructure costs caused by its growth initiative. Total expenses for selling, distribution, administration and research and development increased by € 6.9 million or 8.1 % to € 92.2 million (85.3).
Taking into account other operating income, earnings before interest, tax and income from participations amounts to € 68.4 million, which represents € 2.7 million or 4.1 % more than the record level set in the fi rst three months of 2011 (65.7). Expressed as a percentage of sales revenues, the margin is 15.3 % (16.3 %).

9
With regard to a new ruling of the International Financial Reporting Standards (IFRS), which is due to come into effect and be binding from 2013, FUCHS has already adopted the amend-ments and as of 2012 is disclosing the earnings of its joint ventures in Switzerland, Turkey and in the Middle East in accordance with the equity method under Income from participations. These and all other fi gures from the previous year have therefore been adjusted in this interim report for reasons of comparability. The changes in accounting methods are described in detail in the notes to the fi nancial statements.
Income from participations increased by € 2.4 million to € 4.1 million (1.7). Earnings before interest and tax (EBIT) have therefore exceeded the fi gure recorded in the same period of the previous year by 7.6 % and reached € 72.5 million (67.4).
For reasons of liquidity and due to the outsourcing of pension liabilities in 2011, the fi nancial result saw further improvement (– € 0.5 million following – € 0.8 million in the previous year). After income taxes of € 20.5 million (19.5), the Group therefore increased its earnings dispro-portionately by 9.3 % to € 51.5 million (47.1). Earnings per share increased to € 0.72 (0.65) per ordinary share and € 0.73 (0.66) per preference share.
Regional earnings generated double-digit percentage increases in segment earnings to € 22.5 million (17.9) in Asia-Pacifi c, Africa and to €17.2 million (15.5) in North and South America, while Europe recorded € 32.7 million and was thereby not quite able to achieve the level recorded in the previous year (34.7). The relative KPI ratio of EBIT before income from partici-pations relative to sales revenues is below the previous year’s level in all regions. At 21.6 % (22.5 %), the North and South America region recorded very encouraging profi tability above the Group average of 15.3 % (16.3 %). Asia-Pacifi c, Africa recorded 15.7 % (16.7 %), while Europe recorded 12.3 % (13.9 %).
NET ASSETS AND F INANCIAL POSIT ION
The investments in infrastructure and production as well as the growth in Group sales reve-nues contributed to an increase in the balance sheet total to €1.053 billion (€ 985 million as at December 31, 2011). With an equity ratio of 67.0 % (66.8 %), the Group continues to enjoy extremely solid fi nancing. Cash and cash equivalents increased to € 94.3 million (79.0), mean-ing that the dividend payments scheduled for mid-May and totaling € 70 million can be fi nanced from these funds.
10
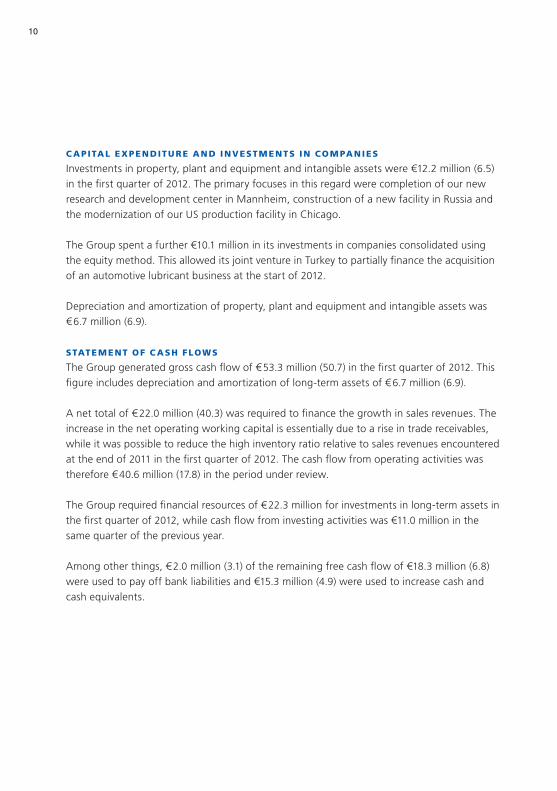
C APITAL EXPENDITU RE AND INVESTM ENTS IN COM PANIES
Investments in property, plant and equipment and intangible assets were €12.2 million (6.5) in the fi rst quarter of 2012. The primary focuses in this regard were completion of our new research and development center in Mannheim, construction of a new facility in Russia and the modernization of our US production facility in Chicago.
The Group spent a further €10.1 million in its investments in companies consolidated using the equity method. This allowed its joint venture in Turkey to partially fi nance the acquisition of an automotive lubricant business at the start of 2012.
Depreciation and amortization of property, plant and equipment and intangible assets was € 6.7 million (6.9).
STATEM ENT OF C ASH FLOWS
The Group generated gross cash fl ow of € 53.3 million (50.7) in the fi rst quarter of 2012. This fi gure includes depreciation and amortization of long-term assets of € 6.7 million (6.9).
A net total of € 22.0 million (40.3) was required to fi nance the growth in sales revenues. The increase in the net operating working capital is essentially due to a rise in trade receivables, while it was possible to reduce the high inventory ratio relative to sales revenues encountered at the end of 2011 in the fi rst quarter of 2012. The cash fl ow from operating activities was therefore € 40.6 million (17.8) in the period under review.
The Group required fi nancial resources of € 22.3 million for investments in long-term assets in the fi rst quarter of 2012, while cash fl ow from investing activities was €11.0 million in the same quarter of the previous year.
Among other things, € 2.0 million (3.1) of the remaining free cash fl ow of €18.3 million (6.8) were used to pay off bank liabilities and €15.3 million (4.9) were used to increase cash and cash equivalents.

11
RESEARC H AND DEVELOPM ENT
FUCHS is signifi cantly expanding the research and development infrastructure at its Mannheim location. Construction of a new laboratory building began in 2010. In the meantime work has been completed and staff are currently in the process of moving into the new premises. This important investment reinforces the importance of the Mannheim location as a central development site within the FUCHS Group.
The extension is also an expression of the ever stricter requirements in the development of lubricants, which require intensive research and development as individualized design and process components. Furthermore, a comprehensive and high performance quality assurance system is also needed.
The following new products, which also highlight the broad scope of potential applications, are examples of special FUCHS solutions for sophisticated applications.
CEPLATTYN BL WHITE is a bright adhesive lubricant with white solid lubricants for pitch and azimuth drives in wind turbines. The product is applied using automatic lubrication systems and allows clean and very low-wear lubrication, both at extremely low tempera-tures of down to – 30°C and high temperatures above 100°C.
STABYL TA is a special adhesive lubricant for steel/plastic combinations. This newly developed special lubricant was developed specifi cally for mobile crane booms, so-called telescopic cranes, which are used for moving loads of up to 1,200 tons. Using this adhe-sive lubricant prevents dangerous stick-slip behavior under load and signifi cantly improves operational safety. At the same time, heavier loads can also be transported and moved, even when the boom is positioned horizontally.
RENISO ULTRACOOL 68 is a high performance refrigerator oil for ammonia chillers. The product is based on synthetic hydrocarbons. It offers exceptional low temperature properties, good fl owability, low volatility, a long service life, as well as improved effi ciency and heat transfer coeffi cients. These properties signifi cantly improve the effi ciency of the overall sys-tem. In addition to this, the oil change intervals can be extended thanks to the innovative formula of this refrigerator oil.

12
EM PLOYEES
As at March 31, 2012, the global workforce of the FUCHS PETROLUB Group consisted of 3,722 employees. On a like-for-like basis, the number of employees at the start of the year was 3,673 compared with 3,594 during the same period of the previous year.
The workforce at a glance:
1 The previous year’s fi gures have been adjusted for reasons of comparability, see “Changes in the accounting policies”
in the notes to the consolidated fi nancial statements.
OPPORTUNIT IES AND R ISKS
In the annual report 2011, FUCHS reported in detail on the opportunities and risks resulting from its international business activities. There have been no signifi cant changes since this time. On the basis of the information currently available, we are of the opinion that no signif-icant individual risks exist for the FUCHS PETROLUB Group, neither now nor in the foresee-able future. Nor do the overall risks or combinations of risks threaten the continued existence of the Group.
The FUCHS PETROLUB Group has implemented an adequate risk management system, which ensures that opportunities and risks are identifi ed and dealt with in good time. We have made all possible provision for typical business risks capable of having a major infl uence on the company’s net assets, fi nancial position and results of operations.
BUSINESS TR ANSAC TIONS WITH REL ATED COM PANIES AND PERSONS
As at December 31, 2011, a dependent company report was prepared pursuant to Section 312 of the German Stock Corporation Act (AktG) with the concluding declaration: “In the legal transactions listed in the dependent company report, and according to the circumstances that were known to us when those legal transactions were performed, our company received an appropriate consideration in each legal transaction. No actions subject to disclosure occurred on the instruction or in the interest of the controlling company or any company associated
March 31, 2012 Dec. 31, 2011 1 March 31, 2011 1
Europe 2,369 2,337 2,286
Asia-Pacifi c, Africa 830 814 795
North and South America 523 522 513
Total 3,722 3,673 3,594

13
with it.” KPMG AG Wirtschaftsprüfungsgesellschaft, Mannheim, the independent auditors of FUCHS PETROLUB AG, have audited this dependent company report and provided it with an unqualifi ed audit opinion.
Up to March 31, 2012, there were no indications which would lead us to revise our statement regarding business transactions with related companies and persons.
OUTLOOK
Despite the various latent risks in place, we rate the current overall economic situation as positive. The global economy proved relatively resistant in the fi rst quarter of 2012. Based on our performance in the fi rst three months, we also expect to see growth in sales revenues over the coming quarters, which will be largely driven by the companies outside Europe.
However, the general picture is clouded by price increases in raw materials and uncertainties resulting from the national debt crises and global risks, such as those in the Middle East.
Insofar as and as long as these risks do not materialize to an appreciable extent, the FUCHS PETROLUB Group anticipates year on year increases both in sales revenues and earnings. However, the development of the gross margin will be dependent on the trend in material prices. In addition to this, personnel and other direct costs will be appreciably above the previous year’s level as a result of our ongoing growth initiative.
Overall, FUCHS is striving to exceed the record € 264.2 million earnings before interest and tax achieved in the previous year. However, the earnings recorded in the fi rst quarter cannot simply be extrapolated over the full year.
The FUCHS PETROLUB Group is continuing its investments as planned in 2012, particularly in emerging markets, and expects to record well above-average capital expenditure through-out the year. Despite this, a high level of free cash fl ow should once again be reached in 2012.

THE FUCHS SHARES
Despite the ongoing uncertainty concerning the national debt crisis, we have seen an encour-aging start to 2012. The share markets have continued their upward trend. This positive development was also refl ected in the price trend of the FUCHS shares in the fi rst quarter.
The FUCHS ordinary share closed at €39.50 in XETRA trading on March 30, 2012, which was 31.2 % above the 2011 year end price. At a price of €41.98, the preference share enjoyed a 24.1 % increase. The DAX and MDAX rose by 17.8 % and 20.3 % respectively over the same time period.
PR ICE TREND OF ORDINARY AND PREFERENCE SHARES IN COMPARISON WITH DA X AND MDA X
( JANUARY 1 – MARCH 31, 2012)
Rel %
130
125
120
115
110
105
100
95
January February March
Preference share Ordinary share DAX MDAX
14

1515FINANCIAL REPORT OF THE GROUP
INCOM E STATEM ENT
in € millionFirst quarter
of 2012First quarter
of 2011 1
Sales revenues 448.4 403.8
Cost of sales – 286.5 – 251.5
Gross profi t 161.9 152.3
Selling and distribution expenses – 62.6 – 57.9
Administrative expenses – 22.4 – 20.7
Research and development expenses – 7.2 – 6.7
Operating profi t 69.7 67.0
Other operating income and expenses – 1.3 – 1.3
EBIT before income from participations 68.4 65.7
Income from participations 4.1 1.7
Earnings before interest and tax (EBIT) 72.5 67.4
Financial result – 0.5 – 0.8
Earnings before tax (EBT) 72.0 66.6
Income taxes – 20.5 – 19.5
Profi t after tax 51.5 47.1
thereof
Non-controlling interests 0.1 0.3
Profi t attributable to equity holders of
FUCHS PETROLUB AG 51.4 46.8
Earnings per share in € 2
Ordinary share 0.72 0.65
Preference share 0.73 0.66
1 The previous year’s fi gures have been adjusted for reasons of comparability, see “Changes in the accounting policies”
in the notes to the consolidated fi nancial statements.
2 Basic and diluted in both cases, after share split in June 2011.

16
STATEM ENT OF COM PREHENSIVE INCOM E
in € millionFirst quarter
of 2012First quarter
of 2011
Profi t after tax 51.5 47.1
Income and expense recognized in equity
Change in fair values of hedging instruments 0.0 0.0
Change in foreign currency translation adjustments 1
foreign subsidiaries – 3.0 – 11.3
investments accounted for using the equity method – 0.1 – 0.3
Actuarial gains/losses on defi ned benefi t pension commitments – 1.9 1.7
Deferred taxes on income and expenses recognized in equity 0.6 – 0.5
Other changes 0.0 0.0
Total income and expenses recognized directly in equity – 4.4 – 10.4
Total income and expenses for the period 47.1 36.7
thereof shareholder of FUCHS PETROLUB AG 47.0 36.4
thereof non-controlling interests 0.1 0.3
1 The previous year’s fi gures have been adjusted for reasons of comparability, see “Changes in the accounting policies”
in the notes to the consolidated fi nancial statements.

17
BAL ANC E SHEET
in € million March 31, 2012 Dec. 31, 2011 1
Assets
Intangible assets 115.6 116.9
Property, plant and equipment 221.2 215.4
Investments accounted for using the equity method 38.7 24.6
Other fi nancial assets 4.5 5.1
Deferred tax assets 26.7 26.1
Other receivables and other assets 2.7 4.0
Long-term assets 409.4 392.1
Inventories 230.9 228.4
Trade receivables 281.2 247.5
Tax receivables 1.8 1.8
Other receivables and other assets 35.2 36.5
Cash and cash equivalents 94.3 79.0
Short-term assets 643.4 593.2
Total assets 1,052.8 985.3
Equity and liabilities
Subscribed capital 71.0 71.0
Group reserves 581.3 403.3
Group profi ts 51.4 182.4
Equity of shareholders of FUCHS PETROLUB AG 703.7 656.7
Non-controlling interests 1.2 1.5
Total equity 704.9 658.2
Pension provisions 16.0 15.8
Other provisions 6.8 7.0
Deferred tax liabilities 18.4 18.6
Financial liabilities 0.0 0.0
Other liabilities 3.7 3.8
Long-term liabilities 44.9 45.2
Trade payables 145.0 128.5
Provisions 21.8 23.8
Tax liabilities 38.2 30.8
Financial liabilities 12.3 14.1
Other liabilities 85.7 84.7
Short-term liabilities 303.0 281.9
Total equity and liabilities 1,052.8 985.3
1 The previous year’s fi gures have been adjusted for reasons of comparability, see “Changes in the accounting policies”
in the notes to the consolidated fi nancial statements.

18
STATEM ENT OF C HANGES IN SHAREHOLDERS’ EQUIT Y
in € millionOutstanding shares (units)
Subscribed capital AG
Capital reserves AG
As at December 31, 2010 23,660,000 71.0 94.6
Dividend payments
Profi t after tax January 1 – March 31, 2011
Change in income and expenses recognized
directly in equity
Other changes
As at March 31, 2011 23,660,000 71.0 94.6
As at December 31, 2011 70,980,000 1 71.0 94.6
Dividend payments
Profi t after tax January 1 – March 31, 2012
Change in income and expenses recognized
directly in equity
Other changes
As at March 31, 2012 70,980,000 71.0 94.6
1 After share split in June 2011.
2 Income and expenses recognized in equity of shareholders of FUCHS PETROLUB AG.

19
Equity capital generated
in the GroupActuarial gains
and losses 2
Differences arising from
currency translation 2
Equity of shareholders
of FUCHS PETROLUB AG
Non-controlling interests Total equity
395.3 – 24.3 7.7 544.3 1.6 545.9
0.0 – 0.4 – 0.4
46.8 46.8 0.3 47.1
1.2 – 11.6 – 10.4 – 10.4
0.1 0.1 – 0.1 0.0
442.2 – 23.1 – 3.9 580.8 1.4 582.2
510.8 – 32.6 12.9 656.7 1.5 658.2
0.0 – 0.4 – 0.4
51.4 51.4 0.1 51.5
– 1.3 – 3.1 – 4.4 – 4.4
0.0 0.0
562.2 – 33.9 9.8 703.7 1.2 704.9

20
STATEM ENT OF C ASH FLOWS
in € million March 31, 2012 Dec. 31, 2011 1
Profi t after tax 51.5 47.1
Depreciation and amortization of long-term assets 6.7 6.9
Change in long-term provisions and in other non-current
assets (covering funds) – 0.6 – 1.3
Change in deferred taxes – 0.2 – 0.3
Non-cash income from investments accounted for using
the equity method – 4.1 – 1.7
Gross cash fl ow 53.3 50.7
Change in inventories – 3.0 – 24.8
Change in trade receivables – 34.8 – 39.8
Change in other assets 1.2 – 2.6
Change in trade payables 15.8 24.3
Change in other liabilities (excluding fi nancial liabilities) 8.1 10.0
Net gain/loss on disposal of long-term assets 0.0 0.0
Cash fl ow from operating activities 40.6 17.8
Investments in long-term assets – 22.3 – 6.5
Acquisition of subsidiaries and other business units 0.0 0.0
Proceeds from the disposal of long-term assets 0.0 1.5
Disposal of fi nancial resources due to changes
in scope of consolidation 0.0 – 6.0
Dividends received 0.0 0.0
Cash fl ow from investing activities – 22.3 – 11.0
Free cash fl ow 18.3 6.8
Dividends paid for previous year – 0.4 – 0.4
Changes in bank and leasing commitments – 2.0 – 3.1
Cash fl ow from fi nancing activities – 2.4 – 3.5
Cash and cash equivalents at the end of the previous period 79.0 90.6
Cash fl ow from operating activities 40.6 17.8
Cash fl ow from investing activities – 22.3 – 11.0
Cash fl ow from fi nancing activities – 2.4 – 3.5
Effect of currency translations – 0.6 1.6
Cash and cash equivalents at the end of the period 2 94.3 95.5
1 The previous year’s fi gures have been adjusted for reasons of comparability, see “Changes in the accounting policies”
in the notes to the consolidated fi nancial statements.
2 Cash and cash equivalents comprise total liquid funds of the Group.
21
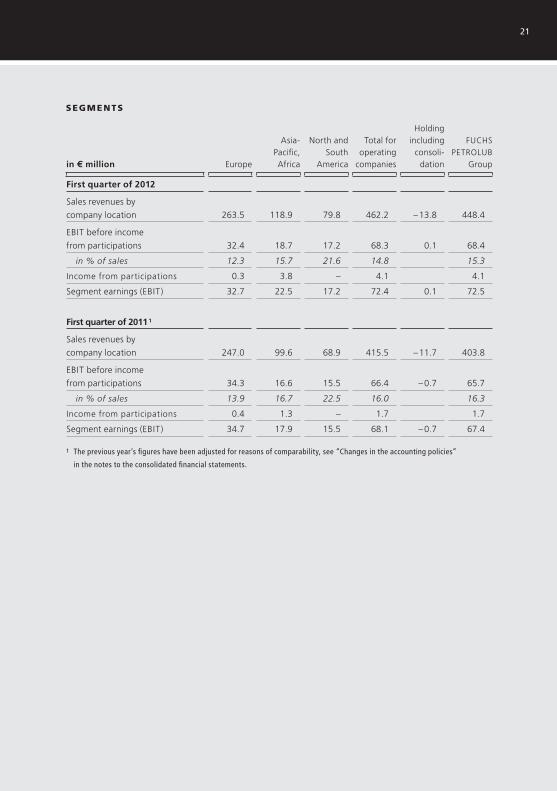
SEGM ENTS
in € million Europe
Asia-Pacifi c,Africa
North and South
America
Total for operating
companies
Holdingincluding
consoli-dation
FUCHS PETROLUB
Group
First quarter of 2012
Sales revenues by
company location 263.5 118.9 79.8 462.2 – 13.8 448.4
EBIT before income
from participations 32.4 18.7 17.2 68.3 0.1 68.4
in % of sales 12.3 15.7 21.6 14.8 15.3
Income from participations 0.3 3.8 – 4.1 4.1
Segment earnings (EBIT) 32.7 22.5 17.2 72.4 0.1 72.5
First quarter of 2011 1
Sales revenues by
company location 247.0 99.6 68.9 415.5 – 11.7 403.8
EBIT before income
from participations 34.3 16.6 15.5 66.4 – 0.7 65.7
in % of sales 13.9 16.7 22.5 16.0 16.3
Income from participations 0.4 1.3 – 1.7 1.7
Segment earnings (EBIT) 34.7 17.9 15.5 68.1 – 0.7 67.4
1 The previous year’s fi gures have been adjusted for reasons of comparability, see “Changes in the accounting policies”
in the notes to the consolidated fi nancial statements.

22
NOTES TO THE INTERIM CONSOLIDATED F INANCIAL STATEM ENTS
The interim consolidated fi nancial statements of FUCHS PETROLUB AG, Mannheim, have been prepared in accordance with the principles of the International Financial Reporting Standards (IFRS), taking into account the standards and interpretations laid down in the guide-lines of the International Accounting Standards Board (IASB), London – to be applied within the EU and valid on the date of report. The interim consolidated fi nancial statements are pre-paired in accordance with IAS 34. The accounting and valuation principles, together with the calculation methods, remained unchanged from the consolidated fi nancial statements for 2011 – with the exception of the change in accounting policies described below; we there-fore refer to the notes to the consolidated fi nancial statements made there.
The interim consolidated fi nancial statements and the interim management report were not subject to examination by the auditor.
Change to the scope of consolidation
The initial consolidation of the Swedish subsidiary FUCHS SMÖRJMEDEL SVERIGE AB was performed in the fi rst quarter of 2012. FUCHS PETROLUB AG founded this company in Sweden to intensive the development of the Scandinavian market. The initial consolidation had no signifi cant effects on the net assets. fi nancial position or results of operations of the FUCHS PETROLUB Group.
Changes in the accounting policies
IAS 31 Interests in Joint Ventures
The FUCHS PETROLUB Group has altered its method of accounting for shares in joint ven-tures. The change concerns the switchover from the proportionate consolidation to using the equity method of accounting of the two joint ventures in Switzerland and Turkey. The background to this change is IFRS 11 “Joint Arrangements”, which has been approved and published by the IASB and requires that from the fi nancial year 2013 onward joint ventures be included in the consolidated fi nancial statements exclusively using the equity method. The option to include these joint ventures in the consolidated fi nancial statements on a propor-tionate consolidation basis as per IAS 31 will therefore be eliminated from 2013 onward. With regard to this new ruling and by exercising the current option as per IAS 31, we changed the method of accounting for our two joint ventures from including them in the consolidated fi nancial statements on a proportionate consolidation basis up to December 31, 2011 to using the equity method of accounting as of January 1, 2012 onward. These changes will require the previous year’s fi nancial information to be adjusted, as shown below.
23
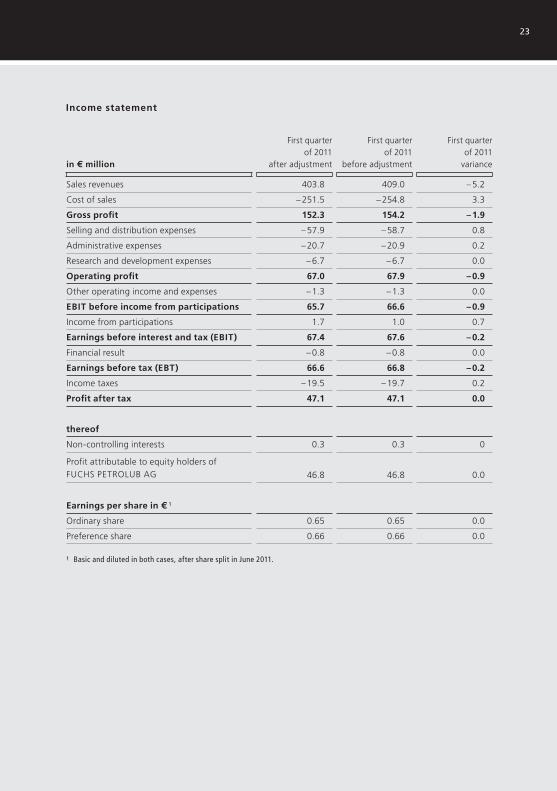
Income statement
in € million
First quarter of 2011
after adjustment
First quarter of 2011
before adjustment
First quarter of 2011
variance
Sales revenues 403.8 409.0 – 5.2
Cost of sales – 251.5 – 254.8 3.3
Gross profi t 152.3 154.2 – 1.9
Selling and distribution expenses – 57.9 – 58.7 0.8
Administrative expenses – 20.7 – 20.9 0.2
Research and development expenses – 6.7 – 6.7 0.0
Operating profi t 67.0 67.9 – 0.9
Other operating income and expenses – 1.3 – 1.3 0.0
EBIT before income from participations 65.7 66.6 – 0.9
Income from participations 1.7 1.0 0.7
Earnings before interest and tax (EBIT) 67.4 67.6 – 0.2
Financial result – 0.8 – 0.8 0.0
Earnings before tax (EBT) 66.6 66.8 – 0.2
Income taxes – 19.5 – 19.7 0.2
Profi t after tax 47.1 47.1 0.0
thereof
Non-controlling interests 0.3 0.3 0
Profi t attributable to equity holders of FUCHS PETROLUB AG 46.8 46.8 0.0
Earnings per share in € 1
Ordinary share 0.65 0.65 0.0
Preference share 0.66 0.66 0.0
1 Basic and diluted in both cases, after share split in June 2011.
24
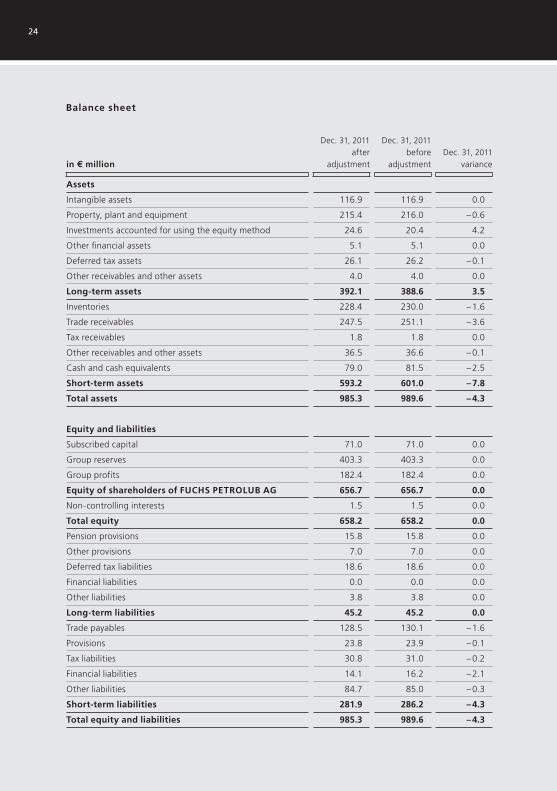
Balance sheet
in € million
Dec. 31, 2011after
adjustment
Dec. 31, 2011before
adjustmentDec. 31, 2011
variance
Assets
Intangible assets 116.9 116.9 0.0
Property, plant and equipment 215.4 216.0 – 0.6
Investments accounted for using the equity method 24.6 20.4 4.2
Other fi nancial assets 5.1 5.1 0.0
Deferred tax assets 26.1 26.2 – 0.1
Other receivables and other assets 4.0 4.0 0.0
Long-term assets 392.1 388.6 3.5
Inventories 228.4 230.0 – 1.6
Trade receivables 247.5 251.1 – 3.6
Tax receivables 1.8 1.8 0.0
Other receivables and other assets 36.5 36.6 – 0.1
Cash and cash equivalents 79.0 81.5 – 2.5
Short-term assets 593.2 601.0 – 7.8
Total assets 985.3 989.6 – 4.3
Equity and liabilities
Subscribed capital 71.0 71.0 0.0
Group reserves 403.3 403.3 0.0
Group profi ts 182.4 182.4 0.0
Equity of shareholders of FUCHS PETROLUB AG 656.7 656.7 0.0
Non-controlling interests 1.5 1.5 0.0
Total equity 658.2 658.2 0.0
Pension provisions 15.8 15.8 0.0
Other provisions 7.0 7.0 0.0
Deferred tax liabilities 18.6 18.6 0.0
Financial liabilities 0.0 0.0 0.0
Other liabilities 3.8 3.8 0.0
Long-term liabilities 45.2 45.2 0.0
Trade payables 128.5 130.1 – 1.6
Provisions 23.8 23.9 – 0.1
Tax liabilities 30.8 31.0 – 0.2
Financial liabilities 14.1 16.2 – 2.1
Other liabilities 84.7 85.0 – 0.3
Short-term liabilities 281.9 286.2 – 4.3
Total equity and liabilities 985.3 989.6 – 4.3

25
Statement of cash flows
in € million
March 31, 2011 after
adjustment
March 31, 2011 before
adjustmentMarch 31, 2011
variance
Profi t after tax 47.1 47.1 0.0
Depreciation and amortization of long-term assets 6.9 6.9 0.0
Change in long-term provisions and in other
non-current assets (covering funds) – 1.3 – 1.3 0.0
Change in deferred taxes – 0.3 – 0.3 0.0
Non-cash income from investments accounted
for using the equity method – 1.7 – 1.0 – 0.7
Gross cash fl ow 50.7 51.4 – 0.7
Change in inventories – 24.8 – 23.6 – 1.2
Change in trade receivables – 39.8 – 40.6 0.8
Change in other assets – 2.6 – 2.6 0.0
Change in trade payables 24.3 24.7 – 0.4
Change in other liabilities (excluding fi nancial liabilities) 10.0 8.0 2.0
Net gain/loss on disposal of long-term assets 0.0 0.0 0.0
Cash fl ow from operating activities 17.8 17.3 0.5
Investments in long-term assets – 6.5 – 6.5 0.0
Acquisition of subsidiaries and other business units 0.0 0.0 0.0
Proceeds from the disposal of long-term assets 1.5 1.5 0.0
Disposal of fi nancial resources due to changes
in scope of consolidation – 6.0 – 6.0 0.0
Dividends received 0.0 0.0 0.0
Cash fl ow from investing activities – 11.0 – 11.0 0.0
Free cash fl ow 6.8 6.3 0.5
Dividends paid for previous year – 0.4 – 0.4 0.0
Changes in bank and leasing commitments – 3.1 – 2.5 – 0.6
Cash fl ow from fi nancing activities – 3.5 – 2.9 – 0.6
Cash and cash equivalents at the end
of the previous period 90.6 92.1 – 1.5
Cash fl ow from operating activities 17.8 17.3 0.5
Cash fl ow from investing activities – 11.0 – 11.0 0.0
Cash fl ow from fi nancing activities – 3.5 – 2.9 – 0.6
Effect of currency translations 1.6 1.7 – 0.1
Cash and cash equivalents at the end of the period 1 95.5 97.2 – 1.7
1 Cash and cash equivalents comprise total liquid funds of the Group.

26
Segments
in € million Europe
Asia-Pacifi c,Africa
North and South
America
Total for operating
companies
Holdingincluding
consoli-dation
FUCHS PETROLUB
Group
First quarter of 2011
after adjustment
Sales revenues by
company location 247.0 99.6 68.9 415.5 – 11.7 403.8
EBIT before income
from participations 34.3 16.6 15.5 66.4 – 0.7 65.7
in % of sales 13.9 16.7 22.5 16.0 16.3
Income from participations 0.4 1.3 – 1.7 1.7
Segment earnings (EBIT) 34.7 17.9 15.5 68.1 – 0.7 67.4
First quarter of 2011
before adjustment
Sales revenues by
company location 249.8 102.1 68.9 420.8 – 11.8 409.0
EBIT before income
from participations 34.8 17.1 15.5 67.4 – 0.8 66.6
in % of sales 13.9 16.7 22.5 16.0 16.3
Income from participations – 1.0 – 1.0 1.0
Segment earnings (EBIT) 34.8 18.1 15.5 68.4 – 0.8 67.6
First quarter of 2011
variance
Sales revenues by
company location – 2.8 – 2.5 0.0 – 5.3 0.1 – 5.2
EBIT before income
from participations – 0.5 – 0.5 0.0 – 1.0 0.1 – 0.9
Income from participations 0.4 0.3 – 0.7 0.7
Segment earnings (EBIT) – 0.1 – 0.2 0.0 – 0.3 0.1 – 0.2

27
The changes did not have any effects on net profi t after tax. earnings per share or share-holders’ equity for the year 2011 or the fi rst quarter of 2012.
Income from participations
Income from participations in the income statement includes earnings from investments in companies accounted for using the equity method.
Relationships with related parties
Our general disclosures in the notes to the consolidated fi nancial statements as of Decem-ber 31, 2011 continue to apply unchanged. The FUCHS PETROLUB Group has trade receivables of € 0.4 million (0.4), dividend receivables of € 0.0 million (3.3) and license receivables of € 0.3 million (0.0) due from companies accounted for using the equity method. The liability of €13.5 million (13.5) refers to an amount held on a fi duciary basis for an associated company in the Middle East which is also recognized on the assets side under short-term Other receiv-ables and other assets. The sales revenues from deliveries of goods to companies measured at equity were € 3.1 million (0.7) in the fi rst quarter of 2012, while other operating income was € 0.3 million (0.0).
28
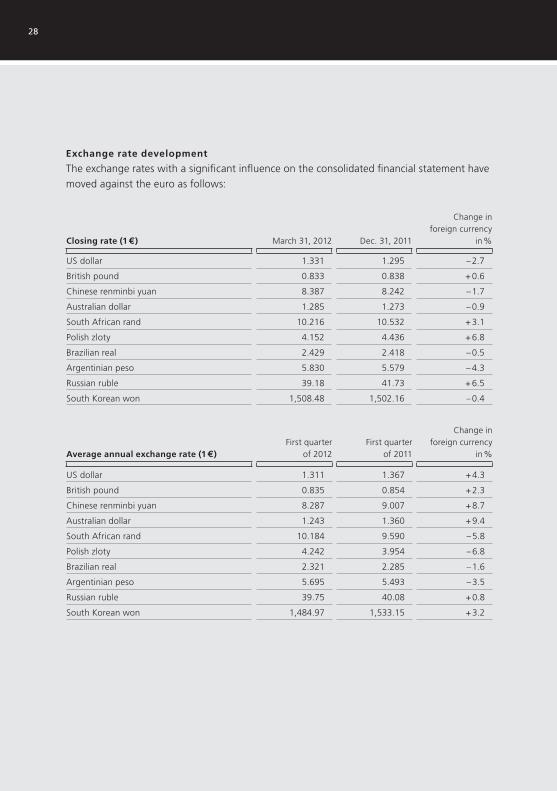
Exchange rate development
The exchange rates with a signifi cant infl uence on the consolidated fi nancial statement have moved against the euro as follows:
Closing rate (1 €) March 31, 2012 Dec. 31, 2011
Change inforeign currency
in %
US dollar 1.331 1.295 – 2.7
British pound 0.833 0.838 + 0.6
Chinese renminbi yuan 8.387 8.242 – 1.7
Australian dollar 1.285 1.273 – 0.9
South African rand 10.216 10.532 + 3.1
Polish zloty 4.152 4.436 + 6.8
Brazilian real 2.429 2.418 – 0.5
Argentinian peso 5.830 5.579 – 4.3
Russian ruble 39.18 41.73 + 6.5
South Korean won 1,508.48 1,502.16 – 0.4
Average annual exchange rate (1 €)First quarter
of 2012First quarter
of 2011
Change inforeign currency
in %
US dollar 1.311 1.367 + 4.3
British pound 0.835 0.854 + 2.3
Chinese renminbi yuan 8.287 9.007 + 8.7
Australian dollar 1.243 1.360 + 9.4
South African rand 10.184 9.590 – 5.8
Polish zloty 4.242 3.954 – 6.8
Brazilian real 2.321 2.285 – 1.6
Argentinian peso 5.695 5.493 – 3.5
Russian ruble 39.75 40.08 + 0.8
South Korean won 1,484.97 1,533.15 + 3.2

29
Events after the balance sheet date
Subsequent to the balance sheet date there have been no events that would materially affect the fi nancial condition or results of operations of the Group.

30
May 2 Interim report as at March 31, 2012
Press conference call
Analyst conference call
May 9 Annual General Meeting, Mannheim
May 10 Information event for Swiss shareholders, Zurich
August 2 Interim report as at June 30, 2012
First-half press conference, Mannheim
Analyst conference call
November 5 Interim report as at September 30, 2012
Press conference call
Analyst conference call
FINANCIAL CALENDAR
DATES 2012

31
This interim report contains statements about future developments that are based on assumptions and estimates made by the management of FUCHS PETROLUB AG. Even if the management is of the opinion that these assumptions and estimates are accurate, future actual developments and future actual results may differ signifi cantly from these assumptions and estimates due to a variety of factors. These factors can include changes in the overall economic climate, changes to exchange rates and interest rates, and changes in the lubricants industry. FUCHS PETROLUB AG provides no guarantee that future developments and the results actually achieved in future will be in line with the assumptions and estimates set out in this interim report and assumes no liability for such.
DISCL AIMER

This interim report is also available in German.
Both language versions are accessible via the
internet.
FUCHS PETROLUB AG
Investor Relations
Friesenheimer Straße 17
68169 Mannheim, Germany
Telephone 0049-(0)621-3802-1105
Fax 0049-(0)621-3802-7274
www.fuchs-oil.com
E-Mail: ir @fuchs-oil.de