q1 fy’18...2 mtpa steel coal mines cement road solutions lgs 17. capacity in deail iron making...
TRANSCRIPT


Q1 FY’18
Industry Update &
Key Performance Highlights
8th August, 2017
DISCLAIMERThis presentation may contain certain forward looking statements concerning JSPL’s futurebusiness prospects and business profitability, which are subject to a number of risks anduncertainties and the actual results could materially differ from those in such forward lookingstatements.
The risks and uncertainties relating to these statements include, but are not limited to, risks anduncertainties regarding fluctuations in earnings, our ability to manage growth, competition(both domestic and international), economic growth in India and the target countries forexports, ability to attract and retain highly skilled professionals, time and cost over runs oncontracts, our ability to manage our international operations, government policies and actionswith respect to investments, fiscal deficits, regulations, etc., interest and other fiscal costsgenerally prevailing in the economy. Past performance may not be indicative of futureperformance. We do not undertake to update our forward-looking statements.
This presentation is not intended, and does not, constitute or form part of any offer, invitation orthe solicitation of an offer to purchase, otherwise acquire, subscribe for, sell or otherwisedispose of, any securities in JSPL or any of it’s subsidiary undertakings or any other invitation orinducement to engage in investment activities, neither shall this presentation nor the fact of it’sdistribution form the basis of, or be relied on in connection with, any contract or investmentdecision. Few numbers in this presentation are purely indicative & provisional and could changelater.
2

OUTLOOK
Q1 FY’18
INDUSTRYDEVELOPMENTS
BRIEF BACKGROUND OPERATIONALPERFORMANCE
PRESENTATION OUTLINE
3
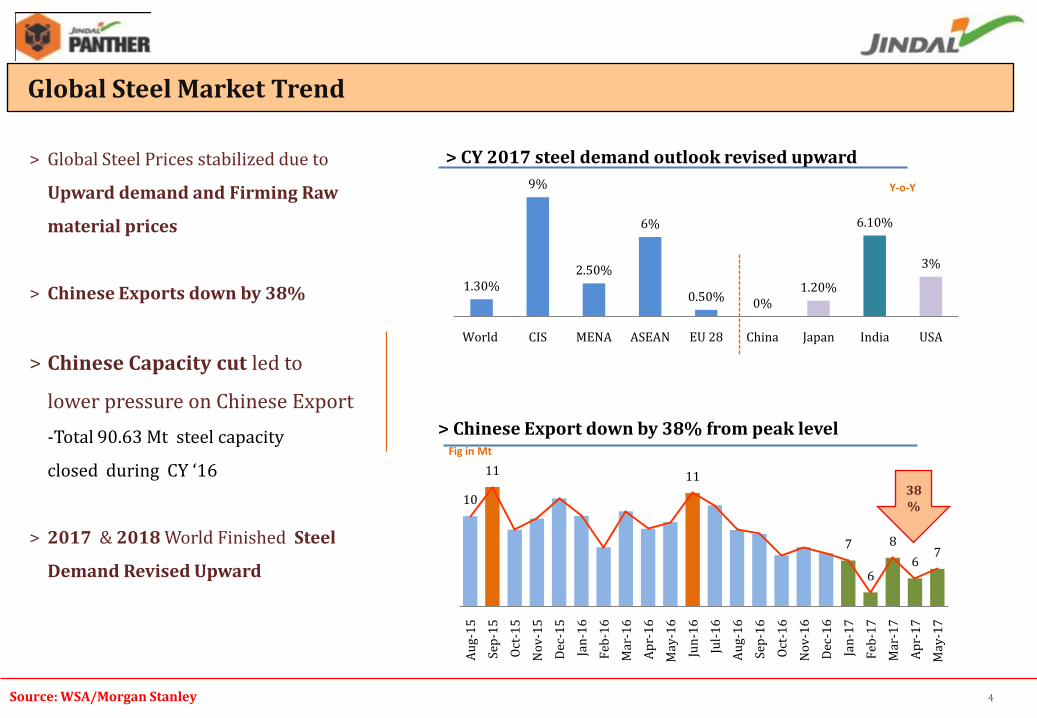
Global Steel Market Trend
10
11 11
7
6
8
67
Au
g-1
5
Sep
-15
Oct
-15
No
v-1
5
Dec
-15
Jan
-16
Feb
-16
Mar
-16
Ap
r-1
6
May
-16
Jun
-16
Jul-
16
Au
g-1
6
Sep
-16
Oct
-16
No
v-1
6
Dec
-16
Jan
-17
Feb
-17
Mar
-17
Ap
r-1
7
May
-17
> Chinese Export down by 38% from peak level Fig in Mt
1.30%
9%
2.50%
6%
0.50%0%
1.20%
6.10%
3%
World CIS MENA ASEAN EU 28 China Japan India USA
> CY 2017 steel demand outlook revised upward
Y-o-Y
> Global Steel Prices stabilized due to
Upward demand and Firming Raw
material prices
> Chinese Exports down by 38%
> Chinese Capacity cut led to
lower pressure on Chinese Export
-Total 90.63 Mt steel capacity
closed during CY ‘16
> 2017 & 2018 World Finished Steel
Demand Revised Upward
38%
Source: WSA/Morgan Stanley 4

Source: WSA 5
799
808
105.1
104.8
89
96
1615
1629
0.8 % 800
836
4.5 %
401
420
4.6 %
52
52
0.5 %
47
49
World Crude Steel Production firmed up led by higher output from major producers
CY ‘15
No #1 China
No #2 Japan
No #3 India
CY ‘16
0.3%
7.4 %
6 Month CY ‘16 6 Month CY ‘17
5.3 %
World
1.2 %

6
Steel industry’s contribution to
National GDP
Nearly 2%
Steel Industry’s contribution to
Index of Industrial Production (IIP)
6.68%
Employment by the steel industry
Over 7lakh direct
Current Market value of the Indian
Steel Industry
$75 bn
Total Investment
expected till 2025-
2030
$187 Bn
India’s per capita steel consumption is expected to increase to 158 Kg in 2031 from current 61 Kg
> Indian steel industry continues to capitalize on its competencies to invest further.
Domestic Steel Industry continues to grow and play major role in Nation Building
116144
300
FY '16 FY '20e FY '31 (GoI Vision)
Crude Steel Capacity Projection
81.5
230
FY '16 FY '31e
Finished Steel Consumption
In Million MT (Mt)
Source: WSA

Source: JPC 7
Q1 FY ‘18 : Other Highlights
> Crude Production of Primary Producers grew by 6.4%, while the crude production of Other Producers grew by 0.1% only.
> Finished Steel Demand : o Over all Steel consumption of finished steel grew by 4.6%o Finished Carbon Steel Consumption grew by 5.7%, While Finished Alloy Steel Consumption
Decreased by 5.7%
Indian Steel Scenario : Q1 FY ’18 Major Highlights
(Qty : Mt) FY ‘17 Q1 FY ‘18
Domestic Steel Industry Qtychange
Qtychange
(y-o-y) (y-o-y)
Crude Steel Production 97.4 8.50% 24.56 3.5%
Finished Steel (Non Alloy+Alloy)
Import 7.23 -38% 1.71 -7%
Export 8.25 102% 2.04 66%
Real Consumption (Demand) 83.65 2.60% 21.0 4.6%

OUTLOOK
Q1 FY’18
INDUSTRYDEVELOPMENTS
BRIEF BACKGROUND OPERATIONALPERFORMANCE
PRESENTATION OUTLINE
8
INDUSTRY UPDATESTEEL SECTOR
9

Source: Steel Mint 10
Finished steel price trend
475485
500
445 440
470
505515
03
/Ap
r/1
7
10
/Ap
r/1
7
17
/Ap
r/1
7
24
/Ap
r/1
7
01
/May
/17
08
/May
/17
15
/May
/17
22
/May
/17
29
/May
/17
05
/Ju
n/1
7
12
/Ju
n/1
7
19
/Ju
n/1
7
26
/Ju
n/1
7
03
/Ju
l/1
7
10
/Ju
l/1
7
17
/Ju
l/1
7
24
/Ju
l/1
7
31
/Ju
l/1
7
07
/Au
g/1
7
International Flat Steel Prices ($/MT- FOB China)
Plate FOB China
445
453
450
483
03
/Ap
r/1
7
10
/Ap
r/1
7
17
/Ap
r/1
7
24
/Ap
r/1
7
01
/May
/17
08
/May
/17
15
/May
/17
22
/May
/17
29
/May
/17
05
/Ju
n/1
7
12
/Ju
n/1
7
19
/Ju
n/1
7
26
/Ju
n/1
7
03
/Ju
l/1
7
10
/Ju
l/1
7
17
/Ju
l/1
7
24
/Ju
l/1
7
31
/Ju
l/1
7
07
/Au
g/1
7
International Long Steel Prices ($/MT- FOB China)
Rebar FOB China Wire Rod FOB China
Source: Platts 11
707067
63
5557
6161
6769
7981
9188
9493
8383
7978
103103102
94
858384
80
85
88
101102
114110
114117
110110
104105
28
Ju
ly '1
7
28
Ju
ly '1
7
17
Ju
ly '1
7
30
Ju
ne
'17
15
Ju
ne
'17
31
May
'17
15
May
'17
5 M
ay '1
7
28
Ap
ril '
17
13
Ap
ril '
17
4 A
pri
l '1
7
29
Mar
'17
20
Mar
'17
7 M
ar '1
7
28
Feb
'17
14
Feb
'17
1 F
eb '1
7
26
Jan
'17
10
Jan
'17
3 J
an '1
7
Iron Ore CNF China Pellets (65%) CFR China
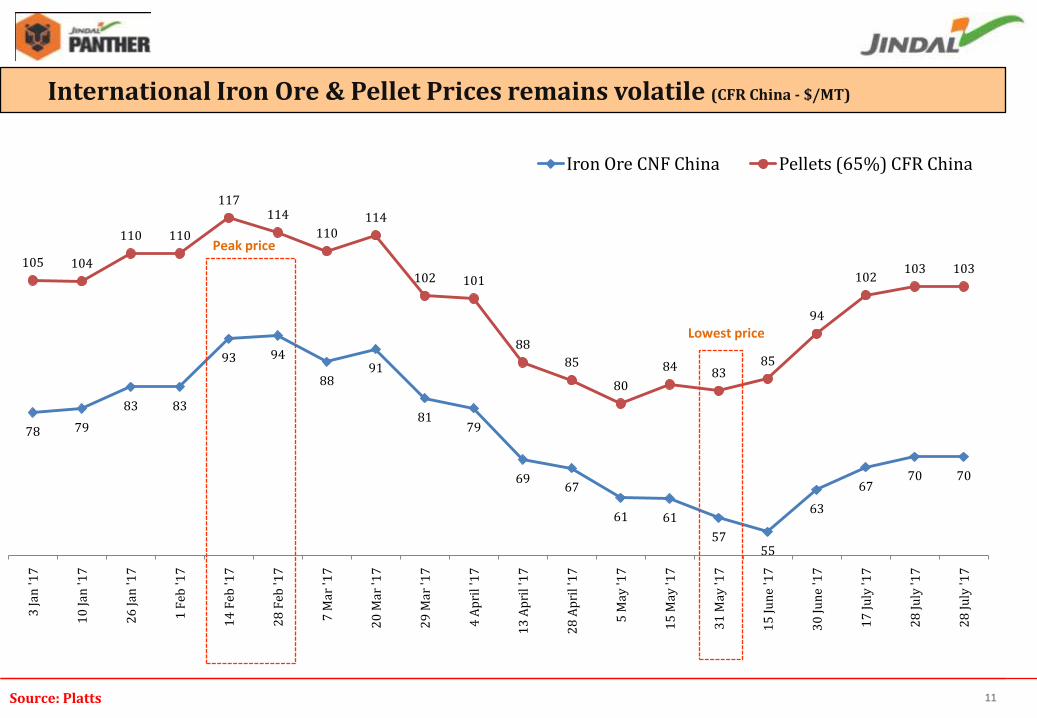
Lowest price
International Iron Ore & Pellet Prices remains volatile (CFR China - $/MT)
Peak price
Source: Platts, Argus 12
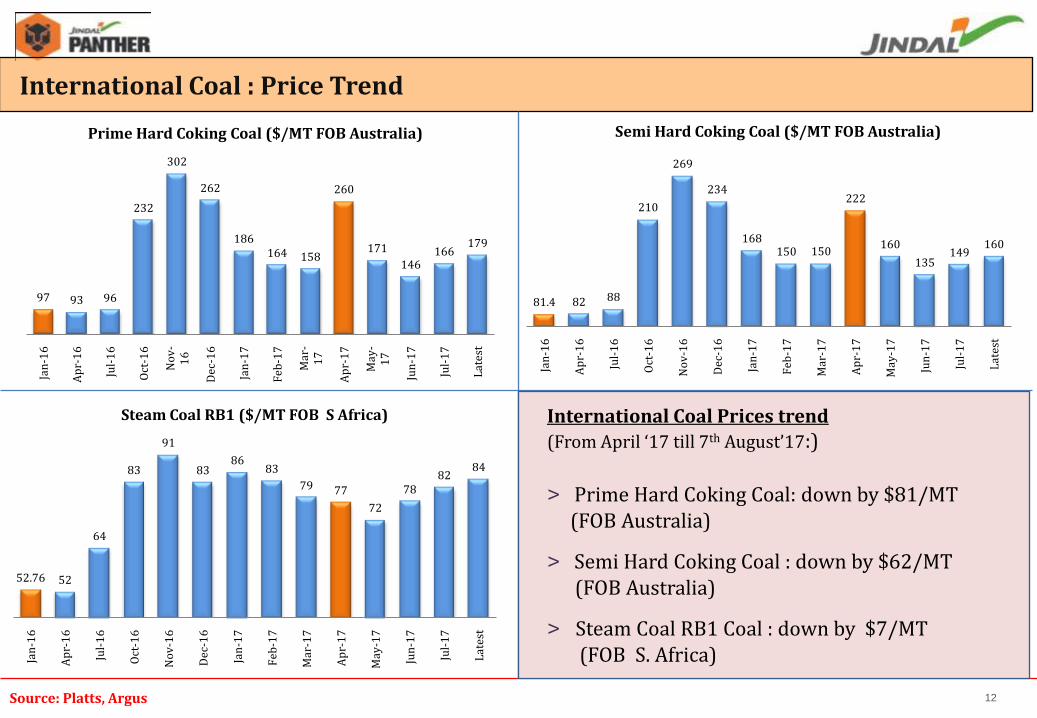
International Coal : Price Trend
International Coal Prices trend
(From April ‘17 till 7th August’17:)
> Prime Hard Coking Coal: down by $81/MT (FOB Australia)
> Semi Hard Coking Coal : down by $62/MT (FOB Australia)
> Steam Coal RB1 Coal : down by $7/MT (FOB S. Africa)
97 93 96
232
302
262
186164 158
260
171
146166
179
Jan
-16
Ap
r-1
6
Jul-
16
Oct
-16
No
v-
16
Dec
-16
Jan
-17
Feb
-17
Mar
-1
7
Ap
r-1
7
May
-1
7
Jun
-17
Jul-
17
Lat
est
Prime Hard Coking Coal ($/MT FOB Australia)
81.4 82 88
210
269
234
168150 150
222
160
135149
160
Jan
-16
Ap
r-1
6
Jul-
16
Oct
-16
No
v-1
6
Dec
-16
Jan
-17
Feb
-17
Mar
-17
Ap
r-1
7
May
-17
Jun
-17
Jul-
17
Lat
est
Semi Hard Coking Coal ($/MT FOB Australia)
52.76 52
64
83
91
8386
83
79 77
72
7882
84
Jan
-16
Ap
r-1
6
Jul-
16
Oct
-16
No
v-1
6
Dec
-16
Jan
-17
Feb
-17
Mar
-17
Ap
r-1
7
May
-17
Jun
-17
Jul-
17
Lat
est
Steam Coal RB1 ($/MT FOB S Africa)

INDUSTRY UPDATEPOWER SECTOR
13

Source: CEA 14
148161
174200
224245
272298
327 330
Mar'09 Mar'10 Mar'11 Mar'12 Mar'13 Mar'14 Mar'15 Mar'16 Mar'17 June'17
220.5
6.8
44.658.3
330.2
Thermal Nuclear Hydro Renewables Total
Installed Capacity (GW) in India
3.4 GW addition in Q1 FY18
Thermal67%
Nuclear2%
Hydro14%
Renewables17%
Wind 32.5
Solar 13.1
Bio Mass 8.2 Small Hydro 4.4
Renewables (GW) Portfolio
Installed Capacity Portfolio
Installed Capacity in India (June 2017)
Installed Capacity (GW) Growth

37
8095 96
307
37
7995 95
305
0.5%0.7%
0.1%
1.5%
0.7%
-1.0%
-0.5%
0.0%
0.5%
1.0%
1.5%
2.0%
0
50
100
150
200
250
300
ER & NE SR WR NR All IndiaRequirement Availability Deficit
Demand-Supply Scenario
Power Demand-Supply Position Q1 FY18 (BUs)
65
123146 153
488
64
122146 151
483
1.2%
0.8%0.4%
1.8%
1.0%
-1.0%
-0.5%
0.0%
0.5%
1.0%
1.5%
2.0%
0
50
100
150
200
250
ER & NE SR WR NR All India
Requirement Availability Deficit
Peak Demand & Peak Met in Q1 FY18 (GW)
All India power demand increased by 4.2% Y-o-Y in Q1 FY18 while supply improved by 4.3% Y-o-Y in Q1 FY18
All India demand-supply gap was 2.25 billion Units in Q1 FY18 and peak deficit during Q1 FY18 was 5 GW.
Source: CEA 15

OUTLOOK
Q1’FY18
INDUSTRYDEVELOPMENTS
BRIEF BACKGROUND
PRESENTATION OUTLINE
OPERATIONALPERFORMANCE
16
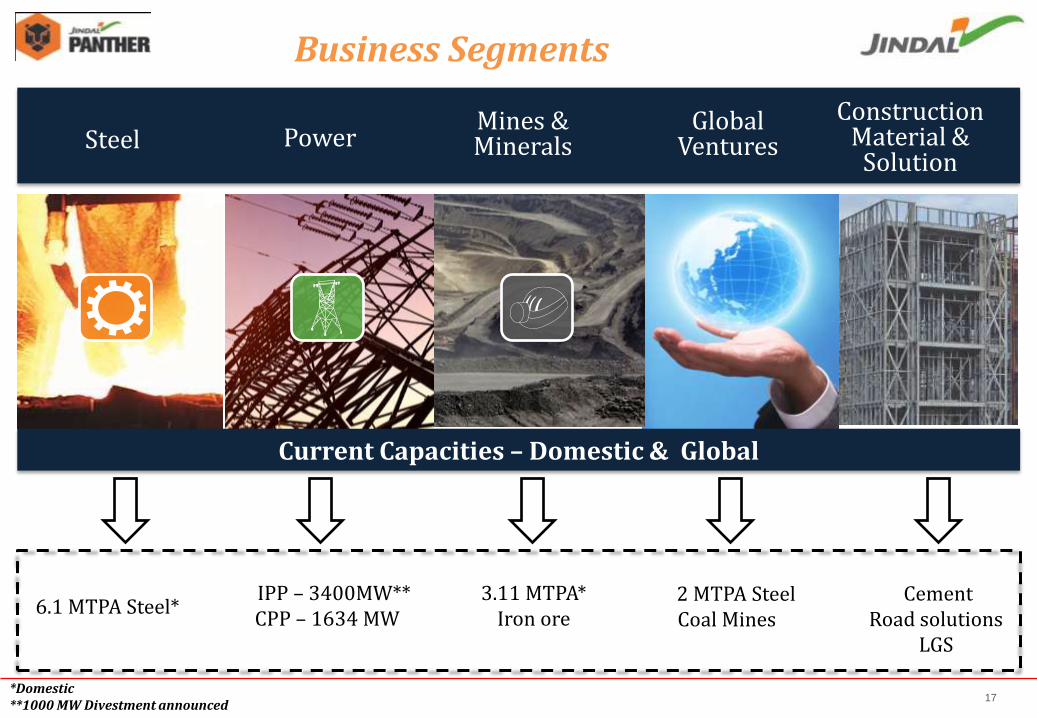
Steel PowerMines & Minerals
Global Ventures
Current Capacities – Domestic & Global
Business Segments
*Domestic**1000 MW Divestment announced
Construction Material &
Solution
6.1 MTPA Steel* 3.11 MTPA*
Iron ore IPP – 3400MW**CPP – 1634 MW
2 MTPA SteelCoal Mines
CementRoad solutions
LGS
17

Capacity in deail
Iron Making
(9.95 MTPA)
BF 5.33 MTPA
DRI 3.12 MTPA
HBI 1.50 MTPA
Liquid Steel
(8.10 MTPA)
SMS 8.10 MTPA
Finished Steel
(6.55 MTPA)
WRM 0.60 MTPA
RUBM 0.75 MTPA
MLSM 0.60 MTPA
Plate Mill 2.20 MTPA
BRM 2.4 MTPA
Steel Capacities across Life Cycle
*BoF in Angul 2.5 MTPA - To be commissioned*BRM in Angul 1.4 MTPA - To be commissioned
18

Capacity in deail
Raigarh(Chhattisgarh)
SMS 3.6MTPA
BF 2.125 MTPA
DRI 1.32 MTPA
Plate Mill 1.00 MTPA
RUBM 0.75 MTPA
MLSM 0.60 MTPA
CPP 824 MW
Angul
(Odisha)
SMS 2.5 MTPA
*SMS 2.5 MTPA
DRI 1.8 MTPA
BF 3.2 MTPA
CGP 225,000 Nm3/Hr
Plate Mill 1.2 MTPA
*BRM 1.4 MTPA
CPP 810 MW
Barbil
(Odisha)
Pellet Plant
9 MTPA
Patratu (Jharkhand)
WRM 0.60
MTPA
BRM 1.0 MTPA
Oman
SMS 2.0 MTPA
HBI 1.5 MTPA
BRM 1.4 MTPA
JPL
Tamnar 3400 MW
Mining
Iron Ore 3.11
MTPA
Coal Overseas
6.60 MTPA
Detailed plant wise capacities
Power Hot Metal Liquid Steel Finished Steel
*To be commissioned
19

Standalone Q1 FY 18 –Snapshot of Key Financials (Figures in Rs. Crores)
Particulars Q1FY18 Q1FY17 Q4FY17 %YoY %QoQ
Total Revenue 3,832 3,562 4,554 +8% -16%
EBITDA 750 659 928 +14% -19%
EBITDA % 20% 19% 20%
Depreciation 481 489 489 -2% -2%
Finance Cost 532 601 529 -11% +1%
Profit/(Loss) Before Tax (263) (431) (81) +39% -224%
Profit/(Loss) After Tax (178) (277) (116) +36% -53%
Cash Profit 218 58 408 +276% -47%
20

Angul
Tamnar
RaigarhCaptive power projects (within JSPL)
ProjectCapacity
(MW)Fuel Configuration Status
DCPP, Raigarh 540 Coal 4x135 MW Operational
JSPL, Raigarh 284Coal & waste heat
2x25 MW & 40 MW(Waste heat)
2x55 MW 3x25 MW
Operational
Angul, Odisha 810 Coal 6 x135 MW Operational
Independent Power Projects (IPP)
ProjectCapacity
(MW)Fuel Configuration Status
Tamnar 1* 1,000 Coal 4x250 MW Operational
Tamnar 2 2,400 Coal 4x600 MW Operational
IPP CPP
One of the largest thermal portfolios in India
JSPL - Power Capacities
*Divestment announced 21

96.43% subsidiary of JSPL
JINDAL POWER LIMITED
EUP -I1000MW (4 X 250)
EUP -II1200MW (2 X 600)
EUP -III1200MW (2 X 600)
22

Project Buyer Type
Period Quantum (MW)From To
Tamnar II
(Phase 1)Tamil Nadu
Long Term Feb-14 Sep-28 400
Tamnar I Medium Term Sep-12 Aug-17 200
Tamnar II
(Phase 1)KSEB
Long Term Jun-16 May-41 200
Tamnar II
(Phase 1)Long Term Oct-17 Sep-42 150
Tamnar II
(Phase 1)Chhattisgarh
Long Term After commercial operation of Unit and for complete life
of plant
60
Tamnar II
(Phase 2)Long Term 60
PPA Arrangements
Over 30% of total capacity tied up *
* Out of 3400 MW (IPP) 23

Tamnar-I, 1,000 MW (EUP I)
In the interim, coal sourced through – market purchase and e-auction
Bilateral/short term/merchant
TNEB – 200 MW
258km transmission line from plant to national grid
Tamnar-II - 1,200 MW (EUP II)
Long term linkage from Mahanadi Coal Limited (MCL) and South Eastern Coalfields Limited (SECL)
TNEB – 400MW
CSEB – 60MW
KSEB – 200MW
KSEB – 150MW
Open access available
Tamnar-II - 1,200 MW (EUP III)
Market purchase and e-auction
CSEB – 60MW
Open access to be finalised against PPAs
FSA
PPA
Evacuation
Raw materials, transmission & PPAs in place for achieving higher PLF
Key Contractual Arrangements for JPL
24
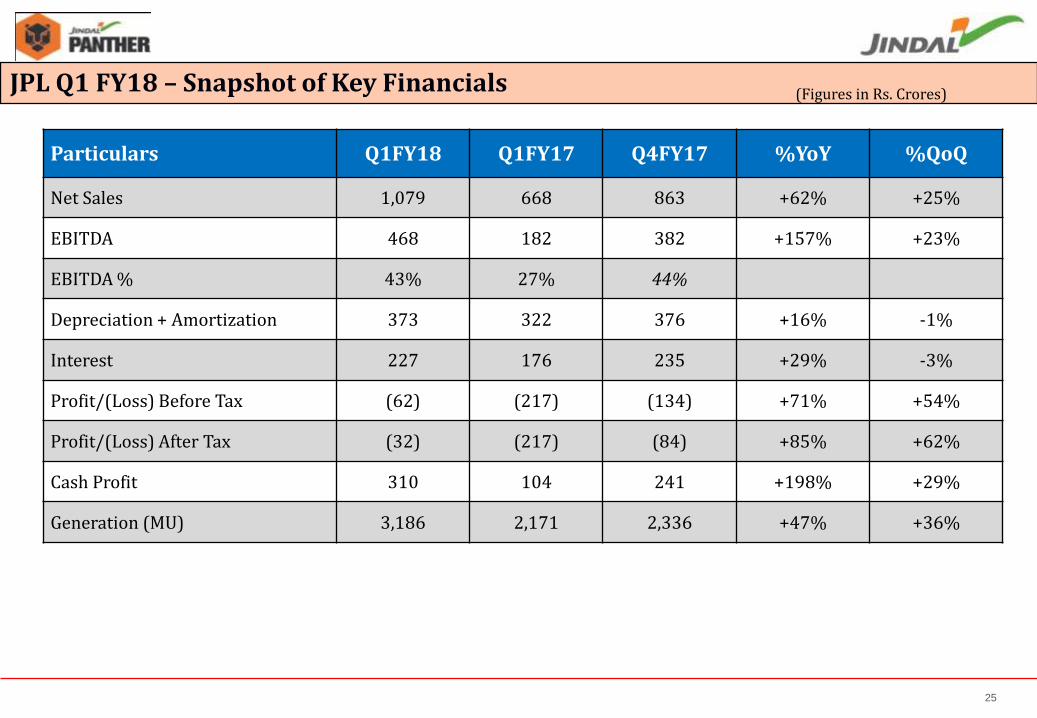
JPL Q1 FY18 – Snapshot of Key Financials (Figures in Rs. Crores)
Particulars Q1FY18 Q1FY17 Q4FY17 %YoY %QoQ
Net Sales 1,079 668 863 +62% +25%
EBITDA 468 182 382 +157% +23%
EBITDA % 43% 27% 44%
Depreciation + Amortization 373 322 376 +16% -1%
Interest 227 176 235 +29% -3%
Profit/(Loss) Before Tax (62) (217) (134) +71% +54%
Profit/(Loss) After Tax (32) (217) (84) +85% +62%
Cash Profit 310 104 241 +198% +29%
Generation (MU) 3,186 2,171 2,336 +47% +36%
25

Developing a 3 MTPA coal
mine in Mozambique’s coal-
rich Moatize region
Mozambique, Africa
JSPL’s Kiepersol Colliery produces Anthracite
coal, sold domestically and internationally.
South Africa, Africa Acquired 60.3% stake in
Wollongong Coal
Australia
1.5 MT HBI , 2 MT SMS Plant &
1.4MTPA Rebar Mill – an
Integrated Steel Plant
Shadeed, Oman
Summary of International Operations
26

Oman
Holding structure for global operations
Jindal Steel & Power Ltd
Listed Operating Entity in India
Australia
Coking Coal
South Africa
Anthracite Coal
Mozambique
Thermal/ Coking Coal
Jindal Steel & Power (Mauritius) Ltd
Holding company for overseas business
2 MTPA Steel plant
27

Consolidated Q1 FY 18 –Snapshot of Key Financials
Particulars Q1FY18 Q1FY17 Q4FY17 %YoY %QoQ
Total Revenue 6,127 5,125 6,765 +20% -9%
EBITDA 1,353 1,015 1,569 +33% -14%
EBITDA % 22% 20% 23%
Depreciation 962 917 1,006 +5% -4%
Finance Cost 901 853 881 +6% +2%
Profit/(Loss) Before Tax (510) (1,381) (56) +63% -817%
Profit/(Loss) After Tax (421) (1,240) (98) +66% -328%
Cash Profit 453 (463) 950 +198% -52%
(Figures in Rs. Crores)
28
OUTLOOK
Q1 FY’18
INDUSTRYDEVELOPMENTS
BRIEF BACKGROUND
PRESENTATION OUTLINE
OPERATIONALPERFORMANCE
29

Performance highlights
India’s largest Blast Furnace commissioned at Angul.
JSPL’s Standalone EBITDA increased by 14% Y-o-Y for Q1FY18
JSPL’s Consolidated Steel Production for Q1FY18 was 1.26 Million Tonne up 6% YoY (1.19 Million Tonne in Q1FY17)
JSPL’s Consolidated EBITDA increased by 33% Y-o-Y for Q1FY18
Oman records highest ever quarterly rebar production and sales in 1QFY18
JPL increased its EBITDA by 157% Y-o-Y and 23% Q-o-Q in Q1FY18
30
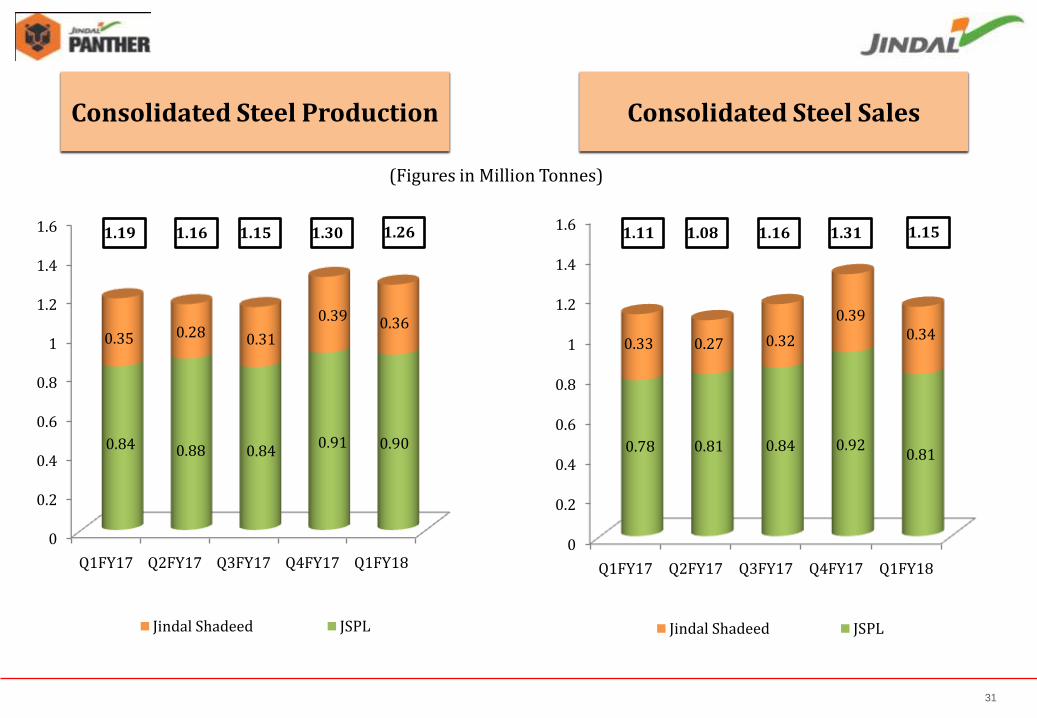
0
0.2
0.4
0.6
0.8
1
1.2
1.4
1.6
Q1FY17 Q2FY17 Q3FY17 Q4FY17 Q1FY18
0.84 0.88 0.840.91 0.90
0.35 0.28 0.31
0.39 0.36
Jindal Shadeed JSPL
1.301.19 1.16 1.15
Consolidated Steel Production
(Figures in Million Tonnes)
1.26
Consolidated Steel Sales
0
0.2
0.4
0.6
0.8
1
1.2
1.4
1.6
Q1FY17 Q2FY17 Q3FY17 Q4FY17 Q1FY18
0.78 0.81 0.84 0.920.81
0.33 0.27 0.32
0.390.34
Jindal Shadeed JSPL
1.311.11 1.08 1.16 1.15
31

Key Customers & Adding…
32

India’s largest Blast Furnace
33

For any information please contact: -
Mr. Nishant Baranwal – Head, Investor RelationsTel : +91 11-41462198Mobile:+91 8800690255Email: - [email protected]
Ms. Shweta Bagaria – Assistant Manager, Investor RelationsTel: +91-124-6612073Mobile: +91 95995 53717Email: [email protected]
34
THANK YOU
35