q1 fy 2014 earnings presentation august 13, 2013
TRANSCRIPT

www.vivimedlabs.com © Vivimed Labs Ltd 2010 All rights reserved
1
Vivimed Labs Limited Q1 FY 2014 Earnings Presentation
August 13, 2013
2
Disclaimer
No representation or warranty, express or implied, is made as to, and no reliance should be placed on, the fairness, accuracy,
completeness or correctness of the information or opinions contained in this presentation. Such information and opinions are in all
events not current after the date of this presentation. Certain statements made in this presentation may not be based on historical
information or facts and may be "forward looking statements" based on the currently held beliefs and assumptions of the
management of Vivimed Labs Limited (“Company” or “Vivimed”), which are expressed in good faith and in their opinion reasonable,
including those relating to the Company’s general business plans and strategy, its future financial condition and growth prospects
and future developments in its industry and its competitive and regulatory environment.
Forward-looking statements involve known and unknown risks, uncertainties and other factors, which may cause the actual results,
financial condition, performance or achievements of the Company or industry results to differ materially from the results, financial
condition, performance or achievements expressed or implied by such forward-looking statements, including future changes or
developments in the Company’s business, its competitive environment and political, economic, legal and social conditions. Further,
past performance is not necessarily indicative of future results. Given these risks, uncertainties and other factors, viewers of this
presentation are cautioned not to place undue reliance on these forward-looking statements. The Company disclaims any
obligation to update these forward-looking statements to reflect future events or developments.
This presentation is for general information purposes only, without regard to any specific objectives, financial situations or
informational needs of any particular person. This presentation does not constitute an offer or invitation to purchase or subscribe for
any securities in any jurisdiction, including the United States. No part of it should form the basis of or be relied upon in connection
with any investment decision or any contract or commitment to purchase or subscribe for any securities. None of our securities may
be offered or sold in the United States, without registration under the U.S. Securities Act of 1933, as amended, or pursuant to an
exemption from registration there from.
This presentation is confidential and may not be copied or disseminated, in whole or in part, and in any manner.

3
Where Chemistry and Quality Matters
Robust Financial Performance
Best-in-Class Operations Unique Business Model
Attractive Industry Dynamics
• 12 manufacturing facilities and 5 R&D
centers across the world
• 4 US FDA approved sites
• Healthcare revenues: Regulated markets
85% and Semi Regulated markets 15%
• High entry barriers: Long standing customer
relationships and in house knowledge base
• Flexible manufacturing across API and
Active Ingredients
• Uses chemistry to create ingredients which
touch human life on a daily basis
• Focused on the Health Care, Personal Care,
Home Care and Industrial segments globally
• Multiple manufacturing and R&D centers
provides efficient platforms in India across
business segments
• Product portfolio caters to over 75% of the
personal care ingredient market
• Combination of stable margin and high growth
global businesses
• Global API sales is expected to grow at a
CAGR of 5.9% from 2010 to 2015
• Drugs with global market size of $224bn to
go off-patent by 2015 driving generic sales
• Indian pharmaceutical industry to reach
$20bn in 2015, a CAGR of 12.3%
• Global personal care ingredient market to
grow to $15bn by 2015 and India to $800mn
• 5-year Net Sales CAGR of 42% and Net
Profit CAGR of 44%
• Revenues: India 35%, RoW 65%
• R&D investments: 3%of Revenues
• Short-term bank facilities rated A2+ and long
term facilities rated A- by CARE Ratings
• Strong transnational management team with
proven track record of delivering growth &
profitability

4
Business Segments
Healthcare 71% of Q1 FY14 sales
Personal Care 17% of Q1 FY14 sales
Home Care 9% of Q1 FY14 sales
Industrials 3% of Q1 FY14 sales
• Active
Pharmaceutical
Ingredients (API)
• Finished Dosage
Formulations
(FDF)
• Antimicrobials
• Specialty
Intermediates
• Preservatives
• Photo Chromic
Dyes
• Imaging Chemicals
• Sun Care
• Skin Care
• Hair Care
• Oral Care
• Naturals
71.4%
16.7%
9.3%2.6%
Healthcare Personal Care
Home Care Industrials
5
Consolidated Financial Performance
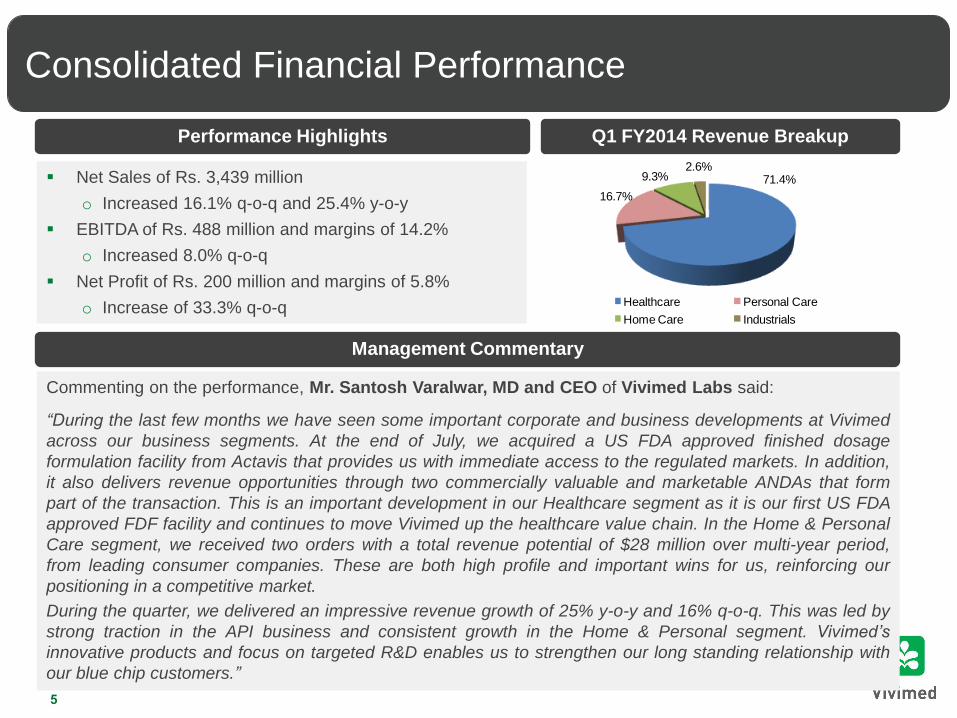
Net Sales of Rs. 3,439 million
o Increased 16.1% q-o-q and 25.4% y-o-y
EBITDA of Rs. 488 million and margins of 14.2%
o Increased 8.0% q-o-q
Net Profit of Rs. 200 million and margins of 5.8%
o Increase of 33.3% q-o-q
Management Commentary
Performance Highlights
Commenting on the performance, Mr. Santosh Varalwar, MD and CEO of Vivimed Labs said:
“During the last few months we have seen some important corporate and business developments at Vivimed
across our business segments. At the end of July, we acquired a US FDA approved finished dosage
formulation facility from Actavis that provides us with immediate access to the regulated markets. In addition,
it also delivers revenue opportunities through two commercially valuable and marketable ANDAs that form
part of the transaction. This is an important development in our Healthcare segment as it is our first US FDA
approved FDF facility and continues to move Vivimed up the healthcare value chain. In the Home & Personal
Care segment, we received two orders with a total revenue potential of $28 million over multi-year period,
from leading consumer companies. These are both high profile and important wins for us, reinforcing our
positioning in a competitive market.
During the quarter, we delivered an impressive revenue growth of 25% y-o-y and 16% q-o-q. This was led by
strong traction in the API business and consistent growth in the Home & Personal segment. Vivimed’s
innovative products and focus on targeted R&D enables us to strengthen our long standing relationship with
our blue chip customers.”
Q1 FY2014 Revenue Breakup

6
Financial Performance
6
Consolidated Financials
Key Observations
• Net Sales in Q1 FY2014 increased due to strong traction in the API business and consistent
growth trend in the Specialty Chemicals business which helped offset the subdued performance
of the Branded FDF business
• EBITDA margins were primarily impacted by a negative WIP charge in the API business and
lower utilization levels in the domestic FDF business; normalized for the WIP charge
consolidated EBITDA margins would have increased sequentially
• Finance costs have stabilized after the one-off reduction seen in Q4 FY2013
• Net Profit margins improved sequentially as tax rates normalized in Q1 FY2014
y-o-y Q4 q-o-q
(Rs. million) FY2014 FY2013 Growth (%) FY2013 Growth (%)
Net Sales 3,439 2,743 25.4% 2,961 16.1%
EBITDA 488 619 (21.2)% 452 8.0%
Margin (%) 14.2% 22.6% 15.3%
Net Profit 200 261 (23.5)% 150 33.3%
Margin (%) 5.8% 9.5% 5.1%
Basic EPS (Rs.) 12.44 18.75 (33.6)% 9.33 33.4%
Note: Net Sales includes Other Operating Income
Q1

44.6%
1.0%
53.1%
1.2%
Skin care Oral care Hair care Others
80.8%
15.7%3.4%
API Contract FDF Branded FDF
7
Segment Highlights
Q1 FY14 Revenue:
Rs. 2,458 mn Healthcare Segment
• Revenue growth driven by the API business – ramp up of a key
CMO account and better client penetration
• Process improvements, new product development and efficient
procurement to remain key focus areas for enhancing segment
profitability in the API business
• Utilization rates in the Domestic FDF business impacted by
prolonged wait for regulatory audits from the CIS markets and
impact of regulatory ban on a portfolio product
• The recent acquisition of a US FDA approved FDF to provide
immediate access to regulated markets; immediate revenue
opportunity with two ANDAs
Personal Care Segment
• Skin Care: Healthy traction across existing customers with
increase in off-take and cross selling of newer variants
• Hair Care: Approval of a new product underway in Middle East
markets; Increased sales with existing customers in Europe with
new set of products
• Sun Care: New opportunity tapped in APAC geography for a
leading product. Other product extensions seeing an increase in
user base in LatAm and Europe
• Two high profile order wins with significant revenue potential of
~$28 million over a period of 24 months in the sun care and hair
care segments
Q1 FY14 Revenue:
Rs. 574 mn

57.0%31.1%
11.8%
Photo chromic dyes Imaging chemicals
Other chemicals
54.3%
45.3%
0.4%
Antimicrobials Speciality intermediates Others
8
Segment Highlights
Q1 FY14 Revenue:
Rs. 320 mn Home Care Segment
• Cross selling efforts across existing customer in multiple
geographies resulting in growth for Antimicrobial segment
• Specialty intermediates growth trajectory remains stable
Industrials Segment
• Photo Chromic business continues to face challenges based on
technological access
• Focus is to fix process and on newer geographies across Photo
Chromics and Imaging chemicals
Q1 FY14 Revenue:
Rs. 89 mn

9
Recent acquisition of a US FDA approved FDF facility will provide immediate access to the regulated markets
Acquisition of APMPL SOD
• US FDA approved facility with 1.2 billion SOD per annum manufacturing capacity
• Immediate access to regulated market such as USA, the largest generics market in the world
• Eliminates three to four years of lead time, which is required to build a green field project of this quality and getting the regulatory approvals
Immediate Access to the Regulated Markets
• Two commercially valuable and marketable ANDAs acquired with the facility
• ANDAs acquired include Losartan with a market size of $3.2 billion and Donepezil with a market size of $2.2 billion
• Actavis to provide a manufacturing contract for a set of products over a defined period
Immediate Revenue Streams
• Opportunities which could emerge over the longer term include Actavis’ potential use of Vivimed’s existing API manufacturing platform
• Being considered for any future ANDA divestments by Actavis
Strengthening Relationship with Actavis for Future Association
• Adding to forward integration synergies for Vivimed’s existing API business
• Vivimed to develop its own formulation dossiers and start building a filing pipeline with Actavis facility as the manufacturing site
Completing the Value Chain
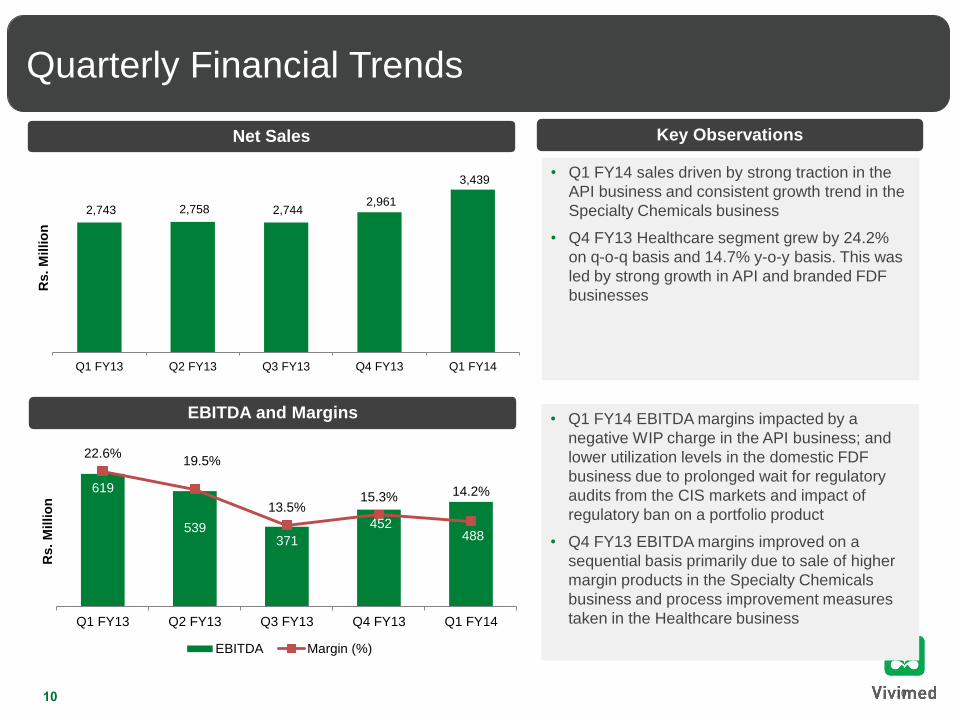
• Q1 FY14 sales driven by strong traction in the
API business and consistent growth trend in the
Specialty Chemicals business
• Q4 FY13 Healthcare segment grew by 24.2%
on q-o-q basis and 14.7% y-o-y basis. This was
led by strong growth in API and branded FDF
businesses
10
Key Observations Net Sales
EBITDA and Margins
Quarterly Financial Trends
10
• Q1 FY14 EBITDA margins impacted by a
negative WIP charge in the API business; and
lower utilization levels in the domestic FDF
business due to prolonged wait for regulatory
audits from the CIS markets and impact of
regulatory ban on a portfolio product
• Q4 FY13 EBITDA margins improved on a
sequential basis primarily due to sale of higher
margin products in the Specialty Chemicals
business and process improvement measures
taken in the Healthcare business
619
539371
452 488
22.6% 19.5%
13.5% 15.3% 14.2%
Q1 FY13 Q2 FY13 Q3 FY13 Q4 FY13 Q1 FY14
Rs.
Millio
n
EBITDA Margin (%)
2,743 2,758 2,744 2,961
3,439
Q1 FY13 Q2 FY13 Q3 FY13 Q4 FY13 Q1 FY14
Rs
. M
illio
n
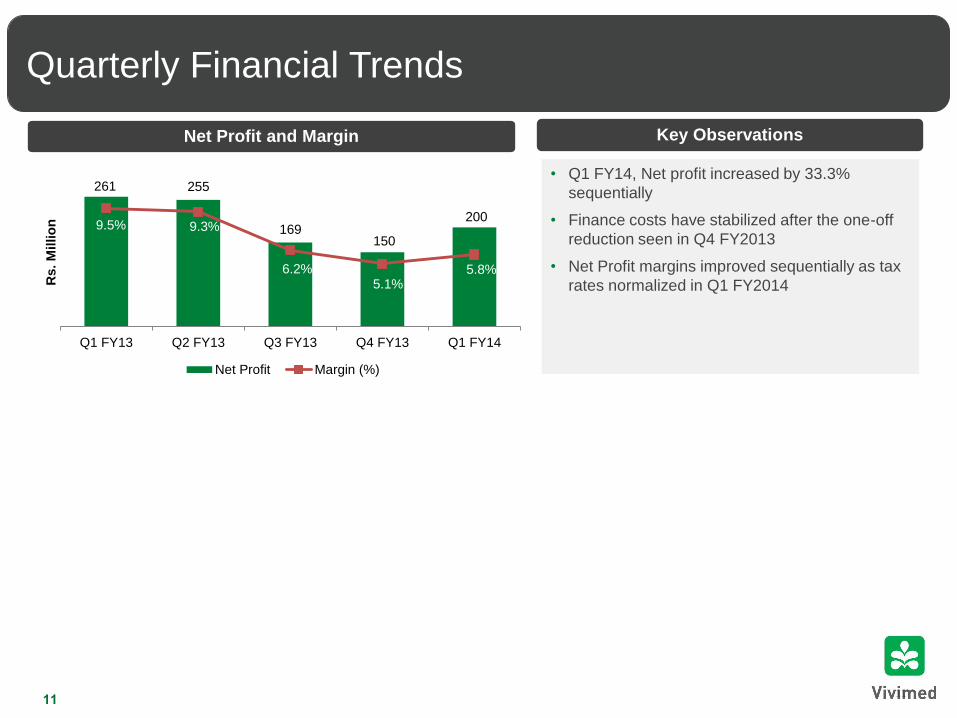
• Q1 FY14, Net profit increased by 33.3%
sequentially
• Finance costs have stabilized after the one-off
reduction seen in Q4 FY2013
• Net Profit margins improved sequentially as tax
rates normalized in Q1 FY2014
11
Net Profit and Margin
Quarterly Financial Trends
11
Key Observations
261 255
169150
200 9.5% 9.3%
6.2% 5.1%
5.8%
Q1 FY13 Q2 FY13 Q3 FY13 Q4 FY13 Q1 FY14
Rs.
Millio
n
Net Profit Margin (%)

12
Capital Markets
39.8%
27.4%
2.5%
30.3%
Promoters FII DII Others
Note:
1 In Q4 FY2013, Jacob Ballas converted its convertible preference shares resulting in dilution of Promoters’ stake
Shareholding Structure Key Institutional Investors
Shareholding Pattern Trend
Shareholders Sep-12 Dec-12 Mar-13 Jun-13
Promoters1 45.2% 45.2% 39.7% 39.8%
FII / FDI 17.2% 16.4% 27.5% 27.4%
DII 0.4% 0.3% 0.3% 2.5%
Others 37.2% 38.1% 32.5% 30.3%
Total 100.0% 100.0% 100.0% 100.0%
13
Wh
ere
Ch
em
istr
y a
nd
Qu
ality
Ma
tte
rs
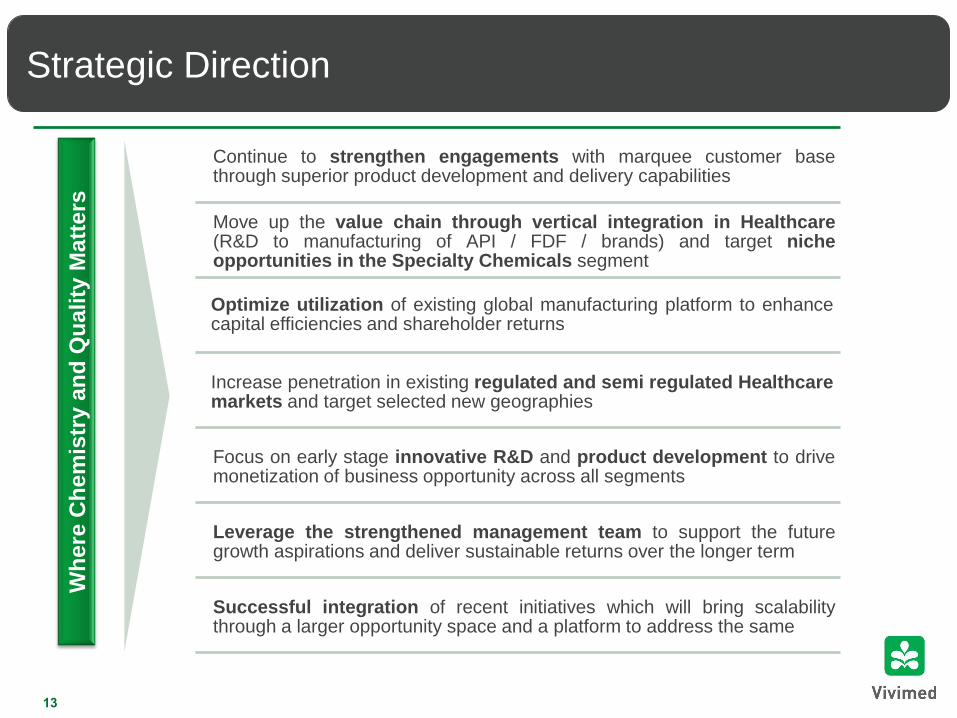
Strategic Direction
Continue to strengthen engagements with marquee customer base through superior product development and delivery capabilities
Move up the value chain through vertical integration in Healthcare (R&D to manufacturing of API / FDF / brands) and target niche opportunities in the Specialty Chemicals segment
Optimize utilization of existing global manufacturing platform to enhance capital efficiencies and shareholder returns
Increase penetration in existing regulated and semi regulated Healthcare markets and target selected new geographies
Focus on early stage innovative R&D and product development to drive monetization of business opportunity across all segments
Leverage the strengthened management team to support the future growth aspirations and deliver sustainable returns over the longer term
Successful integration of recent initiatives which will bring scalability through a larger opportunity space and a platform to address the same

14
Global Reach
A multinational global platform that provides Vivimed access to markets and significant cost advantage
Facilities Mexico Spain UK China USA India Total
Healthcare – API 1 2 3
Healthcare – FDF 7 7
Active Ingredients 2 2
Total Facilities 1 2 9 12
R&D Facilities 1 1 3 5
Global Support Offices 1 1 1 1 1 5
Sant Celoni, Spain Lliçà de Vall, Spain
Cuernavaca, Mexico
Kashipur, Uttarakhand Haridwar, Uttarakhand
Kolkata
Bolarum, Hyderabad Bidar,
Karnataka
Bonthapally, Hyderabad
Jeedimetla, Hyderabad
(2 facilities)
Alathur, Tamil Nadu
15
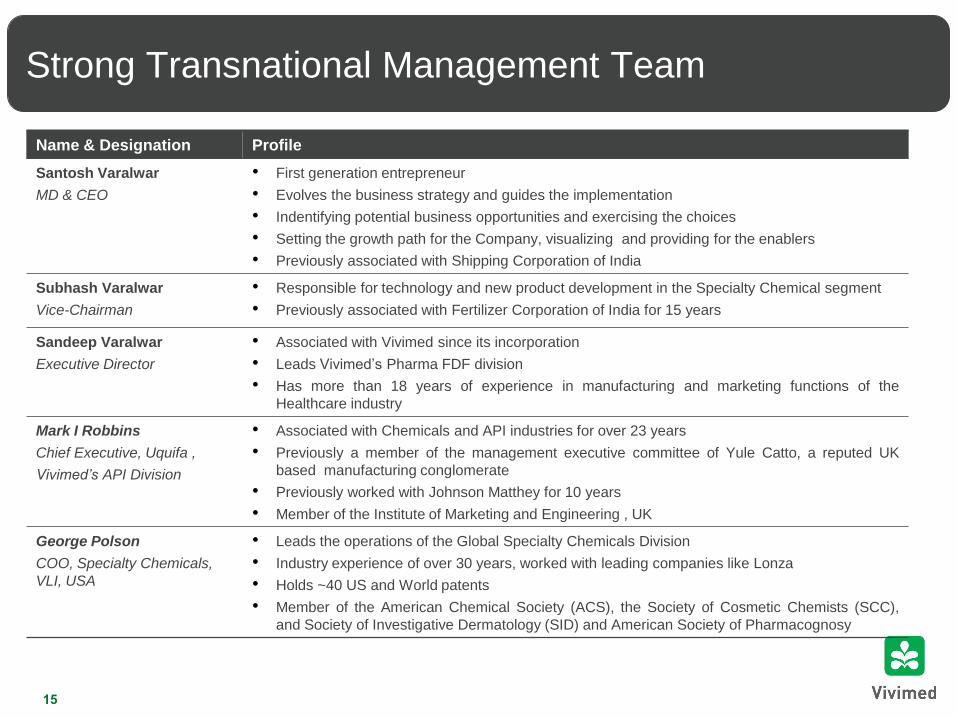
Strong Transnational Management Team
Name & Designation Profile
Santosh Varalwar
MD & CEO
• First generation entrepreneur
• Evolves the business strategy and guides the implementation
• Indentifying potential business opportunities and exercising the choices
• Setting the growth path for the Company, visualizing and providing for the enablers
• Previously associated with Shipping Corporation of India
Subhash Varalwar
Vice-Chairman
• Responsible for technology and new product development in the Specialty Chemical segment
• Previously associated with Fertilizer Corporation of India for 15 years
Sandeep Varalwar
Executive Director
• Associated with Vivimed since its incorporation
• Leads Vivimed’s Pharma FDF division
• Has more than 18 years of experience in manufacturing and marketing functions of the
Healthcare industry
Mark I Robbins
Chief Executive, Uquifa ,
Vivimed’s API Division
• Associated with Chemicals and API industries for over 23 years
• Previously a member of the management executive committee of Yule Catto, a reputed UK
based manufacturing conglomerate
• Previously worked with Johnson Matthey for 10 years
• Member of the Institute of Marketing and Engineering , UK
George Polson
COO, Specialty Chemicals,
VLI, USA
• Leads the operations of the Global Specialty Chemicals Division
• Industry experience of over 30 years, worked with leading companies like Lonza
• Holds ~40 US and World patents
• Member of the American Chemical Society (ACS), the Society of Cosmetic Chemists (SCC),
and Society of Investigative Dermatology (SID) and American Society of Pharmacognosy
16
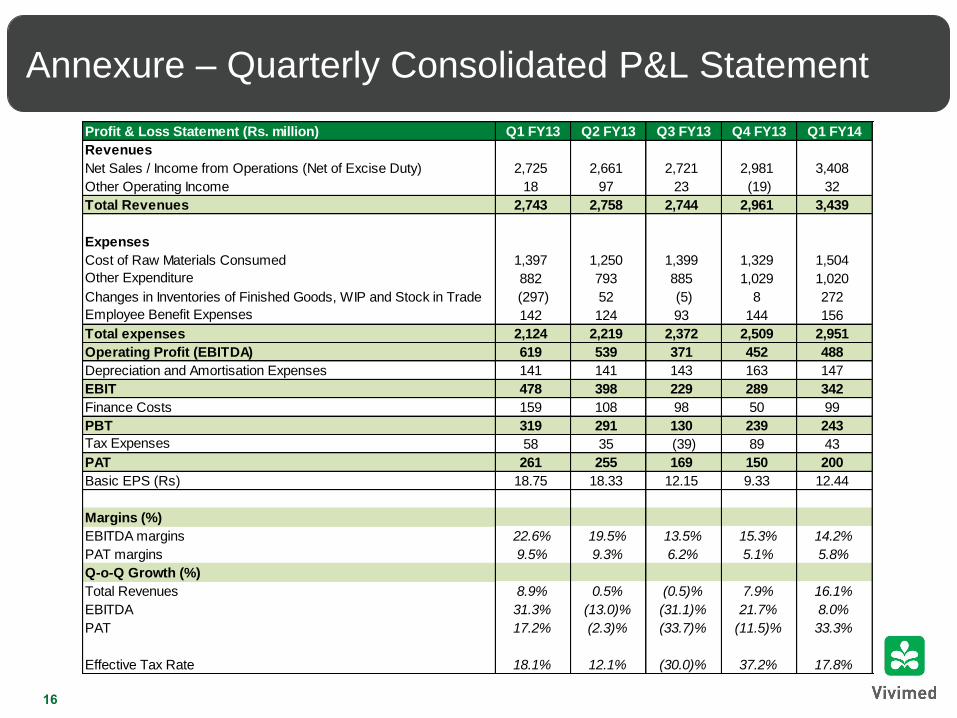
Annexure – Quarterly Consolidated P&L Statement
Profit & Loss Statement (Rs. million) Q1 FY13 Q2 FY13 Q3 FY13 Q4 FY13 Q1 FY14
Revenues
Net Sales / Income from Operations (Net of Excise Duty) 2,725 2,661 2,721 2,981 3,408
Other Operating Income 18 97 23 (19) 32
Total Revenues 2,743 2,758 2,744 2,961 3,439
Expenses
Cost of Raw Materials Consumed 1,397 1,250 1,399 1,329 1,504
Other Expenditure 882 793 885 1,029 1,020
Changes in Inventories of Finished Goods, WIP and Stock in Trade (297) 52 (5) 8 272
Employee Benefit Expenses 142 124 93 144 156
Total expenses 2,124 2,219 2,372 2,509 2,951
Operating Profit (EBITDA) 619 539 371 452 488
Depreciation and Amortisation Expenses 141 141 143 163 147
EBIT 478 398 229 289 342
Finance Costs 159 108 98 50 99
PBT 319 291 130 239 243
Tax Expenses 58 35 (39) 89 43
PAT 261 255 169 150 200
Basic EPS (Rs) 18.75 18.33 12.15 9.33 12.44
Margins (%)
EBITDA margins 22.6% 19.5% 13.5% 15.3% 14.2%
PAT margins 9.5% 9.3% 6.2% 5.1% 5.8%
Q-o-Q Growth (%)
Total Revenues 8.9% 0.5% (0.5)% 7.9% 16.1%
EBITDA 31.3% (13.0)% (31.1)% 21.7% 8.0%
PAT 17.2% (2.3)% (33.7)% (11.5)% 33.3%
Effective Tax Rate 18.1% 12.1% (30.0)% 37.2% 17.8%

Consolidated Performance
Annexure – Segment Highlights
17
y-o-y Q4 q-o-q
(Rs. million) FY2014 FY2013 Growth (%) FY2013 Growth (%)
Segment Revenue 3,408 2,725 25.0% 2,981 14.3%
Specialty chemicals 983 883 11.4% 1,029 (4.4)%
Healthcare 2,424 1,842 31.6% 1,952 24.2%
EBIT 342 478 (28.5)% 289 18.3%
Margin (%) 10.0% 17.5% 9.7%
Specialty chemicals 150 197 (23.9)% 153 (2.3)%
Margin (%) 15.2% 22.3% 14.9%
Healthcare 192 281 (31.7)% 135 41.7%
Margin (%) 7.9% 15.3% 6.9%
Capital Employed 12,926 11,944 8.2% 12,929 (0.0)%
Specialty chemicals 7,913 7,635 3.6% 7,772 1.8%
Healthcare 5,014 4,309 16.3% 5,157 (2.8)%
Q1

Thank You
Contact Details:
Vivimed Labs Limited
Veernag Towers, Habsiguda, Hyderabad 500 007
www.vivimedlabs.com
Priyanka Mukherjee
Vivimed Labs Limited
+91 40 2717 6005
Saket Somani
Churchgate Partners
+91 22 3953 7444