q1 2020 results - deutsche bank€¦ · q1 2020 results 29 april 2020 deutsche bank investor...
TRANSCRIPT

Q1 2020 results
29 April 2020
Deutsche Bank

Q1 2020 results 29 April 2020
Deutsche BankInvestor Relations
Robust group performance with significant increase in Core Bank revenues and profitability
9th consecutive quarter of annual adjusted cost reductions(1) – outperformance versus internal expectations
Strong balance sheet and conservative risk levels allow us to navigate stressed environment
Clear client-led strategy and position as Germany’s leading bank enable us to be a vital part of the solution
Strategic transformation ahead of plan and beneficial in current environment
Executing well in unprecedented conditions
1
(1) Adjusted costs excluding bank levies and transformation charges
Q1 2020 results 29 April 2020
Deutsche BankInvestor Relations
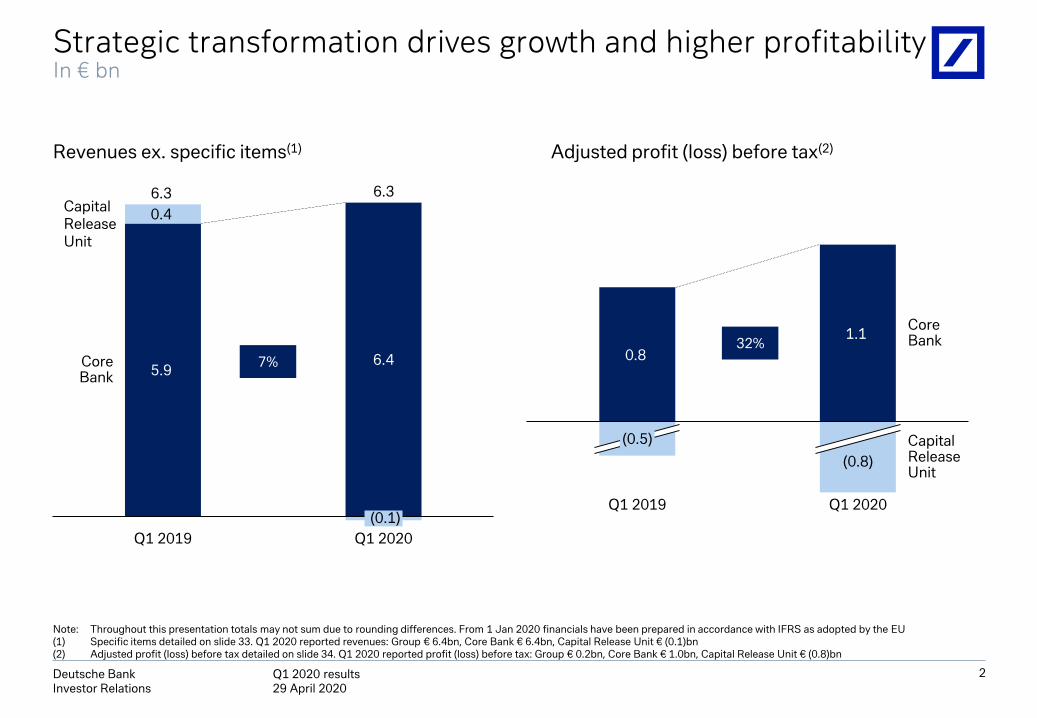
Strategic transformation drives growth and higher profitability In € bn
Revenues ex. specific items(1) Adjusted profit (loss) before tax(2)
Note: Throughout this presentation totals may not sum due to rounding differences. From 1 Jan 2020 financials have been prepared in accordance with IFRS as adopted by the EU(1) Specific items detailed on slide 33. Q1 2020 reported revenues: Group € 6.4bn, Core Bank € 6.4bn, Capital Release Unit € (0.1)bn(2) Adjusted profit (loss) before tax detailed on slide 34. Q1 2020 reported profit (loss) before tax: Group € 0.2bn, Core Bank € 1.0bn, Capital Release Unit € (0.8)bn
2
5.9 6.4
0.4
Q1 2019
(0.1)
Q1 2020
CoreBank
6.3 6.3
0.8
1.1
(0.5)
Q1 2019
(0.8)
Q1 2020
CapitalReleaseUnit
CoreBank
7%
32%
Capital Release Unit
Q1 2020 results 29 April 2020
Deutsche BankInvestor Relations
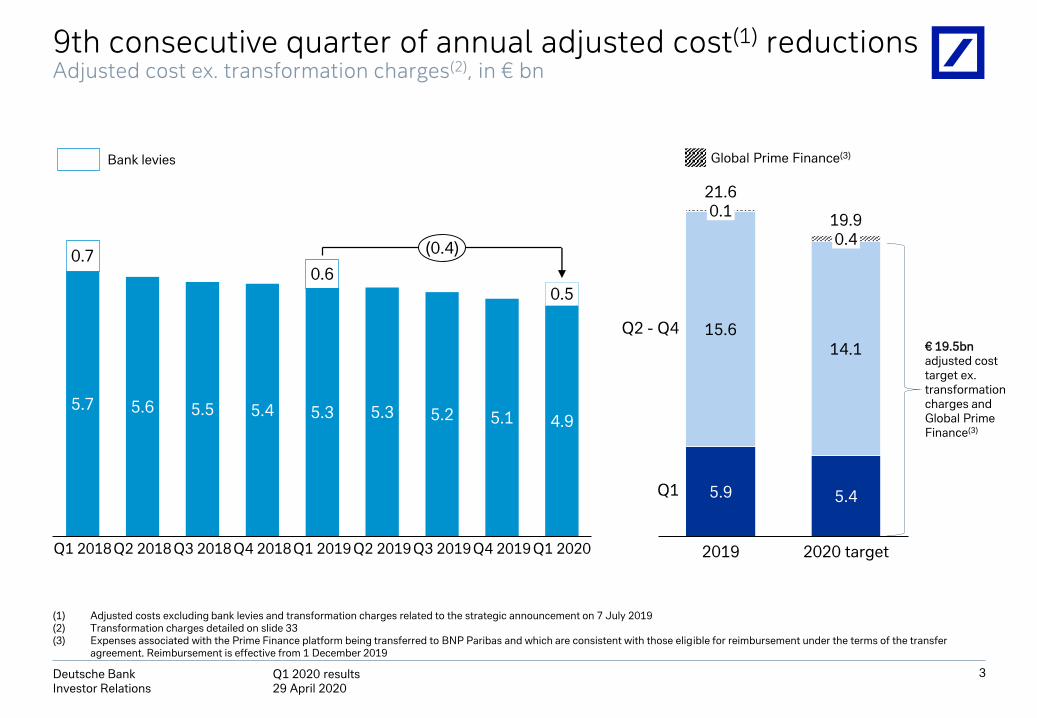
9th consecutive quarter of annual adjusted cost(1) reductionsAdjusted cost ex. transformation charges(2), in € bn
3
0.1
5.9
15.6
2019
0.4
5.4
14.1
2020 target
21.6
19.9
Q2 2018
0.7
5.74.9
5.45.55.6
Q1 2018 Q3 2018Q4 2018
0.6
5.3
Q1 2019
5.15.3
Q2 2019
5.2
Q3 2019Q4 2019
0.5
Q1 2020
(0.4)
Bank levies
(1) Adjusted costs excluding bank levies and transformation charges related to the strategic announcement on 7 July 2019(2) Transformation charges detailed on slide 33(3) Expenses associated with the Prime Finance platform being transferred to BNP Paribas and which are consistent with those eligible for reimbursement under the terms of the transfer
agreement. Reimbursement is effective from 1 December 2019
Q1
Q2 - Q4
Global Prime Finance(3)
€ 19.5bn adjusted costtarget ex. transformationcharges andGlobal Prime Finance(3)

Q1 2020 results 29 April 2020
Deutsche BankInvestor Relations
Growing revenues reflecting continued franchise momentumCore Bank revenues(1) excluding specific items, in € bn
Note: Specific items detailed on slide 33
(1) Revenues in Corporate & Other (Q1 2019: € (16)m, Q1 2020: € 63m) are not shown on this chart but are included in Core Bank totals
Asset Management
PrivateBank
Corporate Bank
Investment Bank
4
1.3
2.1
2.0
1.3
0.5
2.1
Q1 2019
2.3
0.5
Q1 2020
CB
IB
PB
AM
5.9
6.4
7%
(1)%
15%
3%
(1)%
— Net inflows in core focus areas including through strategic partnerships and ESG funds
— Number of funds rated 4/5 star by Morningstar increased by 40% since IPO in 2018
— Strong demand for digital capabilities across the platform
— Wealth management revenue growth reflecting relationship manager hiring in 2019
— Continued deposit conversion and net inflows of € 4bn into investment products to partly offset interest rate headwinds
— Repriced a further € 10bn of deposits in the quarter
— Good momentum on strategic priorities to develop platform, FinTech and ecommerce payments solutions
— Further investments in Asian coverage and technology platforms
— Current crisis reinforces our leading domestic position
— Encouraging development in Rates, FX and Emerging Markets
— Partnership with Corporate Bank drove 30% growth in Rates and FX revenues with corporate clients
— Regained market share in German and EMEA Origination & Advisory

Q1 2020 results 29 April 2020
Deutsche BankInvestor Relations
Strategic priorities supporting cost reduction pathCore Bank adjusted costs ex transformation charges(1), in € bn
Note: Adjusted costs ex. transformation charges detailed on slide 33
(1) Adjusted costs ex. transformation charges in Corporate & Other (Q1 2019: € 31m, Q1 2020: € 103m) are not shown on this chart but are included in Core Bank totals
Asset Management
— Continued implementation of efficiency measures including vendor relationships and real estate footprint
PrivateBank
— € 70m of German merger synergies in the quarter – on track to deliver against 2020 target
— Next initiatives under way including German legal entity merger in Q2 2020
Corporate Bank
— Cost increase driven by changes to group wide infrastructure cost allocation methodology
— Focus on efficiency optimization in Germany and across infrastructure
Investment Bank
— Benefitting from front office headcount reductions in 2019
— 19% reduction in infrastructure costs
— Continued progress on application decommissioning - 14% of target applications retired since strategic announcement
5
1.0
Q1 2020
1.8
1.7
Q1 2019
0.4
1.1
1.5
1.8
0.4
CB
IB
PB
AM
5.0
4.8
(4)%
4%
(15)%
(2)%
(7)%

Q1 2020 results 29 April 2020
Deutsche BankInvestor Relations
Maintained strong balance sheet
6
CommentQ1 20202019
€ 24m Tightly controlled market riskAverage Value at Risk € 28m
Increase reflects deteriorating macroeconomic outlook
44bpsProvision for credit losses as a % of loans
17bps
12.8%239bps above current regulatory
requirementsCommon Equity Tier 1 capital ratio
13.6%
€ 43bn above requirementsLiquidity Coverage Ratio 133%141%
Liquidity reserves € 205bn€ 222bnMaintained a strong liquidity profile
while supporting client demand

Q1 2020 results 29 April 2020
Deutsche BankInvestor Relations
Low risk, well diversified loan portfolioLoans at amortized cost, in € bn, period end
7
230
87
131
459
11
Investment Bank
Q1 2020
Corporate Bank
Private Bank
Note: Loan amounts are gross of allowances for loan losses. LTV = Loan to Value(1) Mainly Corporate & Other and Capital Release Unit
(2) Based on Deutsche Bank internal rating assessment
(3) Applicable to DB SpA
Other(1)
— Trade Finance and working capital, mainly short-term to German midcaps and
global multinationals
—Commercial Banking loans to midcap and SME clients in Germany
—Concentration risk subject to strict hedging framework
—Asset backed loans (iA- median rating(2)) collateralized with diverse range of assets
—Commercial real estate loans (~60% LTV), positioned to withstand downside risks
—Conservative underwriting standards across leveraged loans
—Dynamic hedging of bridge commitments
— ~50% of total loan portfolios in the Private Bank
— ~60% of Private Bank loans in low risk German mortgages – median LTV 64%
—Wealth Management portfolio 99% collateralized
— Italian portfolio best in class with gross non-performing loans below 2.5%(3)

Q1 2020 results 29 April 2020
Deutsche BankInvestor Relations
Well positioned in this crisis as Germany’s leading bank
Source: DB Research, Bundesbank, IMF, Bruegel
5969
7582
122
155
UK FRSGY USIT
Corporate debt(% of GDP as of 2019)
Announced government COVID-19 measures(% of GDP as of 2019)
Household debt(% of GDP as of 2019)
Government debt(% of GDP as of 2019)
8
39
60
85
99109
135
GY ITCH UK USFR
22
14
12
86
5
USITGY FR UK S
41
5461
7584
132
UKGYIT FR US S
Access point to state sponsored lending as ‘Hausbank’ to ~900k
corporate and commercial clients
Leading German corporate finance franchise – 14%
market share year-to-date
Reinforced position as leading German retail bank
Provided liquidity and solutions as the #1 domestic
retail asset manager
Q1 2020 results 29 April 2020
Deutsche BankInvestor Relations
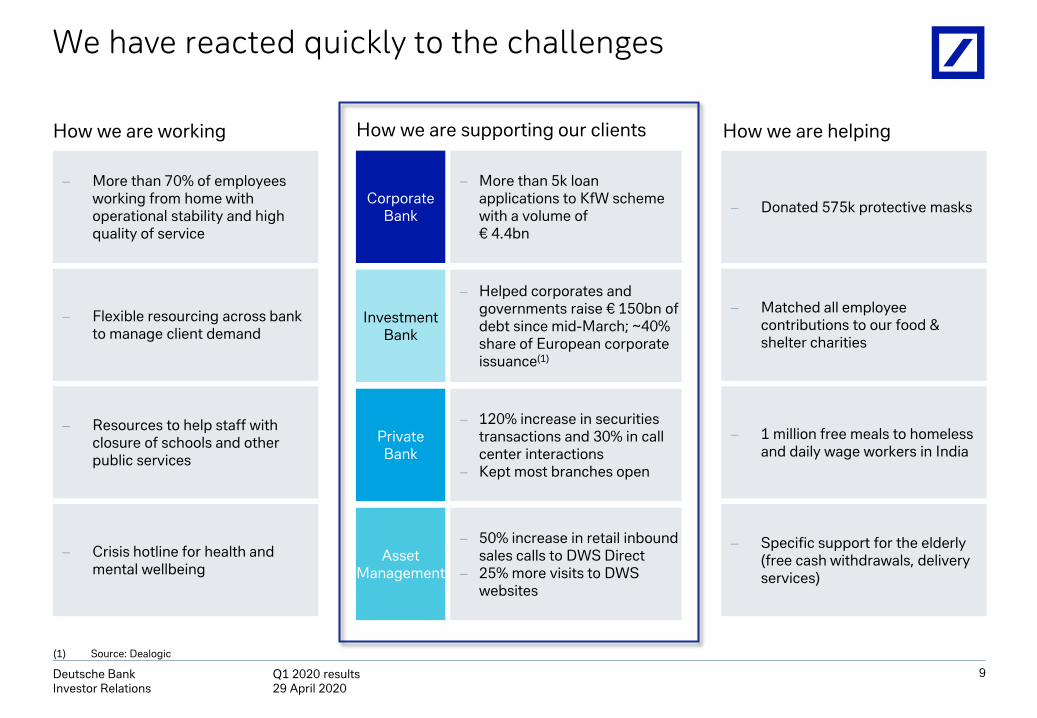
We have reacted quickly to the challenges
9
How we are supporting our clients
Asset Management
PrivateBank
Corporate Bank
Investment Bank
More than 5k loan applications to KfW scheme with a volume of € 4.4bn
Helped corporates and governments raise € 150bn of debt since mid-March; ~40% share of European corporate issuance(1)
50% increase in retail inbound sales calls to DWS Direct
25% more visits to DWS websites
120% increase in securities transactions and 30% in call center interactions
Kept most branches open
Flexible resourcing across bank to manage client demand
Crisis hotline for health and mental wellbeing
Resources to help staff with closure of schools and other public services
Donated 575k protective masks
Matched all employee contributions to our food & shelter charities
Specific support for the elderly (free cash withdrawals, delivery services)
How we are working How we are helping
More than 70% of employees working from home with operational stability and high quality of service
(1) Source: Dealogic
1 million free meals to homeless and daily wage workers in India

Q1 2020 results 29 April 2020
Deutsche BankInvestor Relations
Q1 2020 Group financial highlightsIn € m, unless stated otherwise
10
Change in % Change in %
Q1 2020 vs. Q1 2019 vs. Q4 2019
Revenues
Revenues 6,350. (0) 19.
of which: specific items(1) 76(
Revenues ex specific items 6,275( (1) 18.
Costs
Noninterest expenses 5,638( (5) (12)
of which: Adjusted costs ex. transformation charges(2) 5,452( (8) 7.
Cost/income ratio (%)(3) 89( (4) ppt (31) ppt
Profitability
Profit (loss) before tax 206( (29) n.m.
Profit (loss) 66. (67) n.m.
RoTE (%)(4) (0.3) (1.1) ppt 12.3. ppt
Per sharemetrics
Diluted earnings per share (in €) 0.02. (75) n.m.
Tangible book value per share (in €) 23.27. (10) (1)
Risk and Capital
Provision for credit losses(bps of loans)(5) 44( 31. bps 21. bps
CET1 ratio (%) 12.8( (90). bps (79). bps
Leverage ratio (%, fully loaded) 4.0( 7. bps (21) bps
(1) Specific items detailed on slide 33
(2) Transformation charges of € 84m in Q1 2020 and € 608m in Q4 2019
(3) Throughout this presentation cost/income ratio defined as total noninterest expenses as a percentage of total net revenues
(4) Tangible shareholders’ equity Q1 2020: € 49.7bn, Q1 2019: € 54.2bn and Q4 2019: € 50.8bn
(5) Year-to-date provision for credit losses annualized as % of loans gross of allowances for loan losses (€ 459bn as of 31 Mar 2020)

Q1 2020 results 29 April 2020
Deutsche BankInvestor Relations
COVID-19 impact on financials
11
CET1 ratio ~40bps
Provision for credit losses ~€ 260m
Level 3 assets € 4bn
Liquidity Reserves € 17bn
Q1 2020COVID-19
impact
— Changes in macroeconomic environment
— Rating migration
— Drawdowns on committed credit facilities
— Modest actual impairments
— Drawdowns on committed credit facilities
— Additional lending to support clients
— Higher carrying values on existing level 3 derivative
inventory, mainly driven by movements in interest rates
— Some reclassification into level 3 due to increased
dispersion in market pricing
— Drawdowns on committed credit facilities
— Increase in capital deductions from Prudent Valuation
adjustments
— Higher credit risk RWA for derivatives
Drivers

Q1 2020 results 29 April 2020
Deutsche BankInvestor Relations
97 107213 259 276
230
43 54
Q1 2019
247
140
Q4 2019Q2 2019
(38)
Q3 2019
(12)
Q1 2020
161175
506
12
Stage 3Stage 1 + 2
Provision for credit lossesIn € m, unless otherwise stated
— Higher provision for credit losses driven by
COVID-19 pandemic
— Increased Stage 1 and 2 provisions related to
COVID-19 to reflect:
— Updated approach in-line with ECB
guidance incorporating a three year average
macroeconomic outlook
— Updated macroeconomic outlook
— Adverse rating migrations
— Increased drawdowns on committed
facilities
— COVID-19 Stage 1 and 2 provisions most
pronounced in the Investment Bank and in the
Corporate Bank. Modest increase in the Private
Bank
— Stage 3 provisions largely in line with prior quarter,
consistent with our previous guidance, reflecting a
number of smaller specific events
— Allowance for loan losses of € 4.3bn (95bps of
loans) adequate relative to conservatively
positioned loan portfolio
245
229
Q1 2020ex COVID-19 impact(1)
COVID-19 impactStage 3
COVID-19 impactStage 1 & 2
32
Q1 2020
506
Total COVID-19 impact: 261
(1) Estimated Q1 2020 provision for credit losses earlier in the quarter, prior to the onset of the COVID-19 pandemic

Q1 2020 results 29 April 2020
Deutsche BankInvestor Relations
13
Key focusindustries:~11%
Note: Loan amounts are gross of allowances for loan losses. LTV = Loan to Values(1) Comprise of Commercial Real Estate Group and APAC Commercial Real Estate exposures in the Investment Bank as well as non-recourse Commercial Real Estate business in the Corporate Bank
(2) Net credit limits is the maximum credit risk appetite after risk mitigation, it also includes other non-loan cash, derivative and contingent exposures as well as unutilized credit facilities approved
(3) Retail industry loan exposures exclude clients in more stable Food industry subsegment
Loan book compositionLoans at amortized cost, period end
Commercial Real Estate(1)
(€ 33bn)
— Well diversified across high quality properties
— Largely first lien, 60% average loan to value
— Manageable exposure to hotels and retail mitigated by low
LTVs and strong sponsors
Oil & Gas(€ 8bn)
— Focused on Oil majors and national players
— More than 80% net credit limits(2) to Investment Grade names
— Limited exposure to higher cost US shale producers following
reductions over last years
Retail industry(3)
(€ 5bn)
— Focused on strong global names
— More than 70% net credit limits to Investment Grade names
— Limited exposure to non-food, apparel and textiles retailers
Aviation(€ 4bn)
— 2/3rds secured aircraft financing, 70% average LTV, biased
towards newer / liquid aircrafts
— Unsecured portfolio focused on developed market flag
carriers
Leisure(€ 2bn)
— Focused portfolio on industry leaders in hotels and casinos
— Limited exposure to cruise lines and tour operators

Q1 2020 results 29 April 2020
Deutsche BankInvestor Relations
Capital ratiosIn € bn, except movements (in basis points), period end
14
CET1 ratio
Leverage ratio – CRD4, fully loaded
— CET1 capital ratio declined by 79bps in the quarter
— ~30bps from the new securitization framework
— ~40bps due to COVID-19 pandemic, notably:
— Client drawdowns driving higher credit risk RWA
— Higher Prudent Valuation reserves impacting capital
— COVID-19 impacts mostly expected to reverse over
time as the environment normalizes
— ~10bps reflecting regular business growth
— Leverage ratio declined by 21bps in the quarter
— ~15bps due to COVID-19 impact including
— ~€ 10bn net increase in leverage exposure from
client drawdowns
— ~€ 10bn from higher net derivatives and trading
exposures
— ~€ 20bn from higher pending settlements
— ~15bps principally from seasonal rebound in trading
related balance sheet
— ~10bps benefit from our AT1 issuance
013.6%
Q4 2019 FX Effect
(66)
RWA change
(13) 12.8%
Capital change
Q1 2020
CET1Capital
44.1 0.0 - (0.4) 43.7
RWA 324 0 17 - 341
Tier 1Capital
48.7 0.0 - 0.7 49.5
LeverageExposure
1,168 3 77 - 1,248
4.2%
Q4 2019
(1)
FX Effect
(26)
Leverage Exposure change
Capital change
Q1 2020
4.0%6
Q1 2020 results 29 April 2020
Deutsche BankInvestor Relations
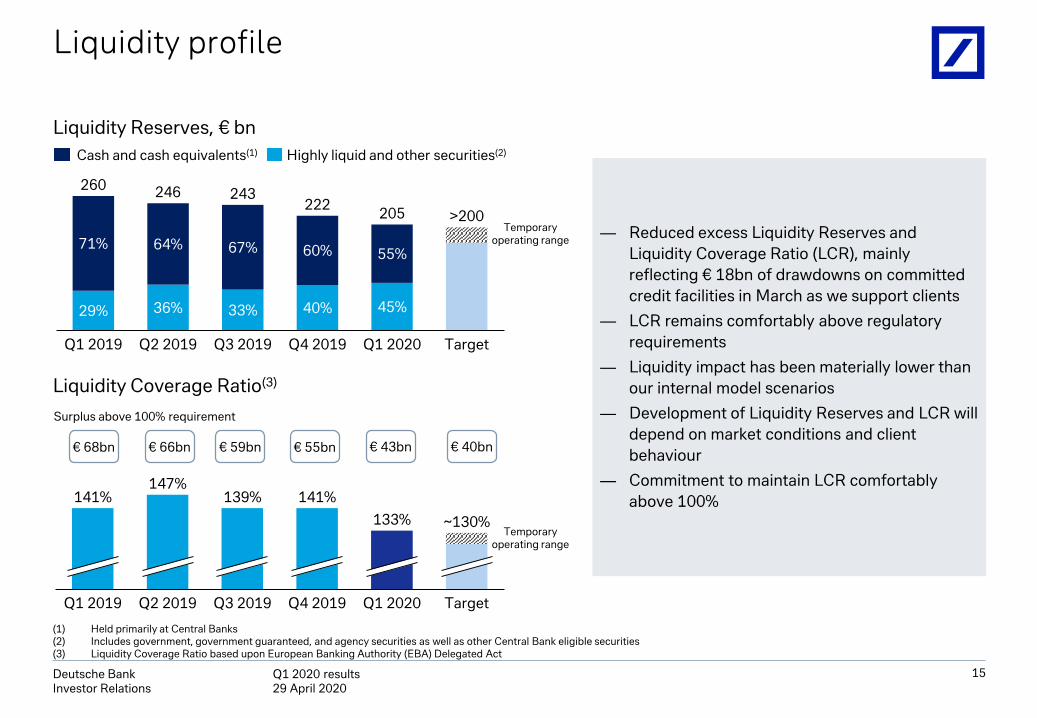
Liquidity Coverage Ratio(3)
Liquidity Reserves, € bn
Highly liquid and other securities(2)Cash and cash equivalents(1)
33%
67%71% 64%
29%
TargetQ1 2019 Q1 2020
36%
Q2 2019 Q3 2019
60%
40%
Q4 2019
55%
45%
260 246 243222
205 >200
€ 66bn€ 68bn € 43bn
Liquidity profile
141%147%
Q1 2019 Q2 2019 Q3 2019 Q4 2019 Q1 2020 Target
141% 139%
133% ~130%
€ 59bn € 55bn
(1) Held primarily at Central Banks(2) Includes government, government guaranteed, and agency securities as well as other Central Bank eligible securities(3) Liquidity Coverage Ratio based upon European Banking Authority (EBA) Delegated Act
Surplus above 100% requirement
15
Temporaryoperating range
€ 40bn
Temporaryoperating range
— Reduced excess Liquidity Reserves and
Liquidity Coverage Ratio (LCR), mainly
reflecting € 18bn of drawdowns on committed
credit facilities in March as we support clients
— LCR remains comfortably above regulatory
requirements
— Liquidity impact has been materially lower than
our internal model scenarios
— Development of Liquidity Reserves and LCR will
depend on market conditions and client
behaviour
— Commitment to maintain LCR comfortably
above 100%

Q1 2020 results 29 April 2020
Deutsche BankInvestor Relations
Transformation-related effectsIn € bn
16
1.00.2
0.7
0.50.4
1.0
0.4
0.2
2.8
0.0 0.1
2021
0.1
2019
0.10.1
2020
0.10.1 0.1
2022
Deferred tax asset valuation
adjustment
Goodwill impairment(1)
Software impairment(3)
Real estate charges
Restructuring & Severance(2)
Deferred Tax Asset valuation adjustment
Goodwill impairment
Software impairment/ accelerated amortization
Real estate charges
82%
100%
50%
45%
% of total 2019 –
Q1 2020
Note: Estimated restructuring and severance, impairments, deferred tax valuation adjustments and other transformation charges in future periods are preliminary and subject to change. Non-tax items are shown on a pre-tax basis
(1) Non-tax deductible (2) Excludes H1 2019 Restructuring & Severance of € 0.1bn, prior to the strategic announcement on 7 July 2019(3) Includes accelerated amortization(4) Excluded from Adjusted costs. Definition of adjusted costs detailed on 31(5) Included in Adjusted costs
Total transformation-related effects 73%
3.4
1.0
0.3
1.8
2019 – 2022 expected
cumulative expenses
0.0
-
0.1
0.0
Q1 2020
Restructuring & Severance
0.1
1.4 76%
No
no
pe
rati
ng
co
sts(4
)
Tra
nsf
orm
ati
on
c
ha
rge
s(5)Pre-tax
items
Other 0.0 0.2 22%
Other

Q1 2020 results 29 April 2020
Deutsche BankInvestor Relations
Adjusted costsIn € m, FX adjusted
— Reductions across all
categories year-on-year
— Decline in compensation and
benefit costs primarily reflects
workforce reductions
— Reduced internal workforce
by over 900 in the quarter
— IT costs decreased mainly due
to lower software amortization
— Decrease in professional
service fees and other costs
reflecting continued
disciplined management of
non-compensation costs
— Bank levies in the quarter
declined by 17% versus the
prior year period
Drivers
17
Global Prime Finance(1)
Note: Adjusted costs detailed on slide 35 and 36
(1) Expenses associated with the Prime Finance platform being transferred to BNP Paribas and which are consistent with those eligible for reimbursement under the terms of the transfer agreement. Reimbursement is effective from 1 December 2019
(2) Excludes severance of € 14m in Q1 2020 and € 23m in Q1 2019 as well as € 86m in Q4 2019 as they are excluded from adjusted costs
(183)(101)
Q1 2020Q1 2019ex FX
(88)
Others
98
5,354
Q1 2020 ex. transfor-
mationcharges
84
Transformationcharges
Compensationand
benefits(2)
(90)
IT costs Bank levies
(53)
ProfessionalService Fees
5,966
5,452 5,536
(9)%
71 497 (116)102
5,102
Q1 2020 ex. transfor-
mationcharges
98
Q1 2020Transformationcharges
Q4 2019ex. transfor-
mationcharges
5,000
Compensationand
benefits(2)
(45)
IT costs
84
(56)
ProfessionalService Fees
5,452 5,536
5,354
Bank levies Others
+7%
(3)% ex. Bank levies

Q1 2020 results 29 April 2020
Deutsche BankInvestor Relations
18
Segment results

Q1 2020 results 29 April 2020
Deutsche BankInvestor Relations
19
Change in Change in
Q1 2020
% vs. Q1 2019
% vs. Q4 2019
RevenuesRevenues 1,326. (1) 2
— Revenues essentially flat, with
limited impact from COVID-19 in the
quarter
— Progress on strategic priorities
including deposit repricing and
cooperation with Investment Bank
— Higher adjusted costs ex.
transformation charges reflect
higher internal service cost
allocations
— Loan growth and RWA increase
mainly driven by client drawdowns
on existing credit facilities
— Increase in credit loss provisions
mainly driven by a small number of
specific names as well as an updated
outlook due to COVID-19
of which: specific items(1) -. n.m. n.m.
Costs
Noninterest expenses 1,088. 8. (16)
of which: Adjusted costs ex.transformation charges(2) 1,052. 4. 4.
Cost/income ratio (%) 82. 7. ppt (18) ppt
Profitability
Profit (loss) before tax 132. (54) n.m.
Adjusted profit (loss) before tax(3) 168. (42) (5)
RoTE (%)(4) 3.4. (4.7) ppt 7.3 ppt
Balance sheet (€ bn)
Loans(5) 131. 12( 9(
Deposits 260. 0. (2).
Leverage exposure 272. 0. 3.
Risk
Risk weighted assets (€ bn) 59. (2) 4.
Provision for credit losses(bps of loans)(6)
33. 17. bps (2) bps
Corporate Bank In € m, unless otherwise stated
Q1 2020 year-on-year comments
(1) Specific items detailed on slide 33
(2) Transformation charges of € 26m for Q1 2020 and € 154m for Q4 2019
(3) Detailed on slide 34
(4) Post-tax return on tangible shareholders’ equity applying a 28% tax rate. Allocated tangible shareholders’ equity Q1 2020: € 9.2bn, Q1 2019: € 9.5bn and Q4 2019: € 9.0bn
(5) Loans gross of allowances for loan losses
(6) Year-to-date provision for credit losses annualized as % of loans (gross of allowances for loan losses)

Q1 2020 results 29 April 2020
Deutsche BankInvestor Relations
Q1 2020 Corporate Bank revenue performance In € m
968
358
1,326
Global Transaction Banking
Commercial Banking
Corporate Bank
Q1 2020 year-on-year driversChange vs. Q1 2019
Global Transaction Banking:
— Cash Management essentially flat as
interest rate headwinds partly offset by
deposit repricing and ECB deposit
tiering
— Trade Finance & Lending essentially flat
supported by further growth in lending
volumes
— Decrease in Securities Services driven
by the non-recurrence of a one-off gain
in the prior year period
— Trust & Agency Services lower,
impacted by U.S. interest rate cuts and
lower depositary receipts activity
Commercial Banking:
— Commercial Banking essentially flat as
higher lending volumes and payment
fees were offset by lower deposit
revenues given the current interest rate
environment
(1) Specific items detailed on slide 33
20
X% Excluding specific items(1)
(2)% (2)%
X%
0% 0%
(1)% (1)%

Q1 2020 results 29 April 2020
Deutsche BankInvestor Relations
21
Change in Change in
Q1 2020% vs.
Q1 2019% vs.
Q4 2019
Revenues
Revenues 2,339. 18. 54. — Revenue increase driven by higher
volumes and volatility in Fixed Income
and growth in Debt Origination
— Progress on strategic priorities
including institutional and corporate
client engagement
— Adjusted costs ex. transformation
charges declined on lower internal
service cost allocations and bank
levies
— RWA increase in the quarter mainly
due to the new securitization
framework and client drawdowns
— Leverage increase in the quarter
driven by higher pending settlements,
higher derivative market values and
client drawdowns
— Significantly higher provisions for
credit losses driven by rating
migrations, increased drawdowns on
committed credit facilities and an
updated macroeconomic outlook
of which: specific items(1) 36.
Revenues ex. specific items 2,303. 15. 54.
Costs
Noninterest expenses 1,475. (15) (5)
of which: Adjusted costs ex.transformation charges(2) 1,462. (15) 10.
Cost/income ratio (%) 63. (24) ppt (39) ppt
Profitability
Profit (loss) before tax 622. 149. n.m.
Adjusted profit (loss) before tax(3) 598. 114. n.m.
RoTE (%)(4) 7.7. 4.9. ppt 9.3. ppt
Balance sheet (€ bn)
Loans(5) 87. 27. 16.
Leverage exposure 529. 13. 20.
Risk
Risk weighted assets (€ bn) 133. 11. 13.
Provision for credit losses(bps of loans)(6) 111. 107. bps 91. bps
Investment Bank In € m, unless otherwise stated
(1) Specific items detailed on slide 33
(2) Transformation charges of € 14m for Q1 2020 and € 134m for Q4 2019
(3) Detailed on slide 34
(4) Post-tax return on tangible shareholders’ equity applying a 28% tax rate. Allocated tangible shareholders’ equity Q1 2020: € 21.3bn, Q1 2019: € 21.3bn and Q4 2019: € 21.6bn
(5) Loans gross of allowances for loan losses
(6) Year-to-date provision for credit losses annualized as % of loans (gross of allowances for loan losses)
Q1 2020 year-on-year comments

Q1 2020 results 29 April 2020
Deutsche BankInvestor Relations
Q1 2020 Investment Bank revenue performance In € m
1,854
458
27
2,339
Fixed Income, Currency Sales & Trading
Origination & Advisory
Other
Investment Bank
Q1 2020 year-on-year driversChange vs. Q1 2019
Fixed Income, Currency Sales & Trading:
— Strong client activity in all products
— Rates, FX & Emerging Markets
revenues up significantly due to higher
volatility and benefits of strategic
repositioning
— Significantly lower Credit revenues due
to mark-to-market losses on credit
positions
Origination & Advisory:
— Significantly higher Debt Origination
revenues on higher fees and net impact
of hedges partly offset by mark downs
on commitments
— Debt Origination bridge exposure is
significantly lower than in 2008
— Significantly lower Advisory revenues
on lower market volumes
(1) Specific items detailed on slide 33
22
X% Excluding specific items(1)
13% 16%
8% 8%
X%
18% 15%

Q1 2020 results 29 April 2020
Deutsche BankInvestor Relations
Change in Change in
Q1 2020% vs.
Q1 2019% vs.
Q4 2019
Revenues
Revenues 2,162 2. 9.— Revenues essentially flat as growth
in Wealth Management and volume
growth in Private Bank Germany
more than offset the ongoing
interest rate headwinds
— Progress on strategic priorities
including ~€ 70m of German
merger-related cost synergies in the
quarter
— Adjusted costs ex. transformation
charges declined on benefits from
reorganization measures and
workforce reductions, in part offset
by higher internal service cost
allocations
— Net inflows of € 4bn in investment
products; Assets under
Management declined on negative
market performance
— Provisions for credit losses returned
to more normalized levels. Limited
COVID-19 impact in the quarter
of which: specific items(1) 16
Revenues ex. specific items 2,145 3. 10.
Costs
Noninterest expenses 1,891 5. (12)of which: Adjusted costs ex. transformation charges(2) 1,807 (2) 1.
Cost/income ratio (%) 87 3. ppt (21) ppt
Profitability
Profit (loss) before tax 132 (38) n.m.
Adjusted profit (loss) before tax(3) 197 29. n.m.
RoTE (%)(4) 3.0 (2.5) ppt 12.0. ppt
Business volume
(€ bn)
Loans(5) 230 3. 1.
Deposits 286 1. 0.
Assets under Management(6) 442 (7) (8)
Risk
Risk weighted assets (€ bn) 76 6. 1.
Provision for credit losses(bps of loans)(7) 24 5. bps 3. bps
23
Private Bank In € m, unless otherwise stated
Q1 2020 year-on-year comments
(1) Specific items detailed on slide 33(2) Transformation charges of € 15m for Q1 2020 and € 174m for Q4 2019(3) Detailed on slide 34(4) Post-tax return on tangible shareholders’ equity applying a 28% tax rate. Allocated tangible shareholders’ equity Q1 2020: € 10.3bn, Q1 2019: € 10.1bn and Q4 2019: € 10.2bn(5) Loans gross of allowances for loan losses(6) Includes deposits if they serve investment purposes. Detailed on slide 48(7) Year-to-date provision for credit losses annualized as % of loans (gross of allowances for loan losses)

Q1 2020 results 29 April 2020
Deutsche BankInvestor Relations
Q1 2020 Private Bank revenue performance In € m
1,327
369
466
2,162
Private Bank Germany
Private & CommercialBusiness International
Wealth Management
Private Bank
(1) Specific items detailed on slide 33
Private Bank Germany:
— Impact of deposit margin compression as well
as higher liquidity and funding costs largely
offset by growth in investment products
— 8th consecutive quarter of loan growth with
net client loan growth of €2bn in the current
quarter, mainly in mortgages
Private & Commercial Business International:
— Growth in loan and investment product
revenues combined with re-pricing measures
offset ongoing deposit margin compression
— Slowdown in growth at quarter-end in Italy
and Spain on initial COVID-19 impacts
Wealth Management:
— Strong growth across all regions, in particular
in capital market products in Emerging
Markets in January and February
— Net inflows in investment products of € 3bn
Q1 2020 year-on-year driversChange vs. Q1 2019Excluding specific items(1)
24
X%
(1)% (1)%
3% 3%
9% 17%
2% 3%
3% 3%

Q1 2020 results 29 April 2020
Deutsche BankInvestor Relations
25
Change in Change in
Q1 2020% vs.
Q1 2019% vs.
Q4 2019
Revenues Revenues 519) (1) (23)
Costs
Noninterest expenses 374) (6) (15)
of which: Adjusted costs ex.transformation charges(1) 366) (7) (13)
Cost/income ratio (%) 72) (4) ppt 7. ppt
Profitability
Profit (loss) before tax 110) 14. (38)
Adjusted profit (loss) before tax(2) 118) 17. (42)
RoTE (%)(3) 16.6) 1.2. ppt (10.9) ppt
Mgmt fee margin (bps)(4) 29.5) (0.5) bps 0.6. bps
AuM (€ bn)Assets under Management 700) (1) (9)
Net flows (2) n.m. n.m.
Asset ManagementIn € m, unless otherwise stated
(1) Transformation charges of € 0m for Q1 2020 and € 21m for Q4 2019(2) Detailed on slide 34(3) Post-tax return on tangible shareholders’ equity applying a 28% tax rate. Allocated tangible shareholders’ equity Q1 2020: € 1.8bn, Q1 2019: € 1.7bn and Q4 2019: € 1.8bn (4) DWS disclosed margin. Asset Management reported management margin of 29.5 bps for Q1 2020, annualized management fees divided by average Assets under Management
Q1 2020 year-on-year comments
— Revenues essentially flat as
interest rate related change in
fair value of guarantees offset
higher management fees
— Progress on strategic priorities
with net inflows in core focus
areas
— Adjusted costs ex.
transformation charges declined
on successful implementation of
cost initiatives and lower
deferred variable compensation
— Assets under Management
declined on negative market
performance
— Industry wide outflows in March
offset strong inflows in January
and February

Q1 2020 results 29 April 2020
Deutsche BankInvestor Relations
Q1 2020 Asset Management revenue performance In € m
17
(51)
519
Other Revenues
Management Fees
Performance & Transaction Fees
Asset Management
553 9% 9%
n.m. n.m.
(1)% (1)%
59% 59%
Q1 2020 year-on-year drivers
Management Fees:
— Higher Management Fees and other
recurring revenues reflecting increase
in average assets under management
and the benefits of inflows and market
performance during 2019
Performance & Transaction Fees:
— Higher real estate transaction fees in
the quarter
Other Revenues:
— Declined significantly primarily
reflecting the change in fair value of
guarantees on lower interest rates
Change vs. Q1 2019X% Excluding specific items(1)X%
(1) Specific items detailed on slide 33
26

Q1 2020 results 29 April 2020
Deutsche BankInvestor Relations
Corporate & OtherIn € m
Q1 2019
(1) Valuation and Timing reflects the mismatch in revenue from instruments accounted on an accrual basis under IFRS that are economically hedged with derivatives that are accounted for on a mark-to-market basis
(2) Reversal of noncontrolling interests reported in operating business segments (mainly Asset Management)
(15)
(154)
(24)
Profit (loss) before tax
27
Change Change
Q1 2020vs. Q1 2019
vs. Q4 2019
Profit (loss) before tax (24) (8) 130.
Funding & liquidity (47) (33) 80.
Valuation & Timing differences(1) 190. 149. (56)
Shareholder expenses (92) 23. (8)
Litigation (10) (7) 128.
Noncontrolling interest(2) 33. 1. (21)
Other (98) (141) 7.Q4 2019 Q1 2020

Q1 2020 results 29 April 2020
Deutsche BankInvestor Relations
28
Q1 2020
Absolutechange vs. Q4 2019 Q4 2019
RevenuesRevenues (59) 120. (179) — Negative revenues in the quarter
driven by funding and credit valuation
adjustments and de-risking costs,
partly offset by hedging / risk
management gains and cost
reimbursement from BNP Paribas
agreement
— Noninterest expenses included bank
levy contributions of € 247m in the
quarter
— Adjusted costs ex. transformation
charges and bank levies declined by
€ 83m
— Risk weighted assets and leverage
exposure slightly lower in the quarter
as de-risking reductions were partly
offset by market driven increases
Revenues ex. specific items(1) (82) 81. (163)
CostsNoninterest expenses 694. 3. 691.
of which: Adjusted costs ex.transformation charges(2)
661. 163. 498.
ProfitabilityProfit (loss) before tax (767) 90. (856)
Adjusted profit (loss) before tax(3) (758) (46) (711)
Balance sheet & Risk (€ bn)
Leverage exposure 118. (9) 127.
Risk weighted assets 44. (2) 46.
of which: Operational Risk RWA 26. (0) 26.
Employees Front office FTE(4) 573. (44) 617.
Capital Release UnitIn € m, unless otherwise stated
Q1 2020 quarter-on-quarter comments
(1) Specific items detailed on slide 33(2) Transformation charges of € 29m for Q1 2020 and € 83m for Q4 2019 (3) Detailed on slide 34(4) Full-time equivalents

Q1 2020 results 29 April 2020
Deutsche BankInvestor Relations
Strength of our franchises increasingly visible in Q1 2020
Well capitalized, highly liquid and low risk balance sheet provides a solid foundation
Elevated client demand and current environment make it difficult to predict opportunities and challenges in capital ratio outlook
Our home market in Germany is the most stable market in which to operate
Opportunities to support clients which we believe are in the best interests of all stakeholders
Outlook and conclusion
29
Comfortably on track to reach 2020 adjusted cost target(1)
(1) Excluding transformation charges and expenses associated with the Prime Finance platform being transferred to BNP Paribas and which are consistent with those eligible for reimbursement under the terms of the transfer agreement

Q1 2020 results 29 April 2020
Deutsche BankInvestor Relations
30
Appendix

Q1 2020 results 29 April 2020
Deutsche BankInvestor Relations
Definition of adjustments
31
Adjusted costs
Revenues excluding specific items
Transformation charges
Transformation-related effects
Adjusted profit (loss) before tax
Adjusted costs are calculated by deducting (i) impairment of goodwill and other intangible assets, (ii) litigation charges, net and (iii) restructuring and severance from noninterest expenses under IFRS
Revenues excluding specific items are calculated by adjusting net revenues under IFRS for specific revenue items which generally fall outside the usual nature or scope of the business and are likely to distort an accurate assessment of the divisional operating performance. Excluded items are Debt Valuation Adjustment (DVA) and material transactions or events that are either one-off in nature or belong to a portfolio of connected transactions or events where the P&L impact is limited to a specific period of time
Transformation charges are costs, included in adjusted costs, that are directly related to Deutsche Bank’s transformation as a result of the new strategy announced on 7 July 2019. Such charges include the transformation-related impairment of software and real estate, the quarterly amortization on software related to the Equities Sales and Trading business and other transformation charges like onerous contract provisions or legal and consulting fees related to the strategy execution
Transformation-related effects are financial impacts, in addition to transformation charges, resulting from the new strategy announced on 7 July 2019, which are recorded outside of adjusted costs. These include goodwill impairments in the second quarter 2019, as well as restructuring and severance expenses from the third quarter 2019 onwards. In addition to the aforementioned pre-tax items, transformation-related effects on a post-tax basis include pro-forma tax effects on the aforementioned items and deferred tax asset valuation adjustments in connection with the transformation the Group
Adjusted profit (loss) before tax is calculated by adjusting the profit (loss) before tax under IFRS for specific revenue items, transformation charges, impairment of goodwill and other intangible assets and restructuring and severance

Q1 2020 results 29 April 2020
Deutsche BankInvestor Relations
Revenues
Revenues ex. specific items
Core Bank financial highlightsQ1 2020, in € bn, unless otherwise stated
Risk weighted assets
of which Operational Risk
Leverage exposure (fully loaded)
Capital ReleaseUnit
Core Bank
Change vs. Q1 2019
32
(1) Transformation charges of € 55m in Core Bank and € 29m in Capital Release Unit in Q1 2020
(2) Profit (loss) before tax adjusted for specific revenue items, transformation charges as well as restructuring & severance costs and goodwill impairments. Detailed on slide 34
(3) Including expenses of € 98m incurred in Q1 2020 associated with the Prime Finance platform being transferred to BNP Paribas and which are consistent with those eligible for reimbursement under the terms of the transfer agreement. Reimbursement is effective from 1 December 2019
(0.1)
(0.1)
44
26
118
6%
(14)%
6%
(767)
(758)
6.4
6.4
296
46
1,130
7%
7%
973
1,060
17
32
Profit (loss) before tax (in € m)
Adjusted profit (loss) before tax (in € m)(2)
0.7
0.7(3)
4.9
4.8
(1)%
(4)%
Noninterest expenses
Adjusted costs ex. transformation charges(1)
Change vs. Q4 2019
7%
(1)%
9%
16%
16%
n.m.
128
(13)%
4%

Q1 2020 results 29 April 2020
Deutsche BankInvestor Relations
Q1 2020 Q1 2019 Q4 2019
CB IB PB AM C&OCore Bank
CRU Group CB IB PB AM C&OCore Bank
CRU Group CB IB PB AM C&OCore Bank
CRU Group
Revenues 1,326 2,339 2,162 519 63 6,409 (59) 6,350 1,342 1,988 2,125 525 (16) 5,964 387 6,351 1,299 1,523 1,979 671 56 5,528 (179) 5,349
DVA - IB Other / CRU - 46 - - - 46 24 70 - (49) - - - (49) - (49) - (14) - - - (14) (15) (29)
Change in valuation of an investment - FIC S&T
- (10) - - - (10) - (10) - 36 - - - 36 - 36 - 42 - - - 42 - 42
Sal. Oppenheim workout - Wealth Management
- - 16 - - 16 - 16 - - 43 - - 43 - 43 - - 21 - - 21 - 21
Revenues ex. specific items
1,326 2,303 2,145 519 63 6,357 (82) 6,275 1,342 2,000 2,082 525 (16) 5,933 387 6,320 1,299 1,495 1,958 671 56 5,478 (163) 5,315
Q1 2020 Q1 2019 Q4 2019
CB IB PB AM C&OCore Bank
CRU Group CB IB PB AM C&OCore Bank
CRU Group CB IB PB AM C&OCore Bank
CRU Group
Noninterest expenses 1,088 1,475 1,891 374 116 4,944 694 5,638 1,009 1,730 1,804 398 31 4,973 946 5,919 1,295 1,551 2,153 438 266 5,704 691 6,395
Impairment of goodwill and other intangible assets
- - - 0 - 0 - 0 - - - - - - - - (0) - (0) - - (0) - (0)
Litigation charges, net (0) 1 3 (0) 10 14 1 14 (0) (3) (22) (1) 3 (23) 6 (17) 8 (9) 18 (6) 138 149 63 213
Restructuring and severance
10 (2) 66 7 3 84 3 88 2 18 (18) 4 (3) 3 4 6 123 98 174 3 29 427 46 473
Adjusted costs 1,077 1,476 1,822 367 103 4,845 690 5,536 1,007 1,715 1,845 395 31 4,993 937 5,930 1,165 1,462 1,961 441 98 5,128 582 5,709
Transformation charges(1) 26 14 15 0 0 55 29 84 - - - - - - - - 154 134 174 21 40 524 83 608
Adjusted costs ex. transformation charges
1,052 1,462 1,807 366 103 4,791 661 5,452 1,007 1,715 1,845 395 31 4,993 937 5,930 1,011 1,328 1,787 419 58 4,603 498 5,102
Specific revenue items and Adjusted costsIn € m
33
(1) Definition on slide 31

Q1 2020 results 29 April 2020
Deutsche BankInvestor Relations
Adjusted profit (loss) before taxIn € m
34
(1) Definition on slide 31
Q1 2020 Q1 2019
PBT reportedSpecific
revenue items
Transfor-mation
charges(1)
Goodwill impairments
Restructuring & severance
PBT Adjusted PBT reportedSpecific
revenue items
Transfor-mation
charges(1)
Goodwill impairments
Restructuring & severance
PBT Adjusted
CB 132 - 26 - 10 168 288 - - - 2 290
IB 622 (36) 14 - (2) 598 250 12 - - 18 280
PB 132 (16) 15 - 66 197 214 (43) - - (18) 152
AM 110 - 0 0 7 118 97 - - - 4 101
C&O (24) - 0 - 3 (21) (15) - - - (3) (18)
Core Bank 973 (52) 55 0 84 1,060 833 (31) - - 3 805
CRU (767) (24) 29 - 3 (758) (541) - - - 4 (538)
Group 206 (76) 84 0 88 303 292 (31) - - 6 267
Q4 2019
PBT reportedSpecific
revenue items
Transfor-mation
charges(1)
Goodwill impairments
Restructuring & severance
PBT Adjusted
CB (100) - 154 (0) 123 176
IB (67) (28) 134 - 98 137
PB (293) (21) 174 (0) 174 35
AM 177 - 21 - 3 202
C&O (154) - 40 - 29 (85)
Core Bank (437) (49) 524 (0) 427 465
CRU (856) 15 83 - 46 (711)
Group (1,293) (34) 608 (0) 473 (246)

Q1 2020 results 29 April 2020
Deutsche BankInvestor Relations
Q1 2020 Q1 2019 YoYQ1 2019
ex FX(1)
YoYex FX
Q4 2019 QoQ
Compensation and benefits 2,675 2,842 (6)% 2,858 (6)% 2,605 3%
IT costs 942 954 (1)% 960 (2)% 1,392 (32)%
Professional service fees 224 270 (17)% 273 (18)% 285 (21)%
Occupancy 396 414 (4)% 416 (5)% 505 (22)%
Communication, data services, marketing 183 211 (13)% 213 (14)% 215 (15)%
Other 612 634 (3)% 642 (5)% 702 (13)%
Adjusted costs ex. bank levies 5,033 5,326 (6)% 5,362 (6)% 5,703 (12)%
Bank levies 503 604 (17)% 604 (17)% 6 n.m.
Adjusted costs 5,536 5,930 (7)% 5,966 (7)% 5,709 (3)%
Memo: Transformation charges 84 - n.m. - n.m. 608 (86)%
Memo: Adjusted costs ex. transformation charges 5,452 5,930 (8)% 5,966 (9)% 5,102 7%
Impairment of goodwill & other intangible assets 0 - n.m. - n.m. (0) n.m.
Litigation charges, net 14 (17) n.m. (17) n.m. 213 (93)%
Restructuring and severance 88 6 n.m. 7 n.m. 473 (81)%
Noninterest expenses 5,638 5,919 (5)% 5,956 (5)% 6,395 (12)%
Noninterest expense trends In € m, unless otherwise stated
(1) To exclude the FX effects the prior quarter figures were recalculated using the corresponding current quarter’s monthly FX rates
Re
co
nc
ilia
tio
na
dju
ste
dc
ost
sto
no
nin
tere
ste
xp
en
ses
35
Ad
just
ed
co
sts
inc
lud
ing
tra
nsf
orm
ati
on
ch
arg
es

Q1 2020 results 29 April 2020
Deutsche BankInvestor Relations
Q1 2020 Q1 2019 YoYQ1 2019
ex FX(1)
YoYex FX
Q4 2019 QoQ
Compensation and benefits 2,675 2,842 (6)% 2,858 (6)% 2,605 3%
IT costs 870 954 (9)% 960 (9)% 915 (5)%
Professional service fees 221 270 (18)% 273 (19)% 277 (20)%
Occupancy 388 414 (6)% 416 (7)% 382 2%
Communication, data services, marketing 183 211 (13)% 213 (14)% 215 (15)%
Other 611 634 (3)% 642 (5)% 702 (13)%
Adjusted costs ex. bank levies 4,948 5,326 (7)% 5,362 (8)% 5,095 (3)%
Bank levies 503 604 (17)% 604 (17)% 6 n.m.
Adjusted costs ex. transformation charges 5,452 5,930 (8)% 5,966 (9)% 5,102 7%
IT costs 72 - n.m. - n.m. 477 (85)%
Professional service fees 3 - n.m. - n.m. 8 (59)%
Occupancy 8 - n.m. - n.m. 123 (94)%
Other 1 - n.m. - n.m. (0) n.m.
Transformation charges 84 - n.m. - n.m. 608 (86)%
Adjusted costs 5,536 5,930 (7)% 5,966 (7)% 5,709 (3)%
Adjusted costs excluding transformation chargesIn € m, unless otherwise stated
(1) To exclude the FX effects the prior quarter figures were recalculated using the corresponding current quarter’s monthly FX rates
36
Ad
just
ed
co
sts
ex
clu
din
gtr
an
sfo
rma
tio
nc
ha
rge
sR
ec
on
cill
iati
on
Ad
just
ed
co
sts
ex
cl.
tra
nsf
orm
ati
on
ch
arg
es
toA
dju
ste
dc
ost
s

Q1 2020 results 29 April 2020
Deutsche BankInvestor Relations
Q1 2020 bridge from EU IFRS to IASB IFRSProfit (loss), in € m
37
66
(4)
IASBIFRS
(70)
EUIFRS
Impact from hedge accounting in C&O
— Deutsche Bank’s financial statements have historically been prepared based on the International Financial Reporting Standards (“IFRS”) as issued by the International Accounting Standards Board (“IASB”) and endorsed by the European Union (“EU”)
— From 2020, the Group will apply fair value hedge accounting for portfolio hedges of interest rate risk (macro hedging) under the EU carve out version of IAS 39 (EU IFRS). This results in a difference between IFRS as endorsed by the EU and IFRS as issued by the IASB
— Accordingly, the Group’s first quarter 2020 profit is € 70m higher under EU IFRS compared to IFRS as issued by the IASB (Profit before tax impact € 132m)
— To reflect reporting obligations in Germany and the US, Deutsche Bank is preparing separate sets of interim financial information from Q1 2020 onwards (i.e. locally: based on IFRS as endorsed by the EU; US: based on IFRS as issued by the IASB)

Q1 2020 results 29 April 2020
Deutsche BankInvestor Relations
Deposit charging
Charging agreements(1) , € bn
Quarterly revenue impact, € m
16
Q3 2019 Q4 2019
32
Q1 2020
<10
— Implemented charging agreements to pass through
negative interest rates to clients on a total of € 10bn of
deposit balances in the quarter
— Deposit attrition better than forecast with lower than
expected reduction in Euro deposits and growth in USD
deposits
— On track to generate an incremental € 100m in revenues
from passing through of negative interest rates in 2020,
ahead of plan
— Private Bank in Germany will include negative interest rate
charges in contracts for newly opened Euro current
accounts in excess of € 100k
— Actively advising retail customers to navigate through this
period of continued low interest rates
Q3 2019 Q4 2019
~40
Q1 2020
~20
~30
(1) Total € current account balances of corporate, institutional, commercial and private clients with implemented charging agreements. Individual charging thresholds apply
38

Q1 2020 results 29 April 2020
Deutsche BankInvestor Relations
65%
51%
84%
59%65%
13%
16%
27%
21%
20%
18% 22%11%
7%14%
Euro
PrivateBank
CorporateBank
0%
0%
AssetManagement
Investment Bank
0%
1%
US$
Group
Other(1)
GB Pound
4%
61%
11%
86%
55% 52%
8%
41%
1%
13% 17%
16%
33%
27%18%
16% 15%9% 5%
13%
CorporateBank
4%
Investment Bank
Group
Other(1)
PrivateBank
AssetManagement
US$
GB Pound
Euro
39
Q1 2020 indicative regional currency mix
Net revenues Total noninterest expenses
Note: Classification is based primarily on the currency of Group office in which the revenues and noninterest expenses are recorded and therefore only provide an indicative approximation(1) Primarily includes Singapore Dollar, Indian Rupee, and Hong Kong Dollar

Q1 2020 results 29 April 2020
Deutsche BankInvestor Relations
Net interest income sensitivityHypothetical +100 bps parallel shift impact, in € bn
40
Note: Estimates are based on a static balance sheet, excluding trading positions & DWS, and at constant exchange rates. The parallel yield curve shift by +100 basis points assumes an immediateincrease of all interest rate tenors and no additional management action. Figures do not include Mark-to-Market / Other Comprehensive Income effects on centrally managed positions noteligible for hedge accounting. Unchanged rates impact estimated as delta between annualized last quarter’s NII and first and second 12 months’ NII forecast under unchanged interest ratesrespectively
> 3M
≤ 3M
> 3M
≤ 3M
0.2
0.3
0.0
0.5
0.2
0.8
0.0
0.0
0.0
0.1
0.0
0.1
EU
RU
SD
0.5
0.3
0.0
0.5
0.5
0.7
0.0
0.0
0.1
0.1
0.1
0.1
> 3M
≤ 3M
> 3M
≤ 3M
EU
RU
SD
First year Second year
Maturity Maturity
0.80.6
Retail Non-retail
1.4
GroupGroup
0.6
Retail
1.1
Non-retail
0.5
Q1 2020 results 29 April 2020
Deutsche BankInvestor Relations
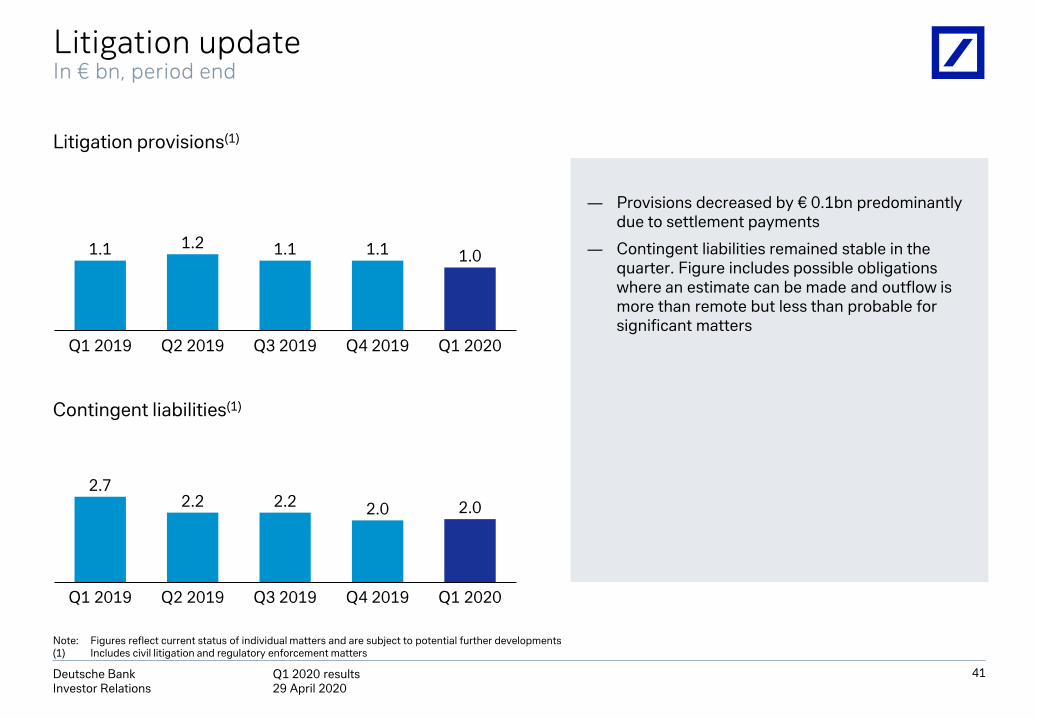
Note: Figures reflect current status of individual matters and are subject to potential further developments(1) Includes civil litigation and regulatory enforcement matters
Litigation updateIn € bn, period end
41
― Provisions decreased by € 0.1bn predominantly due to settlement payments
― Contingent liabilities remained stable in the quarter. Figure includes possible obligations where an estimate can be made and outflow is more than remote but less than probable for significant matters
Litigation provisions(1)
Contingent liabilities(1)
1.1 1.2 1.1 1.1 1.0
Q2 2019Q1 2019 Q3 2019 Q4 2019 Q1 2020
2.72.2 2.2 2.0 2.0
Q1 2019 Q2 2019 Q3 2019 Q4 2019 Q1 2020

Q1 2020 results 29 April 2020
Deutsche BankInvestor Relations
Loan bookIn € bn, period end
149 148 150 152 154
32 32 33 32 32
69 6974 75 87
47 4849 50
50
65 6666 66
65
Investment Bank(1)
3
5
42
5
5
2
434
41
5
Q2 2019
5
43
Q4 2019
4
431
8
419
Q3 2019
4
Private & CommercialBusiness International
43Wealth Management
Strategic Corporate Lending
4
Global Transaction Banking
8
15
44
8
Q1 2020
Commercial Banking
Private Bank Germany
415
5
Capital Release Unit(1)
Q1 2019
Other(2)
459
16%
27%
5%
1%
3%
7%
Change vs. Q1 2019
Reported
42
ex. FX
16%
27%
4%
1%
3%
7%
Note: Loan amounts are gross of allowances for loan losses(1) Historic balances restated due to the transfer of the Corporate Margin Lending from the Capital Release Unit to the Investment Bank
(2) Mainly Corporate & Other
n.m. n.m.

Q1 2020 results 29 April 2020
Deutsche BankInvestor Relations
43
Private Bank Corporate BankInvestment Bank
OtherCapital Release Unit
— Well diversified Loan Portfolio. The gross
position of loans at amortized cost is
€ 459bn as of Q1 2020
— 50% of loan portfolio in Private Bank,
mainly consisting of German retail
mortgages and Wealth Management
— 28% of loan portfolio in Corporate Bank,
with loans in Global Transaction Banking
(predominantly trade finance to corporate
and institutional clients) and Commercial
Banking (various loan products to Midcap
and SME clients in Germany)
— Investment Bank comprises well-secured,
mainly asset backed loans, commercial real
estate loans and collateralized financing.
Well-positioned to withstand downside
risks due to conservative underwriting
standards and risk appetite frameworks
limiting concentration riskNote: Loan amounts are gross of allowances for loan losses(1) Mainly Corporate & Other
(2) Previously captured under Global Transaction Banking
(3) Commercial Real Estate Group in Investment Bank and non-recourse Commercial Real Estate business in the Corporate Bank
(4) Includes APAC Commercial Real Estate exposures
29%
4%
5%
10%14%
9%
3%
4%
7%
5%
InternationalMortgages
German Mortgages
Consumer Finance
Commercial Banking
2%
Business Finance
StrategicCorporate Lending(2)
Wealth ManagementGlobal Transaction Banking
Leveraged Debt Capital Markets
2%CB - Commercial Real
Estate(3)
Capital Release Unit
Asset Backed Securities
IB - Commercial Real Estate(3)
2%
IB Other(4)
1%2%
Other(1)
Loan book compositionAs of 31 March 2020

Q1 2020 results 29 April 2020
Deutsche BankInvestor Relations
Provision for credit losses and stage 3 loans
10762 55
119 139
4461 74
104 10644
243
(8)(18)
267
Q1
20
Q2 Q3
175
(14)
38
Q4
14
Q1
140 161
247
506
Corporate Bank
Private Bank Investment Bank
Capital Release Unit
4.5 4.4 4.5 4.5 4.8
1.5 1.8 1.7 1.9 2.00.8
0.52.3 2.2 2.3 2.2
2.1
Q3
0.60.7
0.70.5
Q1
0.6
Q2
0.5
Q4
0.6 0.8
Q1
9.6 9.8 9.8 9.7 10.1
PB (ex-POCI)
CB (ex-POCI)
IB (ex-POCI)
CRU (ex-POCI)
Purchased or Originated Credit Impaired (POCI)
Group Stage 3 at amortized cost %(2)
2.3% 2.3% 2.3% 2.2% 2.2%
Provision for credit losses, € m Stage 3 at amortised cost, € bn
Provision for credit losses(% of loans)(1) 2020 2019
Coverage Ratio (3)
Group Group
2020 2019
CBCB
PBPB
44
Note: Provisions for credit losses in the Corporate & Other and Asset Management segments are not shown on this chart but are included in the DB Group totals(1) 2020 Year-to-date provision for credit losses annualized as % of loans at amortized cost (€ 459bn as of 31 March 2020)
(2) IFRS 9 stage 3 financial assets at amortized cost including POCI as % of loans at amortized cost (€ 459bn as of 31 March 2020)
(3) IFRS 9 stage 3 allowance for credit losses for financial assets at amortized cost excluding POCI divided by stage 3 financial assets at amortized cost excluding POCI
IB
39%
47%
39%
18%
40%
44%
41%
16%IB
0.13%
0.15%
0.19%
0.04%
0.17%
0.24%
0.15%
0.14%
0.44%
0.33%
1.11%
0.24%
0.15%
0.20%
0.13%
0.13%
0.14%
0.18%
0.15%
0.15%
40%
44%
41%
20%
44%
52%
45%
23%
41%
46%
42%
17%

Q1 2020 results 29 April 2020
Deutsche BankInvestor Relations
Level 3 assets As of 31 March 2020, in € bn
— Level 3 is an indicator of valuation uncertainty and not of asset quality
— Increase in Level 3 assets in the quarter almost all in derivative market values, driven by
— Net transfers due to the recent dispersion in market pricing (expected to materially reverse as markets normalize)
— Increased market values on existing Level 3 derivatives due to movements in Interest rates (materially offset by equivalent increases in Level 3 liabilities)
— The Capital Release Unit accounts for € 8bn of Level 3 assets
— Variety of mitigants to valuation uncertainty
— Prudent Valuation capital deductions(2)
specific to Level 3 balances of ~€ 0.7bn
— Uncertain inputs often hedged
— Exchange of collateral with derivative counterparties
— Portfolios are not static with significant turnover every year
134
DerivativeAssets
1
8
Debtsecurities
Loans
2Other
Equity securities
0
Mortgage backed securities
Assets (total: € 28bn)
45
[8]
Movements in balances
31 Dec 2019
Sales/ Settlements
2
(2)
Purchases/ Issuances
2
Net transfers
to L3
Increased market values
20
8
31 Mar 2020
24
2 28
(1)
(1) Issuances include cash amounts paid on the primary issuance of a loan to a borrower(2) Additional value adjustments deducted from CET 1 capital pursuant to Article 34 of Regulation (EU) No. 2019/876 (CRR)
COVID-19 impacts on derivative Level
3 assetsCRU

Q1 2020 results 29 April 2020
Deutsche BankInvestor Relations
Leverage exposure and risk weighted assetsCRD4, fully loaded, in € bn, period end
46
250
Q1 2020
Operational Risk RWA 72
255
238
Market Risk RWA
Credit valuationadjustments
Credit Risk RWA
341
147
Lending commitments(2)
89
103
431
Cash and depositswith banks
116
197
161
Q1 2020
455
95
124
135
72
31
28
93
8
33
3
42
Lending
Trading assets
1,248
Reverse repo /securitiesborrowed
Derivatives(1)
Q4 2019
Other 137
Q1 2020
109
148
1,168
341
(1) Excludes any related market risk risk weighted assets which have been fully allocated to non-derivatives trading assets(2) Includes contingent liabilities
Leverage exposure Risk weighted assets

Q1 2020 results 29 April 2020
Deutsche BankInvestor Relations
Stressed Value at Risk(1)
Value at Risk
Q3 2019Q1 2019 Q2 2019
(1) Stressed Value-at-Risk is calculated on the same portfolio as Value at Risk but uses historical market data from a period of significant financial stress (i.e. characterized by high volatility and extreme price movements)
Quarterly average
Q4 2019
0
20
40
60
80
100
120
Q1 2020
72
24
86 87 79
30 27 28
79
25
47
Trading book Value at RiskDB Group, 99%, 1 day, in € m, unless otherwise stated

Q1 2020 results 29 April 2020
Deutsche BankInvestor Relations
(1) Assets under Management have been restated in prior periods to reflect an asset reclassification(2) Deposits are considered assets under management if they serve investment purposes. In Private Bank Germany and Private & Commercial Business International, this includes
all time deposits and savings deposits. In Wealth Management, it is assumed that all customer deposits are held with us primarily for investment purposes; Wealth Management deposits under discretionary and wealth advisory mandate type were reported as Investment products
(3) Investment products also include insurances (4) Regional view is based on a client view(5) Net flows as reported also include shifts between Deposits and Investment Products
48
Assets under Management – Private BankIn € bn
Q1 2019 Q2 2019 Q3 2019 Q4 2019 Q1 2020
Assets under Management (1) 473 478 481 482 442
Private Bank Germany 207 211 211 213 197
therein: Deposits (2) 106 108 106 104 106
therein: Investment Products (3) 102 103 105 109 91
Private & Commercial Business International 59 60 60 59 53
therein: Deposits (2) 10 10 10 9 9
therein: Investment Products (3) 49 50 50 50 44
Wealth Management (1) 206 206 211 210 192
by product:
Deposits (2) 53 54 54 51 49
Investment Products (1),(3) 153 153 157 159 143
by region: (4)
Americas 28 28 28 28 25
Germany 85 86 87 85 76
Europe 29 30 31 30 30
Emerging Markets 64 63 65 66 61
Net flows - Assets under Management 6.5 4.4 (1.1) (5.7) 0.7
Private Bank Germany 4.1 3.1 (1.4) (1.5) 0.6
therein: Deposits (2),(5) 3.5 2.3 (2.2) (1.5) (0.8)
therein: Investment Products (3),(5) 0.6 0.7 0.8 0.0 1.3
Private & Commercial Business International (0.5) 0.6 (0.8) (1.2) (0.6)
therein: Deposits (2),(5) (0.3) 0.1 (0.4) (0.3) (0.2)
therein: Investment Products (3),(5) (0.2) 0.5 (0.4) (0.9) (0.4)
Wealth Management 2.8 0.7 1.1 (3.0) 0.7
therein: Deposits (2),(5) 1.5 0.7 (0.7) (2.2) (2.1)
therein: Investment Products (3),(5) 1.3 (0.0) 1.9 (0.7) 2.8

Q1 2020 results 29 April 2020
Deutsche BankInvestor Relations
Reconciliation of Asset Management segment to DWSProfit before tax, in € m
49
27
35
Sold & discontinued businesses
Noncontrolling minority interest
Asset Management reported
173
0
DB group allocation / Fundingcharges
1
Other perimeter adjustments
DWS Reported
110
28
30
Asset Management reported
0
Sold & discontinued businesses
DB group allocation / Funding charges
Noncontrolling minority interest
(8)
Other perimeter adjustments
DWS Reported
97
148
Q1 2020
Q1 2019
Note: Other perimeter adjustments include adjustments for IPO related costs and adjustments due to differences in accounting for DWS and Asset Management segment

Q1 2020 results 29 April 2020
Deutsche BankInvestor Relations
Cautionary statements
50
This presentation contains forward-looking statements. Forward-looking statements are statements that are not
historical facts; they include statements about our beliefs and expectations and the assumptions underlying them.
These statements are based on plans, estimates and projections as they are currently available to the management of
Deutsche Bank. Forward-looking statements therefore speak only as of the date they are made, and we undertake no
obligation to update publicly any of them in light of new information or future events.
By their very nature, forward-looking statements involve risks and uncertainties. A number of important factors could
therefore cause actual results to differ materially from those contained in any forward-looking statement. Such factors
include the conditions in the financial markets in Germany, in Europe, in the United States and elsewhere from which
we derive a substantial portion of our revenues and in which we hold a substantial portion of our assets, the
development of asset prices and market volatility, potential defaults of borrowers or trading counterparties, the
implementation of our strategic initiatives, the reliability of our risk management policies, procedures and methods,
and other risks referenced in our filings with the U.S. Securities and Exchange Commission. Such factors are described
in detail in our SEC Form 20-F of 20 March 2020 under the heading “Risk Factors.” Copies of this document are
readily available upon request or can be downloaded from www.db.com/ir.
This presentation also contains non-IFRS financial measures. For a reconciliation to directly comparable figures
reported under IFRS, to the extent such reconciliation is not provided in this presentation, refer to the Q1 2020
Financial Data Supplement, which is accompanying this presentation and available at www.db.com/ir.