q1 2019 md&a - new cannabis ventures€¦ · 4 aurora cannabis inc. q1 2019 md&a aurora’s...
TRANSCRIPT

Q1 2019 MD&A

Aurora intends to be a leader in the domestic adult consumer use market as well as the domestic and international medical cannabis space, both in terms of scale and profitability. To achieve this, the Company has identified a number of factors it deems critical in driving its strategy.
Consequently, Aurora has been executing on an aggressive growth strategy that is focused on developing a vertically integrated company with a diversified portfolio offering.
This dynamic growth strategy focuses on the following areas to ultimately better enable Aurora to capture greater margin across the entire cannabis industry value chain:
Meeting the Critical Success Factors: Capturing Margin Throughout the Cannabis Value Chain
SCALEDevelop large scale, highly efficient production capacity in diverse geographic markets to serve the global demand for medical cannabis.
INNOVATIONDevelop, adopt and acquire innovations across the entire cannabis industry value chain to deliver efficiencies and cre-ate competitive advantages.
SCIENCEDevelop and acquire mar-ketable intellectual property while strengthening our global medical brand and generating increased visibility
BRANDSCreate unique brands and customer experiences that resonate both with the medical community and the adult consumer use market to help capture market share.
DIVERSIFICATIONDevelop a broad portfolio of high value-add products to deliver higher margins.
COST OF PRODUCTIONAdopt a purpose-built, high-technology, automated, yield optimized facility model that is replicable across the Company’s different markets, ensuring consistently high- quality cannabis products, produced at low costs.
DISTRIBUTIONDevelop strong domestic and international distribution part-ners and networks to ensure a broad market reach
2 Aurora Cannabis Inc. Q1 2019 MD&A
Aurora Cannabis Inc. Q1 2019 MD&A 3
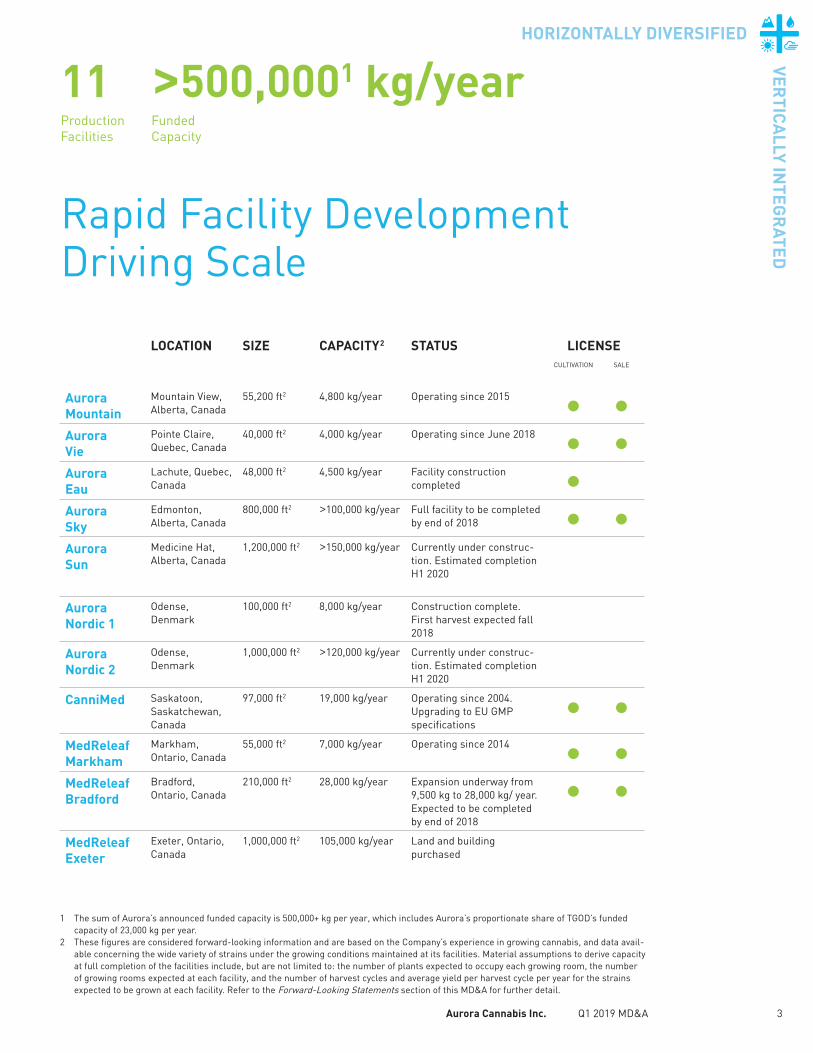
Rapid Facility Development Driving Scale
LOCATION SIZE CAPACITY2 STATUS LICENSECULTIVATION SALE
Aurora Mountain
Mountain View, Alberta, Canada
55,200 ft2 4,800 kg/year Operating since 2015 • •Aurora Vie
Pointe Claire, Quebec, Canada
40,000 ft2 4,000 kg/year Operating since June 2018 • •Aurora Eau
Lachute, Quebec, Canada
48,000 ft2 4,500 kg/year Facility construction completed •
Aurora Sky
Edmonton, Alberta, Canada
800,000 ft2 >100,000 kg/year Full facility to be completed by end of 2018 • •
Aurora Sun
Medicine Hat, Alberta, Canada
1,200,000 ft2 >150,000 kg/year Currently under construc-tion. Estimated completion H1 2020
Aurora Nordic 1
Odense, Denmark
100,000 ft2 8,000 kg/year Construction complete. First harvest expected fall 2018
Aurora Nordic 2
Odense, Denmark
1,000,000 ft2 >120,000 kg/year Currently under construc-tion. Estimated completion H1 2020
CanniMed Saskatoon, Saskatchewan, Canada
97,000 ft2 19,000 kg/year Operating since 2004. Upgrading to EU GMP specifications
• •MedReleaf Markham
Markham, Ontario, Canada
55,000 ft2 7,000 kg/year Operating since 2014 • •MedReleaf Bradford
Bradford, Ontario, Canada
210,000 ft2 28,000 kg/year Expansion underway from 9,500 kg to 28,000 kg/ year. Expected to be completed by end of 2018
• •MedReleaf Exeter
Exeter, Ontario, Canada
1,000,000 ft2 105,000 kg/year Land and building purchased
11Production Facilities
>500,0001 kg/yearFunded Capacity
1 The sum of Aurora’s announced funded capacity is 500,000+ kg per year, which includes Aurora’s proportionate share of TGOD’s funded capacity of 23,000 kg per year.
2 These figures are considered forward-looking information and are based on the Company’s experience in growing cannabis, and data avail-able concerning the wide variety of strains under the growing conditions maintained at its facilities. Material assumptions to derive capacity at full completion of the facilities include, but are not limited to: the number of plants expected to occupy each growing room, the number of growing rooms expected at each facility, and the number of harvest cycles and average yield per harvest cycle per year for the strains expected to be grown at each facility. Refer to the Forward-Looking Statements section of this MD&A for further detail.
VERTICA
LLY INTEG
RATED
HORIZONTALLY DIVERSIFIED
4 Aurora Cannabis Inc. Q1 2019 MD&A
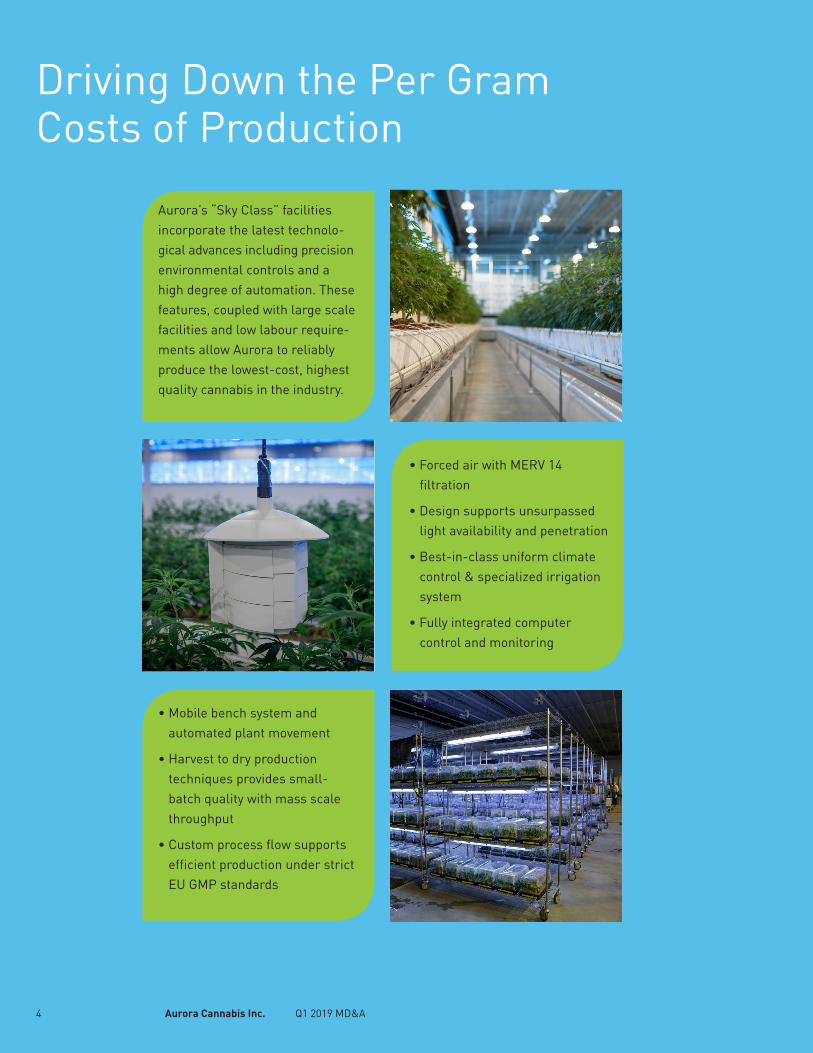
Aurora’s “Sky Class” facilities incorporate the latest technolo- gical advances including precision environmental controls and a high degree of automation. These features, coupled with large scale facilities and low labour require-ments allow Aurora to reliably produce the lowest-cost, highest quality cannabis in the industry.
• Mobile bench system and automated plant movement
• Harvest to dry production techniques provides small- batch quality with mass scale throughput
• Custom process flow supports efficient production under strict EU GMP standards
• Forced air with MERV 14 filtration
• Design supports unsurpassed light availability and penetration
• Best-in-class uniform climate control & specialized irrigation system
• Fully integrated computer control and monitoring
Driving Down the Per Gram Costs of Production

Aurora Cannabis Inc. Q1 2019 MD&A 5
CanvasRx, a wholly owned subsidiary of Aurora, is Canada’s trusted resource and marketplace, enabling you to develop a better understanding of medical marijuana and its various strains and uses, as well as information on licensed producers in Canada. With 35 clinics in operation nationwide, CanvasRx is a leading Canadian network of cannabis counseling and outreach centres. To date CanvasRx has assisted more than 55,000 patients. Over 11,000 physicians across Canada have referred patients to CanvasRx and its affiliated medical clinics.
Diverse and Expansive Domestic Medical Distribution Networks
Aurora has entered into agreements to collaborate with PharmaChoice, Pharmasave and Shoppers Drug Mart on the distribution, sale and marketing of medical cannabis products through their respective networks of pharmacies, subject to Health Canada approval.
This collaboration will see Aurora produce and deliver accredited pharmacy education programs to Canadian pharmacists and eventually distribute medical cannabis through pharmacists across Canada.
VERTICA
LLY INTEG
RATED
HORIZONTALLY DIVERSIFIED
6 Aurora Cannabis Inc. Q1 2019 MD&A
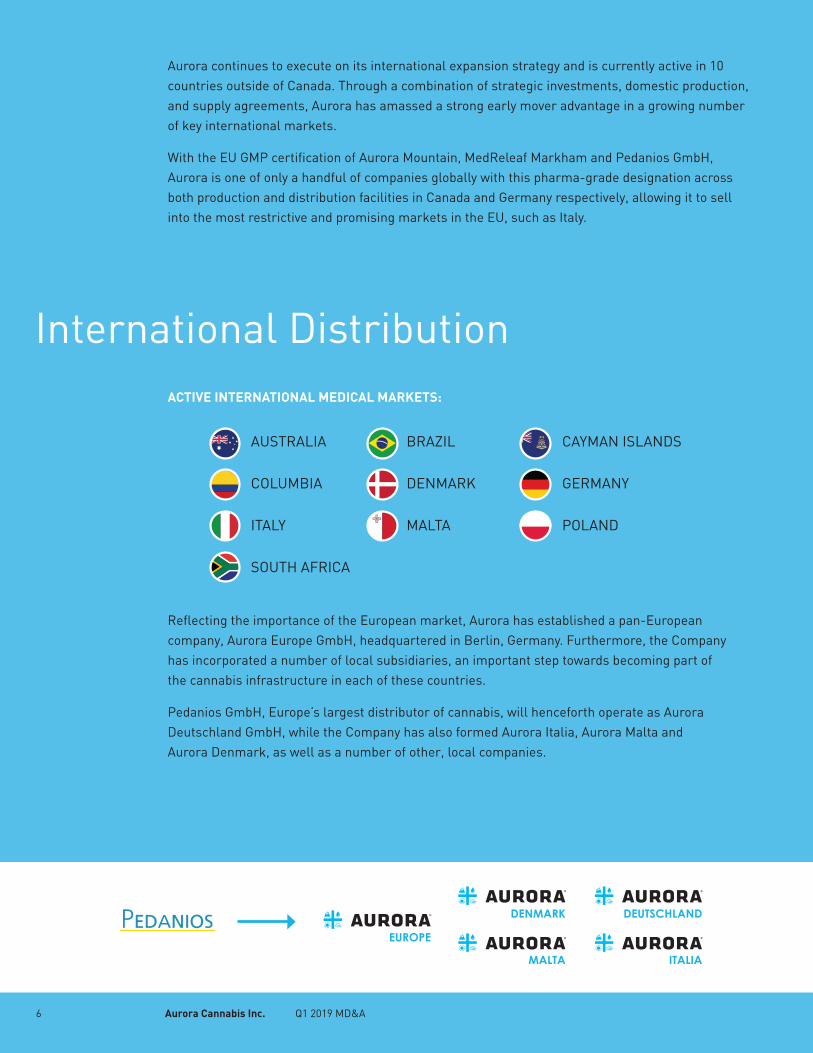
International Distribution
Aurora continues to execute on its international expansion strategy and is currently active in 10 countries outside of Canada. Through a combination of strategic investments, domestic production, and supply agreements, Aurora has amassed a strong early mover advantage in a growing number of key international markets.
With the EU GMP certification of Aurora Mountain, MedReleaf Markham and Pedanios GmbH, Aurora is one of only a handful of companies globally with this pharma-grade designation across both production and distribution facilities in Canada and Germany respectively, allowing it to sell into the most restrictive and promising markets in the EU, such as Italy.
Reflecting the importance of the European market, Aurora has established a pan-European company, Aurora Europe GmbH, headquartered in Berlin, Germany. Furthermore, the Company has incorporated a number of local subsidiaries, an important step towards becoming part of the cannabis infrastructure in each of these countries.
Pedanios GmbH, Europe’s largest distributor of cannabis, will henceforth operate as Aurora Deutschland GmbH, while the Company has also formed Aurora Italia, Aurora Malta and Aurora Denmark, as well as a number of other, local companies.
ACTIVE INTERNATIONAL MEDICAL MARKETS:
AUSTRALIA BRAZIL CAYMAN ISLANDS
COLUMBIA DENMARK GERMANY
ITALY MALTA POLAND
SOUTH AFRICA
EUROPE
DENMARK DEUTSCHLAND
MALTA ITALIA

Aurora Cannabis Inc. Q1 2019 MD&A 7
TAILORED CONSUMER RETAIL EXPERIENCES
Aurora and Alcanna have created a unique and engaging, state-of-the-art consumer retail concept that aims to deliver an inviting, inclusive, and educational experience. The stores will feature a variety of brands, including Aurora, MedReleaf and CanniMed as well as a selection of products from other Canadian Licensed Producers. As permitted, Alcanna intends to open additional retail stores across Canada.
• Alcanna will build, own and operate the new cannabis stores, leveraging its experience and expertise as a responsible retailer of controlled substances.
• Alcanna is currently converting several of its existing liquor stores into cannabis retail outlets and will work with commercial landlords to secure a multitude of locations where permitted.
• Alcanna will retain Aurora through CanvasRx, CanniMed and MedReleaf, which have deep experience working with cannabis users, and unparalleled data regarding efficacy and customer experience to assist in training its in-store associates known as Category Specialists.
Adult Consumer-Use Market Distribution Platforms
BRITISH COLUMBIA
NORTHWEST TERRITORIES
YUKON
SASKATCHEWANMANITOBA
PEI
NEWFOUNDLAND
NOVA SCOTIA
NEW BRUNSWICK
ALBERTA
ONTARIOQUÉBEC
Aurora has completed and is in the process of completing agreements with provincial regulators to supply cannabis for the entire Canadian adult consumer market, once legalized. Under the terms of these current and prospective agreements, Aurora will supply the provinces with a wide variety of premium product from its facilities. Supply quantities will be determined based on demand on an ongoing basis.
VERTICA
LLY INTEG
RATED
HORIZONTALLY DIVERSIFIED
8 Aurora Cannabis Inc. Q1 2019 MD&A
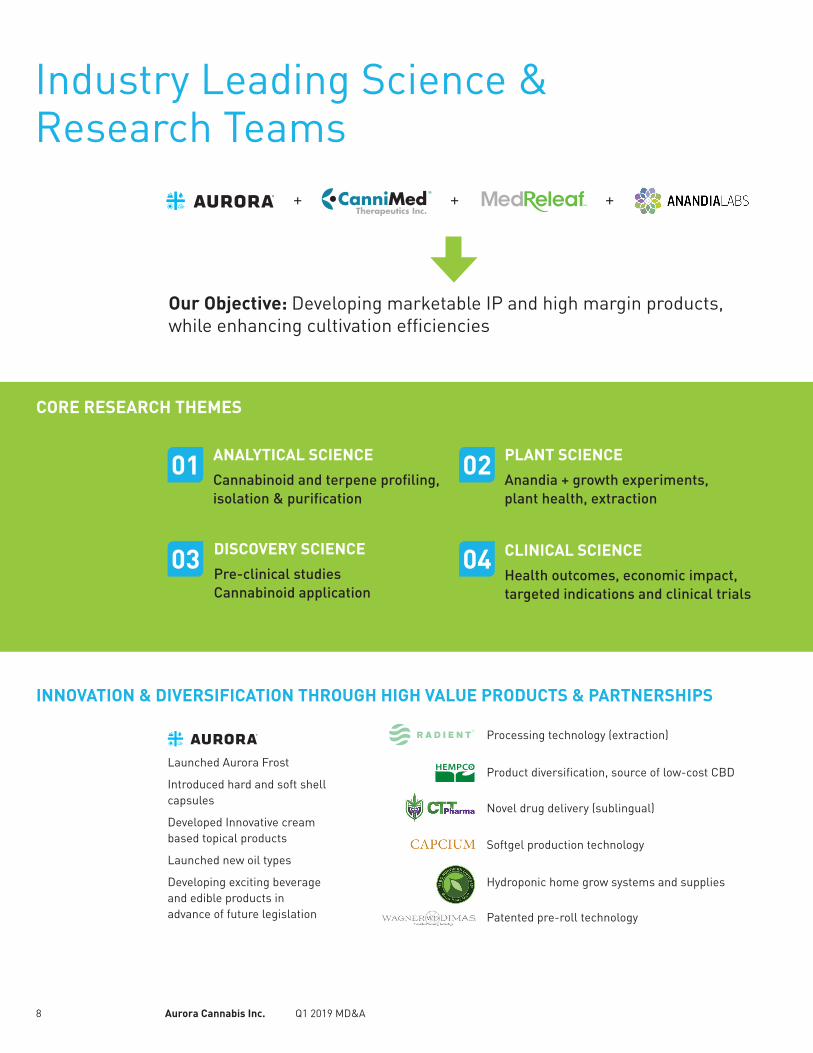
CORE RESEARCH THEMES
INNOVATION & DIVERSIFICATION THROUGH HIGH VALUE PRODUCTS & PARTNERSHIPS
Our Objective: Developing marketable IP and high margin products, while enhancing cultivation efficiencies
Industry Leading Science & Research Teams
Launched Aurora Frost
Introduced hard and soft shell capsules
Developed Innovative cream based topical products
Launched new oil types
Developing exciting beverage and edible products in advance of future legislation
ANALYTICAL SCIENCE
Cannabinoid and terpene profiling, isolation & purification
DISCOVERY SCIENCE
Pre-clinical studiesCannabinoid application
CLINICAL SCIENCE
Health outcomes, economic impact, targeted indications and clinical trials
PLANT SCIENCE
Anandia + growth experiments, plant health, extraction
+++
01
03
02
04
Processing technology (extraction)
Product diversification, source of low-cost CBD
Novel drug delivery (sublingual)
Softgel production technology
Hydroponic home grow systems and supplies
Patented pre-roll technology

Aurora Cannabis Inc. Q1 2019 MD&A 9
Aurora has secured a broadly diversified portfolio of three recognizable and well- established cannabis brands, including Aurora, CanniMed and MedReleaf, and consumer and wellness brands, such as San Rafael ‘71, Woodstock and AltaVie.
These brands are backed by award-winning products, detailed consumer and marketplace insights and advanced analytical frameworks.
Strong Medical & Adult Consumer Use Brands
DATA DRIVEN DEVELOPMENT • EXPERT GUIDED EXECUTION
VERTICA
LLY INTEG
RATED
HORIZONTALLY DIVERSIFIED
10 Aurora Cannabis Inc. Q1 2019 MD&A
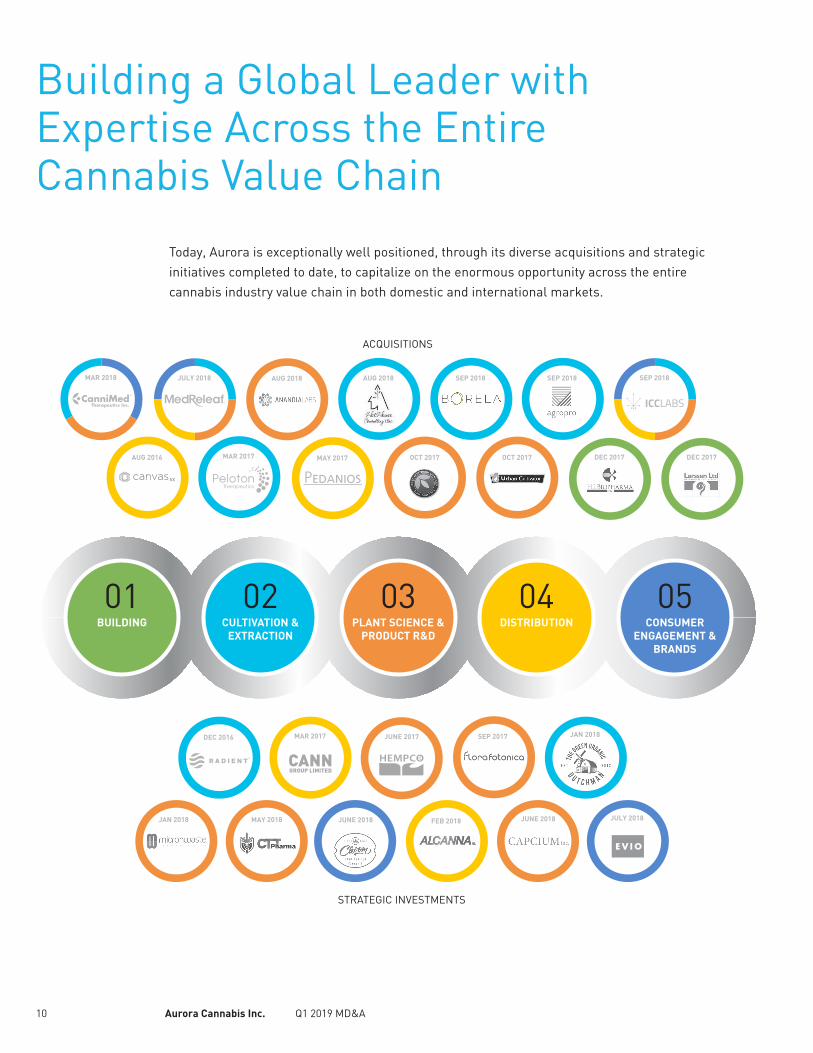
Building a Global Leader with Expertise Across the Entire Cannabis Value Chain
Today, Aurora is exceptionally well positioned, through its diverse acquisitions and strategic initiatives completed to date, to capitalize on the enormous opportunity across the entire cannabis industry value chain in both domestic and international markets.
ACQUISITIONS
STRATEGIC INVESTMENTS
OCT 2017
OCT 2017
DEC 2017
DEC 2017
MAR 2018
JULY 2018
SEP 2018
AUG 2016
AUG 2018
AUG 2018
MAY 2017 MAR 2017
DEC 2016
JUNE 2018
JUNE 2017 SEP 2017
JAN 2018
JAN 2018 JUNE 2018 JULY 2018
MAY 2018 FEB 2018
MAR 2017
01BUILDING
05CONSUMER
ENGAGEMENT & BRANDS
04DISTRIBUTION
03PLANT SCIENCE &
PRODUCT R&D
02CULTIVATION &
EXTRACTION
SEP 2018 SEP 2018

11 | Aurora Cannabis Inc. Q1 2019 MD&A
Management Discussion & Analysis
Table of Contents
About Aurora ........................................................................................................................................................................................... 13
Summary of Financial Results ................................................................................................................................................................ 14
Key Developments During Q1 2019 ..................................................................................................................................................... 16
Key Developments Subsequent to September 30, 2018 .................................................................................................................. 19
Financial Review ..................................................................................................................................................................................... 20
Liquidity and Capital Resources ........................................................................................................................................................... 24
Related Party Transactions .................................................................................................................................................................... 26
Critical Accounting Estimates ............................................................................................................................................................... 27
New or Amended Standards Effective July 1, 2018 .......................................................................................................................... 27
Recent Accounting Pronouncements ................................................................................................................................................ 29
Financial Instruments and Other Instruments...................................................................................................................................... 30
Financial Instruments Risk ....................................................................................................................................................................... 32
Summary of Outstanding Share Data ................................................................................................................................................. 33
Summary of Quarterly Results ............................................................................................................................................................... 34
Risk Factors ............................................................................................................................................................................................... 35
Internal Controls over Financial Reporting .......................................................................................................................................... 35
Forward-Looking Statements ................................................................................................................................................................ 36
12 | Aurora Cannabis Inc. Q1 2019 MD&A
This Management’s Discussion and Analysis (“MD&A”) reports on the consolidated financial condition and operating results
of Aurora Cannabis Inc. (“the Company” or “Aurora”) for the three month period ended September 30, 2018 and has
been prepared pursuant to the MD&A disclosure requirements under National Instrument 51-102 - Continuous Disclosure
Obligations (“NI 51-102”) of the Canadian Securities Administrators. The Company’s continuous disclosure documents,
including Annual Information Form (“AIF”), are available on SEDAR at www.sedar.com.
This MD&A should be read in conjunction with the Company’s unaudited Condensed Interim Consolidated Financial
Statements for the three month period ended September 30, 2018 and notes thereto (the “Interim Financial Statements”),
and the audited consolidated financial statements for the year ended June 30, 2018 and the notes thereto, which have
been prepared in accordance with International Financial Reporting Standards (“IFRS”).
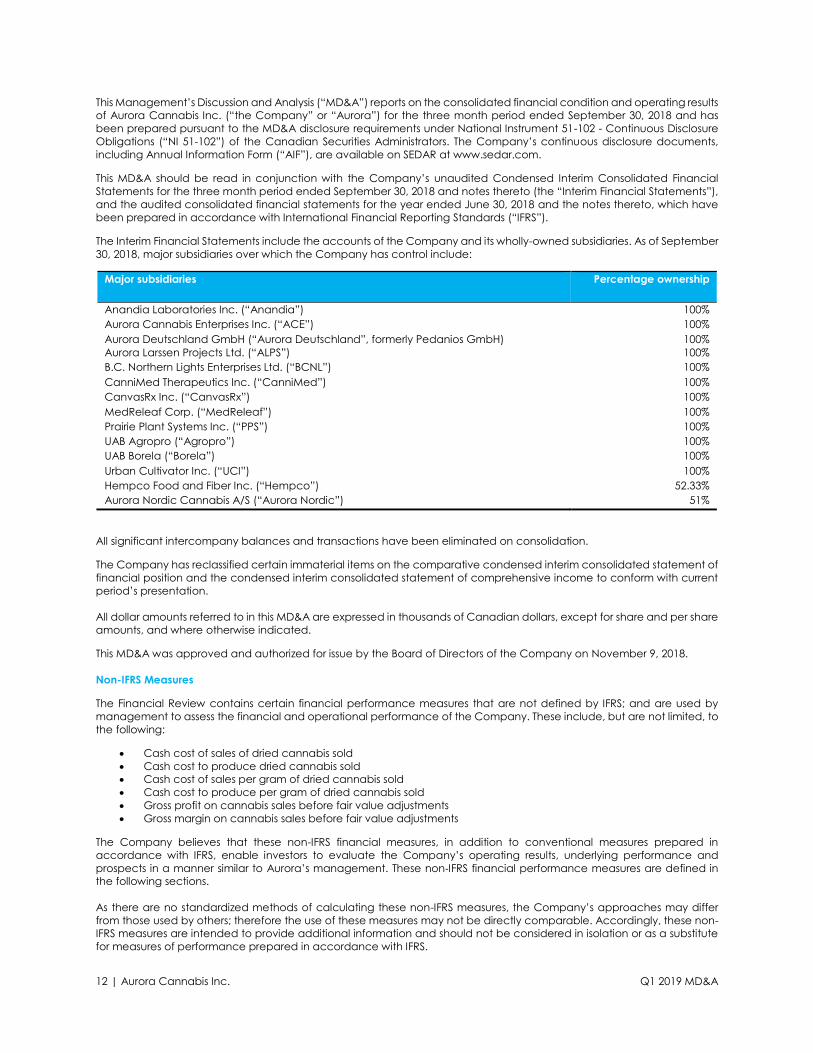
The Interim Financial Statements include the accounts of the Company and its wholly-owned subsidiaries. As of September
30, 2018, major subsidiaries over which the Company has control include:
Major subsidiaries Percentage ownership
Anandia Laboratories Inc. (“Anandia”) 100%
Aurora Cannabis Enterprises Inc. (“ACE”) 100%
Aurora Deutschland GmbH (“Aurora Deutschland”, formerly Pedanios GmbH) 100%
Aurora Larssen Projects Ltd. (“ALPS”) 100%
B.C. Northern Lights Enterprises Ltd. (“BCNL”) 100%
CanniMed Therapeutics Inc. (“CanniMed”) 100%
CanvasRx Inc. (“CanvasRx”) 100%
MedReleaf Corp. (“MedReleaf”) 100%
Prairie Plant Systems Inc. (“PPS”) 100%
UAB Agropro (“Agropro”) 100%
UAB Borela (“Borela”) 100%
Urban Cultivator Inc. (“UCI”) 100%
Hempco Food and Fiber Inc. (“Hempco”) 52.33%
Aurora Nordic Cannabis A/S (“Aurora Nordic”) 51%
All significant intercompany balances and transactions have been eliminated on consolidation.
The Company has reclassified certain immaterial items on the comparative condensed interim consolidated statement of
financial position and the condensed interim consolidated statement of comprehensive income to conform with current
period’s presentation.
All dollar amounts referred to in this MD&A are expressed in thousands of Canadian dollars, except for share and per share
amounts, and where otherwise indicated.
This MD&A was approved and authorized for issue by the Board of Directors of the Company on November 9, 2018.
Non-IFRS Measures
The Financial Review contains certain financial performance measures that are not defined by IFRS; and are used by
management to assess the financial and operational performance of the Company. These include, but are not limited, to
the following:
• Cash cost of sales of dried cannabis sold
• Cash cost to produce dried cannabis sold
• Cash cost of sales per gram of dried cannabis sold
• Cash cost to produce per gram of dried cannabis sold
• Gross profit on cannabis sales before fair value adjustments
• Gross margin on cannabis sales before fair value adjustments
The Company believes that these non-IFRS financial measures, in addition to conventional measures prepared in
accordance with IFRS, enable investors to evaluate the Company’s operating results, underlying performance and
prospects in a manner similar to Aurora’s management. These non‑IFRS financial performance measures are defined in
the following sections.
As there are no standardized methods of calculating these non-IFRS measures, the Company’s approaches may differ
from those used by others; therefore the use of these measures may not be directly comparable. Accordingly, these non-
IFRS measures are intended to provide additional information and should not be considered in isolation or as a substitute
for measures of performance prepared in accordance with IFRS.
13 | Aurora Cannabis Inc. Q1 2019 MD&A
About Aurora
Aurora Cannabis Inc. (the “Company” or “Aurora”) was incorporated under the Business Corporations Act (British
Columbia) on December 21, 2006. The Company’s shares are listed on the New York Stock Exchange under the symbol
“ACB”, on the Toronto Stock Exchange under the symbol “ACB”, and on the Frankfurt Stock Exchange under the symbol
“21P”.
The Company’s principal business is the production and distribution of cannabis in Canada pursuant to the Cannabis Act,
the distribution of wholesale medical cannabis in the European Union pursuant to the German Medicinal Products Act
and German Narcotic Drugs Act, and the production of cannabis in Denmark under the Danish Medicines Act. Through
its recent acquisitions, the Company expanded its business to include research and development, the production and
sale of indoor cultivation systems, and the production and sale of hemp related food products.
Aurora does not engage in any U.S. cannabis-related activities as defined in Canadian Securities Administrators Staff
Notice 51-352. While the Company previously held an interest in a U.S. based company, Australis Holdings LLP (“Australis
Holdings” or “AHL”), AHL has not engaged in any U.S. cannabis-related activities. AHL was spun-out to Aurora shareholders
as part of the Australis Capital Inc. spin-out completed on September 19, 2018.
Aurora is one of the world`s largest and fastest growing cannabis companies and has created a growing constellation of
subsidiaries and strategic partnerships that provide differentiation in terms of geographic reach, production, technology,
product offering, and execution.
With a growing number of countries adopting medical cannabis legislation, the Company has embarked on an aggressive
international expansion strategy that currently sees Aurora with business and investments in Germany, Denmark, Italy,
Poland, Australia, Cayman Islands, Malta, Lithuania, South Africa, and South America.

14 | Aurora Cannabis Inc. Q1 2019 MD&A
Summary of Financial Results
Summarized Key Quarterly Results
($ thousands)
Q1 2019
Q4 2018
% Change
Q1 2018
% Change
Financial Results
Total revenue $ 29,674 $ 19,147 55% $ 8,249 260%
Cannabis revenue (1) $ 24,596 $ 14,880 65% $ 7,315 236%
Gross margin on cannabis sales (2) 70% 74% (4%) 58% 12%
General and administration expense $ 35,943 $ 22,557 59% $ 2,993 1,101%
Sales and marketing expense $ 29,376 $ 14,761 99% $ 3,668 701%
Earnings $ 104,181 $ 79,268 31% $ 3,560 2,826%
Earnings attributable to common shareholders $ 105,462 $ 79,870 32% $ 3,560 2,862%
Balance Sheet
Working capital $ 548,446 $ 144,533 279% $ 169,674 223%
Cannabis inventory and biological assets $ 80,848 $ 41,031 97% $ 16,846 380%
Total assets $ 4,955,361 $ 1,910,716 159% $ 347,834 1,325%
Operational Results – Cannabis
Cash cost of sales per gram sold (3) $ 1.90 $ 1.87 2% $ 2.16 (12%)
Cash cost of sales per gram produced (4) $ 1.45 $ 1.70 (15%) $ 1.87 (22%)
Active registered patients 67,484 43,308 56% 19,280 250%
Average net selling price of dried cannabis (5) $ 8.39 $ 8.02 5% $ 7.32 15%
Average net selling price of cannabis extracts (5) $12.12 $ 13.52 (10%) $ 16.41 (26%)
Kilograms produced 4,996 2,212 126% 1,010 395%
Kilograms sold 2,676 1,617 65% 890 201%
(1) Cannabis revenue for Q1 2019 was comprised of revenues from both medical and adult-use markets while Q4 2018 and Q1
2018 cannabis revenues were comprised of revenues from medical cannabis.
(2) Represents the gross margin on cannabis sales before fair value adjustments. Excludes revenues from patient counselling
services, design, engineering, and construction services, and analytical testing services. Gross margin on cannabis sales is a
non-IFRS financial measure. See “Gross Margin” section for reconciliation to IFRS figure.
(3) Represents the cash cost of sales per gram of dried cannabis produced and sold by consolidated Aurora (including the results
of MedReleaf from July 25, 2018 in Q1 2019). Cash cost of sales per gram sold is a non-IFRS financial measure. See “Cash Cost
of Sales of Dried Cannabis and Cash Cost to Produce Dried Cannabis Sold – Aurora Produced Cannabis” section for
reconciliation to IFRS figure.
(4) Represents the cash cost of sales per gram of dried cannabis produced and sold by consolidated Aurora (including the results
of MedReleaf from July 25, 2018 in Q1 2019), excluding costs to sell such as packaging costs. Cash cost of sales per gram
produced is a non-IFRS financial measure. See “Cash Cost of Sales of Dried Cannabis and Cash Cost to Produce Dried
Cannabis Sold – Aurora Produced Cannabis” section for reconciliation to IFRS figure.
(5) Represents the net average selling price per gram of dried cannabis or per gram of dried cannabis equivalent.
The Company’s financial results for the first quarter of fiscal 2019 continued to show strong growth in its core cannabis
businesses. Compared to the prior quarter, total cannabis revenue increased by 65%, while at the same time Aurora was
bolstering its inventory levels to continue serving multiple customer markets. Combined cannabis inventory and biological
assets increased 97% from the prior quarter as the Company prepared for the high-demand Canadian adult-use market.
The Company reported total Q1 2019 revenues of $29.7 million. On a proforma basis, had Aurora included MedReleaf
revenues from July 1, 2018, Aurora’s revenues for Q1 2019 would have been $34.2 million. Also including Anandia, Agropro,
and Borela revenues from July 1, 2018, Q1 2019 Aurora pro forma revenue would be $35.8 million.
Medical sales remained strong, increasing 62% due mainly to the inclusion of MedReleaf results beginning July 25, 2018.
Aurora had 67,484 active registered patients at September 30, 2018. The percentage of oil and extract-based sales also
stayed strong at over 31% of total cannabis sales in the quarter. The percentage of sales attributable to oil and extract-
based product sales in the medical markets is expected to increase in future quarters as new extract-based products are
introduced, including Aurora’s recently licensed softgel capsules.
With the Cannabis Act taking effect as of October 17, 2018, the Company began its first Canadian adult-use shipments to
provincial wholesalers in late September, recognizing approximately $0.6 million revenue in Q1 2019 from sales to this
market. Aurora expects to have sufficient supply to fulfill its confirmed sales orders from the provinces. With full scale
production at Aurora Sky ramping up during fiscal Q2 2019, the rate of growth in the next several quarters for Canadian
adult-use cannabis revenues is partially dependent on Aurora Sky receiving its licenses for the additional production bays
on a timely basis.
15 | Aurora Cannabis Inc. Q1 2019 MD&A
During the quarter, production of cannabis increased 126% as the Company welcomed MedReleaf’s Markham and
Bradford facilities into the family as of July 25, 2018, and completed first harvests at the Aurora Sky and Aurora Eau facilities.
The Company anticipates its first harvest from the Aurora Nordic I facility in Denmark in late calendar 2018, which will further
bolster production capacity to serve the expanding international medical market.
Cash cost to produce per gram of dried cannabis sold decreased by $0.25 mainly due to efficient yield practices applied
to the CanniMed production facilities. Production costs per gram are expected to decrease further once Aurora Sky is fully
operational, and the efficiencies from technology, scale and scientific yield expertise are realized across all Aurora
facilities. Management expects that cash costs to produce a gram of cannabis at a “Sky Class” facility will be well below
$1.00 per gram.
Looking ahead in fiscal 2019, the Company expects sales to the Canadian adult-use market to contribute lower average
net selling prices per gram equivalent of cannabis compared to those of the Canadian medical and European medical
markets, where sales are made direct-to-patients. However, as the Company introduces higher margin products such as
softgel capsules and pre-rolls, and continues to realize lower per gram production costs from the application of technology
across Aurora’s production facilities and economies of scale at Aurora Sky, margin compression in fiscal 2019 is expected
to be mitigated to the extent possible.
During Q1 2019, Aurora continued to ramp up investments in infrastructure and talent required to realize the tremendous
opportunities in the Canadian and international medical cannabis markets, and the Canadian adult-use market.
General and administration costs increased by $13,386, or 59%, compared to the prior quarter. The increase was primarily
due to the addition of MedReleaf from July 25, 2018, Anandia from August 8, 2018, and continued talent acquisition and
new office space to support Aurora’s development of markets in Canada and internationally. The Company also incurred
higher consulting and professional fees related to the year-end audit and NYSE listing. Ongoing integration activities
include identification of rationalization opportunities within general and administrative costs.
Sales and marketing costs increased by $14,615, or 99%, compared to the prior quarter. The Company continued to invest
in sales, marketing, and market analytics capabilities by hiring talented staff and engaging key consultants. However, the
majority of sales and marketing costs in Q1 2019 were in relation to activities and programs specifically for the
October 17, 2018 launch of the Canadian adult-use market. With the Cannabis Act taking effect October 17, 2018, these
costs are not expected to recur. Aurora expects quarterly sales and marketing costs over the remainder of fiscal 2019 to
average substantially less than that of Q1 2019.
During the first quarter of fiscal 2019, the Company closed its debt facility with the Bank of Montreal (“BMO”). The Company
now has the option to upsize the facility to $250 million, subject to certain conditions. The financing allows the Company
to continue investing in its production capabilities and product development, while gaining entry into new global markets.
Through the acquisitions of MedReleaf and Anandia, the Company recognized approximately $2.4 billion in intangible
assets and goodwill. Integration activities for both acquisitions are well underway as teams across the Company
collaborate and move towards realizing the strategic value identified for the transactions. Production and science teams
from Aurora, MedReleaf, and Anandia have been meeting to combine expertise on high-yield cultivation techniques,
which is being applied to all of the Company’s production facilities around the globe to further its industry-leading
cultivation efficiencies and drive down production costs. Science and R&D teams across Aurora, MedReleaf, and Anandia
are integrating and collaborating to build broad portfolios of high-value, high-margin products and together with the
strengthened corporate teams of the three companies, will be a significant catalyst for penetrating new domestic and
international markets.
16 | Aurora Cannabis Inc. Q1 2019 MD&A
Key Developments During Q1 2019
Acquisitions
Aurora is building a diversified and vertically integrated company that can realize the tremendous opportunity of the
global cannabis markets. During the quarter, the Company continued to gain significant first-mover advantages in global
markets through several strategic acquisitions and investments.
a) Acquisition of MedReleaf
On July 25, 2018, the Company closed the previously announced acquisition of all issued and outstanding
common shares of MedReleaf. This represents the world’s largest cannabis industry transaction which created a
vertically integrated cannabis industry leader, with a total funded capacity of more than 500,000 kg per year.
With MedReleaf, Aurora now has two EU GMP certified facilities, which will increase product availability for
international markets.
Under the terms of the Amended Arrangement Agreement, holders of MedReleaf common shares received 3.575
common shares of Aurora and $0.000001 cash for each MedReleaf common share held. The Company issued
an aggregate of 370,120,238 common shares with a fair value of $2,568,634 and 14,033,784 replacement stock
options. The exercise price of the stock options was based on the exercise price per MedReleaf’s stock options
adjusted for the Exchange Ratio.
b) Acquisition of Anandia
On August 8, 2018, the Company acquired all issued and outstanding shares of Anandia, a leading research and
science company specializing in genomics, plant breeding, and providing analytical testing services to
producers and patient-cultivators. Total consideration of $98.2 million consisted of 12,716,482 common shares of
Aurora, and 6,358,210 share purchase warrants, exercisable at $9.3717 per share. Pursuant to the achievement
of future milestones, Aurora will pay out an additional $10.0 million through the issuance of common shares and
share purchase warrants.
This transaction enables the Company to develop new strains with specific terpene/cannabinoid profiles for
targeted product applications, as well as strains with improved cultivation characteristics. Management believes
these activities will lead to the development of new higher-margin products and a further increase in efficiency
during the Company’s cultivation process.
c) Acquisition of ICC Labs Inc. (“ICC”)
On September 10, 2018, the Company entered into a definitive agreement to acquire all the issued and
outstanding shares of ICC, a licensed producer, developer, and vendor of recreational and medical cannabis
products and industrial hemp in Uruguay. Under the terms of the agreement, each holder of ICC common shares
will receive $1.95 per share, totaling an aggregate purchase price of $290.0 million.
Once approved and completed, this acquisition will create a strong foundation for expansion and will leverage
ICC’s first mover advantage in South America, bringing significant low-cost production capacity of both THC and
CBD based products in both Uruguay and Colombia. We believe that ICC presently has the largest market share
in Uruguay, the first country in the world to legalize cannabis for adult-use. In addition, ICC has extensive
distribution channels throughout South American and internationally.
d) Acquisition of UAB Agropro (“Agropro”) and UAB Borela (“Borela”)
On September 10, 2018, the Company acquired all of the issued and outstanding shares of Agropro, Europe’s
largest producer, processor, and supplier of certified organic hemp and hemp products, as well as Borela, a
European hemp processor and distributor. Total consideration of approximately $12.9 million was comprised of
$8.3 million in cash, $3.1 million loan settlement, and 170,834 common shares with a fair value of $1.4 million.
Additionally, the Company issued 270,024 common shares for finders’ fees relating to this acquisition with a fair
value of $2.2 million.
This acquisition is anticipated to yield significant quantities of CBD for extraction and create further synergies
through the Company’s CBD and hemp product value chain, which includes the majority ownership of Hempco
Food and Fiber.
e) Acquisition of HotHouse Consulting Inc. (“HotHouse”)
On August 7, 2018, the Company entered into a Letter of Intent to acquire HotHouse, a provider of advanced
greenhouse consulting services, specializing in hybrid greenhouse growing techniques. In anticipation of closing,
HotHouse founder and industry veteran, Laust Dam, has joined Aurora’s wholly-owned subsidiary, Aurora Larssen
Projects (“ALPS”) as VP of Horticultural Development. This acquisition will allow Aurora to expand ALPS post-
construction services offerings and provide customers with ongoing support and consulting by HotHouse crop
specialists.
17 | Aurora Cannabis Inc. Q1 2019 MD&A
Strategic Investments
f) Spin-out of Australis Capital Inc. (“ACI”)
On September 19, 2018, the Company completed the spin-out of ACI, an investment company that intends to
acquire ownership interest in a variety of opportunities and asset classes in the cannabis and real estate sectors
in the U.S. Eligible Aurora shareholders received one unit of ACI for every 34 Aurora shares outstanding as at
August 24, 2018. Each unit consisted of one common share and one warrant exercisable at $0.25 per warrant for
a period of one-year. Following the distribution, Aurora has no direct ownership interest in ACI.
ACI’s management, board, and advisory teams have deep experience and relationships within the cannabis
industry, and Aurora believes that they will be able to secure investments to build significant shareholder value.
g) License for Pre-Roll Technology with CannaRoyalty Corp. (“CannaRoyalty”)
On August 1, 2018, the Company entered into an Assignment and Assumption Agreement with CannaRoyalty,
whereby CannaRoyalty assigned to Aurora all its rights, title and interest in an exclusive license for pre-rolled
cannabis technology developed by Wagner Dimas Inc (“Wagner Dimas”). This technology allows Aurora to
target the high-volume, high-margin pre-rolled segment of the cannabis market. Total consideration paid for the
license was approximately $4.5 million, which consisted of 756,348 common shares at a price of $5.92 per share.
The Wagner Dimas technology has now been installed at Aurora, and the large-scale production of pre-rolled
product has commenced in order to fulfill orders received from provincial buyers who are supplying the adult-
use market.
h) Strategic Partnership with Evio Beauty Group Ltd. (“Evio”)
On July 10, 2018, the Company entered into a strategic partnership with Evio to collaborate on a line of co-
branded hemp seed oil products (“non-infused products”) and CBD-infused cosmetic products (“infused
products”). Under the terms of the agreement, Aurora will earn a 10% royalty on sales of all non-infused products,
and Evio will earn a 10% royalty on sales of all infused products. Aurora anticipates that this partnership will result
in greater brand recognition and cross-selling opportunities to customers of both companies.
Facility Licensing
i) Production License for Aurora Eau Facility
On September 7, 2018, the Company received a Health Canada production license for its Eau facility in Lachute,
Quebec. Aurora Eau, a 48,000 square foot facility with production capacity of 4,500 kg per year, was purpose-
built to EU GMP standards. With large-scale production ramping up at Aurora Sky, this license will allow Aurora to
allocate Eau’s production to niche cannabis markets.
j) Oils Production License for MedReleaf Bradford Facility
On September 7, 2018, the Company, through its wholly-owned subsidiary, MedReleaf, received its Health
Canada oils production license for its facility located in Bradford, Ontario. This license allows MedReleaf Bradford,
a 210,000 square foot facility which features a high-volume CO2 extraction facility, to significantly increase the
production of oils in fiscal 2019. MedReleaf Bradford continues to produce oils, a higher-margin product, in
anticipation of the receipt of its oils sales license.
k) Approval for Softgel Production at Aurora Vie Facility
On August 22, 2018, the Company received Health Canada authorization to begin producing cannabis softgel
capsules at its Aurora Vie facility in Pointe-Claire, Quebec. The softgels are produced in partnership with Montreal-
based Capcium Inc. (“Capcium”), Aurora’s exclusive manufacturer of cannabis softgel products in North
America. Aurora holds a 19.99% existing ownership interest in Capcium.
l) Dealer’s License and Capsules License for Aurora Mountain Facility
On July 30, 2018, the Company received a Health Canada dealer’s license for its Mountain Facility in Cremona,
Alberta. This license allows Aurora to expand research and development activities with cannabinoids and their
derivatives that were not covered under the previous license, as well as import and export cannabis products to
and from international markets, subject to applicable regulations.
On September 28, 2018, Aurora Mountain also received its Health Canada production license to produce
encapsulated oils. Aurora intends to produce unique, integral hard-shell capsules for medical markets, and
recreational markets, once legalized.
m) Capsules License for CanniMed Facility
On July 3, 2018, the Company, through its wholly-owned subsidiary, CanniMed, received Health Canada
authorization to commence sales of CanniMed capsules, a line of vegan capsules which became available to
patients on August 22, 2018.
18 | Aurora Cannabis Inc. Q1 2019 MD&A
International Expansion
n) Aurora Europe
On August 13, 2018, Aurora established a pan-European company, Aurora Europe GmbH (“Aurora Europe”),
headquartered in Berlin, Germany. Aurora’s wholly-owned subsidiary, Pedanios GmbH, Europe’s largest
distributor of cannabis, will be henceforth known as Aurora Deutschland GmbH (“Aurora Deutschland”). The
Company has also incorporated Aurora Italia (Italy) and several other local companies under Aurora Europe.
Aurora anticipates that the number of employees in Europe will grow substantially over the coming months as
Aurora Europe expands across the continent.
o) Letter of Intent for Production of Medical Cannabis in Malta
On July 24, 2018, the Company announced that it received a Letter of Intent from Malta Enterprise, the Maltese
government’s economic development agency, to establish a medical cannabis production facility focused on
the production of high margin oils and cannabis derivative products in Malta. Aurora will be a majority
shareholder in a newly established subsidiary, Aurora Malta, through a joint venture with a local Maltese partner,
Cherubino Ltd., the largest pharmaceutical wholesaler in Malta. Aurora Malta will serve the domestic Maltese
and Southern European markets.
p) Commencement of Cultivation at Aurora Nordic Phase I
On August 13, 2018, the Company successfully shipped cultivars from Aurora Mountain to Odense, Denmark to
commence populating the Aurora Nordic Phase I facility. Aurora Nordic Phase I, a 100,000 square foot retrofitted
hybrid greenhouse, which will be ramping up to full production capacity of 8,000 kg per year in the coming
months.
Aurora Nordic Phase I is operated by Aurora Nordic, a 51% Aurora-owned subsidiary, owned in partnership with
Alfred Pederson & Son. Aurora Nordic Phase II will be a 1,000,000 square foot hybrid greenhouse facility with a
capacity of more than 120,000 kg per year and is expected to be complete in the first half of calendar 2020.
Both Phases have been designed by ALPS and will comply with EU GMP standards.
q) EU GMP Certification for MedReleaf Markham Facility
On August 13, 2018, Aurora, through its wholly-owned subsidiary, MedReleaf, received EU GMP certification on its
facility in Markham, Ontario. This certification will allow MedReleaf Markham to access rapidly growing, higher
margin, heavily regulated EU markets. All Aurora and MedReleaf facilities are being designed and built to EU
GMP standards.
r) MedColombia SAS (“MedColombia”)
Through the acquisition of MedReleaf, Aurora acquired MedColombia, a licensed cannabis company based in
Colombia, who holds a strong portfolio of genetics, and a strong potential for growth. Aurora anticipates that
MedColombia will be leveraged as a part of Aurora’s South American platform.
s) Exports to Australia
During the first quarter of 2019, Aurora successfully completed its first export of cannabis oil products to Australia.
The products were supplied to medical patients through its associate, Cann Group Ltd. (“Cann Group”). Aurora
and its wholly-owned subsidiary, Anandia, have also successfully exported plant tissue culture derived genetics
which were used to enhance Cann Group’s cultivation program.
Cann Group has announced that it will be constructing an ALPS designed, high-technology, hybrid cultivation
facility at the Melbourne International Airport.
Financing Activities
t) Bank of Montreal (“BMO”) Debt Facility
On August 29, 2018, the Company closed its previously announced debt facility with BMO, consisting of a $150.0
million term loan and $50.0 million revolving credit facility, both of which mature in 2021. The debt facility bears
interest at a set margin over BMO CAD Prime Rate, or a Bankers’ Acceptance of appropriate term.
The Company has the option to upsize the facility to $250.0 million, subject to certain conditions. The debt facility
is primarily secured by Aurora’s production facilities and can be repaid without penalty at Aurora’s discretion.
19 | Aurora Cannabis Inc. Q1 2019 MD&A
Key Developments Subsequent to September 30, 2018
a) New York Stock Exchange (“NYSE”) Listing
On October 23, 2018, the Company’s common shares commenced trading on the NYSE under the ticker symbol
“ACB”, the same symbol the Company’s common shares currently, and will continue to, trade under on the
Toronto Stock Exchange (“TSX”). Upon commencement of trading on the NYSE, Aurora voluntarily delisted its
shares from the OTCQX, which previously traded under the ticker symbol “ACBFF”.
This milestone reflects Aurora’s commitment to continue advancing domestic and internal growth initiatives,
which includes expanding the Company’s base of global institutional and retail investors.
b) First Cannabis Import Permit from Polish Ministry of Health
On October 25, 2018, the Company announced that it was granted approval from the Polish Ministry of Health
to ship medical cannabis to a pain treatment center and a hospital in Warsaw, Poland. This is believed to be the
first time a non-government run business has been granted approval to supply medical cannabis products in
Poland.
Under Polish legislation, physicians can prescribe medical cannabis products to patients, who can then access
it through registered pharmacies. Therefore, this permit establishes a new and significant medical market for
Aurora.
c) Sales License for Aurora Sky and Vie Facilities
On October 17, 2018, the Company received its Health Canada sales license for its Sky Facility and its softgel
sales license for its Vie facility, located at the Edmonton International Airport and in Pointe-Claire, Quebec. These
licenses allow Aurora to increase product availability across Canada, and enable Aurora to swiftly scale-up
production to service the rapid growth anticipated in domestic and international markets.
d) Conversion of 6.0% Unsecured Convertible Debentures
On October 17, 2018, the Company announced that it has elected to exercise its right under the Indenture
governing the Company’s 6.0% unsecured convertible debentures due November 28, 2022 (the “Indenture”) to
convert all of the principal amount outstanding of the remaining debentures as at November 16, 2018 into
common shares of the Company.
Pursuant to the terms of the Indenture, the Company may force the conversion of the debentures at the
conversion price of $6.50 per common share when the VWAP of the common shares on the TSX equals or exceeds
$9.00 for 10 consecutive trading days. As of close of markets on October 16, 2018, the VWAP equaled $13.35. The
conversion is scheduled to be effective on November 16, 2018. On Monday, November 19, 2018, the estimated
remaining debentures of approximately $1.72 million will be converted to approximately 265,692 common shares,
and accrued interest will be paid.
e) Partial Disposition of Common Shares of The Green Organic Dutchman Holdings Ltd. (“TGOD”)
In October 2018, the Company sold 6,341,250 common shares of its 17% interest in TGOD for gross proceeds of
$35.9 million. Following the disposition, Aurora holds 33,333,334 common shares representing approximately 13%
of TGOD’s issued and outstanding shares.
f) Launch of Vape-Ready, High-Potency CBD Oil Cartridges
On October 16, 2018, the Company announced that it had received necessary compliance verification from
Health Canada to sell its innovative, high-potency, vape-ready CBD oil product line under the brand Aurora
Cloud. The first Aurora Cloud products released contain over 550mg of CBD and less than 30mg of THC, making
them the only vape-ready CBD products legally available in Canada.
20 | Aurora Cannabis Inc. Q1 2019 MD&A
Financial Review
Cannabis Segment
Revenue
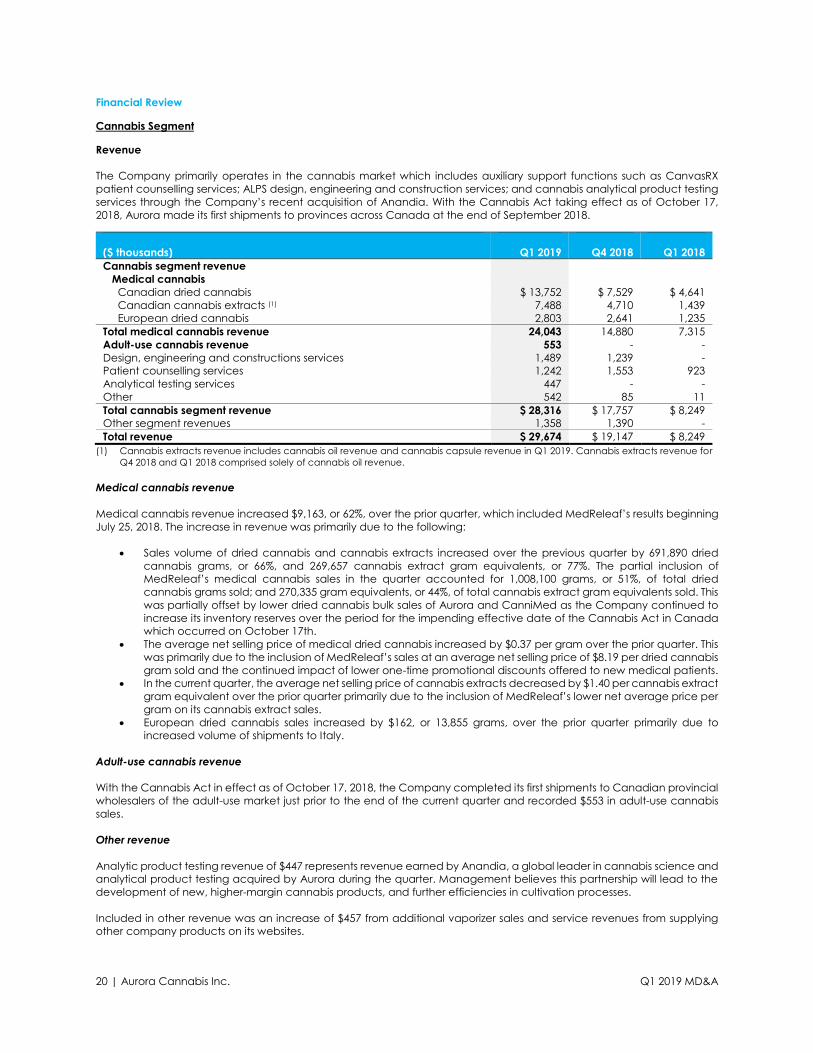
The Company primarily operates in the cannabis market which includes auxiliary support functions such as CanvasRX
patient counselling services; ALPS design, engineering and construction services; and cannabis analytical product testing
services through the Company’s recent acquisition of Anandia. With the Cannabis Act taking effect as of October 17,
2018, Aurora made its first shipments to provinces across Canada at the end of September 2018.
($ thousands)
Q1 2019
Q4 2018
Q1 2018
Cannabis segment revenue
Medical cannabis
Canadian dried cannabis $ 13,752 $ 7,529 $ 4,641
Canadian cannabis extracts (1) 7,488 4,710 1,439
European dried cannabis 2,803 2,641 1,235
Total medical cannabis revenue 24,043 14,880 7,315
Adult-use cannabis revenue 553 - -
Design, engineering and constructions services 1,489 1,239 -
Patient counselling services 1,242 1,553 923
Analytical testing services 447 - -
Other 542 85 11
Total cannabis segment revenue $ 28,316 $ 17,757 $ 8,249
Other segment revenues 1,358 1,390 -
Total revenue $ 29,674 $ 19,147 $ 8,249
(1) Cannabis extracts revenue includes cannabis oil revenue and cannabis capsule revenue in Q1 2019. Cannabis extracts revenue for
Q4 2018 and Q1 2018 comprised solely of cannabis oil revenue.
Medical cannabis revenue
Medical cannabis revenue increased $9,163, or 62%, over the prior quarter, which included MedReleaf’s results beginning
July 25, 2018. The increase in revenue was primarily due to the following:
• Sales volume of dried cannabis and cannabis extracts increased over the previous quarter by 691,890 dried
cannabis grams, or 66%, and 269,657 cannabis extract gram equivalents, or 77%. The partial inclusion of
MedReleaf’s medical cannabis sales in the quarter accounted for 1,008,100 grams, or 51%, of total dried
cannabis grams sold; and 270,335 gram equivalents, or 44%, of total cannabis extract gram equivalents sold. This
was partially offset by lower dried cannabis bulk sales of Aurora and CanniMed as the Company continued to
increase its inventory reserves over the period for the impending effective date of the Cannabis Act in Canada
which occurred on October 17th.
• The average net selling price of medical dried cannabis increased by $0.37 per gram over the prior quarter. This
was primarily due to the inclusion of MedReleaf’s sales at an average net selling price of $8.19 per dried cannabis
gram sold and the continued impact of lower one-time promotional discounts offered to new medical patients.
• In the current quarter, the average net selling price of cannabis extracts decreased by $1.40 per cannabis extract
gram equivalent over the prior quarter primarily due to the inclusion of MedReleaf’s lower net average price per
gram on its cannabis extract sales.
• European dried cannabis sales increased by $162, or 13,855 grams, over the prior quarter primarily due to
increased volume of shipments to Italy.
Adult-use cannabis revenue
With the Cannabis Act in effect as of October 17, 2018, the Company completed its first shipments to Canadian provincial
wholesalers of the adult-use market just prior to the end of the current quarter and recorded $553 in adult-use cannabis
sales.
Other revenue
Analytic product testing revenue of $447 represents revenue earned by Anandia, a global leader in cannabis science and
analytical product testing acquired by Aurora during the quarter. Management believes this partnership will lead to the
development of new, higher-margin cannabis products, and further efficiencies in cultivation processes.
Included in other revenue was an increase of $457 from additional vaporizer sales and service revenues from supplying
other company products on its websites.

21 | Aurora Cannabis Inc. Q1 2019 MD&A
Consolidated cannabis segment revenues for the first quarter of fiscal 2019 increased by $20,068, or 243%, over the same
period in the prior year which was primarily attributable to:
• The inclusion of $18,365 in combined revenue in the quarter from the Company’s strategic acquisitions of
MedReleaf, CanniMed, ALPS, Anandia, Agropro, and Borela;
• Significant increase in the Company’s combined active registered patients list from 19,280 in Q1 2018 to 67,484
in the current quarter through the integration of CanniMed’s and MedReleaf’s registered patients of 21,908 and
22,656 respectively; as well as organic growth of 3,640 in Aurora patients as the Company balanced medical
market growth with preparation for the Canadian adult-use markets;
• Increase in dried cannabis sold domestically of $9,645, or 1,117,313 grams; and sold internationally of $1,569, or
136,485 grams; and
• Increase in cannabis extracts sold domestically of $6,068, or 532,414 gram equivalents, which comprised of $5,747
of cannabis oils, or 505,409 in cannabis oil gram equivalents and $321 in cannabis capsules, or 27,005 in cannabis
capsule gram equivalents.
Gross Margin
($ thousands)
Q1 2019
Q4 2018
Q1 2018
Total revenue $ 29,674 $ 19,147 $ 8,249
Total cost of sales (9,542) (4,867) (3,072)
Gross profit before fair value adjustments 20,132 14,280 5,177
Less: Non-cannabis segment revenue (1) (1,358) (1,390) -
Add: Non-cannabis segment cost of sales (1) 1,311 165 -
Gross profit on cannabis segment before fair value adjustments 20,085 13,055 5,177
Less: Non-cannabis revenue (2) (3,720) (2,792) (923)
Add: Non-cannabis cost of sales (2) 746 747 29
Gross profit on cannabis before fair value adjustments (3) 17,111 11,010 4,283
Gross margin on cannabis before fair value adjustments (4) 70% 74% 58%
(1) Non-cannabis segment revenue and non-cannabis segment cost of sales includes the revenues and cost of sales from hemp and
home cultivation products.
(2) Non-cannabis revenue and non-cannabis cost of sales includes the revenues and cost of sales from patient counselling services;
design, engineering, and construction services; and analytical testing services.
(3) Gross profit on cannabis before fair value adjustments is a non-IFRS financial measure and is calculated by removing from
total revenue and total cost of sales, the effects from non-cannabis segment revenue(1) and non-cannabis segment cost of
sales(1) and non-cannabis revenue(2) and non-cannabis costs of sales(2).
(4) Gross margin on cannabis before fair value adjustments is a non-IFRS financial measure and is calculated by taking the gross
profit on cannabis before fair value adjustments(3) and divided by the amount equal to total revenue less non-cannabis
segment revenue(1) and non-cannabis revenue(2).
Gross margin on cannabis before the effect of changes in fair value in the first quarter of fiscal 2019 was 70% compared
to 74% in the fourth quarter of fiscal 2018. The decrease was primarily due to the inclusion of MedReleaf’s relatively higher
packaging costs, overall increase in packaging costs from the stringent regulatory requirements of the Cannabis Act, and
MedReleaf’s slightly lower cannabis extract average net selling prices; partially offset by overall higher average net selling
price of dried cannabis sold from the inclusion of MedReleaf’s dried cannabis sales and from lower one-time promotional
discounts offered on new Aurora medical patients.
Gross margin on cannabis before the effect of changes in fair value in the first quarter of fiscal 2019 increased by 12% from
58% in the first quarter of fiscal 2018. This was mainly attributable to a change in sales ratio of cannabis extracts to dried
cannabis, as cannabis extracts contribute higher profit margins relative to dried cannabis. In the current quarter, cannabis
extracts comprised 24% of total gram equivalents sold compared to 10% for the same period in fiscal 2018. The increase in
gross margin during the period is also attributable to the inclusion of MedReleaf’s results, which contributed to a higher
average net selling price per gram of dried cannabis sold; partially offset by higher packaging costs overall.
In accordance with IFRS, the Company is required to record its biological assets at fair value. As biological assets move
through the production process, capitalized production costs and the fair value on the eventual sale of the cannabis
from the plants are both recognized under IFRS based on the stage of completion of the biological assets. The fair value
portion of the biological assets is recognized as unrealized gains from the change in fair value of biological assets in the
statement of comprehensive income for the reporting period. At the time of harvest, the biological assets are transferred
to inventory and include capitalized production costs to date and the related fair value portion, which is adjusted to the
lower of cost or inventory net realizable value. On the eventual sale of inventory, the fair value portion is relieved through
unrealized loss on change in fair value on sale of inventory reported in the results of operations.
22 | Aurora Cannabis Inc. Q1 2019 MD&A
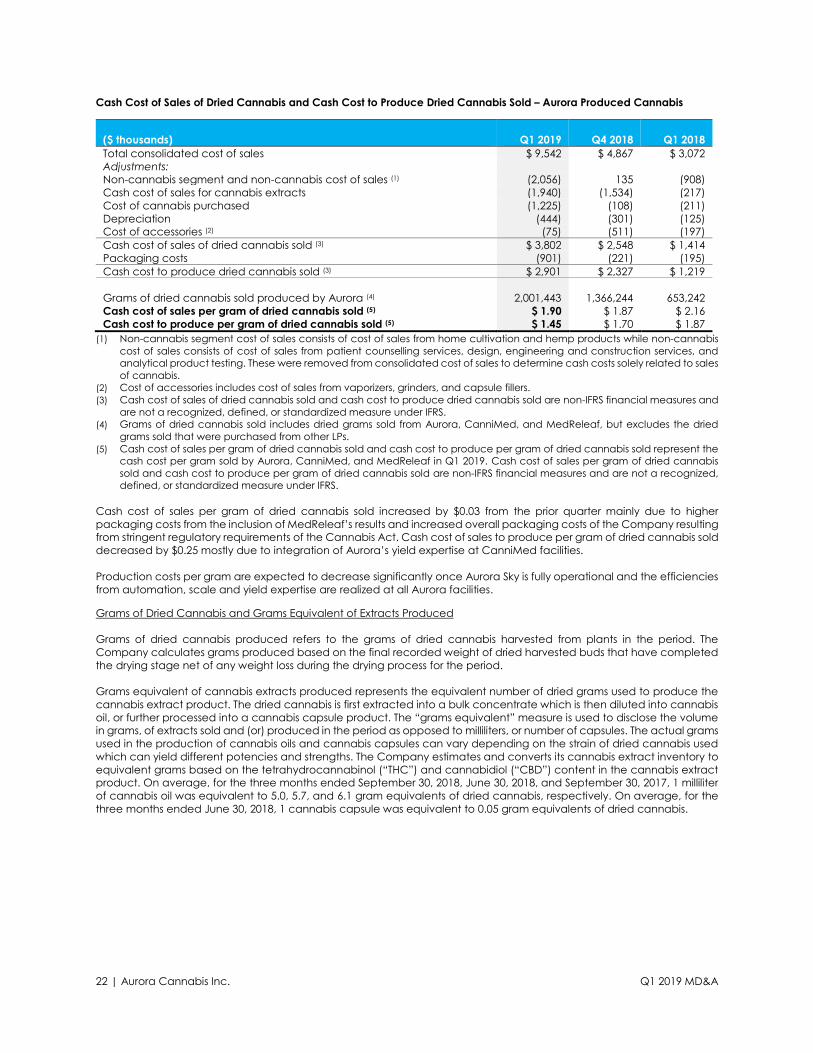
Cash Cost of Sales of Dried Cannabis and Cash Cost to Produce Dried Cannabis Sold – Aurora Produced Cannabis
($ thousands)
Q1 2019
Q4 2018
Q1 2018
Total consolidated cost of sales $ 9,542 $ 4,867 $ 3,072
Adjustments:
Non-cannabis segment and non-cannabis cost of sales (1) (2,056) 135 (908)
Cash cost of sales for cannabis extracts (1,940) (1,534) (217)
Cost of cannabis purchased (1,225) (108) (211)
Depreciation (444) (301) (125)
Cost of accessories (2) (75) (511) (197)
Cash cost of sales of dried cannabis sold (3) $ 3,802 $ 2,548 $ 1,414
Packaging costs (901) (221) (195)
Cash cost to produce dried cannabis sold (3) $ 2,901 $ 2,327 $ 1,219
Grams of dried cannabis sold produced by Aurora (4) 2,001,443 1,366,244 653,242
Cash cost of sales per gram of dried cannabis sold (5) $ 1.90 $ 1.87 $ 2.16
Cash cost to produce per gram of dried cannabis sold (5) $ 1.45 $ 1.70 $ 1.87
(1) Non-cannabis segment cost of sales consists of cost of sales from home cultivation and hemp products while non-cannabis
cost of sales consists of cost of sales from patient counselling services, design, engineering and construction services, and
analytical product testing. These were removed from consolidated cost of sales to determine cash costs solely related to sales
of cannabis.
(2) Cost of accessories includes cost of sales from vaporizers, grinders, and capsule fillers.
(3) Cash cost of sales of dried cannabis sold and cash cost to produce dried cannabis sold are non-IFRS financial measures and
are not a recognized, defined, or standardized measure under IFRS.
(4) Grams of dried cannabis sold includes dried grams sold from Aurora, CanniMed, and MedReleaf, but excludes the dried
grams sold that were purchased from other LPs.
(5) Cash cost of sales per gram of dried cannabis sold and cash cost to produce per gram of dried cannabis sold represent the
cash cost per gram sold by Aurora, CanniMed, and MedReleaf in Q1 2019. Cash cost of sales per gram of dried cannabis
sold and cash cost to produce per gram of dried cannabis sold are non-IFRS financial measures and are not a recognized,
defined, or standardized measure under IFRS.
Cash cost of sales per gram of dried cannabis sold increased by $0.03 from the prior quarter mainly due to higher
packaging costs from the inclusion of MedReleaf’s results and increased overall packaging costs of the Company resulting
from stringent regulatory requirements of the Cannabis Act. Cash cost of sales to produce per gram of dried cannabis sold
decreased by $0.25 mostly due to integration of Aurora’s yield expertise at CanniMed facilities.
Production costs per gram are expected to decrease significantly once Aurora Sky is fully operational and the efficiencies
from automation, scale and yield expertise are realized at all Aurora facilities.
Grams of Dried Cannabis and Grams Equivalent of Extracts Produced
Grams of dried cannabis produced refers to the grams of dried cannabis harvested from plants in the period. The
Company calculates grams produced based on the final recorded weight of dried harvested buds that have completed
the drying stage net of any weight loss during the drying process for the period.
Grams equivalent of cannabis extracts produced represents the equivalent number of dried grams used to produce the
cannabis extract product. The dried cannabis is first extracted into a bulk concentrate which is then diluted into cannabis
oil, or further processed into a cannabis capsule product. The “grams equivalent” measure is used to disclose the volume
in grams, of extracts sold and (or) produced in the period as opposed to milliliters, or number of capsules. The actual grams
used in the production of cannabis oils and cannabis capsules can vary depending on the strain of dried cannabis used
which can yield different potencies and strengths. The Company estimates and converts its cannabis extract inventory to
equivalent grams based on the tetrahydrocannabinol (“THC”) and cannabidiol (“CBD”) content in the cannabis extract
product. On average, for the three months ended September 30, 2018, June 30, 2018, and September 30, 2017, 1 milliliter
of cannabis oil was equivalent to 5.0, 5.7, and 6.1 gram equivalents of dried cannabis, respectively. On average, for the
three months ended June 30, 2018, 1 cannabis capsule was equivalent to 0.05 gram equivalents of dried cannabis.
23 | Aurora Cannabis Inc. Q1 2019 MD&A
Other Segment
The Company’s other reportable segments include its horizontally integrated businesses and operating expenses. On
September 10, 2018, Aurora acquired all of the listed and outstanding common shares of Agropro and Borela; one of
Europe’s largest producer, processor and supplier of certified organic hemp and hemp products. The results of Agropro
and Borela have been included in Other Segment revenue from September 10, 2018.
Revenue
Other segment revenue of $1,358 related to sales of organic hemp and hemp products, and home cultivation products;
of which $519 was attributable to Agropro and Borela.
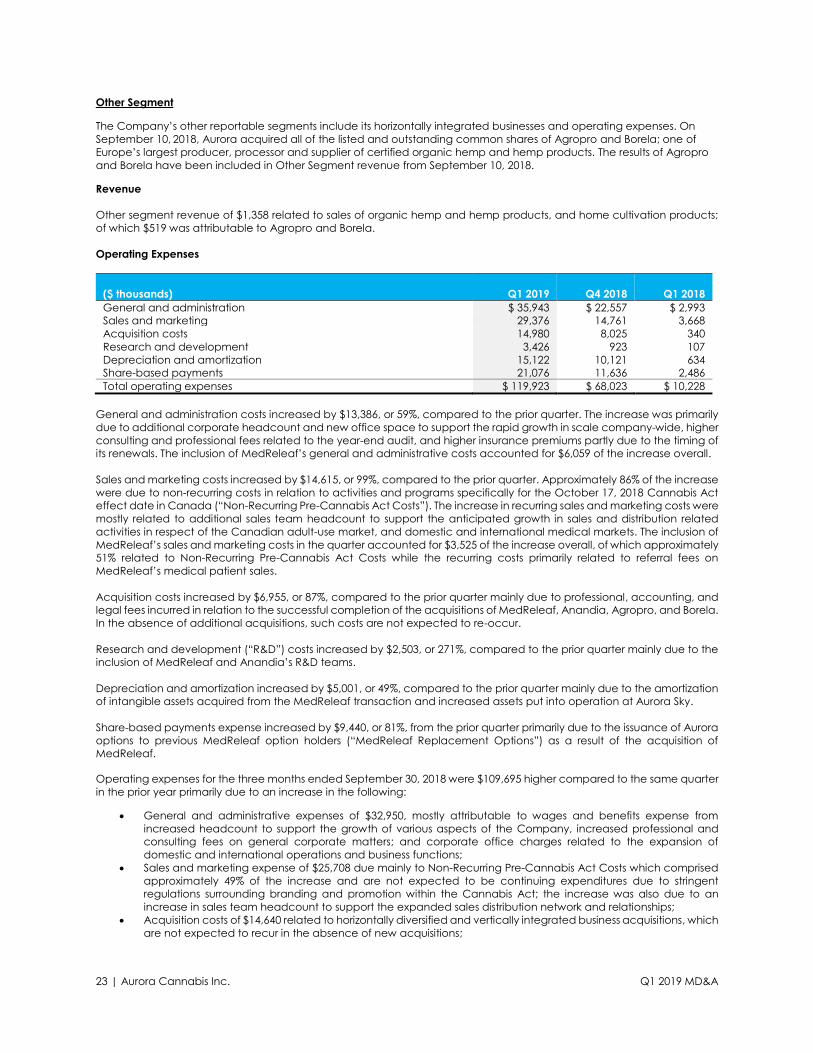
Operating Expenses
($ thousands)
Q1 2019
Q4 2018
Q1 2018
General and administration $ 35,943 $ 22,557 $ 2,993
Sales and marketing 29,376 14,761 3,668
Acquisition costs 14,980 8,025 340
Research and development 3,426 923 107
Depreciation and amortization 15,122 10,121 634
Share-based payments 21,076 11,636 2,486
Total operating expenses $ 119,923 $ 68,023 $ 10,228
General and administration costs increased by $13,386, or 59%, compared to the prior quarter. The increase was primarily
due to additional corporate headcount and new office space to support the rapid growth in scale company-wide, higher
consulting and professional fees related to the year-end audit, and higher insurance premiums partly due to the timing of
its renewals. The inclusion of MedReleaf’s general and administrative costs accounted for $6,059 of the increase overall.
Sales and marketing costs increased by $14,615, or 99%, compared to the prior quarter. Approximately 86% of the increase
were due to non-recurring costs in relation to activities and programs specifically for the October 17, 2018 Cannabis Act
effect date in Canada (“Non-Recurring Pre-Cannabis Act Costs”). The increase in recurring sales and marketing costs were
mostly related to additional sales team headcount to support the anticipated growth in sales and distribution related
activities in respect of the Canadian adult-use market, and domestic and international medical markets. The inclusion of
MedReleaf’s sales and marketing costs in the quarter accounted for $3,525 of the increase overall, of which approximately
51% related to Non-Recurring Pre-Cannabis Act Costs while the recurring costs primarily related to referral fees on
MedReleaf’s medical patient sales.
Acquisition costs increased by $6,955, or 87%, compared to the prior quarter mainly due to professional, accounting, and
legal fees incurred in relation to the successful completion of the acquisitions of MedReleaf, Anandia, Agropro, and Borela.
In the absence of additional acquisitions, such costs are not expected to re-occur.
Research and development (“R&D”) costs increased by $2,503, or 271%, compared to the prior quarter mainly due to the
inclusion of MedReleaf and Anandia’s R&D teams.
Depreciation and amortization increased by $5,001, or 49%, compared to the prior quarter mainly due to the amortization
of intangible assets acquired from the MedReleaf transaction and increased assets put into operation at Aurora Sky.
Share-based payments expense increased by $9,440, or 81%, from the prior quarter primarily due to the issuance of Aurora
options to previous MedReleaf option holders (“MedReleaf Replacement Options”) as a result of the acquisition of
MedReleaf.
Operating expenses for the three months ended September 30, 2018 were $109,695 higher compared to the same quarter
in the prior year primarily due to an increase in the following:
• General and administrative expenses of $32,950, mostly attributable to wages and benefits expense from
increased headcount to support the growth of various aspects of the Company, increased professional and
consulting fees on general corporate matters; and corporate office charges related to the expansion of
domestic and international operations and business functions;
• Sales and marketing expense of $25,708 due mainly to Non-Recurring Pre-Cannabis Act Costs which comprised
approximately 49% of the increase and are not expected to be continuing expenditures due to stringent
regulations surrounding branding and promotion within the Cannabis Act; the increase was also due to an
increase in sales team headcount to support the expanded sales distribution network and relationships;
• Acquisition costs of $14,640 related to horizontally diversified and vertically integrated business acquisitions, which
are not expected to recur in the absence of new acquisitions;

24 | Aurora Cannabis Inc. Q1 2019 MD&A
• Research and development expenses of $3,319 from continued investments into product development and
enhancing cultivation efficiencies, and from cost incurred to ramp up processes at Aurora Sky to its optimal levels;
• Depreciation and amortization expense of $14,488 from additional capital assets in operational use within Aurora
Sky and other facilities, as well as from amortization of intangible assets acquired from the CanniMed and
MedReleaf acquisitions; and
• Share-based payments of $18,590 from the issuance of additional stock options in line with the increase
headcount, and from the issuance of MedReleaf Replacement Options.
The inclusion of CanniMed’s and MedReleaf’s results accounted for 24% of the increase in general and administrative
expenses; and 20% of the increase in sales and marketing expense.
Liquidity and Capital Resources
During the three months ended September 30, 2018, the Company generated revenue of $29,674 from operations, and
financed its current operations, growth initiatives, and met its capital requirements from debt financing. The Company’s
objectives when managing its liquidity and capital resources are to ensure sufficient liquidity to support its financial
obligations and execute its operating and strategic plans while maintaining healthy liquidity reserves and access to capital
for at least the next twelve months.
The Company manages its liquidity risk by monitoring its operating requirements and preparing budgets and cash forecasts
to ensure it has sufficient funds to fulfill obligations.
The Company also has strategic investments in a number of publicly-traded companies. Based on the closing prices at
November 9, 2018, the value of the common shares and “in-the-money” warrants held by the Company was $407,566.
The table below sets out cash and working capital as at September 30, 2018, and June 30, 2018:
($ thousands)
Sept 30,
2018
June 30,
2018
$ $
Cash and cash equivalents 147,797 89,193
Working capital 548,446 144,533
During the three months ended September 30, 2018, the Company increased its cash and cash equivalents balance by
$58,604 from June 30, 2018. The increase was largely due to a mixture of cash financing from the drawn down of the BMO
debt facility and cash acquired from completed transactions, partially offset by cash used in operations.
The Company’s working capital as at September 30, 2018 was $548,446 compared to $144,533 as at June 30, 2018. The
increase in working capital of $403,913 was largely attributable to the TGOD investment being previously treated as an
investment in associate which was reported at cost; the investment is now treated as a marketable security and reported
at fair value. The inclusion of MedReleaf’s balances accounted for $57,606 in additional working capital.
The table below summarizes total capitalization as at September 30, 2018, and June 30, 2018:
($ thousands)
Sept 30,
2018
June 30,
2018
$ $
Convertible notes 199,788 191,528
Loans and borrowings 91,315 11,683
Total debt 291,103 203,211
Total equity 4,402,917 1,563,131
Total capitalization 4,694,020 1,766,342
Total capitalization increased by $2,927,678 compared to June 30, 2018 mostly due to an increase in equity of $2,839,786
from the issuance of shares in relation to the MedReleaf acquisition.
Loans and borrowings increased by $79,632 as the Company closed a $200,000 Debt Facility with Bank of Montreal,
consisting of a $150,000 term loan and a $50,000 revolving credit facility, both of which will mature in 2021. Included in the
Debt Facility is an option to upsize the facility to $250,000 in total following the implementation of Bill C-45 on October 17,
2018. The Debt Facility shifted the capital structure of the Company to include more traditional debt financing, lowering
the Company’s cost of capital. The Company anticipates that it will have sufficient liquidity and capital resources to meet
its planned expenditures for the next twelve months.
25 | Aurora Cannabis Inc. Q1 2019 MD&A
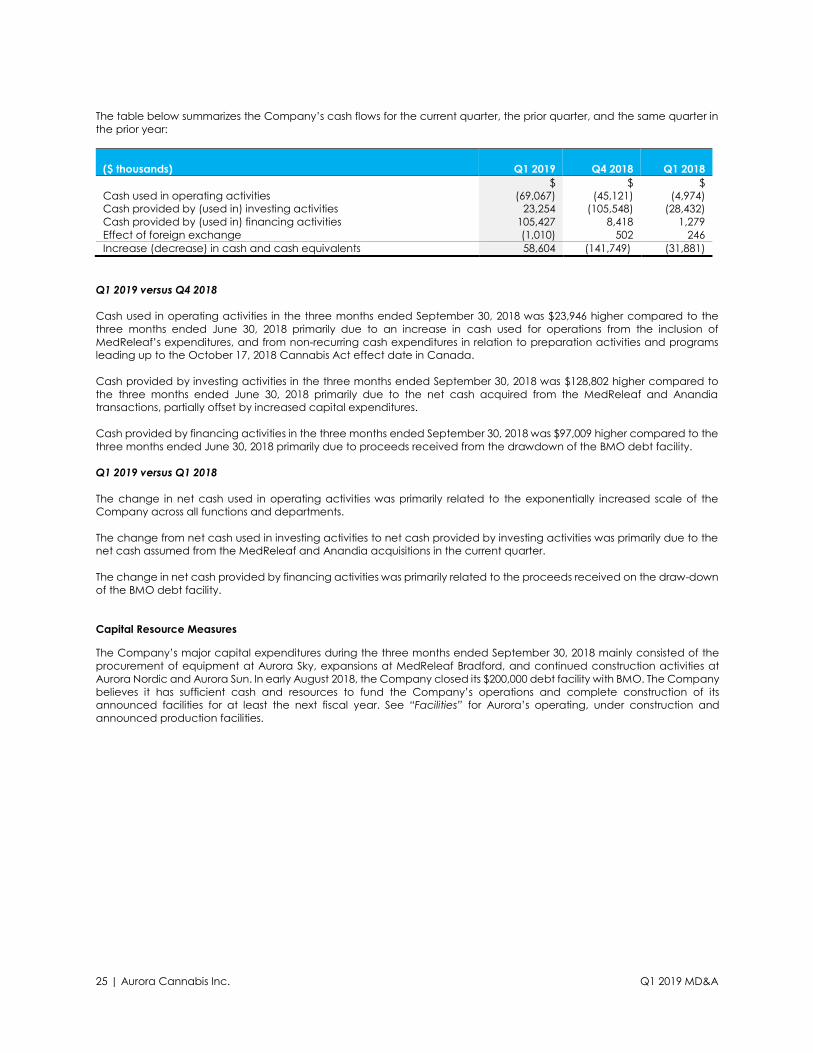
The table below summarizes the Company’s cash flows for the current quarter, the prior quarter, and the same quarter in
the prior year:
($ thousands)
Q1 2019
Q4 2018
Q1 2018
$ $ $
Cash used in operating activities (69,067) (45,121) (4,974)
Cash provided by (used in) investing activities 23,254 (105,548) (28,432)
Cash provided by (used in) financing activities 105,427 8,418 1,279
Effect of foreign exchange (1,010) 502 246
Increase (decrease) in cash and cash equivalents 58,604 (141,749) (31,881)
Q1 2019 versus Q4 2018
Cash used in operating activities in the three months ended September 30, 2018 was $23,946 higher compared to the
three months ended June 30, 2018 primarily due to an increase in cash used for operations from the inclusion of
MedReleaf’s expenditures, and from non-recurring cash expenditures in relation to preparation activities and programs
leading up to the October 17, 2018 Cannabis Act effect date in Canada.
Cash provided by investing activities in the three months ended September 30, 2018 was $128,802 higher compared to
the three months ended June 30, 2018 primarily due to the net cash acquired from the MedReleaf and Anandia
transactions, partially offset by increased capital expenditures.
Cash provided by financing activities in the three months ended September 30, 2018 was $97,009 higher compared to the
three months ended June 30, 2018 primarily due to proceeds received from the drawdown of the BMO debt facility.
Q1 2019 versus Q1 2018
The change in net cash used in operating activities was primarily related to the exponentially increased scale of the
Company across all functions and departments.
The change from net cash used in investing activities to net cash provided by investing activities was primarily due to the
net cash assumed from the MedReleaf and Anandia acquisitions in the current quarter.
The change in net cash provided by financing activities was primarily related to the proceeds received on the draw-down
of the BMO debt facility.
Capital Resource Measures
The Company’s major capital expenditures during the three months ended September 30, 2018 mainly consisted of the
procurement of equipment at Aurora Sky, expansions at MedReleaf Bradford, and continued construction activities at
Aurora Nordic and Aurora Sun. In early August 2018, the Company closed its $200,000 debt facility with BMO. The Company
believes it has sufficient cash and resources to fund the Company’s operations and complete construction of its
announced facilities for at least the next fiscal year. See “Facilities” for Aurora’s operating, under construction and
announced production facilities.
26 | Aurora Cannabis Inc. Q1 2019 MD&A
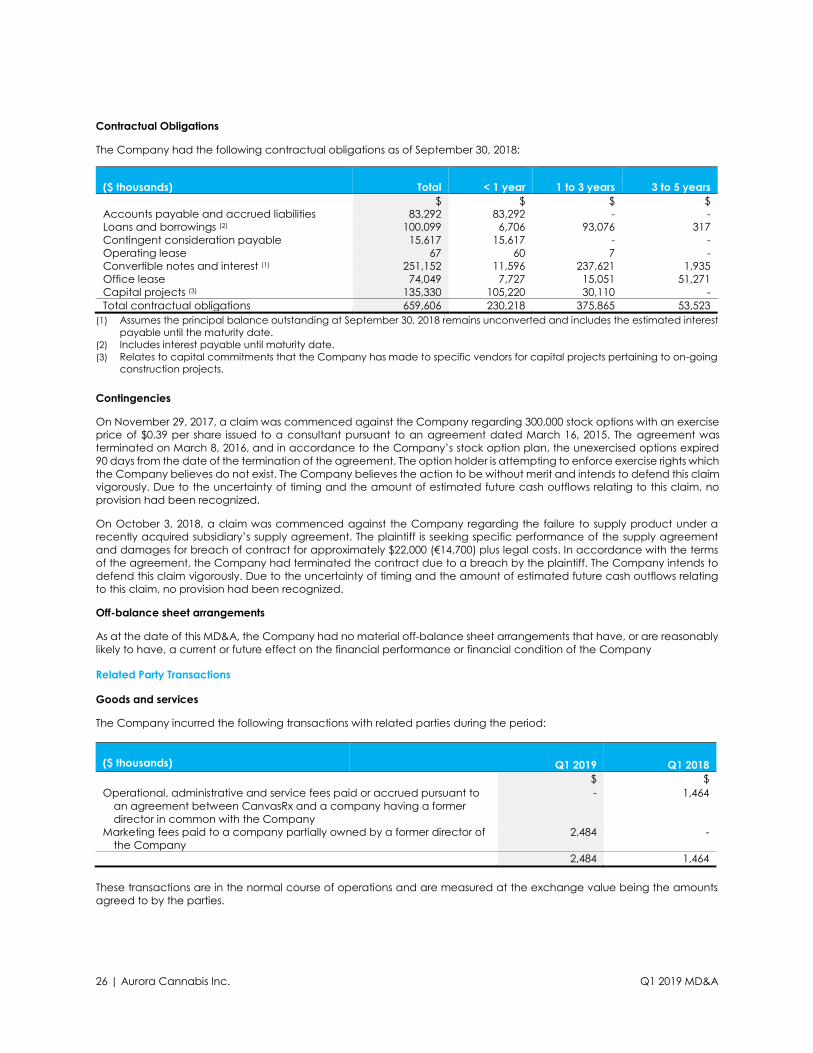
Contractual Obligations
The Company had the following contractual obligations as of September 30, 2018:
($ thousands)
Total
< 1 year
1 to 3 years
3 to 5 years
$ $ $ $
Accounts payable and accrued liabilities 83,292 83,292 - -
Loans and borrowings (2) 100,099 6,706 93,076 317
Contingent consideration payable 15,617 15,617 - -
Operating lease 67 60 7 -
Convertible notes and interest (1) 251,152 11,596 237,621 1,935
Office lease 74,049 7,727 15,051 51,271
Capital projects (3) 135,330 105,220 30,110 -
Total contractual obligations 659,606 230,218 375,865 53,523
(1) Assumes the principal balance outstanding at September 30, 2018 remains unconverted and includes the estimated interest
payable until the maturity date.
(2) Includes interest payable until maturity date.
(3) Relates to capital commitments that the Company has made to specific vendors for capital projects pertaining to on-going
construction projects.
Contingencies
On November 29, 2017, a claim was commenced against the Company regarding 300,000 stock options with an exercise
price of $0.39 per share issued to a consultant pursuant to an agreement dated March 16, 2015. The agreement was
terminated on March 8, 2016, and in accordance to the Company’s stock option plan, the unexercised options expired
90 days from the date of the termination of the agreement. The option holder is attempting to enforce exercise rights which
the Company believes do not exist. The Company believes the action to be without merit and intends to defend this claim
vigorously. Due to the uncertainty of timing and the amount of estimated future cash outflows relating to this claim, no
provision had been recognized.
On October 3, 2018, a claim was commenced against the Company regarding the failure to supply product under a
recently acquired subsidiary’s supply agreement. The plaintiff is seeking specific performance of the supply agreement
and damages for breach of contract for approximately $22,000 (€14,700) plus legal costs. In accordance with the terms
of the agreement, the Company had terminated the contract due to a breach by the plaintiff. The Company intends to
defend this claim vigorously. Due to the uncertainty of timing and the amount of estimated future cash outflows relating
to this claim, no provision had been recognized.
Off-balance sheet arrangements
As at the date of this MD&A, the Company had no material off-balance sheet arrangements that have, or are reasonably
likely to have, a current or future effect on the financial performance or financial condition of the Company
Related Party Transactions
Goods and services
The Company incurred the following transactions with related parties during the period:
($ thousands) Q1 2019 Q1 2018
$ $
Operational, administrative and service fees paid or accrued pursuant to
an agreement between CanvasRx and a company having a former
director in common with the Company
- 1,464
Marketing fees paid to a company partially owned by a former director of
the Company
2,484 -
2,484 1,464
These transactions are in the normal course of operations and are measured at the exchange value being the amounts
agreed to by the parties.
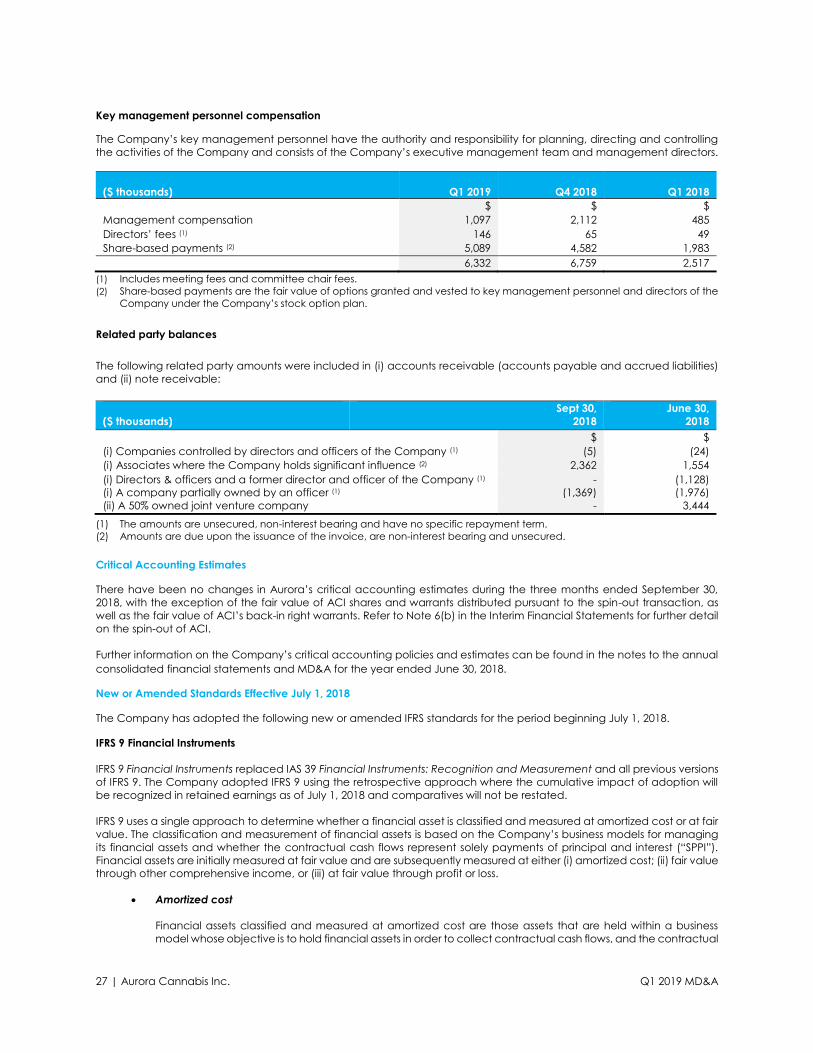
27 | Aurora Cannabis Inc. Q1 2019 MD&A
Key management personnel compensation
The Company’s key management personnel have the authority and responsibility for planning, directing and controlling
the activities of the Company and consists of the Company’s executive management team and management directors.
($ thousands)
Q1 2019
Q4 2018
Q1 2018
$ $ $
Management compensation 1,097 2,112 485
Directors’ fees (1) 146 65 49
Share-based payments (2) 5,089 4,582 1,983
6,332 6,759 2,517
(1) Includes meeting fees and committee chair fees.
(2) Share-based payments are the fair value of options granted and vested to key management personnel and directors of the
Company under the Company’s stock option plan.
Related party balances
The following related party amounts were included in (i) accounts receivable (accounts payable and accrued liabilities)
and (ii) note receivable:
($ thousands)
Sept 30,
2018
June 30,
2018
$ $
(i) Companies controlled by directors and officers of the Company (1) (5) (24)
(i) Associates where the Company holds significant influence (2) 2,362 1,554
(i) Directors & officers and a former director and officer of the Company (1)
(i) A company partially owned by an officer (1)
-
(1,369)
(1,128)
(1,976)
(ii) A 50% owned joint venture company - 3,444
(1) The amounts are unsecured, non-interest bearing and have no specific repayment term.
(2) Amounts are due upon the issuance of the invoice, are non-interest bearing and unsecured.
Critical Accounting Estimates
There have been no changes in Aurora’s critical accounting estimates during the three months ended September 30,
2018, with the exception of the fair value of ACI shares and warrants distributed pursuant to the spin-out transaction, as
well as the fair value of ACI’s back-in right warrants. Refer to Note 6(b) in the Interim Financial Statements for further detail
on the spin-out of ACI.
Further information on the Company’s critical accounting policies and estimates can be found in the notes to the annual
consolidated financial statements and MD&A for the year ended June 30, 2018.
New or Amended Standards Effective July 1, 2018
The Company has adopted the following new or amended IFRS standards for the period beginning July 1, 2018.
IFRS 9 Financial Instruments
IFRS 9 Financial Instruments replaced IAS 39 Financial Instruments: Recognition and Measurement and all previous versions
of IFRS 9. The Company adopted IFRS 9 using the retrospective approach where the cumulative impact of adoption will
be recognized in retained earnings as of July 1, 2018 and comparatives will not be restated.
IFRS 9 uses a single approach to determine whether a financial asset is classified and measured at amortized cost or at fair
value. The classification and measurement of financial assets is based on the Company’s business models for managing
its financial assets and whether the contractual cash flows represent solely payments of principal and interest (“SPPI”).
Financial assets are initially measured at fair value and are subsequently measured at either (i) amortized cost; (ii) fair value
through other comprehensive income, or (iii) at fair value through profit or loss.
• Amortized cost
Financial assets classified and measured at amortized cost are those assets that are held within a business
model whose objective is to hold financial assets in order to collect contractual cash flows, and the contractual

28 | Aurora Cannabis Inc. Q1 2019 MD&A
terms of the financial asset give rise to cash flows that are SPPI. Financial asset classified at amortized cost are
measured using the effective interest method.
• Fair value through other comprehensive income (“FVTOCI”)
Financial assets classified and measured at FVTOCI are those assets that are held within a business model
whose objective is achieved by both collecting contractual cash flows and selling financial assets, and the
contractual terms of the financial asset give rise to cash flows that are SPPI.
This classification includes certain equity instruments where IFRS 9 allows an entity to make an irrevocable
election to classify the equity instruments, on an instrument-by-instrument basis, that would otherwise be
measured at FVTPL to present subsequent changes in FVTOCI.
• Fair value through profit or loss (“FVTPL”)
Financial assets classified and measured at FVTPL are those assets that do not meet the criteria to be classified
at amortized cost or at FVTOCI. This category includes debt instruments whose cash flow characteristics are
not SPPI or are not held within a business model whose objective is either to collect contractual cash flows, or
to both collect contractual cash flows and sell the financial asset.
Consistent with IAS 39, financial liabilities under IFRS 9 are generally classified and measured at fair value at initial
recognition and subsequently measured at amortized cost. The Company has contingent consideration payables arising
from business combinations which are measured at fair value at initial recognition and subsequently at FVTPL.
The following table summarizes the classification of the Company’s financial instruments under IAS 39 and IFRS 9:
IAS 39
Classification
IFRS 9
Classification
Financial assets
Cash and cash equivalents Loans and receivables Amortized cost
Short-term investments Loans and receivables Amortized cost
Accounts receivable excluding taxes receivable Loans and receivables Amortized cost
Marketable securities Available-for-sale FVTOCI
Derivatives FVTPL FVTPL
Financial liabilities
Accounts payable and accrued liabilities Amortized cost Amortized cost
Loans and borrowings Amortized cost Amortized cost
Convertible notes Amortized cost Amortized cost
Contingent consideration payable FVTPL FVTPL
The adoption of IFRS 9 did not have an impact on the Company’s classification and measurement of financial assets and
liabilities except for equity instruments which were classified as marketable securities on the statement of financial position.
Under IFRS 9, equity investments require a designation, on an instrument-by-instrument basis, between recording both
unrealized and realized gains and losses either through (i) other comprehensive income (“OCI”) with no recycling to profit
and loss or (ii) profit and loss. On adoption of IFRS 9, the Company elected to measure its equity investments in Radient
Technologies Inc., Micron Waste Technologies Inc., and Choom Holdings Inc., which are classified as marketable securities
on the statement of financial position, at FVTOCI as these equity investments are for long-term strategic purposes. During
the period ended September 30, 2018, the Company’s additions to marketable securities were also elected to be classified
at FVTOCI, including its investments in The Green Organic Dutchman Holdings Ltd. and Australis Capital Inc. The FVTOCI
election is made upon initial recognition and once made is irrevocable. Gains and losses on these instruments including
when derecognized or sold are recorded in equity and are not subsequently reclassified to the consolidated statement of
comprehensive income (loss). On adoption of IFRS 9 on July 1, 2018, there was no change in the carrying value of the
financial instruments on transition from IAS 39.
IFRS 9 uses an expected credit loss impairment model as opposed to an incurred credit loss model under IAS 39. The
impairment model is applicable to financial assets measured at amortized cost where any expected future credit losses
are provided for, irrespective of whether a loss event has occurred as at the reporting date. For accounts receivable
excluding taxes receivable, the Company utilized a provision matrix, as permitted under the simplified approach, and has
measured the expected credit losses based on lifetime expected credit losses taking into consideration historical credit
loss experience and financial factors specific to the debtors and other factors. The carrying amount of trade receivables
is reduced for any expected credit losses through the use of an allowance account. Changes in the carrying amount of
the allowance account are recognized in the statement of comprehensive income. At the point when the Company is
satisfied that no recovery of the amount owing is possible, the amount is considered not recoverable and the financial
29 | Aurora Cannabis Inc. Q1 2019 MD&A
asset is written off. The adoption of the new expected credit loss impairment model had a negligible impact on the carrying
amounts of financial assets at amortized cost.
IFRS 15 Revenue from Contracts with Customers
The IASB replaced IAS 18 Revenue, in its entirety with IFRS 15 Revenue from Contracts with Customers. The Company
adopted IFRS 15 using the modified retrospective approach where the cumulative impact of adoption will be recognized
in retained earnings as of July 1, 2018 and comparatives will not be restated.
The standard contains a single model that applies to contracts with customers and two approaches to recognizing
revenue, at a point in time or over time, the assessment of which requires judgment. The model features the following
contract-based five-step analysis of transactions to determine whether, how much and when revenue is recognized:
1. Identifying the contract with a customer;
2. Identifying the performance obligation(s) in the contract;
3. Determining the transaction price;
4. Allocating the transaction price to the performance obligation(s) in the contract; and
5. Recognizing revenue when or as the Company satisfies the performance obligation(s).
Under IFRS 15, revenue from the sale of cannabis are generally recognized at a point in time when control over the goods
have been transferred to the customer. Payment is typically due prior to shipment and is recognized into revenue upon
the satisfaction of the performance obligation. The Company satisfies its performance obligation and transfers control
upon delivery and acceptance by the customer, the timing of which is consistent with the Company’s previous revenue
recognition policy under IAS 18.
Referral revenues earned from Licensed Producers through CanvasRx Inc. are recognized over time. Advance payments
are typically due at contract inception and is recognized into revenue on a monthly basis over a specified period of time
that the referred patient remains an active purchaser of medical cannabis with the Licensed Producer. This timing of
recognition is consistent with the Company’s previous revenue recognition policy under IAS 18.
Construction service revenues earned through Aurora Larssen Projects Ltd. are recognized over a period of time as the
performance obligations for design, engineering and construction consulting services are completed. Payment is typically
due upon the issuance of the invoice for the completed performance obligation. This timing of recognition is consistent
with the Company’s previous revenue recognition policy under IAS 11 where revenue was recognized based on the stage
of completion.
Contract liabilities arising from revenue contracts are classified as deferred revenue on the statement of financial position
and represents the entity’s obligation to transfer goods or services to a customer for which the Company has received
consideration from the customer. For the three months ended September 30, 2018, $763 of revenue recognized in the
period was included in deferred revenue as at June 30, 2018.
Receivables earned from the satisfaction of performance obligations but were not billed at the reporting date are
classified as contract asset receivables and are transferred to trade receivables when the rights become unconditional.
Contract asset receivables primarily relate to the Company’s right to consideration for work completed from design,
engineering and construction consulting services.
Based on the Company’s assessment, the adoption of this new standard had no impact on the amounts recognized in its
Interim Financial Statements.
Recent Accounting Pronouncements
The following IFRS standards have been recently issued by the IASB. Pronouncements that are not applicable or where it
has been determined do not have a significant impact to the Company have been excluded herein.
IFRS 16 Leases
In January 2016, the IASB issued IFRS 16 Leases, which will replace IAS 17 Leases. This standard introduces a single lessee
accounting model and requires a lessee to recognize assets and liabilities for all leases with a term of more than twelve
months, unless the underlying asset is of low value. A lessee is required to recognize a right-of-use asset representing its right
to use the underlying asset and a lease liability representing its obligation to make lease payments. The standard will be
effective for annual periods beginning on or after January 1, 2019, with earlier application permitted for entities that apply
IFRS 15 Revenue from Contracts with Customers at or before the date of initial adoption of IFRS 16. The Company intends
to adopt IFRS 16 on July 1, 2019 and is currently assessing the impact of this new standard on its consolidated financial
statements.
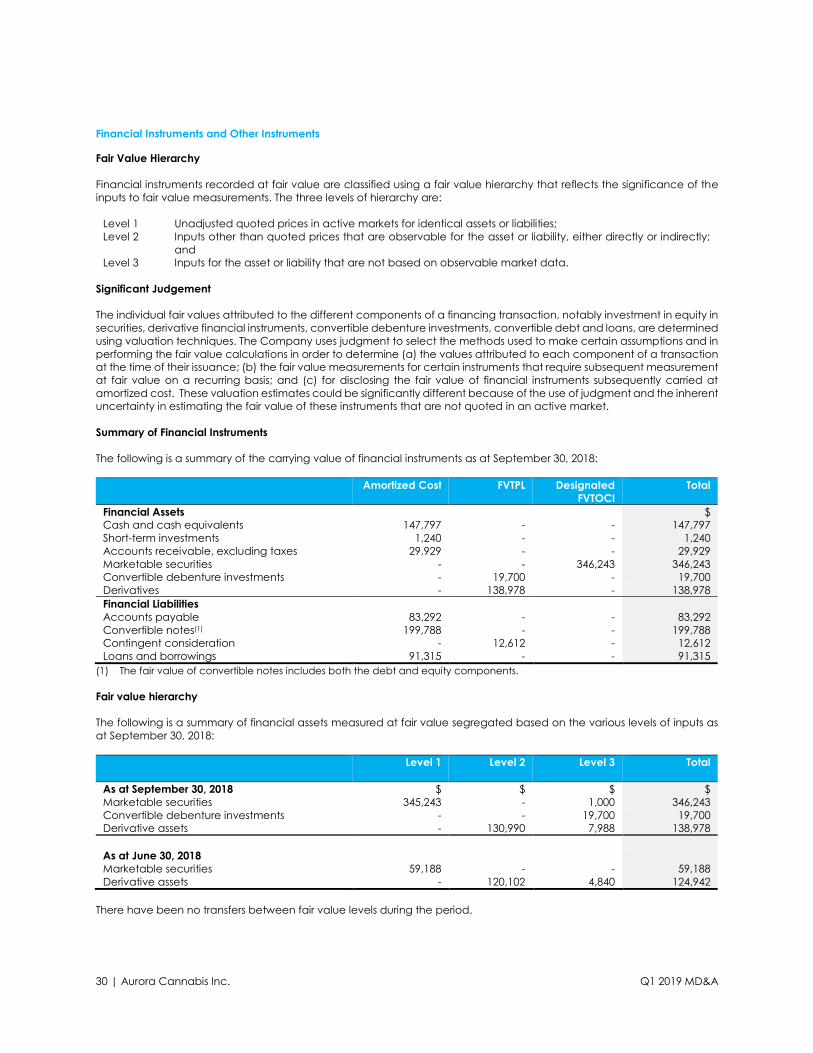
30 | Aurora Cannabis Inc. Q1 2019 MD&A
Financial Instruments and Other Instruments
Fair Value Hierarchy
Financial instruments recorded at fair value are classified using a fair value hierarchy that reflects the significance of the
inputs to fair value measurements. The three levels of hierarchy are:
Level 1 Unadjusted quoted prices in active markets for identical assets or liabilities;
Level 2 Inputs other than quoted prices that are observable for the asset or liability, either directly or indirectly;
and
Level 3 Inputs for the asset or liability that are not based on observable market data.
Significant Judgement
The individual fair values attributed to the different components of a financing transaction, notably investment in equity in
securities, derivative financial instruments, convertible debenture investments, convertible debt and loans, are determined
using valuation techniques. The Company uses judgment to select the methods used to make certain assumptions and in
performing the fair value calculations in order to determine (a) the values attributed to each component of a transaction
at the time of their issuance; (b) the fair value measurements for certain instruments that require subsequent measurement
at fair value on a recurring basis; and (c) for disclosing the fair value of financial instruments subsequently carried at
amortized cost. These valuation estimates could be significantly different because of the use of judgment and the inherent
uncertainty in estimating the fair value of these instruments that are not quoted in an active market.
Summary of Financial Instruments
The following is a summary of the carrying value of financial instruments as at September 30, 2018:
Amortized Cost FVTPL Designated
FVTOCI
Total
Financial Assets $
Cash and cash equivalents 147,797 - - 147,797
Short-term investments 1,240 - - 1,240
Accounts receivable, excluding taxes 29,929 - - 29,929
Marketable securities - - 346,243 346,243
Convertible debenture investments - 19,700 - 19,700
Derivatives - 138,978 - 138,978
Financial Liabilities
Accounts payable 83,292 - - 83,292
Convertible notes(1) 199,788 - - 199,788
Contingent consideration - 12,612 - 12,612
Loans and borrowings 91,315 - - 91,315
(1) The fair value of convertible notes includes both the debt and equity components.
Fair value hierarchy
The following is a summary of financial assets measured at fair value segregated based on the various levels of inputs as
at September 30, 2018:
Level 1 Level 2 Level 3 Total
As at September 30, 2018 $ $ $ $
Marketable securities 345,243 - 1,000 346,243
Convertible debenture investments - - 19,700 19,700
Derivative assets - 130,990 7,988 138,978
As at June 30, 2018
Marketable securities 59,188 - - 59,188
Derivative assets - 120,102 4,840 124,942
There have been no transfers between fair value levels during the period.

31 | Aurora Cannabis Inc. Q1 2019 MD&A
Changes in level 3 financial assets
The following is a summary of the changes in carrying value of level 3 financial assets during the three months ended
September 30, 2018:
Marketable
Securities
Derivatives Convertible
Debenture
Total
$ $ $ $
Balance, June 30, 2017 - 292 11,071 11,363
Additions - 30,681 - 30,681
Unrealized gain at inception - 3,050 - 3,050
Unrealized gain (loss) - (9,790) 830 (8,960)
Conversion of debenture - 4,330 (11,901) (7,571)
Exercise of warrants - (23,723) - (23,723)
Balance, June 30, 2018 - 4,840 - 4,840
Additions 1,000 - 18,003 19,003
Unrealized gain - 3,148 1,697 4,845
Ending, September 30, 2018 1,000 7,988 19,700 28,688
Unrealized gains on level 3 financial assets
The following is a summary of unrealized gains recognized on level 3 financial assets during the three months ended
September 30, 2018:
Derivatives Convertible
Debenture
Total
Three months ended September 30, 2017 $ $ $
Gain on changes in fair value 252 830 1,082
Amortized deferred inception gains 565 6,107 6,672
Unrealized gain on level 3 financial assets 817 6,937 7,754
Three months ended September 30, 2018
Gain on changes in fair value 3,148 1,097 4,245
Gain on foreign exchange - 600 600
Amortized deferred inception gains 385 - 385
Unrealized gains on level 3 financial assets 3,533 1,697 5,230
Deferred gains
The following is a summary of deferred gains on derivatives measured at fair value and included in level 3 of the fair value
hierarchy during the three months ended September 30, 2018:
Derivatives Convertible
Debenture
Total
$ $ $
Balance, June 30, 2017 321 10,206 10,527
Additions 3,051 - 3,051
Conversion of debenture 4,099 (4,099) -
Unrealized gains amortized (5,217) (6,107) (11,324)
Balance, June 30, 2018 2,254 - 2,254
Unrealized gains amortized (385) - (385)
Balance, September 30, 2018 1,869 - 1,869
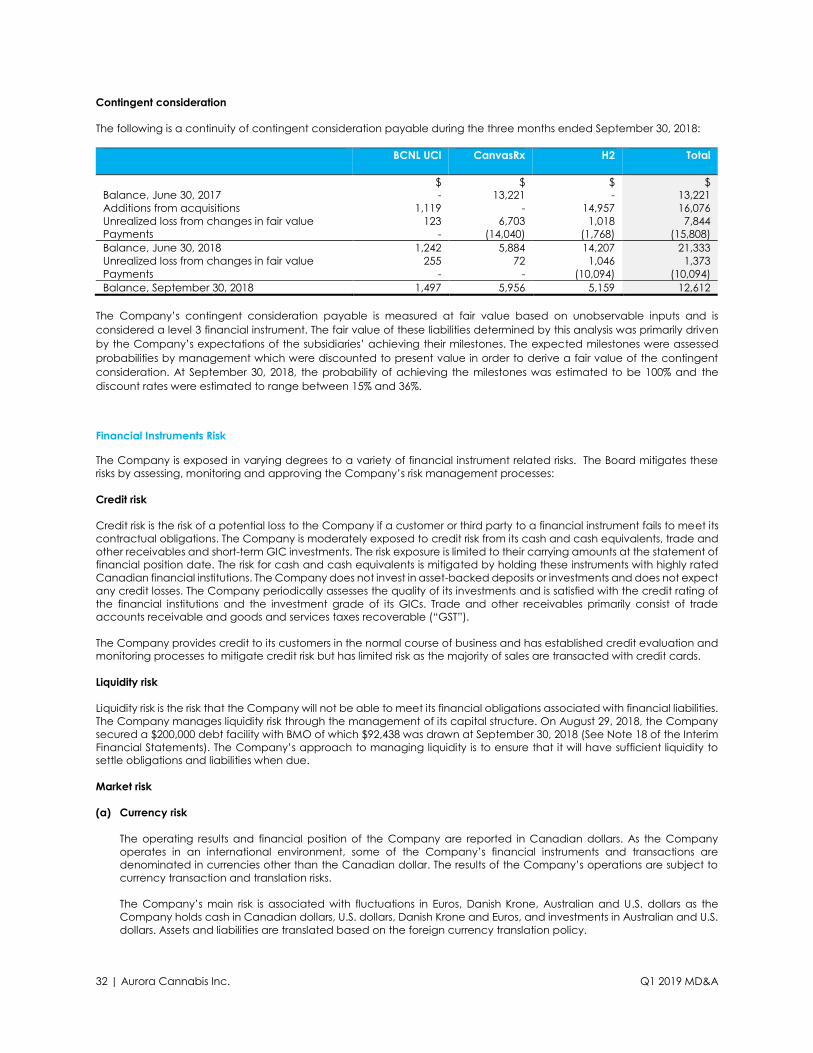
32 | Aurora Cannabis Inc. Q1 2019 MD&A
Contingent consideration
The following is a continuity of contingent consideration payable during the three months ended September 30, 2018:
BCNL UCI CanvasRx H2 Total
$ $ $ $
Balance, June 30, 2017 - 13,221 - 13,221
Additions from acquisitions 1,119 - 14,957 16,076
Unrealized loss from changes in fair value 123 6,703 1,018 7,844
Payments - (14,040) (1,768) (15,808)
Balance, June 30, 2018 1,242 5,884 14,207 21,333
Unrealized loss from changes in fair value 255 72 1,046 1,373
Payments - - (10,094) (10,094)
Balance, September 30, 2018 1,497 5,956 5,159 12,612
The Company’s contingent consideration payable is measured at fair value based on unobservable inputs and is
considered a level 3 financial instrument. The fair value of these liabilities determined by this analysis was primarily driven
by the Company’s expectations of the subsidiaries’ achieving their milestones. The expected milestones were assessed
probabilities by management which were discounted to present value in order to derive a fair value of the contingent
consideration. At September 30, 2018, the probability of achieving the milestones was estimated to be 100% and the
discount rates were estimated to range between 15% and 36%.
Financial Instruments Risk
The Company is exposed in varying degrees to a variety of financial instrument related risks. The Board mitigates these
risks by assessing, monitoring and approving the Company’s risk management processes:
Credit risk
Credit risk is the risk of a potential loss to the Company if a customer or third party to a financial instrument fails to meet its
contractual obligations. The Company is moderately exposed to credit risk from its cash and cash equivalents, trade and
other receivables and short-term GIC investments. The risk exposure is limited to their carrying amounts at the statement of
financial position date. The risk for cash and cash equivalents is mitigated by holding these instruments with highly rated
Canadian financial institutions. The Company does not invest in asset-backed deposits or investments and does not expect
any credit losses. The Company periodically assesses the quality of its investments and is satisfied with the credit rating of
the financial institutions and the investment grade of its GICs. Trade and other receivables primarily consist of trade
accounts receivable and goods and services taxes recoverable (“GST”).
The Company provides credit to its customers in the normal course of business and has established credit evaluation and
monitoring processes to mitigate credit risk but has limited risk as the majority of sales are transacted with credit cards.
Liquidity risk
Liquidity risk is the risk that the Company will not be able to meet its financial obligations associated with financial liabilities.
The Company manages liquidity risk through the management of its capital structure. On August 29, 2018, the Company
secured a $200,000 debt facility with BMO of which $92,438 was drawn at September 30, 2018 (See Note 18 of the Interim
Financial Statements). The Company’s approach to managing liquidity is to ensure that it will have sufficient liquidity to
settle obligations and liabilities when due.
Market risk
(a) Currency risk
The operating results and financial position of the Company are reported in Canadian dollars. As the Company
operates in an international environment, some of the Company’s financial instruments and transactions are
denominated in currencies other than the Canadian dollar. The results of the Company’s operations are subject to
currency transaction and translation risks.
The Company’s main risk is associated with fluctuations in Euros, Danish Krone, Australian and U.S. dollars as the
Company holds cash in Canadian dollars, U.S. dollars, Danish Krone and Euros, and investments in Australian and U.S.
dollars. Assets and liabilities are translated based on the foreign currency translation policy.
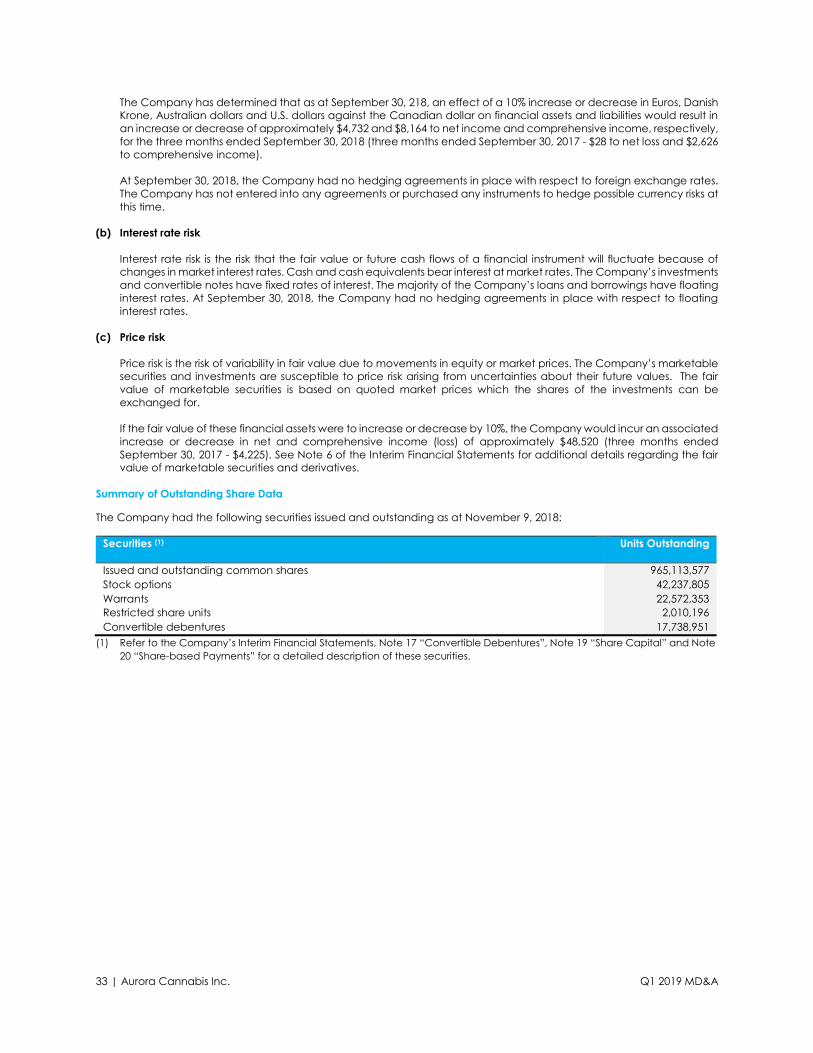
33 | Aurora Cannabis Inc. Q1 2019 MD&A
The Company has determined that as at September 30, 218, an effect of a 10% increase or decrease in Euros, Danish
Krone, Australian dollars and U.S. dollars against the Canadian dollar on financial assets and liabilities would result in
an increase or decrease of approximately $4,732 and $8,164 to net income and comprehensive income, respectively,
for the three months ended September 30, 2018 (three months ended September 30, 2017 - $28 to net loss and $2,626
to comprehensive income).
At September 30, 2018, the Company had no hedging agreements in place with respect to foreign exchange rates.
The Company has not entered into any agreements or purchased any instruments to hedge possible currency risks at
this time.
(b) Interest rate risk
Interest rate risk is the risk that the fair value or future cash flows of a financial instrument will fluctuate because of
changes in market interest rates. Cash and cash equivalents bear interest at market rates. The Company’s investments
and convertible notes have fixed rates of interest. The majority of the Company’s loans and borrowings have floating
interest rates. At September 30, 2018, the Company had no hedging agreements in place with respect to floating
interest rates.
(c) Price risk
Price risk is the risk of variability in fair value due to movements in equity or market prices. The Company’s marketable
securities and investments are susceptible to price risk arising from uncertainties about their future values. The fair
value of marketable securities is based on quoted market prices which the shares of the investments can be
exchanged for.
If the fair value of these financial assets were to increase or decrease by 10%, the Company would incur an associated
increase or decrease in net and comprehensive income (loss) of approximately $48,520 (three months ended
September 30, 2017 - $4,225). See Note 6 of the Interim Financial Statements for additional details regarding the fair
value of marketable securities and derivatives.
Summary of Outstanding Share Data
The Company had the following securities issued and outstanding as at November 9, 2018:
Securities (1) Units Outstanding
Issued and outstanding common shares 965,113,577
Stock options 42,237,805
Warrants 22,572,353
Restricted share units 2,010,196
Convertible debentures 17,738,951
(1) Refer to the Company’s Interim Financial Statements, Note 17 “Convertible Debentures”, Note 19 “Share Capital” and Note
20 “Share-based Payments” for a detailed description of these securities.
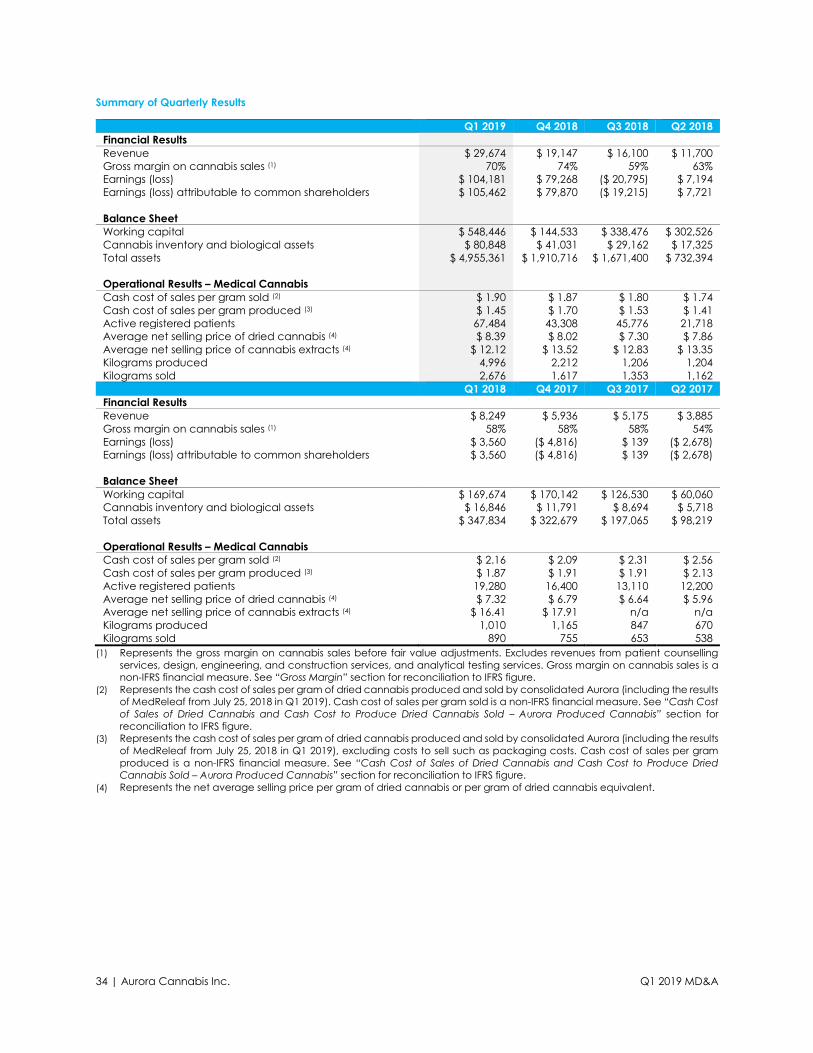
34 | Aurora Cannabis Inc. Q1 2019 MD&A
Summary of Quarterly Results
Q1 2019 Q4 2018 Q3 2018 Q2 2018
Financial Results
Revenue $ 29,674 $ 19,147 $ 16,100 $ 11,700
Gross margin on cannabis sales (1) 70% 74% 59% 63%
Earnings (loss) $ 104,181 $ 79,268 ($ 20,795) $ 7,194
Earnings (loss) attributable to common shareholders $ 105,462 $ 79,870 ($ 19,215) $ 7,721
Balance Sheet
Working capital $ 548,446 $ 144,533 $ 338,476 $ 302,526
Cannabis inventory and biological assets $ 80,848 $ 41,031 $ 29,162 $ 17,325
Total assets $ 4,955,361 $ 1,910,716 $ 1,671,400 $ 732,394
Operational Results – Medical Cannabis
Cash cost of sales per gram sold (2) $ 1.90 $ 1.87 $ 1.80 $ 1.74
Cash cost of sales per gram produced (3) $ 1.45 $ 1.70 $ 1.53 $ 1.41
Active registered patients 67,484 43,308 45,776 21,718
Average net selling price of dried cannabis (4) $ 8.39 $ 8.02 $ 7.30 $ 7.86
Average net selling price of cannabis extracts (4) $ 12.12 $ 13.52 $ 12.83 $ 13.35
Kilograms produced 4,996 2,212 1,206 1,204
Kilograms sold 2,676 1,617 1,353 1,162
Q1 2018 Q4 2017 Q3 2017 Q2 2017
Financial Results
Revenue $ 8,249 $ 5,936 $ 5,175 $ 3,885
Gross margin on cannabis sales (1) 58% 58% 58% 54%
Earnings (loss) $ 3,560 ($ 4,816) $ 139 ($ 2,678)
Earnings (loss) attributable to common shareholders $ 3,560 ($ 4,816) $ 139 ($ 2,678)
Balance Sheet
Working capital $ 169,674 $ 170,142 $ 126,530 $ 60,060
Cannabis inventory and biological assets $ 16,846 $ 11,791 $ 8,694 $ 5,718
Total assets $ 347,834 $ 322,679 $ 197,065 $ 98,219
Operational Results – Medical Cannabis
Cash cost of sales per gram sold (2) $ 2.16 $ 2.09 $ 2.31 $ 2.56
Cash cost of sales per gram produced (3) $ 1.87 $ 1.91 $ 1.91 $ 2.13
Active registered patients 19,280 16,400 13,110 12,200
Average net selling price of dried cannabis (4) $ 7.32 $ 6.79 $ 6.64 $ 5.96
Average net selling price of cannabis extracts (4) $ 16.41 $ 17.91 n/a n/a
Kilograms produced 1,010 1,165 847 670
Kilograms sold 890 755 653 538
(1) Represents the gross margin on cannabis sales before fair value adjustments. Excludes revenues from patient counselling
services, design, engineering, and construction services, and analytical testing services. Gross margin on cannabis sales is a
non-IFRS financial measure. See “Gross Margin” section for reconciliation to IFRS figure.
(2) Represents the cash cost of sales per gram of dried cannabis produced and sold by consolidated Aurora (including the results
of MedReleaf from July 25, 2018 in Q1 2019). Cash cost of sales per gram sold is a non-IFRS financial measure. See “Cash Cost
of Sales of Dried Cannabis and Cash Cost to Produce Dried Cannabis Sold – Aurora Produced Cannabis” section for
reconciliation to IFRS figure.
(3) Represents the cash cost of sales per gram of dried cannabis produced and sold by consolidated Aurora (including the results
of MedReleaf from July 25, 2018 in Q1 2019), excluding costs to sell such as packaging costs. Cash cost of sales per gram
produced is a non-IFRS financial measure. See “Cash Cost of Sales of Dried Cannabis and Cash Cost to Produce Dried
Cannabis Sold – Aurora Produced Cannabis” section for reconciliation to IFRS figure.
(4) Represents the net average selling price per gram of dried cannabis or per gram of dried cannabis equivalent.
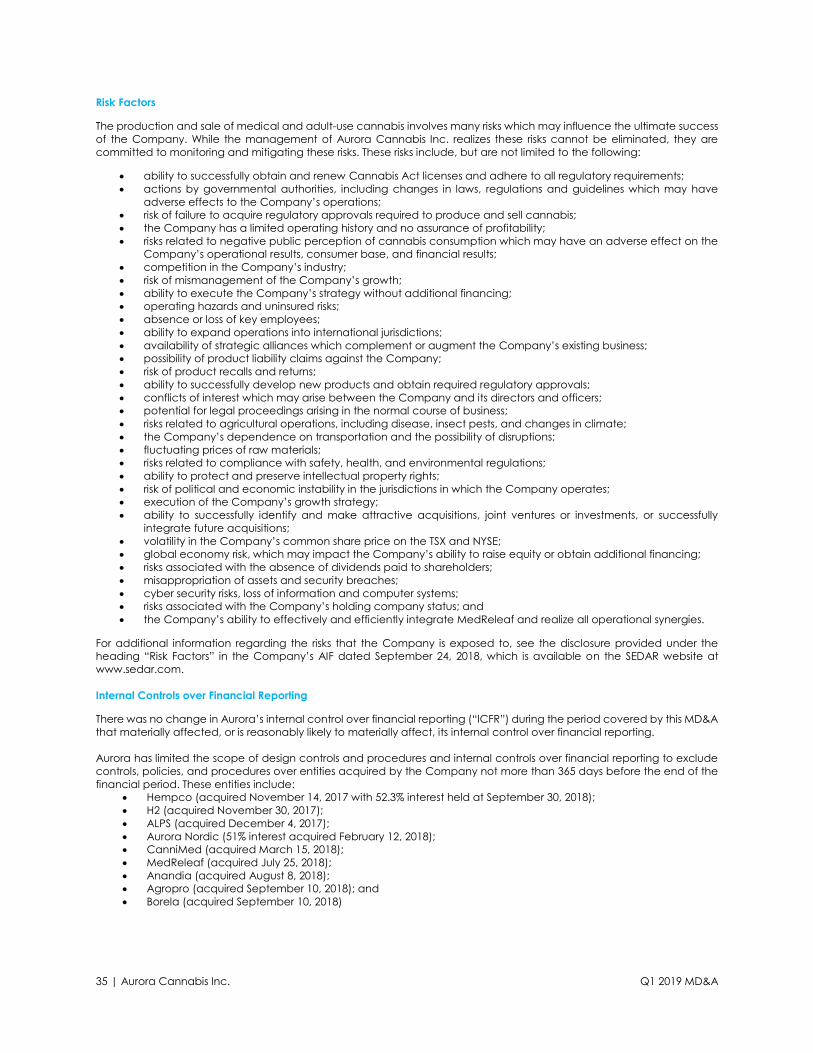
35 | Aurora Cannabis Inc. Q1 2019 MD&A
Risk Factors
The production and sale of medical and adult-use cannabis involves many risks which may influence the ultimate success
of the Company. While the management of Aurora Cannabis Inc. realizes these risks cannot be eliminated, they are
committed to monitoring and mitigating these risks. These risks include, but are not limited to the following:
• ability to successfully obtain and renew Cannabis Act licenses and adhere to all regulatory requirements;
• actions by governmental authorities, including changes in laws, regulations and guidelines which may have
adverse effects to the Company’s operations;
• risk of failure to acquire regulatory approvals required to produce and sell cannabis;
• the Company has a limited operating history and no assurance of profitability;
• risks related to negative public perception of cannabis consumption which may have an adverse effect on the
Company’s operational results, consumer base, and financial results;
• competition in the Company’s industry;
• risk of mismanagement of the Company’s growth;
• ability to execute the Company’s strategy without additional financing;
• operating hazards and uninsured risks;
• absence or loss of key employees;
• ability to expand operations into international jurisdictions;
• availability of strategic alliances which complement or augment the Company’s existing business;
• possibility of product liability claims against the Company;
• risk of product recalls and returns;
• ability to successfully develop new products and obtain required regulatory approvals;
• conflicts of interest which may arise between the Company and its directors and officers;
• potential for legal proceedings arising in the normal course of business;
• risks related to agricultural operations, including disease, insect pests, and changes in climate;
• the Company’s dependence on transportation and the possibility of disruptions;
• fluctuating prices of raw materials;
• risks related to compliance with safety, health, and environmental regulations;
• ability to protect and preserve intellectual property rights;
• risk of political and economic instability in the jurisdictions in which the Company operates;
• execution of the Company’s growth strategy;
• ability to successfully identify and make attractive acquisitions, joint ventures or investments, or successfully
integrate future acquisitions;
• volatility in the Company’s common share price on the TSX and NYSE;
• global economy risk, which may impact the Company’s ability to raise equity or obtain additional financing;
• risks associated with the absence of dividends paid to shareholders;
• misappropriation of assets and security breaches;
• cyber security risks, loss of information and computer systems;
• risks associated with the Company’s holding company status; and
• the Company’s ability to effectively and efficiently integrate MedReleaf and realize all operational synergies.
For additional information regarding the risks that the Company is exposed to, see the disclosure provided under the
heading “Risk Factors” in the Company’s AIF dated September 24, 2018, which is available on the SEDAR website at
www.sedar.com.
Internal Controls over Financial Reporting
There was no change in Aurora’s internal control over financial reporting (“ICFR”) during the period covered by this MD&A
that materially affected, or is reasonably likely to materially affect, its internal control over financial reporting.
Aurora has limited the scope of design controls and procedures and internal controls over financial reporting to exclude
controls, policies, and procedures over entities acquired by the Company not more than 365 days before the end of the
financial period. These entities include:
• Hempco (acquired November 14, 2017 with 52.3% interest held at September 30, 2018);
• H2 (acquired November 30, 2017);
• ALPS (acquired December 4, 2017);
• Aurora Nordic (51% interest acquired February 12, 2018);
• CanniMed (acquired March 15, 2018);
• MedReleaf (acquired July 25, 2018);
• Anandia (acquired August 8, 2018);
• Agropro (acquired September 10, 2018); and
• Borela (acquired September 10, 2018)
36 | Aurora Cannabis Inc. Q1 2019 MD&A
Excluding goodwill and intangible assets generated from these acquisitions, on a combined basis these entities constitute
approximately 18% of the Company’s current assets, 7% of total assets, 35% of current liabilities, 16% of total liabilities, as
well as 63% of revenue and 28% of net income as at and for the three months ended September 30, 2018.
Forward-Looking Statements
This MD&A may contain “forward-looking information” within the meaning of Canadian securities legislation (“forward-
looking statements”). These forward-looking statements are made as of the date of this MD&A and Company does not
intend, and does not assume any obligation, to update these forward-looking statements, except as required under
applicable securities legislation. Forward-looking statements relate to future events or future performance and reflect
Company management’s expectations or beliefs regarding future events. In certain cases, forward-looking statements
can be identified by the use of words such as “plans”, “expects” or “does not expect”, “is expected”, “budget”,
“scheduled”, “estimates”, “forecasts”, “intends”, “anticipates” or “does not anticipate”, or “believes”, or variations of such
words and phrases or statements that certain actions, events or results “may”, “could”, “would”, “might” or “will be taken”,
“occur” or “be achieved” or the negative of these terms or comparable terminology. In this document, certain forward-
looking statements are identified by words including “may”, “future”, “expected”, “intends” and “estimates”. By their very
nature forward-looking statements involve known and unknown risks, uncertainties and other factors which may cause the
actual results, performance or achievements of the Company to be materially different from any future results,
performance or achievements expressed or implied by the forward-looking statements. The Company provides no
assurance that forward-looking statements will prove to be accurate, as actual results and future events could differ
materially from those anticipated in such statements. Accordingly, readers should not place undue reliance on forward-
looking statements.
Certain forward-looking statements in this MD&A include, but are not limited to the following:
• pro forma measures including revenue, registered medical patients and grams produced;
• the completion of construction of production facilities, associated costs, and receipt of licenses from Health
Canada to produce and sell cannabis and cannabis related products from these facilities;
• the successful integration of CanniMed and MedReleaf into Aurora’s operations;
• strategic investments and capital expenditures, and related benefits;
• future growth expansion plans;
• expectations regarding production capacity, costs and yields; and
• product sales expectation and corresponding forecasted increase in revenue.
The above and other aspects of the Company’s anticipated future operations are forward-looking in nature and, as a
result, are subject to certain risks and uncertainties. Although the Company believes that the expectations reflected in
these forward-looking statements are reasonable, undue reliance should not be placed on them as actual results may
differ materially from the forward-looking statements. Such forward-looking statements are estimates reflecting the
Company's best judgment based upon current information and involve a number of risks and uncertainties, and there can
be no assurance that other factors will not affect the accuracy of such forward-looking statements. Such factors include
but are not limited to the Company’s ability to obtain the necessary financing and the general impact of financial market
conditions, the yield from marijuana growing operations, product demand, changes in prices of required commodities,
competition, government regulations and other risks as set out under “Risk Factors” in the Company’s AIF dated September
24, 2018 filed on SEDAR at www.sedar.com.
Aurora Cannabis Inc. Q1 2019 MD&A 11
Corporate Directory
DIRECTORS
Michael Singer Chairman
Norma Beauchamp Director
Terry Booth CEO, Aurora Cannabis
Steve Dobler President, Aurora Cannabis
Dr. Jason Dyck Director
Ronald Funk Director
Diane Jang CEO, Hempco Food and Fiber Inc.
Adam Szweras Director
SHAREHOLDER INFORMATION
Stock Exchange Listing NYSE: ACB | TSX: ACB
Registrar and Transfer Agent Computershare Ltd. Vancouver 510 Burrard St, 3rd Floor Vancouver, BC V6C 3B9 Tel.: 1-604-661-9400Fax: 1-604-661-9549
Auditors KPMG LLP, Vancouver
INVESTOR CONTACTS
Phone: 1-855-279-4652Email: [email protected]
Robert KellyDirector of Investor RelationsAurora
Marc LakmaakerVice President, Investor Relations and Corporate DevelopmentAurora
OFFICERS
Terry Booth CEO
Steve Dobler President
Neil Belot CBDO
Cam Battley CCO
Glen Ibbott CFO
Allan Cleiren COO
Darryl Vleeming CIO
Debra Wilson CHRO

www.auroramj.com