q1 2019 financial results...this presentation is a high-level summary of our q1 2019 financial...
TRANSCRIPT

May 8, 2019
Q1 2019Financial Results
1

This presentation is a high-level summary of our Q1 2019 financial results. For more information please refer to our press release dated May 8, 2019 and filings with the SEC.
This presentation contains forward-looking statements within the meaning of the federal securities laws. Forward-looking statements include statements relating to our ability to bring buyers back to Etsy.com, our market opportunity, our financial guidance and key drivers thereof, anticipated marketing spend and other planned investments and their anticipated impact on our future financial results, anticipated product launches and impact of experiments, including on conversion rates, anticipated growth in active buyers, and investments in and timing of our migration to the cloud and its anticipated impact on our future financial results. Forward-looking statements include all statements that are not historical facts. In some cases, forward-looking statements can be identified by terms such as “anticipates,” “believes,” “could,” “estimates,” “expects,” “may,” “plans,” “will,” “intends,” or similar expressions and the negatives of those words.
Forward-looking statements involve substantial risks and uncertainties that may cause actual results to differ materially from those that we expect. These risks and uncertainties include: (1) the fluctuation of our quarterly operating results; (2) our ability to implement our business strategy; (3) our ability to attract and retain an active and engaged community of Etsy sellers and Etsy buyers; (4) our history of operating losses;(5) macroeconomic events that are outside of our control; (6) our ability to recruit and retain employees; (7) the importance to our success of the trustworthiness of our marketplace and the connections within our community; (8) our ability to enhance our current offerings and develop new offerings to respond to the changing needs of Etsy sellers and Etsy buyers; (9) the effectiveness of our marketing efforts; (10) the effectiveness of our mobile solutions for Etsy sellers and Etsy buyers; (11) our ability to expand our business in our core geographic markets; (12) regulation in the area of privacy and protection of user data; (13) our dependence on third-party payment providers; and (14) the potential misuse or disclosure of sensitive information about members of our community and the potential for cyber-attacks. These risks and uncertainties are more fully described in our filings with the Securities and Exchange Commission, including in the section entitled “Risk Factors” in our Annual Report on Form 10-K for the year ended December 31, 2018, and subsequent reports that we file with the Securities and Exchange Commission. Moreover, we operate in a very competitive and rapidly changing environment. New risks emerge from time to time. It is not possible for our management to predict all risks, nor can we assess the impact of all factors on our business or the extent to which any factor, or combination of factors, may cause actual results to differ materially from those contained in any forward-looking statements we may make. In light of these risks, uncertainties and assumptions, we cannot guarantee future results, levels of activity, performance, achievements or events and circumstances reflected in the forward-looking statements will occur. Forward-looking statements represent our beliefs and assumptions only as of the date of this presentation. We disclaim any obligation to update forward-looking statements.
Forward-looking Statements
Q1 2019 Financial Results2

Josh SilvermanCEO
Q1 2019 Financial Results3

1EPS reflects diluted earnings per share2Reconciliation of non-GAAP financial measures is contained in the appendix
GMS Growth Adj. EBITDA Margin
29.4%
21.9%20.9%
22.6%
20.6%17.6% 19.3%
20.8%
23.1%
Revenue Growth
40.1%
24.8%
30.2%
Reflects pricing changes
41.3%
46.8%25.7%
Revenue
$169M+40.1% Y/Y
Net Income
$32M$0.24 EPS1
Adj. EBITDA2
$50M29.4% Margin
GMS
$1B+18.9% Y/Y
+20.6% Y/Y (FX adj.)
Solid financial performance to start 2019...
Q1 2019 Financial Results4

United States
Canada
United Kingdom
Australia
France
Germany
1.Focus on the core Etsy marketplace in our 6 core geographies
2.Build a sustainable competitive advantage around four key elements
Best-in-Class
Search and
Discovery
Human
Connections
A Trusted
Brand
Our Collection of Unique Items
× ×
Executing our long-term growth strategy
Q1 2019 Financial Results5

Item Price
Location
Device type
Categories
Color Favorites
Age Language
Delivery speed
Recent activity
Material
gold ring
Search results for a gold ring
Search results for a gold ring with elevated price ranking
Product initiatives drive Q1 performance
Q1 2019 Financial Results6

Aligning for integrated, full-funnel marketing campaigns
Q1 2019 Financial Results
FULL-FUNNEL MARKETING
7

Marketing channels
Campaign priorities
Q1 2019 Financial Results
Etsy’s New Creative Campaign Optimized for Digital Video
Testing new marketing channels again in Q2
➔ TV advertising
➔ Digital video
➔ Paid social
➔ Buyer frequency
➔ Improvement in brand awareness
➔ Increase in visits
➔ Improved purchase intent
8

We have a significant runway for sustainable long-term growth
● Unique and defensible Right to Win
● Untapped opportunities in product development and marketing investment
● Best-in-class technology to fuel our growth
● Disciplined leadership team and high performance culture
Executing on an early stage growth opportunity
Q1 2019 Financial Results9

Q1 2019 Financial Results
Rachel Glaser CFO
10

GMS
$1B+18.9% Y/Y
Active Buyers
41M+18% Y/Y
Active Sellers
2.2M+13% Y/Y
GMS per Active Buyer
$99.8
$97.9
$99.0
$99.8 $99.7
% GMS of New vs. Repeat Buyers % Paid GMS
15%+19% Y/Y
% International GMS
38%+33% Y/Y (FX adj.)
Year-over-year growth
-0.9% 0.6% 2.0% 2.2% 2.0%
+20.6% Y/Y (FX adj.)
Q1 2019 Financial Results
Strong execution has led to solid financial and operational results
11
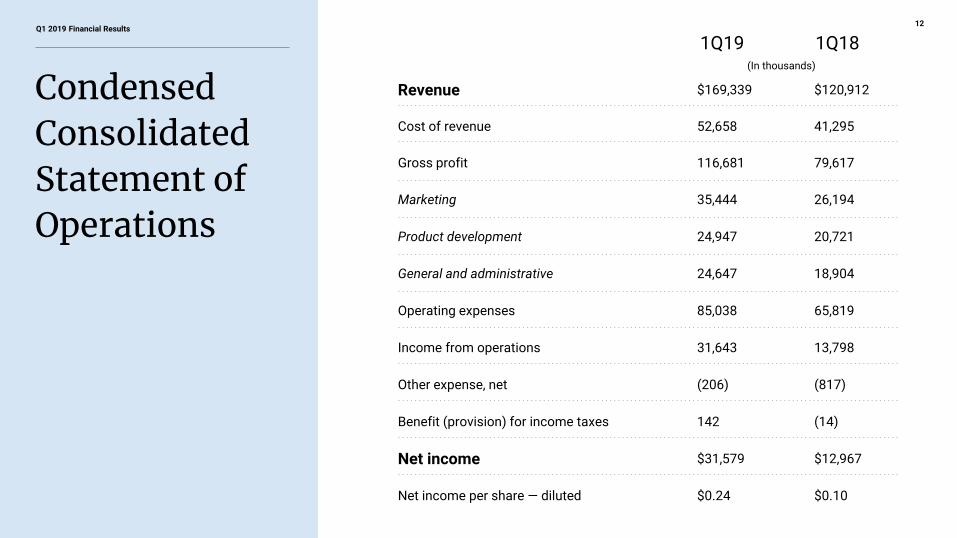
Revenue $169,339 $120,912
Cost of revenue 52,658 41,295
Gross profit 116,681 79,617
Marketing 35,444 26,194
Product development 24,947 20,721
General and administrative 24,647 18,904
Operating expenses 85,038 65,819
Income from operations 31,643 13,798
Other expense, net (206) (817)
Benefit (provision) for income taxes 142 (14)
Net income $31,579 $12,967
Net income per share — diluted $0.24 $0.10
Q1 2019 Financial Results
Condensed Consolidated Statement of Operations
1Q19 1Q18(In thousands)
12

Q1 2019 Financial Results
2019 Guidance for GMS, Revenueand Adjusted EBITDA
13*Based on the mid-point of 2019 revenue guidance. Reconciliation of non-GAAP financial measures is contained in the Appendix.
Key factors potentially impacting our 2019 guidance are contained in the Appendix.
2019 GuidanceMay 8, 2019
18 - 21%GMS Growth
30 - 32%Revenue Growth
23 - 25%Adjusted EBITDA Margin*
2019 GuidanceFebruary 25, 2019
17 - 20%
29 - 32%
23 - 25%
13

Q&A

15
Appendix

Services Revenue(Optional value-added services)
Promoted Listings
Etsy Shipping Labels
Pattern
Etsy Plus
Marketplace Revenue
$.20 Listing Fee per item
Transaction Fee1
Etsy Payments 3-4.5% + flat fee
$126M, up 43% YoY
$42M, up 29% YoY
1On July 16, 2018, we increased our seller transaction fee from 3.5% to 5%, and now apply it to the cost of shipping in addition to the cost of the item
*As of 3/31/2019
$169M, up 40% YoY
We have a diversified revenue model consisting of mandatory fees and optional value-added services

We anticipate that the key factors impacting our 2019 GMS and revenue guidance will be:
● Continued visit growth.
● Conversion rate improvements driven by product launches enhancing the buying experience.
● Incremental GMS from marketing investments.
● Continued currency-neutral growth in international GMS, which we expect to grow faster than overall GMS, driven by global product
enhancements and marketing.
● We assume a stable macro environment. However, external factors may offset some growth, such as E.U. regulatory conditions, currency
fluctuations, changes to VAT and state sales tax laws, and the potential for geopolitical events that impact trade.*
We anticipate that the key factors impacting our 2019 Adjusted EBITDA margin guidance will be:
● Planned investments in marketing including investments in newer channels for Etsy with more speculative returns.
● Lower operating expense as a percent of revenue stemming from gaining leverage in our operating structure. We expect to gain leverage in
both product development and general administrative expenses, which excludes the impact of depreciation from the implementation of new
lease accounting standards.
● Cloud costs, which we expect to be higher for the full year than we indicated last quarter, most of which will be expensed through cost of
revenue.
○ Additionally, during the migration, we are maintaining some of our existing data center infrastructure to ensure reliability of our
platform.
○ As we migrate to the cloud, we anticipate spending a smaller portion on existing data center infrastructure and more on cloud
capacity.
17Q1 2019 Financial Results
Key factors impacting our 2019 Guidance
*These, and other risks and uncertainties, are more fully described in in our Annual Report on Form 10-K for the year ended December 31, 2018, and subsequent reports that we file with the Securities and Exchange Commission.

Condensed Consolidated Statement of Cash Flows
1Q19 1Q18
(in thousands)
Net Income $31,579 $12,967
Net cash provided by operating activities 31,458 26,169
Net cash used in investing activities (22,004) (45,653)
Net cash (used in) provided by financing activities (29,307) 233,836
Effect of exchange rate changes on cash (1,458) 4,061
Net (decrease) increase in cash, cash equivalents, and restricted cash
(21,311) 218,413
Cash, cash equivalents, and restricted cash at the beginning of the period
372,326 320,783
Cash, cash equivalents, and restricted cash at the end of the period $351,015 $539,196
18Q1 2019 Financial Results

Condensed Consolidated Balance Sheets
19Q1 2019 Financial Results
1Q19 4Q18
(in thousands)
Cash and cash equivalents $345,674 $366,985
Short-term investments 276,432 257,302
Accounts receivable, net 10,789 12,244
Property and equipment, net 131,650 120,179
Other current and non-current assets 216,623 145,141
Total assets $981,168 $901,851
Accounts payable $17,325 $26,545
Finance lease obligations, net of current portion 59,610 2,095
Facility financing obligation - 59,991
Long-term debt, net 280,226 276,486
Other current and non-current liabilities 203,994 135,836
Total liabilities 561,155 500,953
Total stockholders’ equity 420,013 400,898
Total liabilities and stockholders’ equity $981,168 $901,851

1Q19 1Q18
(in thousands)
Net income $31,579 $12,967
Excluding:
Interest and other non-operating expense, net 1,268 2,667
(Benefit) provision for income taxes (142) 14
Depreciation and amortization 10,142 6,320
Stock-based compensation expense 8,082 6,454
Foreign exchange gain (1,062) (1,850)
Restructuring and other exit income — (151)
Adjusted EBITDA $49,867 $26,421
20Q1 2019 Financial Results
Reconciliation of Quarterly Net Income to Adj. EBITDA