q1 2018 email program review - preview.4at5.netpreview.4at5.net/email_domains/mar/1000/monthly...q1...
TRANSCRIPT

Q1 2018 EMAIL PROGRAM REVIEW June 21, 2018
Q1 REVIEW MEETING AGENDA Performance Summary
Key Initiatives & Campaign Highlights
Core Campaigns

Q1 PERFORMANCE SUMMARY

EMAIL PERFORMANCE 4
FIRST QUARTER MADE POSITIVE KPI REBOUNDS VS. LQ
313.6M Emails Delivered -18.6% QoQ +13.1% YoY
9.1% CTO Rate
+21.3% QoQ +6.6% YoY
8.5% Conversion Rate
+0% QoQ -14.3% YoY
1.7 Bookings/Delivered (K)
+30.8% QoQ -10.5% YoY
22.3M Mailable Audience +3.6% QoQ +17.6% YoY
• Delivered increase is positive for exposure; open rates down YoY but CTOR has a healthy increase • Stronger emphasis on non-booking benefits correlated with declines in conversion and booking
1.27M Room Nights
+10% QoQ +1.3% YoY
22.3% Open Rate
+8.3% QoQ -2.1% YoY
*Financials based on EIR data

INDUSTRY ENGAGEMENT
PERFORMANCE CONSISTENT WITH Q1 2018 YLM BENCHMARKS
• The average number of emails sent per engaged subscriber declined by 29.3% from Q4 2017 to Q1 2018.
• The average open rate increased by 5.8% and the average unique click rate jumped by 12.1% QoQ.
Except… • The average unsubscribe rate increased by 15.7% QoQ.
• The unique click rate decreased by 7% YoY.
5

GROWTH OF MR EMAIL ENGAGEMENT 6
MEMBER ENGAGEMENT HAS STEADILY INCREASED OVER THE PAST 4 QUARTERS Fewer unengaged
members

EXECUTIVE DASHBOARD 7
Q1 2018 Email Performance:
• Expanded reach but BPK is down across the board, with the exception of Destinations mailings
• Destinations, Solos and Lifecycle are driving overall positive performance of program; Hotel Specials continues to underperform
• Lifecycle emails have the best CTOR of all categories at 22.4%
Program eNews
Hotel
Specials Dest. Solos Lifecycle MRCC METT313.6 M 44.6 M 29.0 M 41.7 M 111.1 M 21.4 M 47.0 M 18.9 M
13.1% 3.7% -6.9% 11.6% 27.3% 26.7% 7.5% 4.9%
0.16% 0.11% 0.15% 0.14% 0.14% 0.32% 0.22% 0.18%
-0.0 pts -0.0 pts -0.0 pts 0.0 pts 0.0 pts 0.1 pts -0.0 pts -0.1 pts
99.0% 99.2% 99.2% 99.2% 99.2% 97.3% 98.7% 98.8%
0.2 pts 0.1 pts -0.3 pts -0.3 pts -0.1 pts 0.8 pts -0.1 pts 3.3 pts
22.3% 19.6% 18.4% 19.7% 25.0% 27.0% 20.7% 22.5%
-0.5 pts -1.8 pts -1.5 pts -2.6 pts 2.1 pts -4.3 pts -2.3 pts 0.2 pts
69.9 M 8.7 M 5.3 M 8.2 M 27.8 M 5.8 M 9.7 M 4.3 M
10.7% -5.1% -13.9% -1.2% 39.1% 9.2% -3.4% 5.8%
2.0% 2.2% 1.4% 1.5% 2.4% 6.1% 0.7% 0.6%
0.1 pts -0.6 pts -0.1 pts 0.3 pts 0.2 pts 0.6 pts -0.1 pts -0.4 pts
6.3 M 960.1 K 396.0 K 636.0 K 2.6 M 1.3 M 308.8 K 113.2 K
18.1% -19.0% -12.1% 40.8% 39.9% 42.0% -1.3% -36.4%
9.1% 11.0% 7.4% 7.8% 9.5% 22.4% 3.2% 2.7%
0.6 pts -1.9 pts 0.2 pts 2.3 pts 0.1 pts 5.2 pts 0.1 pts -1.8 pts
540.5 K 107.3 K 30.3 K 38.0 K 248.5 K 76.0 K 29.0 K 11.4 K
1.2% -12.8% -24.9% 23.2% 20.2% -0.3% -20.0% -44.3%
1.3 M 254.3 K 69.1 K 91.6 K 577.8 K 187.6 K 62.8 K 26.5 K
1.3% -12.3% -26.1% 23.1% 19.3% 1.2% -21.1% -41.5%
$196.9 M $40.0 M $10.8 M $14.7 M $89.4 M $29.1 M $8.6 M $4.4 M
2.0% -10.3% -25.9% 24.7% 19.7% 2.2% -27.3% -38.5%
8.5% 11.2% 7.6% 6.0% 9.4% 5.9% 9.4% 10.1%
-1.4 pts 0.8 pts -1.3 pts -0.9 pts -1.5 pts -2.5 pts -2.2 pts -1.4 pts
1.7 2.4 1.0 0.9 2.2 3.6 0.6 0.6
-10.5% -15.9% -19.4% 10.4% -5.6% -21.4% -25.6% -46.9%
Aud
ienc
e
Total
Delivered
Unsub Rate
Delivery Rate
Enga
gem
ent
Open Rate
Opens
Click Rate
Unique Clicks
Click to Open
Rate
Fina
ncia
l
Bookings
RoomNights
Revenue
Conversion Rate
Bookings per
Delivered(K)
PROGRAM SUMMARY 8
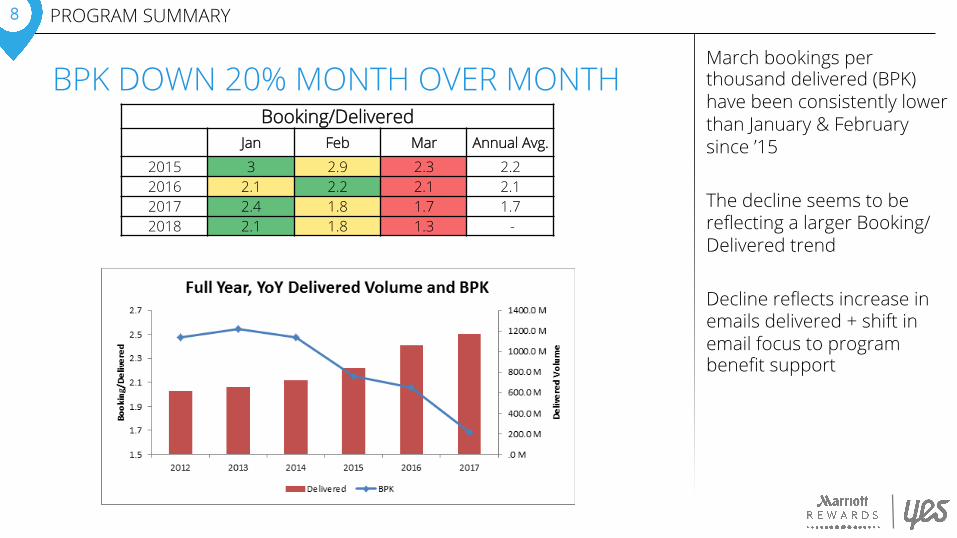
BPK DOWN 20% MONTH OVER MONTH March bookings per thousand delivered (BPK) have been consistently lower than January & February since ’15 The decline seems to be reflecting a larger Booking/Delivered trend Decline reflects increase in emails delivered + shift in email focus to program benefit support
Booking/Delivered Jan Feb Mar Annual Avg.
2015 3 2.9 2.3 2.2 2016 2.1 2.2 2.1 2.1 2017 2.4 1.8 1.7 1.7 2018 2.1 1.8 1.3 -

PROGRAM SUMMARY 9
SOLO’S DRIVE PROGRAM METRICS • 50% increase in number of unique Solo emails sent YoY • 83% of Q1 Solo’s were focused on program benefits (non-booking) • Increase in Solo room nights are positive for the program
Q1 '18
Delivered vs. LY Q1 '18 Room Nts. vs. LY Q1 '18
BPK vs. LY
eNews 44.6 M 4% 254.3 K -12% 2.4 -16% Hotel Specials 29.0 M -7% 69.1 K -26% 1.0 -19%
Solo 111.1 M 27% 577.8 K 19% 2.2 -6% Lifecycle 21.4 M 27% 187.6 K 1% 3.6 -21%
MRCC 47.0 M 8% 62.8 K -21% 0.6 -26% METT 18.9 M 5% 26.5 K -41% 0.6 -47%
Destinations 41.7 M 12% 91.6 K 23% 0.9 10% Grand Total 313.6 M 13% 1.3 M 1% 1.7 -10%
Solo’s drive program: 35% of Delivered
46% of Room Nights

PROGRAM SUMMARY 10
RECOMMENDATIONS • Establish tracking & reporting process for business
partner KPI’s o Redemptions (MR Moments, RewardsPlus) o Registrations (MegaBonus) o Acquisitions (by segment for cobrand card solicitations) o Partner Revenue (Marriott Vacations Worldwide, Hertz)
• Use customer data to improve targeting; expected hit on emails delivered

KEY INITIATIVES & CAMPAIGN HIGHLIGHTS
• Moments Testing & Optimization • MRCC Canada Winback • Spring MegaBonus Support

Q1 ‘18 MOMENTS RECAP 12
MOMENTS ENGAGEMENT CONTINUES TO IMPROVE • CTOR spiked in Feb; High points group up 19% MoM and Low up 22%
o Possible impact from deployment change – from typical Monday’s to Tuesday o Consider day of week testing to determine best day for email and redemption engagement
• March open rate for Low jumped 10% MoM and CTOR up 43% o Drop in delivered counts MoM effected metrics by boosting rates o The March subject line used ‘intrigue’ to drive engagement; consider testing with first name
Low Group Subject Lines Delivered Open Rate
JAN: Discover Your Best Moment Ever 2.1M 41.0%
FEB: Discover Moments to <3, [FNAME] 1.6M 42.9%
MAR: These Moments Are for Members Only 1.4M 47.4%

MOMENTS IMAGE A/B TEST 13
CREATIVE TEST CONCLUDES ANIMATED MOSAIC DRIVES CTOR LIFTS VS. FULL SPAN IMAGE • Final 3 month test results show
higher Section and Campaign CTO rates with the animated mosaic treatment o CTOR lifts up to 19% for section and
3% for campaign
• Animated mosaic may be a contributing factor to lifts; consider testing with & without animation
• Leverage mosaic style going forward o Opportunity to use Wylei
optimization to enhance with other category images

MRCC CANADA WINBACK RECAP 14
HIGH ENGAGEMENT WITH CANADA CREDIT CARD EMAILS: NOTIFICATION & WINBACK OFFER
Overview: • Notification sent in mid-Jan to
Canadian cardholders about the cancellation of their credit card
• Late Jan, a winback offer was sent promoting the Amex SPG card product
Observations: • High open rate with initial
notification; minimal links resulted in low CTOR • Reminders drove incremental
engagement • Consider using propensity
data to improve performance of 3rd reminder
1/19: Initial Notification
1/29: Winback
Spikes coincide with email deployments

MRCC CANADA WINBACK RECAP 15
45% OF NEW WINBACK ACCOUNTS FROM EMAIL
• 14,000+ total new accounts
• 45% of new accounts were acquired from MR email channel
• eNews drove 45% more new accounts vs. SPG’s monthly newsletter banner
Use tactics to partner on future non-U.S. cross-product promotions

SPRING ‘18 MEGABONUS SUPPORT OVERVIEW 16
$45.3M FROM SPRING MEGABONUS EMAIL SUPPORT
• Bookings are down YoY despite increased reach through more deliveries
• One major difference was Spring 2017 had an Announcement, which drove $20.4M in Revenue
Spring ‘17 Summer ’17 Fall ’17 Spring ‘18
# campaigns featured 9 9 11 8
Reach 68.8M 85.4M 91.7M 86.1M
Revenue (EIR) $52.2M $45.2M $58M $45.3M
Booking 144.8K 133.2K 171.9K 124.4K
*Promotion results are for first 3 months

SPRING ‘18 MEGABONUS SUPPORT 17
RECOMMENDATIONS • Announcements: leverage eNews and Solo to non-openers • Registration Confirmation:
o Use “Book now” CTA o Include booking content (Travel Deals, hotel propensity)
• Reminder Solo’s: segment audience based on promo activity and tailor content to each segment
• Achievement Solo: use hotel propensity for next stay reco • Include offer in subject lines
Apply above recommendations to other emails with MegaBonus content

CORE CAMPAIGNS

CORE CAMPAIGNS 19
ENEWS
Delivered 4% more emails QoQ, but opens & clicks decreased MoM • MegaBonus feature saw
fewer section clicks in Feb. (-24% vs. 12M avg.)
• Marriott Vacations feature in Mar. saw fewer clicks (-36% vs. 12M avg.)
Consider using SL test & roll and content optimization in feature to lift clicks • Retest winning styles: • Promo: “Sign up for…” • Intrigue: “The Most Popular
Benefits Are…”
• When possible, leverage image optimization or DCA/Wylei to lift CTOR’s
19.6% Open Rate -1.8 pts.
11.0% CTO Rate -1.9 pts.
2.2% Click Rate -0.6 pts.
Engagement
2.4 BPK
-15.9%
254.3K Room Nights
-12.3%
11.2% Conversion 0.8 pts.
$40MM Revenue -10.3%
Financial

CORE CAMPAIGNS 20
HOTEL SPECIALS
Day of week deployment test concluded in Mar; • Results show Fri conversion
rate up 25% vs. Tues • BPK 9% higher • Continue to monitor KPI’s Submitted offer counts dropped in Mar to 16; down from 32 in Jan and 27 in Feb Continue subject line tests monthly to lift open rates Improve offer quality through re-education
18.4% Open Rate -1.5 pts.
7.4% CTO Rate 0.2 pts.
1.4% Click Rate -0.1 pts.
1.0 BPK
-19.4%
69.1K Room Nights
-26.1%
7.6% Conversion -1.3 pts.
$10.8MM Revenue -25.9%
Engagement
Financial

CORE CAMPAIGNS 21
DESTINATIONS
Sat vs. Fri deployment test generated higher open & CTO rates in Feb and Mar: • Open rate: up 2% and 4% • CTO rate: up 8% and 13% • April shows same trends
Continue SL test & roll to lift open rates; down almost 3 pts. QoQ; re-test winning styles: • Personal tone: “Let’s Talk
Vacation, [FNAME]” • Listicle: “4 Trips for Every
Relationship Style” • Intrigue/FOMO: “Don’t Miss
This Road Trip”
QoQ, clicks are up 41%; Mar saw the highest CTOR since 2016 at 9.7% • Started summer travel series • Positive impact of day of wk.
test
19.7% Open Rate -2.6 pts.
7.8% CTO Rate 2.3 pts.
1.5% Click Rate 0.3 pts.
0.9 BPK
10.4%
91.6K Room Nights
23.1%
6.0% Conversion -0.9 pts.
$14.7MM Revenue 24.7%
Engagement
Financial

ACTIONABLE INSIGHTS
ACTIONABLE INSIGHTS 23
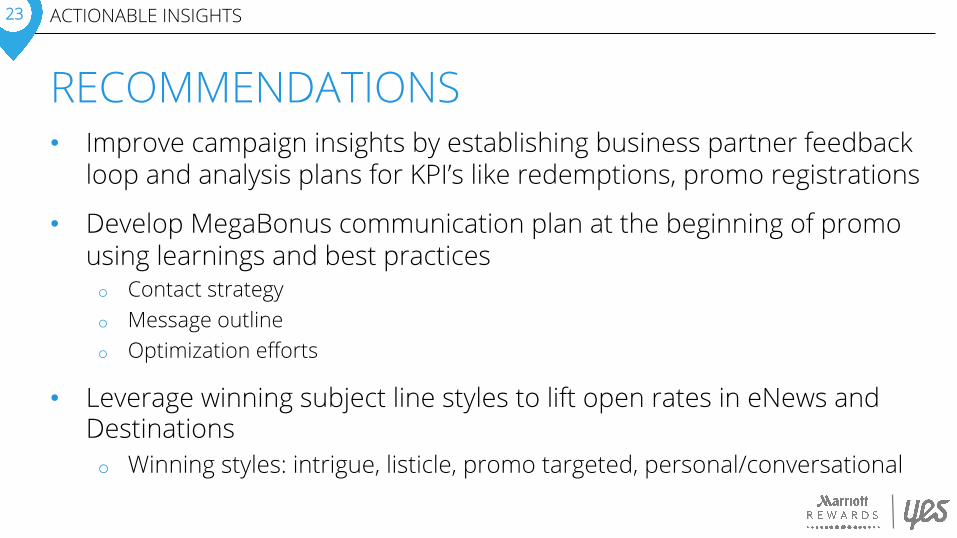
RECOMMENDATIONS • Improve campaign insights by establishing business partner feedback
loop and analysis plans for KPI’s like redemptions, promo registrations
• Develop MegaBonus communication plan at the beginning of promo using learnings and best practices o Contact strategy o Message outline o Optimization efforts
• Leverage winning subject line styles to lift open rates in eNews and Destinations o Winning styles: intrigue, listicle, promo targeted, personal/conversational

MARRIOTT TRAVELER Q1 2018 NEWSLETTER
PERFORMANCE RESULTS

TRAVELER PERFORMANCE RECAP
Feb
• Above goal open rates each month from subject line testing
• Audience expansion had impact on engagement; click rates at an all time low
• However, February quiz drove record high click engagement
Jan Mar Feb

EMAIL PERFORMANCE RESULTS: Q1 2018
11.2M Deployed
97% Delivery Rate
18% Open Rate 15% is Goal
(+3 pts. vs. goal)
1% Click Rate
5.8% Click-to-Open
Rate 15% is Goal
(-9.2 pts. vs. goal)
0.06% Unsubscribe Rate
Data source: Harmony; based on unique counts Report time period: 2 weeks post-launch for Oct, Nov, and Dec emails
• Deployment increased 24% QoQ; deliverability rate also increased by 7% • Open rates up 60% QoQ & 20% above goal; positive gains from subject line testing • 112K+ unique clicks in Q1; up 46% from Q4 ‘17 • CTOR down 61%; noticeable MoM declines especially in March at 3.9% (lowest to-date)

CTOR DECLINES WITH INCREASED DELIVERY QOQ • Low CTOR, high open & stable unsub suggests engagement opp. • Large # of new subscribers brought metrics back to starting point
0.00%
5.00%
10.00%
15.00%
20.00%
0
2,000,000
4,000,000
6,000,000
8,000,000
10,000,000
12,000,000
Q32017 Q42017 Q12018
Delivered OpenRate CTOR
0.05%
0.04%
0.06%
0.00%
0.03%
0.06%
0.09%
Q32017 Q42017 Q12018
UnsubRate

CONTENT SUMMARY Impact of audience expansion on engagement
• % of clicks on most sections were down QoQ except Header, Popular, & Curated C – Header up 19%; mostly from Feb & Mar – Popular Articles up 43%; mostly from Mar
• March Feature % of clicks down 67% MoM; some clicks shifted to video & Popular (+24%)
Feb Feature quiz resulted in 35% of clicks; highest for quarter
March video generated 5% of email clicks – 0.25% CTOR and 76.1% click to play rate (CTPR) – Compared to other video’s, CTOR +8.6%, CTPR -3.5%
Header–13.3%clicks
CuratedFeature–29.6%clicks
CuratedArHclesA–13.8%clicks
PopularArHcles–16.8%clicks
Banner1–0.21%clicks
Banner2–0.20%clicks
Banner3–0.14%clicks
CuratedArHclesB–2.9%clicks
SHckyContent–1.3%clicks
CuratedArHclesC–10.9%clicks
Footer–9.9%clicks

• Monitor new and existing audience engagement with new reporting structure
• Test day of week deployment to lift key metrics (open & CTR rates)
• Improve personalization in subject lines and content modules (roadmap)
• Increase engagement through video, surveys, and animation
ACTIONABLE INSIGHTS

THANK YOU!