q1 2017 results - torm · • in the first quarter of 2017, product tanker freight rates started...
TRANSCRIPT

1 6 Ma y 2 0 1 7
Q1 2017 RESULTS

2
Safe Harbor Statement
Matters discussed in this release may constitute forward-looking statements. Forward-looking statements reflect our current views with respect to future events and financial performance and may include statements concerning plans, objectives, goals, strategies, future events or performance, and underlying assumptions and statements other than statements of historical facts. The words “believe,” “anticipate,” “intend,” “estimate,” “forecast,” “project,” “plan,” “potential,” “may,” “should,” “expect,” “pending” and similar expressions generally identify forward-looking statements.
The forward-looking statements in this release are based upon various assumptions, many of which are based, in turn, upon further assumptions, including without limitation, management’s examination of historical operating trends, data contained in our records and other data available from third parties. Although the Company believes that these assumptions were reasonable when made, because these assumptions are inherently subject to significant uncertainties and contingencies that are difficult or impossible to predict and are beyond our control, the Company cannot guarantee that it will achieve or accomplish these expectations, beliefs or projections.
Important factors that, in our view, could cause actual results to differ materially from those discussed in the forward- looking statements include the strength of the world economy and currencies, changes in charter hire rates and vessel values, changes in demand for “ton miles” of oil carried by oil tankers, the effect of changes in OPEC’s petroleum production levels and worldwide oil consumption and storage, changes in demand that may affect attitudes of time charterers to scheduled and unscheduled dry-docking, changes in TORM’s operating expenses, including bunker prices, dry-docking and insurance costs, changes in the regulation of shipping operations, including requirements for double hull tankers or actions taken by regulatory authorities, potential liability from pending or future litigation, domestic and international political conditions, potential disruption of shipping routes due to accidents, political events or acts by terrorists.
In light of these risks and uncertainties, you should not place undue reliance on forward-looking statements contained in this release because they are statements about events that are not certain to occur as described or at all. These forward-looking statements are not guarantees of our future performance, and actual results and future developments may vary materially from those projected in the forward-looking statements.
Except to the extent required by applicable law or regulation, the Company undertakes no obligation to release publicly any revisions to these forward-looking statements to reflect events or circumstances after the date of this release or to reflect the occurrence of unanticipated events.

3
• Highlights
• Product Tanker Market Overview and Outlook
• Financial and Operating Performance
AGENDA

4
Product tanker
market
Corporate
events• In January, TORM drew USD 126m on the new term loan
Sales &
Purchase
• During the first quarter, TORM sold one vessel, the 1999-built MR vessel TORM Anne. Following the balance sheet date, TORM has sold an
additional two vessels, TORM Madison and TORM Trinity, both 2000-built handysize vessels
• In the first quarter, TORM completed two sale and leaseback transactions for the vessels TORM Helene and TORM Mary. Following the
balance sheet date, TORM has completed an additional sale and leaseback transaction for TORM Vita
• By the end of the first quarter, TORM’s vessel values as measured by broker values had decreased by approximately 6.5% since year-end. In
the beginning of the second quarter of 2017, there are indications that asset prices are bottoming out despite limited activity in the second-
hand market
• By the end of March 2017, the total product tanker order book stood at 10% of the total fleet, the lowest since 2012
Q1 2017
Results
HIGHLIGHTS FOR Q1 2017
• EBITDA of USD 44m and Profit before tax of USD 5m
• RoIC of 3.9% and Earnings per share of USD 0.1 or DKK 0.7
• Net Asset Value estimated at USD 663m as of 31 March 2017, corresponding to a NAV/share of USD 10.7 or DKK 75
• Solid balance sheet, Net Loan-to-Value of 55% and available liquidity of USD ~405m as of 31 March
• TORM obtained average TCE freight rates at USD/day 15,264 in Q1 2017
• In the first quarter of 2017, product tanker freight rates started out at weak levels similar to Q4 2016. Product tanker freight rates
strengthened towards the end of the quarter driven by increased demand for transport of clean petroleum products in the West
• The second quarter of 2017 has started out with volatile freight rates, as we remain in the process of drawing down on clean petroleum
inventories
• As of 5 May 2017, TORM has fixed 56% of its Q2 2017 earning days at an average TCE of USD/day 15,628

5
EBITDA OF USD 44M IN Q1 2017
USDm Q1 2017 Q1 2016 2016
P&L
TCE Earnings 107 138 458
Gross profit 55 80 242
Sale of vessels 0 0 0
EBITDA 44 70 200
Profit before tax 5 31 -142
Adjusted profit before tax
(excluding the impairment charge)
6 31 43
Balance sheet
Equity 786 1,001 781
NIBD 596 605 609
Cash and cash equivalents 215 123 76
Key figures
Adjusted Earnings per share (USD) 0.1 0.5 0.7
Return on Invested Capital (Adjusted RoIC) 3.7% 10.1% 4.9%
Net Asset Value (NAV) 663 1,069 733
Number of vessels (#) 78 81 81
Tanker TCE/day (USD) 15,264 19,845 16,050
Tanker OPEX/day (USD) 6,843 7,400 6,771

6
• Highlights
• Product Tanker Market Overview and Outlook
• Financial and Operating Performance
AGENDA

7
0
10
20
30
40
50
60
Jan Feb Mar Apr May Jun Jul Aug Sep Oct Nov Dec
LR2 (TC1)
5-year average 2014 2015 2016 2017
PRODUCT TANKER FREIGHT RATES IMPROVED IN Q1 FROM PREVIOUS QUARTER
Source: Clarksons. Spot earnings: LR2: TC1 Ras Tanura-> Chiba, LR1: TC5 Ras Tanura-> Chiba and MR:
average basket of Rotterdam->NY, Bombay->Chiba, Mina Al Ahmadi->Rotterdam, Amsterdam->Lome,
Houston->Rio de Janeiro, Singapore->Sidney
FREIGHT RATES IN ‘000 USD/DAY Q1 West
• High gasoline stocks in the US limited imports from Europe
• Steady demand in West Africa and strong demand in Brazil provided long-haul
demand for LRs and MRs
• Very strong demand for imports to Mexico was primarily covered on short-hauls
from the US
• Naphtha arbitrage from West to East was marginally opened, providing some
support to Atlantic-based LRs
Q1 East
• Restricted gasoil/ULSD flows from both Asia and the Middle East towards Europe
due to closed arbitrage caused surplus LR tonnage in the East and consequently
reduced LR earnings
• Asia naphtha imports remained flat year on year, but this was not sufficient to
absorb the relatively high LR newbuilding deliveries in Q1
• Lower Chinese product exports at the start of Q1 had a negative effect on MR
East earnings; nevertheless, Chinese exports gained momentum as the quarter
progressed
Q2-to-date
• In the West, the MR market has been supported by drawdown on US gasoline
stocks, continued imports to West Africa and increased exports from the USG
following the end of the refinery maintenance season. On the other hand, lack of
West to East arbitrage has kept LRs in the West, putting downward pressure on
MR rates. Recent weakening of refinery margins in Europe and the US is starting
to negatively impact product flows
• In the East, the rates have been under pressure as a result of limited gasoil/ULSD
and jet flows from East to West, peak refinery maintenance in Asia and seasonal
feedstock shifting from naphtha to LPG in the Asian petrochemical sector
0
10
20
30
40
50
Jan Feb Mar Apr May Jun Jul Aug Sep Oct Nov Dec
LR1 (TC5)
5-year average 2014 2015 2016 2017
0
5
10
15
20
25
30
35
Jan Feb Mar Apr May Jun Jul Aug Sep Oct Nov Dec
MR (Average)
5-year average 2014 2015 2016 2017

8
ASIAN NAPHTHA AND LPG PRICES
GLOBAL CPP INVENTORIES
DEMAND FUNDAMENTALS FOR PRODUCT TANKERS
* May includes first week of May
Sources: JODI, Reuters, TORM Research
Short-term factors
• Current oil price level continues to support global oil demand, which is
expected to grow by 1.3 mb/d in 2017, well above the average of 1.0
mb/d during 2005-2015
• Robust oil demand has helped to draw down global CPP inventories
from the highs seen at the start of 2017, but the stockpiles are still 9%
above the 5-year average, and the market is expected to remain
negatively impacted by stock drawdowns
• Upcoming US driving season and the fact that the USEC gasoline
yields have remained persistently lower compared to last year may
result in faster inventory draws which could support import demand
• With refinery maintenance focus shifting to Asia in the next quarter,
the region’s gasoline balance is expected to tighten compared to last
year, potentially increasing imports
• Seasonal LPG discount to naphtha is expected to limit Asian naphtha
imports in the coming months; however, the substitution effect is
expected to be less than last year as the LPG price is likely buoyed by
low inventories in the US
Long-term factors
• The fundamental long-term outlook remains positive with oil demand
increasing and the ton-mile being positively impacted by the
dislocation of refinery capacity from Europe and the Pacific (Japan) to
the Middle East and Asia
• Ton-mile demand for product tankers is forecast to grow by around
5% p.a. during 2017-2019
Billion bbl
USD/ton

9
NET FLEET GROWTH Y-O-Y (NO. OF VESSELS)*
SUPPLY OUTLOOK FOR THE PRODUCT TANKER FLEET VARIES BY SEGMENT
Notes: * The number of vessels at the beginning of 2017 was: LR2 317, LR1 339, MR 1,575, Handy 703 (includes chemical vessels). Net fleet growth: gross order book adjusted for expected scrapping, delivery
slippage and TORM assumptions on additional ordering. Currently confirmed orders account on average for 93% and 43% of forecasted deliveries respectively in 2018 and 2019. Source: TORM Research
MR ORDER BOOK AS PERCENTAGE OF THE FLEET (DWT)
• In Q1, newbuilding focus was on crude tankers
while activity within product tankers remained
relatively limited
• The product tanker order book to fleet ratio has
fallen to 10%, the lowest since 2012
• For the MR segment, the order book to fleet ratio is
below 10%, the lowest level for at least 20 years
• Product tanker deliveries totaled 2.9m dwt during
Q1, which combined with limited scrapping activity
resulted in a 1.8% net fleet growth in Q1
• For FY 2017, a fleet growth of 5.5% is forecast,
after which the growth pace starts to slow
• Product tanker fleet capacity is expected to grow
by around 4% p.a. during 2017-2019
• At the start of the Q2 ordering activity for dry bulk,
crude and product tankers has gained momentum
with a significant number of LOIs being signed
recently
2005-2015 average fleet growth for
LR2, LR1, MR and Handysize%
m dwt

10
VESSEL PRICE DEVELOPMENT
• The second-hand market in Q1 was characterized
by low activity yet with signs of increasing interest
from buyers for modern tonnage. Very few units of
have actually been for sale
• For older tonnage, second-hand activity has been
at a decent level with prices remaining flat
• Lack of traditional bank financing remains an
important issue, whereas more sale and lease
back transactions have been reported
• In Q2 so far, second-hand activity has remained
muted with last done indicating a slight price
increase for modern tonnage
• In the newbuilding market, the transition from Tier
2 to Tier 3 tonnage has basically come to an end,
with yards now exclusively marketing the more
expensive Tier 3 tonnage
Source: Clarksons
USDm
LR1 - Newbuilding
USDm
LR2 - Newbuilding MR - Newbuilding
MR - 5 yr. Second-Hand
USDk/day
MR 1Yr T/C
PRODUCT TANKER VESSEL PRICES

11
• Highlights
• Product Tanker Market Overview and Outlook
• Financial and Operating Performance
AGENDA

12
Unfixed days
1,805
2017
17,789
MR
16,851
2,5073,381
2,5064,280
2018
26,211
3,472
2019
28,281
3,565
17,930
2,576
11,574
1,834
LR2 HandyLR1
Illustrative change in cash flow generation potential for the TORM fleet
∆ Average TCE/day 2017 2018 2019
USD 2,000 35.6 52.4 56.6
USD 1,000 17.8 26.2 28.3
USD (1,000) (17.8) (26.2) (28.3)
USD (2,000) (35.6) (52.4) (56.6)
USDm
# of days as of 31 March 2017
Of total earning days 88% 93%
TORM HAS SIGNIFICANT OPERATING LEVERAGE IN THE
PRODUCT TANKER MARKET
99%

13
Notes:
• Peer group is based on Ardmore (split by ECO and ECO-modified), d’Amico (composite of MR and Handy), Frontline 2012, BW (Q1-Q2 2015), Norden, Teekay Tankers and
Scorpio, OSG
USD/day
PEER COMPARISON SHOWS THAT TORM HAS CONTINUED TO PERFORM COMMERCIALLY

14
OPEX HAS SHOWN AN IMPROVING TREND
7,400
2016
7,193
-6%
6,771
2015
-8%
Q1 2017Q1 2016
6,843
USD/day

15
TORM operates on a fully integrated commercial and
technical platformTORM has trimmed administration expenses significantly
Admin. expenses (quarterly avg. in USDm)
• TORM’s operational platform handles all commercial and
technical operation
• The integrated business model provides TORM with the highest
possible trading flexibility and earning power
• TORM manages
‒ ~80 vessels commercially
‒ ~75 vessels technically
• TORM has a global reach with offices in Denmark, India, the
Philippines, Singapore, the UK and the US
• Average admin cost per earning day for 2016 of USD/day
~1,450
• Outsourced technical and commercial management would
affect other line items of the P&L
TORM HAS A FULLY INTEGRATED BUSINESS MODEL AND ADMIN EXPENSES ARE TRENDING SIGNIFICANTLY DOWN
0 2 4 6 8 10 12 14 16 18 20 22 24
-52%
Q1 2017
2010
2009
2008
2016
*2015
2014
2013
2012
2011
* Pro forma figures for 2015 presented as though the Restructuring occurred as of 1 January 2015 and include the combined TORM and Njord fleet

16
TORM’S NET ASSET VALUE ESTIMATED AT USD 663M
Cash
215
Committed
CAPEX
139
Outstanding
debt
811
1,345
Value of
newbuildings
176
Value of
vessels
on water
1,169
Net Asset
Value
663
52
Other*Working
Capital
2
Net LTV of
55%
• Based on broker values, TORM’s vessels
including newbuildings were estimated at
USD 1,345m as of 31 March 2017
• With an outstanding debt of USD 811m,
and committed CAPEX of USD 139m,
TORM’s Net Loan-to-Value was at 55%
ensuring a strong capital structure
• Adjusting for cash and working capital,
TORM’s Net Asset Value (NAV) was
estimated at USD 663m
• On a per share basis*, the NAV was
estimated at USD 10.7 or DKK 74.5
31 March figures, USDm
• Calculated based on 61,985,975 shares (excluding 312,871 treasury shares) and USD/DKK fx rate of 7.0
• * Other includes Other plant and operating equipment, and total financial assets

17
Ample headroom under our attractive
covenant package:
Minimum liquidity: USD 75m*
Minimum book equity ratio: 25%
(adjusted for market value of vessels)
* Of which USD 40m must be cash or cash equivalent
811
422
149
87
2017
repayment
79
Debt as of
31 Mar 2017
2019
repayment
2018
repayment
2020
repayment
73
13908653
Total20182017 2019
405
11575215
Available
debt facility
Cash position LR2
newbuilding
financing
Total
available
liquidity
CAPEX commitments Available liquidity
CAPEX and liquidity as of 31 March 2017 (USDm)
TORM is well-positioned to service
future CAPEX and debt commitments
Scheduled debt repayments as of 31 March 2017 (USDm)
10% 11% 18% 9% 52%
TORM HAS A FAVOURABLE FINANCING PROFILE AND STRONG LIQUIDITY POSITION
18
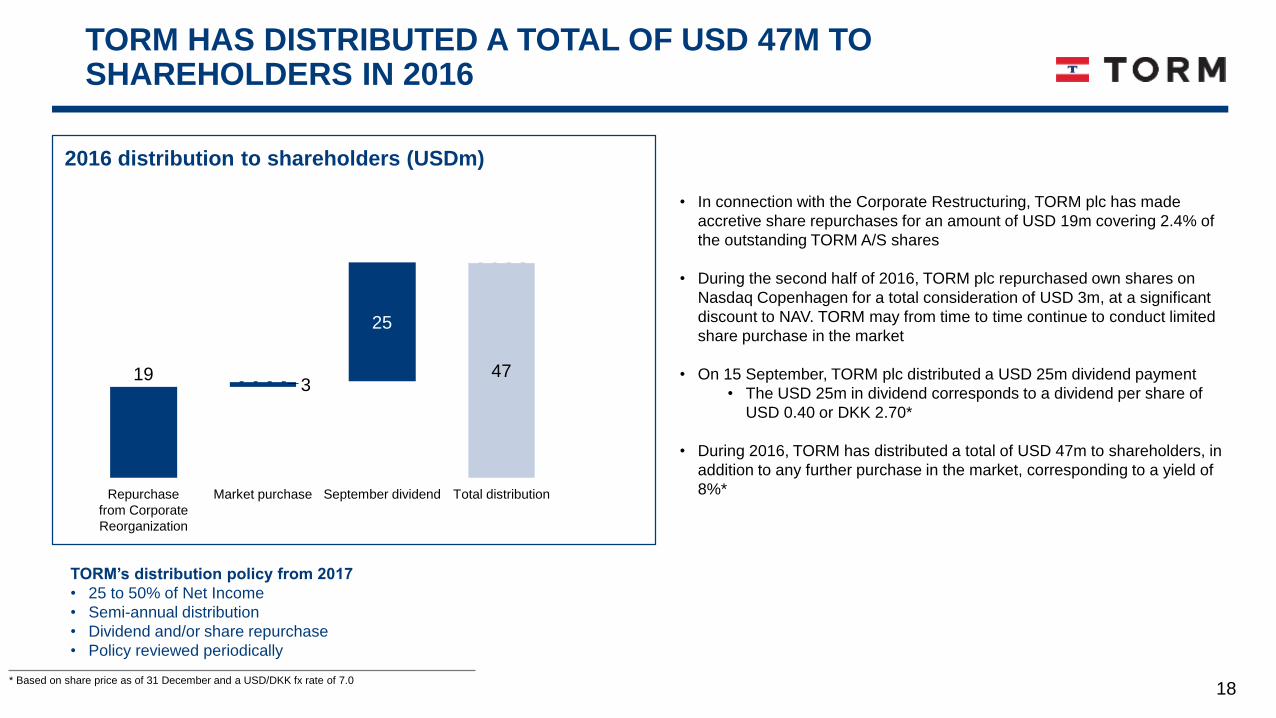
TORM HAS DISTRIBUTED A TOTAL OF USD 47M TO SHAREHOLDERS IN 2016
2016 distribution to shareholders (USDm)
• In connection with the Corporate Restructuring, TORM plc has made
accretive share repurchases for an amount of USD 19m covering 2.4% of
the outstanding TORM A/S shares
• During the second half of 2016, TORM plc repurchased own shares on
Nasdaq Copenhagen for a total consideration of USD 3m, at a significant
discount to NAV. TORM may from time to time continue to conduct limited
share purchase in the market
• On 15 September, TORM plc distributed a USD 25m dividend payment
• The USD 25m in dividend corresponds to a dividend per share of
USD 0.40 or DKK 2.70*
• During 2016, TORM has distributed a total of USD 47m to shareholders, in
addition to any further purchase in the market, corresponding to a yield of
8%*Total distributionSeptember dividend
319
Market purchaseRepurchase
from Corporate
Reorganization
25
47
TORM’s distribution policy from 2017
• 25 to 50% of Net Income
• Semi-annual distribution
• Dividend and/or share repurchase
• Policy reviewed periodically
* Based on share price as of 31 December and a USD/DKK fx rate of 7.0

APPENDIX

20
TORM AIMS TO BE REGARDED AS THE REFERENCE COMPANY IN THE PRODUCT TANKER SEGMENT
TORM is a pure-play product tanker owner active in all large product tanker segments to meet customer demands
Primarily spot-oriented and owns ~80 product tankers
Limited T/C-in(off-balance sheet) commitment
TORM has a solid capital structurewith financial strength topursue growth
Competitive advantage when pursuing vessel acquisitions from lenders and yards
Semi-annual distribution policy of25-50% of net income
TORM’s superior integratedoperating platform includes
in-house technical and commercial management (preferred by customers)
Enhanced responsiveness toTORM’s customers
and higher TCE’s
Cost-efficient set-upwithout leakages
TORM pursues selectivegrowth based on
projected financialreturns and may serve as
a consolidator
In-house S&P team with relationships with brokers,
yards, banks and shipowners

21
FLEET UPDATE
As of 31.03.2017
# of vessels
EoY 2016 Changes Q1 2017 Changes EoY 2017 Changes EoY 2018 Changes EoY 2019
Owned vessels
LR2 8 -1 7 1 8 3 11 - 11
LR1 7 - 7 - 7 - 7 - 7
MR 51 -2 49 -1 48 - 48 - 48
Handysize 11 - 11 -2 9 - 9 - 9
Total 77 -3 74 1 78 3 75 - 75
Charter-in vessels
LR2 2 1 3 - 3 -2 1 - 1
LR1 0 - 0 - 0 - 0 - 0
MR 2 -1 1 1 2 - 2 - 2
Handysize 0 - 0 - 0 - 0 - 0
Total 4 - 4 -2 2 -2 3 - 3
Total fleet 81 -3 78 -1 80 1 78 - 78

22
Seafarers: ~3,000
• 1,500 Filipino seafarers
• 1,200 Indian seafarers
• 180 Danish seafarers
• 150 Croatian seafarers
• 30 Polish seafarers
TORM offices: ~280
A world-leading product
tanker company
• 128 years of history
• A leading product tanker
owner
Listed on Nasdaq
Copenhagen
Key facts Global footprint based on regional power and presence
TORM employees:
TORM AT A GLANCE

23
FLEXIBILITY TO TRANSPORT A WIDE RANGE OF DIFFERENT PRODUCTS

24
Jacob Meldgaard
▪ Executive Director in TORM plc
▪ CEO of TORM A/S since April 2010
▪ Previously Executive Vice President of the Danish shipping company NORDEN where he was in charge of the company’s dry cargo division
▪ Prior to that, he held various positions with J. Lauritzen and A.P. Møller-Mærsk
▪ More than 20 years of shipping experience
Lars Christensen
▪ Head of Projects
Executive Director
Senior Management
Christian Søgaard-Christensen
▪ Chief Financial Officer
Jesper S. Jensen
▪ Head of Technical Division
MANAGEMENT TEAM WITH AN INTERNATIONAL OUTLOOK AND MANY YEARS OF SHIPPING EXPERIENCE

25
Ownership has become more dispersedShare information
OAKTREE IS THE MAJORITY SHAREHOLDER AND
OWNERSHIP HAS BECOME MORE DISPERSED
TORM’s shares are listed on Nasdaq
Copenhagen under the ticker TRMD A
Shares
• 62.3m A shares, one B share and one C
share
• The B and C shares have certain voting
rights
• A Share has a nominal value of USD/share
0.01
For further company information,
visit TORM at www.torm.com12
100
13
Totalunknown
2
RetailInstitutionalParticipants
in
Restructuring
1
DW
8
Oaktree
64
Shareholdings as of April 2016, %
Estimated shareholdings as of 31 January 2017, %
100
62
1010
8
7
3

26
KEY FIGURES
USDm Q1 2017 Q1 2016 2016
Revenue 173 194 680
EBITDA 44 70 200
Impairment -1 - -185
Profit/(loss) before tax 5 31 -142
Adjusted Profit/(loss) before tax 6 31 43
Balance sheet
Total assets 1,699 1,847 1,571
Equity 786 1,001 781
NIBD 596 605 609
Cash and cash equivalents 215 123 76
Cash flow statement
Operating cash flow 27 71 171
Investment cash flow -11 -65 -119
Financing cash flow 123 -53 -144
Financial related key figures
EBITDA margin 26% 36% 29%
Equity ratio 46% 54% 50%
Return on invested capital (RoIC) 4% 10% -7%

27
TORM TANKER SPOT RATES VERSUS INDUSTRY BENCHMARK
Source: Clarksons, Spot earnings: LR2: TC1 (Ras Tanura-> Chiba), LR1: TC5 (Ras Tanura-> Chiba), MR: average basket of Rotterdam->NY, Bombay->Chiba, Mina Al Ahmadi->Rotterdam,
Amsterdam->Lome, Houston->Rio de Janeiro, Singapore->Sidney, Handysize: average basket of Augusta->Lavera, Tuapse->Agioi Theodoroi.
TORM spot vs. industry benchmark Q1 2017 (USD/day)
TORM spot vs. industry benchmark last 12 months (USD/day)
Note: Benchmarks are not one-to-one comparisons as they do not take broker commission, armed guards and low sulphur fuel costs into account.
0
15,000
10,000
5,000
30,000
25,000
20,000+30%
HandysizeMRLR1LR2
+29%+38%+80%
BenchmarkTORM
10,000
5,000
0
25,000
20,000
15,000
30,000
HandysizeMRLR1LR2
+36%+34%
+62%+31%
BenchmarkTORM

28
Owned days
As of 31.03.2017
T/C-in days at
fixed rate
T/C-in days at
floating rate
Total physical
days
Coverage
TORM HAS A SPOT-ORIENTED PROFILE IN A FUNDAMENTALLY STRONG MARKET
2017 2018 2019 2017 2018 2019
LR2 1,976 3,764 3,999
LR1 1,904 2,507 2,506
MR 12,871 17,183 17,347
Handysize 2,642 3,472 3,565
Total 19,392 26,926 27,418
LR2 224 365 365
LR1 - - -
MR 422 730 730
Handysize - - -
Total 645 1,095 1,095
LR2 547 338 -
LR1 - - -
MR - - -
Handysize - - -
Total 547 338 -
LR2 2,747 4,467 4,364 942 1,086 84
LR1 1,904 2,507 2,506 70 - -
MR 13,292 17,913 18,077 1,718 1,062 147
Handysize 2,642 3,472 3,565 66 - -
Total 20,585 28,359 28,513 2,796 2,148 231
LR2 34% 24% 2% 23,784 24,170 24,351
LR1 4% 0% 0% 16,705 - -
MR 13% 6% 1% 17,895 17,524 17,528
Handysize 3% 0% 0% 18,954 - -
Total 14% 8% 1% 19,873 20,884 20,017
Owned days
Charter-in and Leaseback days at fixed rate
Charter-in days at floating rate
Total physical days Covered days
Covered, % Coverage rates, USD/day

29
TORM is actively participating in… TORM has set and communicated on climate targets
Set climate target for 2016:
• In 2016, TORM set a goal to improve fuel efficiency by
3% compared to 2015
• Continued focus on operational procedures and hull
fouling, led to a 3.6% improvement in 2016
• The target for 2017 is a further improvement of 2%
• Danish Shipowners’ AssociationAs part of DSA,TORM is pushing for
international regulation and standards on
e.g. emissions through the International
Maritime Organization
•Maritime Anti-Corruption NetworkTORM is founding member of a global
business network working towards a
maritime industry free of corruption that
enables fair trade
•UN Global CompactTORM became signatory to the
UNGC in 2009 as the first Danish
shipping company
INDUSTRY COOPERATION AND TRANSPARENCY IS KEY TO TORM’S CORPORATE SOCIAL RESPONSIBILITY