q1 2013, stevens point area economic indicators - university of
TRANSCRIPT

Special Report: The American Pie: Income Inequality in the United States By: Scott Wallace Ph.D., Professor of Economics andRandy F. Cray Ph.D., Professor of Economics and Chief Economist
Economic Indicators ReportFirst Quarter 2013: Stevens Point Area
Randy Cray, Ph.D., Chief Economist Scott Wallace, Ph.D., Research Associate
Unive
rsity
of W
iscon
sin-S
teve
ns Po
int
Cent
ral W
iscon
sin Ec
onmi
c Res
earc
h Bur
eau


CWERB Economic Indicators Report - Stevens Point 1
TABLE OF CONTENTS
Outlook: The Forecast for Wisconsin ............................................................................................................................2-3 Table 1: National Economic Statistics ..........................................................................................................................3
Central Wisconsin .............................................................................................................................................................3-5 Table 2: Unemployment Rate in Central Wisconsin ..................................................................................................3 Table 3: Employment in Central Wisconsin ................................................................................................................3 Table 4: Wisconsin Employment Change by Sector ...................................................................................................4 Table 5: County Sales Tax Distribution ........................................................................................................................4 Table6:BusinessConfidenceinCentralWisconsin ..................................................................................................4 Figures 1-7.....................................................................................................................................................................4-5
Stevens Point-Plover Area ...............................................................................................................................................5-7 Table8:RetailerConfidenceinStevensPoint-PloverArea ....................................................................................5 Table9:HelpWantedAdvertisinginPortageCounty ..............................................................................................5 Table 10: Unemployment Claims in Portage County ................................................................................................6 Table11:PublicAssistancebyProgramType .............................................................................................................6 Table 12: Unemployment Claims in Portage County ................................................................................................6 Table13ResidentialConstructioninStevensPoint-PloverArea ..........................................................................6 Table14:NonresidentialConstructioninStevensPoint-PloverArea ..................................................................6 Figures 8-11 ......................................................................................................................................................................7
Housing Market Information ........................................................................................................................................7-8 Table 15: National Median Home Prices .....................................................................................................................7 Table 16: National Existing Home Sales ......................................................................................................................7 Table 17: National Inventory .........................................................................................................................................8 Table18:NationalAffordabilityIndex ........................................................................................................................8 Table19:LocalAreaMedianPrice ...............................................................................................................................8 Table 20: Local Units Sold ..............................................................................................................................................8 Table 21: Local Median Price .........................................................................................................................................8 Table22:LocalNumberofHomeSales .......................................................................................................................8
Recent Entrepreneurship Rates by Age and Industry ............................................................................................9-10
Special Report ............................................................................................................................................................... 11-23The American Pie: Income Inequality in the United States
By: Scott Wallace Ph.D., Professor of EconomicsRandy F. Cray Ph.D., Professor of Economics and Chief Economist
Special Recognition: JeffreyDallman,ResearchAssistant,CWERBBrittanyMelby,ResearchAssistant,CWERB
CWERB-SchoolofBusiness&EconomicsUniversityofWisconsin-StevensPoint
StevensPoint,WI54481715-346-3774 or 715-346-2537
www.uwsp.edu/business/CWERBorfollowusonTwitter@UWSPcwerb
Association for University
Business and Economic Research

2 CWERB Economic Indicators Report - Stevens Point
Outlook: The Forecast for WisconsinTheWisconsinDepartmentofRevenue(WDR)forecastindicatesthatRealGDPfortheU.S.willgrowby a modest 1.8 percent in 2013. Payroll employment willincreaseto135.1million,representingagainof1.4percent.Thenation’sunemploymentrateisexpected to stay stubbornly high at 8.0 percent. In previousreports,Ihavediscussedthevariablesthatare acting to slow the recovery and why this recovery hasbeenpainfullyslow.TheWDRreportalsolistthesewellknowfactors:thefiscalproblemsfacingtheU.S.,Eurozonefinancialdifficulties,thedirectionoftheChineseeconomy,tightcreditmarkets,andthedomestichousingmarket,etc.
TheConsumerPriceIndexisforecastedtoclimbby1.4percentoverthecourseoftheyear.Thismeansthatinflationshouldremainsubduedduring2013.Alongthesamelines,theemploymentcostindexshouldonlyrisebyabout2.1percent,meaningtherewillnotbyagreatamountofupwardpressureonthecosts associated with employment.
Theoutputofournation’sfactoriesshouldincreasebyamodestamount,2.2percentin2013.Interestrates will continue to be held down by the Federal Reserve’smonetarypolicy.ThreemonthTreasuryBillsareforecastedtoyield0.1percentand30-yearfixedmortgagerateswillhoveraround3.5percent.PersonalincomeintheUSwillgrowbyaforecasted4.1percentoverthecourseoftheyearandwagesandsalaries will increase by approximately 3.9 percent.
MuchhasbeenmadeofWisconsin’semploymentsituation.IthinkthebestwaytosummarizetheWDRforecastistosaythatWisconsin’seconomywillgrowmodestlyoverthenextthreeyears,butwillcontinuetolagU.S.economicperformance.Forexample,Wisconsin will not reach its prerecession employment levelof2.9millionuntilmid-2015,whiletheU.S.willreach its prerecession employment level by the end of2014.WhatdoestheforecasthavetosayaboutWisconsin’sjobprospectsin2013?Totalnonfarmemployment shouldgrowbyamodest1.8percent,risingfrom2.753millionto2.801millionjobs,anincreaseofabout48,000.
ContributingtoaslowerturnaroundinWisconsin’seconomyisthattotalemploymentfellmoresharplyin the recession here than in the U.S. as a whole. In other words Wisconsin has more ground to make up. Amajorreasonforthissteepdeclinewasthefallinmanufacturingsectoremployment,andinthetrade,transportation,andutilitiessector.Further,inthenext
three years our population will grow by 0.5 per year compared to 1.0 percent per year increase in the U.S. Thisofcoursecarriesnegativeimplicationsforourcivilianlaborforceandjobgrowth.
Inmoredetail,Wisconsintotalnonfarmemploymentisforecastedtogrowby1.8percentin2013,1.2percentin2014,and1.8percentin2015.Intermsofemployment numbers this translates to 2.81 million jobsin2013,2.83millionjobsin2014,and2.89millionjobsin2015.Forreferencepurposes,Wisconsin’stotalnonfarmemploymentreachedapeakof2.87millionjobsin2008.
ThemanufacturingsectorisveryimportanttoWisconsin. Each year the state ranks near the top in termsofmanufacturingemploymentasapercentoftotalemployment.AsamatteroffactWisconsinoftenranksnumberoneinthenationintermsofmanufacturingdependence.Theforecastformanufacturingisthatemploymentwillriseby1.3percentin2013,1.5percentin2014,and2.0percentin2015.Thismeansthatmanufacturingjobswillreach456thousandin2013,463thousandin2014,and472thousandin2015.Forreferencepurposes,in2008,Wisconsin’sprerecessionmanufacturingemploymentwas at 493 thousand.
EventhoughmanufacturingisveryimportanttoWisconsinthetrade,transportation,andutilitiessectorisactuallythelargestproviderofemploymentinthestate.Theforecastfortrade,transportationandutilities is that employment will rise 1.4 percent in 2013,0.6percentin2014,and0.9percentin2015.Thisimpliesthatjobsinthissectorwillreach518thousandin2013,522thousandin2014,and526thousandin2015.Forreferencepurposes,in2008Wisconsin’sprerecession employment in this sector was 540 thousand.
Intermsoftheunemploymentrate,theforecastisthattheratewilldropfromitscurrentlevelofabout7.0percentto6.8in2013,6.5percentin2014,and5.8percent in 2015. The unemployment rate peaked at 8.8 percent in 2009. Real personal income in the state willbygrowby3.7percentin2013,4.5percentin2014,and4.5percentin2015.Realpersonalincomeisinflationadjustedincomethatincludeswages&salaries,fringebenefits,proprietor’sincome,interestincome,dividendincome,rentalincomeandtransferpayments like social security and Medicare payments.
Natural resources and mining sector employment is supposedtogrowby100positionsandreach3,100
CWERB Economic Indicators Report - Stevens Point 3
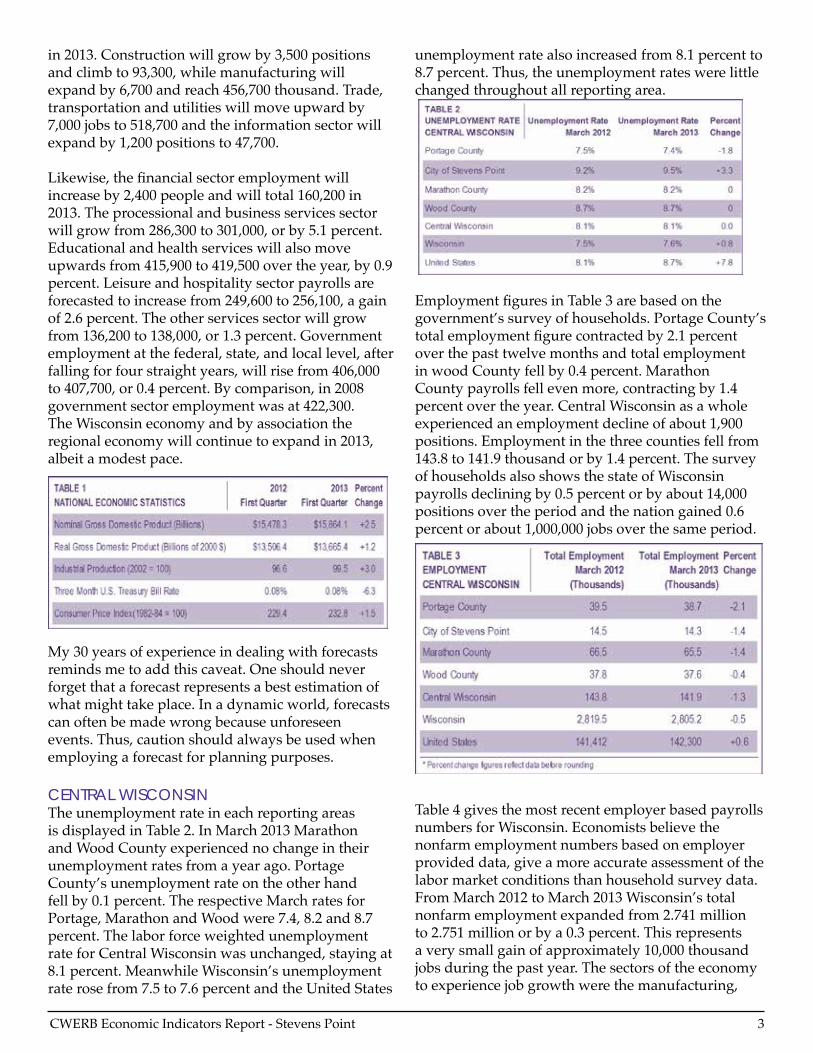
in2013.Constructionwillgrowby3,500positionsandclimbto93,300,whilemanufacturingwillexpandby6,700andreach456,700thousand.Trade,transportation and utilities will move upward by 7,000jobsto518,700andtheinformationsectorwillexpandby1,200positionsto47,700.
Likewise,thefinancialsectoremploymentwillincreaseby2,400peopleandwilltotal160,200in2013. The processional and business services sector willgrowfrom286,300to301,000,orby5.1percent.Educational and health services will also move upwardsfrom415,900to419,500overtheyear,by0.9percent. Leisure and hospitality sector payrolls are forecastedtoincreasefrom249,600to256,100,againof2.6percent.Theotherservicessectorwillgrowfrom136,200to138,000,or1.3percent.Governmentemploymentatthefederal,state,andlocallevel,afterfallingforfourstraightyears,willrisefrom406,000to407,700,or0.4percent.Bycomparison,in2008governmentsectoremploymentwasat422,300.The Wisconsin economy and by association the regionaleconomywillcontinuetoexpandin2013,albeit a modest pace.
My30yearsofexperienceindealingwithforecastsreminds me to add this caveat. One should never forgetthataforecastrepresentsabestestimationofwhatmighttakeplace.Inadynamicworld,forecastscanoftenbemadewrongbecauseunforeseenevents.Thus,cautionshouldalwaysbeusedwhenemployingaforecastforplanningpurposes.
CENTRAL WISCONSINThe unemployment rate in each reporting areas is displayed in Table 2. In March 2013 Marathon and Wood County experienced no change in their unemploymentratesfromayearago.PortageCounty’sunemploymentrateontheotherhandfellby0.1percent.TherespectiveMarchratesforPortage,MarathonandWoodwere7.4,8.2and8.7percent.ThelaborforceweightedunemploymentrateforCentralWisconsinwasunchanged,stayingat8.1percent.MeanwhileWisconsin’sunemploymentraterosefrom7.5to7.6percentandtheUnitedStates
unemploymentratealsoincreasedfrom8.1percentto8.7percent.Thus,theunemploymentrateswerelittlechanged throughout all reporting area.
EmploymentfiguresinTable3arebasedonthegovernment’ssurveyofhouseholds.PortageCounty’stotalemploymentfigurecontractedby2.1percentover the past twelve months and total employment inwoodCountyfellby0.4percent.MarathonCountypayrollsfellevenmore,contractingby1.4percent over the year. Central Wisconsin as a whole experiencedanemploymentdeclineofabout1,900positions.Employmentinthethreecountiesfellfrom143.8 to 141.9 thousand or by 1.4 percent. The survey ofhouseholdsalsoshowsthestateofWisconsinpayrollsdecliningby0.5percentorbyabout14,000positions over the period and the nation gained 0.6 percentorabout1,000,000jobsoverthesameperiod.
Table 4 gives the most recent employer based payrolls numbersforWisconsin.Economistsbelievethenonfarmemploymentnumbersbasedonemployerprovideddata,giveamoreaccurateassessmentofthelabor market conditions than household survey data. FromMarch2012toMarch2013Wisconsin’stotalnonfarmemploymentexpandedfrom2.741millionto 2.751 million or by a 0.3 percent. This represents averysmallgainofapproximately10,000thousandjobsduringthepastyear.Thesectorsoftheeconomytoexperiencejobgrowthwerethemanufacturing,

4 CWERB Economic Indicators Report - Stevens Point
information,professional&businessservices,leisure&hospitality,educational&healthservicesandgovernment.However,theemploymentresultsforalltherestoftheindustrialsectorsweredisappointing.Thus,rateofjobgenerationcontinuestobeveryweakin the state as measured by this data set.
InTable5,PortageCountysalestaxdistributionsrosefrom$1.17millionto$1.30million,anincreaseof10.3percent. Marathon experienced an increase in sales tax distributionsfromthestate.Marathonrosefrom$2.41millionto$2.59millionorby7.3percent.SimilarlyWoodCountycollectionsalsoexpandedfrom$1.11millionto$1.18millionorbyabout6.3percentoverthecourseofthepastyear.Thedatasuggeststherewas some improvement in retail activity in Central Wisconsin.
TheCWERB’ssurveyofareabusinessexecutivesis reported in Table 6. This group believes that recent events at the national level have led to an improvementinthecountry’seconomiccondition.In addition they believe the local business climate has improved over the past twelve months. When theywereaskedtoforecasteconomicconditionsatthe national level they were a lot more optimistic aboutthefuturedirectionoftheeconomythanintherecentpast.Also,theyexpressedsimilaroptimismforthelocaleconomyfortheirparticularindustry.Overall,Table6alsoshowsthatthelevelofoptimismexpressedfortheeconomywasgenerallyhigherinMarch 2013 than in December 2012.
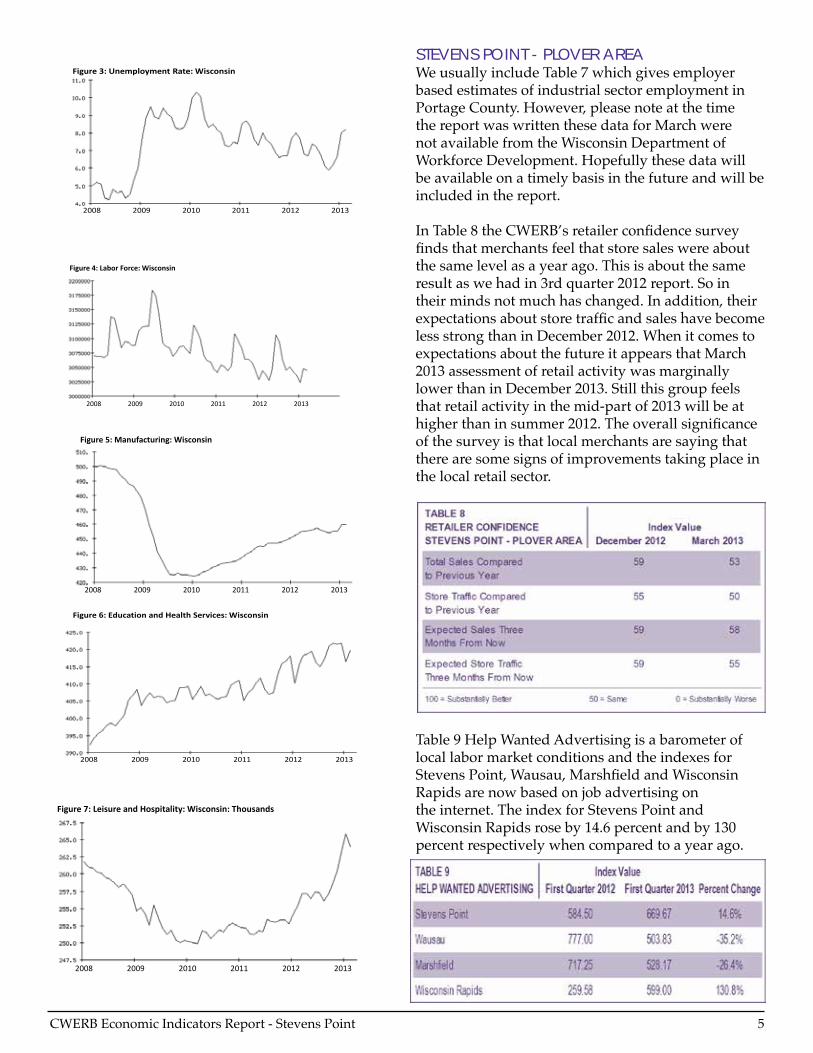
Figures1thru7giveahistoricoverviewofhowtheeconomyinWisconsinhasperformedduringthe2008-2013 time period. For example Figure 5 shows thedramaticdeclineinWisconsinmanufacturingand the rebound taking place since 2010. In 2008 about500,000wereemployedinmanufacturingandattheendof2010thenumberofjobsbottomedoutatapproximately425,000;thus,therecessioncaused75,000jobstobelostinthisonesectoralone.Sincethat time the rebound in activity has added about 35,000positionstothemanufacturingsector.Figure7showsthesteepdeclineandreboundinthenumberofpeopleemployedinleisure&hospitality,fromabout262,000in2008to265,000intheearlypartof2013.
2008 2009 2010 2011 2012 2013
Figure 2: Unemployment Level: Wisconsin
2008 2009 2010 2011 2012 2013
Figure 1: Employment Level: Wisconsin
CWERB Economic Indicators Report - Stevens Point 5
2008 2009 2010 2011 2012 2013
Figure 3: Unemployment Rate: Wisconsin
2008 2009 2010 2011 2012 2013
Figure 4: Labor Force: Wisconsin
STEVENS POINT - PLOVER AREAWe usually include Table 7 which gives employer basedestimatesofindustrialsectoremploymentinPortageCounty.However,pleasenoteatthetimethereportwaswrittenthesedataforMarchwerenotavailablefromtheWisconsinDepartmentofWorkforceDevelopment.Hopefullythesedatawillbeavailableonatimelybasisinthefutureandwillbeincluded in the report.
InTable8theCWERB’sretailerconfidencesurveyfindsthatmerchantsfeelthatstoresaleswereaboutthe same level as a year ago. This is about the same result as we had in 3rd quarter 2012 report. So in theirmindsnotmuchhaschanged.Inaddition,theirexpectationsaboutstoretrafficandsaleshavebecomeless strong than in December 2012. When it comes to expectationsaboutthefutureitappearsthatMarch2013assessmentofretailactivitywasmarginallylowerthaninDecember2013.Stillthisgroupfeelsthatretailactivityinthemid-partof2013willbeathigherthaninsummer2012.Theoverallsignificanceofthesurveyisthatlocalmerchantsaresayingthattherearesomesignsofimprovementstakingplaceinthe local retail sector.
Table9HelpWantedAdvertisingisabarometeroflocallabormarketconditionsandtheindexesforStevensPoint,Wausau,MarshfieldandWisconsinRapidsarenowbasedonjobadvertisingontheinternet.TheindexforStevensPointandWisconsin Rapids rose by 14.6 percent and by 130 percent respectively when compared to a year ago.
2008 2009 2010 2011 2012 2013
Figure 6: Education and Health Services: Wisconsin
2008 2009 2010 2011 2012 2013
Figure 5: Manufacturing: Wisconsin
2008 2009 2010 2011 2012 2013
Figure 7: Leisure and Hospitality: Wisconsin: Thousands

6 CWERB Economic Indicators Report - Stevens Point
Further,Wausauexperiencedacontractionintheamountadvertisingtakingplace,about35percent.Marshfield’shelpwantedindexcontractedbyapproximately 26 percent. These data suggests that advertisinggrowthhasbeenveryuneveninthearea’slabor markets.
Tables10,11and12givevaluableinsightintohowlocalfamilyfinancialdistressfaredinPortageCountyoverthepastyear.Thenumberoftotalapplicationsforpublicassistancedeclinedfrom7,178to6,920or3.6percent.Table11givesdetailedinformationonthetypesofpublicassistanceforFirstQuarter2013.The numbers seem to suggest that matters may have stabilizedinthearea.Inaddition,Table12showsthatnewunemploymentclaimscontractedfrom236to188 or by 20.3 percent. Moreover total unemployment claimsdroppedfrom2,551to1,742orby31percent.
Table 13 presents the residential construction numbers fortheStevensPoint-Ploverarea.InouryearlycomparisonthenumberofpermitsissuedinFirstQuarterwas8andtheyhadanestimatedvalueof$2.34millionandthenumberofhousingunitstotaled8.WhencomparingFirstQuarter2012tothatof2013
residentialalterationactivitycontractedfrom102to61permits.Further,theestimatedvalueofthistypeofactivitywentdownfrom$862thousandto$424thousand. Overall the 2013 construction data results paintamixedpictureofwhatwastakingplaceintheresidentialhousingsector.Butfromahistoricalperspective,activitywasmuchlowerthanintheboomyearsofadecadeago.
ThenonresidentialconstructionfiguresinTable14wereasfollowsforFirstQuarter2013.Thenumberofpermitsissuedwas8andtheestimatedvaluewas$1.4million.Theestimatedvalueofnewstructuresfigurebodeswellfortheareaeconomy.Thenumberofbusinessalterationpermitswas56 in 2013 compared to 51 in 2012. The estimated valueofalterationactivitywas$3.4millionin2013comparedtothe2012figureof$2.0million.Insum,the pace nonresidential construction activity is pickingupinthearea.Further,thereareanumberoflargeconstructionsprojectsthathavebeenrecentlycompleted or are under construction in the greater StevensPointArea.
Figures8thru11onthefollowingpagegiveaneconomic history lesson as to how the employment level,theunemploymentlevel,theunemployment

CWERB Economic Indicators Report - Stevens Point 7
rate,andthelaborforcehavetrendedoverthepastfiveyearsinPortageCounty.PleasenotethedataforthechartsrunsfromJanuary2008toearly2013.Thefiguresclearlyshowtheinfluenceofthegreatrecessiononthearealocaleconomyandthefiguressupplementthereport’sshort-termdatabyplacingtheshorttermdataintothepropercontext.Moreover,thisallowsshort-termfluctuationsintheeconomytobejudgedmoreproperly.
HOUSING MARKET INFORMATIONThefollowingseventablescontaininformationonthenational,regional,andlocalhousingmarket.Housingactivityisanincrediblyimportantaspectofthe economy. We believe the reader will gain valuable insight into housing markets conditions and greater insightintothelocaleconomyinthissectionofthereport.
Table15givesnationalmedianhomepricefortheU.S.andmajorregionsintheU.S.housingpricesintheMidwest are the lowest in the country. The median homepriceinourpartofthecountryhascontractedfrom$142,700in2012toanestimated$129,000inFebruary 2013. In general housing prices should start to rise in the U.S. The weather in the U.S. has been unusually cold and snowy and it is expect that home priceswillriseduringthecourseoftheyear.
Table 16 National and the Midwest existing home sales data shows a substantial increase in sales activity overthepastyear.IntheMidwest1,140,000homesareforecastedtobesoldin2013.Thepreliminaryestimatefor2013isthat70,000morehomeswillbesold than in 2012 in the Midwest. In 2011 the number ofhomesoldbottomedoutat910,000units.
2008 2009 2010 2011 2012 2013
Figure 8: Employment Level: Portage
2008 2009 2010 2011 2012 2013
Figure 9: Unemployment Level: Portage
2008 2009 2010 2011 2012 2013
Figure 10: Unemployment Rate: Portage
2008 2009 2010 2011 2012 2013
Figure 11: Civilian Labor Force: Portage
8 CWERB Economic Indicators Report - Stevens Point
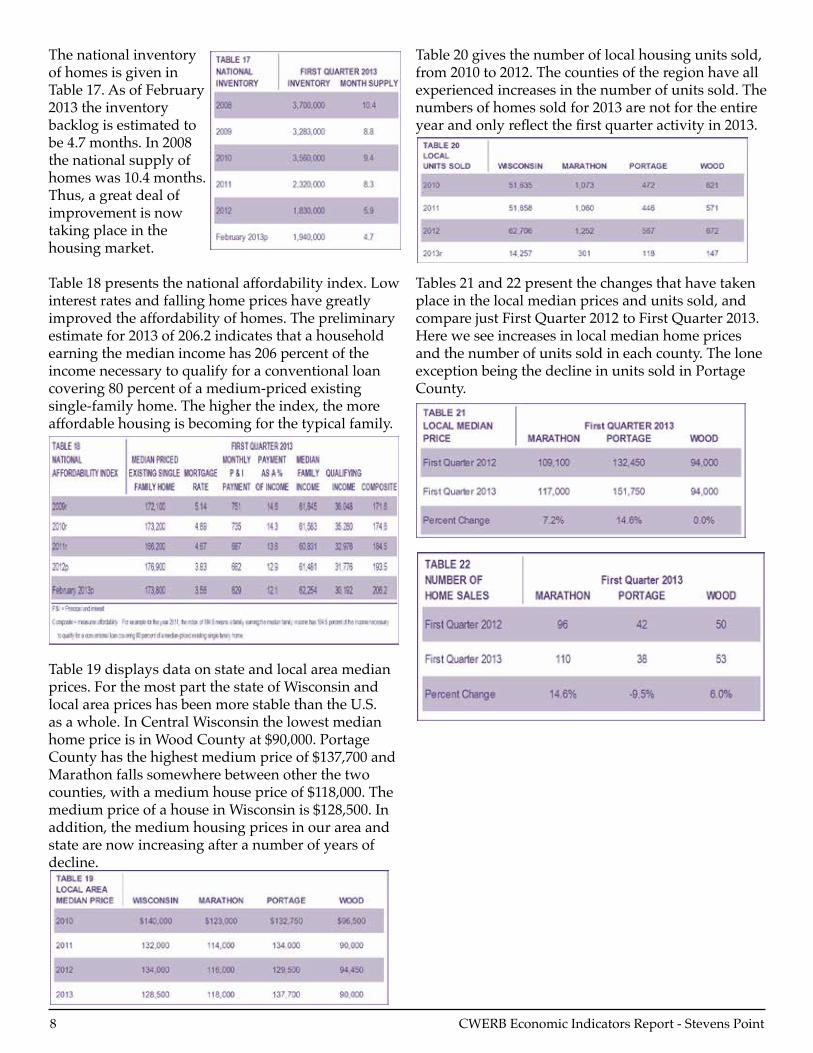
The national inventory ofhomesisgiveninTable17.AsofFebruary2013 the inventory backlog is estimated to be 4.7 months. In 2008 thenationalsupplyofhomes was 10.4 months. Thus,agreatdealofimprovement is now taking place in the housing market.
Table18presentsthenationalaffordabilityindex.Lowinterestratesandfallinghomepriceshavegreatlyimprovedtheaffordabilityofhomes.Thepreliminaryestimatefor2013of206.2indicatesthatahouseholdearningthemedianincomehas206percentoftheincomenecessarytoqualifyforaconventionalloancovering80percentofamedium-pricedexistingsingle-familyhome.Thehighertheindex,themoreaffordablehousingisbecomingforthetypicalfamily.
Table 19 displays data on state and local area median prices.ForthemostpartthestateofWisconsinandlocal area prices has been more stable than the U.S. as a whole. In Central Wisconsin the lowest median homepriceisinWoodCountyat$90,000.PortageCountyhasthehighestmediumpriceof$137,700andMarathonfallssomewherebetweenotherthetwocounties,withamediumhousepriceof$118,000.ThemediumpriceofahouseinWisconsinis$128,500.Inaddition,themediumhousingpricesinourareaandstatearenowincreasingafteranumberofyearsofdecline.
Table20givesthenumberoflocalhousingunitssold,from2010to2012.Thecountiesoftheregionhaveallexperiencedincreasesinthenumberofunitssold.Thenumbersofhomessoldfor2013arenotfortheentireyearandonlyreflectthefirstquarteractivityin2013.
Tables 21 and 22 present the changes that have taken placeinthelocalmedianpricesandunitssold,andcomparejustFirstQuarter2012toFirstQuarter2013.Here we see increases in local median home prices andthenumberofunitssoldineachcounty.Theloneexception being the decline in units sold in Portage County.

CWERB Economic Indicators Report - Stevens Point 9
NoCostBusinessAssistanceforEntrepreneursEntrepreneurialactivity,asreflectedby2013Q1businessstartlegalformations,lookstobeincreasingfortheregion.InadditiontotheUWStevensPointSmallBusinessDevelopmentCenter,http://www.uwsp.edu/conted/sbdc many no-cost resources are available to assist existing and startup entrepreneurs.
TheSmallBusinessAdministrationfeaturesanonlinelearningcenterthatoffersassistancewithawiderangeoftopicsincludingMarketinginToday’sEconomyandTipsforGovernmentContracting. http://www.sba.gov/sba-learning-center
Many entrepreneurs seek answers on what is involvedingettingabusinessloan.TheSBAoffersdetailsonpreparingloanapplicationsat http://www.sba.gov/category/navigation-structure/loans-grants/small-business-loans/how-prepare-your-loan-application The site featuresinformationoncreditfactors,assessingthecurrentfinancialsituationandwhattoincludein preparing a loan package.
The Wisconsin Economic Development Corporation,http://inwisconsin.com/start-your-businessprovidesinformationforstartupandexistingbusinesses.Wisconsin,thrutheonlineBusinessWizard,http://ww2.wisconsin.gov/state/wizard/app/LoadIntroprovidesinformationonlicensing,permittingandregulatoryrequirements,applicationforms,available state resources and links to other valuablebusiness-relatedinformation
Nocosttemplatesandtools,mentoringandonlineworkshopsareavailablefromCentralWisconsinSCORE online at http://centralwisconsin.score.org/CommunityActionProgramCAPservicesbusinessdevelopmentprogramoffersfreeservicesto low-income individuals or to businesses thatcreateliving-wagejobsforlow-incomeindividuals. http://www.capserv.org/
ResourcesandqualityreferralsarealsoavailablethroughareachambersofcommerceandCentergy,TheCentralWisconsinAllianceforEconomicDevelopment http://centergy.net.
TotalBusinessStartsCompared2010,2011,2012
TotalBusinessStartsComparedQ1:2010,2011,2012,2013
TotalNumberofSBALoansCompared2010,2011,2012
Measuring Entrepreneurial Activity as Potential Measure of Job Growth
UWSP Small Business Development CenterVickiLobermeier,SBDCDirectorofEntrepreneurshipActivities
MaryWescott,SBDCCounselingManager

10 CWERB Economic Indicators Report - Stevens Point
TotalSBALoanAmountCompared2010,2011,2012
TotalNumberofSBALoansComparedQ12010,2011,2012,2013
TotalSBALoanAmountComparedQ12010,2011,2012,2013

CWERB Economic Indicators Report - Stevens Point 11
Introduction Ina1963speechontheeconomy,PresidentJohnF.Kennedyremarkedthat“arisingtideliftsallboats.”Thisfamousphraseaccuratelycapturedthebroad-based economic prosperity experienced by the United Statesatthattime.EconomistshavecharacterizedthequartercenturyfollowingWorldWarIIasthe“GreatCompression.”From1947to1973,averagehouseholdincome increased an impressive 2.6% annually in inflationadjustedterms.Remarkably,realincomesforhouseholdsinthebottom20percentoftheincome distribution grew 3 percent annually while realincomesforthetopfifthroseby2.5%annually(GoldinandKatz,2009,28).Thiserawitnessedbotharapidly expanding pie and a greater equality among its slices. Thistrajectory,however,hasnotbeensustainedasincomes have become less equal in the U.S. during the last 30 years. Economists and some commentators havelabeledthecurrentperiodofrisingincomeinequality and diminished economic growth as the “GreatDivergence”(Noah,2010).“From1973to2005,thebottom-fifthoffamiliesrealizedalmostnogrowthinrealincome,whereasthetopfifthenjoyedanaverageannualgainof1.6percent”(GoldinandKatz,2009,28).Itisimportanttopointoutthatthe recent increase in income inequality is not a phenomenonfacedsolelybytheUnitedStates;italsohascharacterizedtheexperiencesofotherOECDcountries.Thecommonexperienceofrisinginequalitywithinthesenationsmaylargelyreflectthestructuralevolutionthatalldevelopedeconomiesface. ThispaperanalyzesthisgreatdivergenceineconomicfortunesamongAmericanhouseholds.Itbeginsbyexaminingtheevidenceofincreasingeconomic inequality in the United States over this timeperiod.Fromthere,weconsiderthecomplexfactorsresponsibleforthisrise.Then,weexploreAmericanidealsofequality.Suchanexplorationisimportant in evaluating policy prescriptions that addressinequality.Next,thepaperdescribeschangesin economic mobility during this period. Lastly we brieflyoutlineseveralbroadareasforpotentialpolicyresponsesthatareconsistentwithAmericanvalues.
TheEvidenceofIncreasingEconomicInequality TheGiniIndex(GI)iscommonlyusedtomeasure
thedegreeofincomeequality in a geographic area or a nation. The rangeofGIisfrom0to1.00.Anationorregion is said to have a completely unequal distributionofincomewhentheGIequals1.00(onegroupreceivesalltheincome),andtohave a completely equal distribution when the GIequals0(eachgroup
hasthesameincome).Theevidencefromavarietyofsources suggests that the income distribution in the US has become less equal over past 30 years. The most recent and comprehensive data set comes fromthenonpartisanCongressionalBudgetOffice(CongressionalBudgetOffice,2011,7).Inmeasuringincomeinequality,theCBOusesmarketincomeasreportedonincometaxformsplusemployerpaidhealthcareinsurance(AppendixA).In1980theGIstood at around .48 and by 2008 it reached .59. This represents a 23 percent increase in income inequality in the nation over the past 27 years. The subtraction ofcapitalgainsfrommarketincomedatareducesthedegreeofincomeinequality.However,theGIformarket income excluding capital gains has trended higher as well meaning that capital gains alone do not explain the upward trend in U.S. income inequality. Inmeasuringanation’sincomedistribution,economistsdivideanation’shouseholdsintoquintileswitheachquintileaccountingfor20percentofthepopulation. The CBO study also shows that income has become much more concentrated in the upper quintileofhouseholdswithincomeaccruingtothetop1percentofhouseholdsbeingamajorsourceoftheincreaseinGI,(CongressionalBudgetOffice,2011,xi).Since1979,everyquintileexperiencedadeclineintheshareofmarketincomeexceptforthehighest(or
The American Pie: Income Inequality in the United StatesScott Wallace Ph.D.,
Professor of EconomicsRandy F. Cray Ph.D.,
Professor of Economics and Chief Economist

12 CWERB Economic Indicators Report - Stevens Point
fifth)quintile.Acloserexaminationshowsthatonlythetop1percentofhouseholdsincreaseditsshareofmarket income over the period! Morespecifically,theCBOfoundthat,between
1979and2007,incomegrewby:275percentforthetop1percentofhouseholdsand65percentforthenext19percentofthehighestquintile.Incomeroseapproximately40percentforthenextthreequintilesand18percentforthebottom20percent,(CongressionalBudgetOffice,2011,x).Theevidenceonce again supports the position that income inequalityhasbeengrowingattheverytopoftheincome distribution in the U.S.
Anotherwaytolookatincomeinequalityistoestimatetheincomeshareoffamiliesinthetopdecile(tenpercent)usingincometaxdatathathasbeencollectedsince1913(Saez,2013,8).Thetop1percentoffamilies’shareofincomeintheU.S.hasrisenfromabout8percentin1970to23percentin2007.Meanwhile,thetotalincomeaccruingtotheother9percentoffamiliesremainedrelativelyflatovermostthe past 90 plus years.
Anumberofanalystscontendthatthesemeasuresoverstatetheriseofinequalityoverthistimeperiod.One argument claims that changes in the tax code havecausedanunderreportingofincomeforthelowerquintilesbyignoringothersourcesofincome such as employer paid health insurance. In addition,thereductionincapitalgainstaxrateshaveencouragedthewealthytorealizetheircapitalgains,thusinflatingincomesintheupperendoftheincomedistribution. While there is some validity to these criticisms,theirimpactontheanalysisismarginalatbest.
NationalandLocalAreaIncomeInequality Anotherdimensionisthespatialdistributionofincomeinequality.Incomeinequalityisnotuniformthroughout the United States. The U.S. Census Bureau mapoftheUnitedStatesshowstheGIatthecountylevelfrom2006to2010.Incomeinequalitytendsbeconcentrated in metropolitan areas and in the South. However,asthemapillustrates,therearepocketsofhighincomeinequalityelsewhereinthenation(UnitedStatesCensusBureau,2012,2).

CWERB Economic Indicators Report - Stevens Point 13
International Comparisons: Within Nations and AcrossNations Data on income equality within nations and across nations over time supports the assertion that the U.S.hasahigherconcentrationofincomeinequalitythananyotherdevelopedcountry(EconomicPolicyInstitute,2013,84).Moreover,therateofincreasein income share by the top 1% is higher in the U.S. thanin15otherdevelopedcountries.Ifwelookfromanalternativeperspective,weseeeconomicinequalityacrossnations(ratherthanwithin)hasdeclined.“Globalinequalityhasbeguntofallaspoorercountriescatchupwithrichercountries”(TheEconomist,2013,4).Thissurelyisgoodnewsasglobaleconomicgrowthhassignificantlyreducedpovertyinemergingeconomies.Thefocus,here,however is on rising inequality within the United States.
CausesofRisingIncomeInequality InthissectionofthepaperweexploresomepossiblecausesfortheriseinincomeinequalityintheU.S.Researchershavehadadifficulttimeascribingblametojustonefactor(EconomicReportofthePresident,February,1997).WebelieveitistheconfluenceofanumberoffactorsthatbestexplainstherisingincomeinequalityintheU.S.Thesefactorsincludeskill-biasedtechnologicalchange,globalization,institutional&organizationalchange,theriseofwinner-take-allmarkets,taxationpolicy,andimmigration. Skill-biased Technological Change This idea here is that technological innovation hasfavoredknowledge-basedoccupations.Theimplicationisthatautomationandnewinformationtechnologieshavegreatlyreducedthenumberofhighpayinglowskilledjobs.Atthesametimeindividualswith the requisite technological skills are relatively scarceandinhighdemand.Theautomobileindustry,
forexample,hasseenalargereductionininhighpayinglowskilljobslargelycausedbythewideadoptionoflabor-savingautomation.Atthesametimetheautomobileindustryandothermanufactureshavehaddifficultyfindingskilledworkerstodomorecomplex tasks. Thislineofreasoningsuggeststhatdigitalandelectronic innovations have simultaneously driven downthewagesofalargenumberoflowskilledworkersnumberswhileincreasingthewagesofamuchsmallergroupofhighlytrainedandskilledworkers. Even though innovation has contributed to economicinequality,itdoesnotexplaineverything.Mostofthegainsinincomehavegonetothetop1percentoftheincomedistribution.Whileitistruethat education and training are highly correlated withearnings,individualsinthetop1percentarenotnecessarily any better educated or trained than people furtherdowntheincomedistributionwhohavenotexperiencedextraordinarygainsintheirincome(U.S.CensusBureau,(2006). Globalization Thisargumentcontendsthattheglobalizationoftheworld’seconomyhasexposedAmericanworkersto greater competition. More than at any time in history,lessskilledinexpensiveforeignlaborisindirect competition with U.S. workers. Improvements intransportation,communicationandtherelaxationoftraderestrictionshavemadeforeignmadegoodsmoreaccessibletoU.S.consumers.Thus,U.S.workershave become more susceptible to being displaced byinexpensiveforeigncompetition,withlow-skilledU.S.workersfacingthefiercestcompetition.Converselythegreatertheskilllevelofworkers,thelesslikelytheyaretolosetheirjobstounskilledforeignworkers.Thissituationhasexacerbatedincome inequality in this country. Whileglobalizationhassomeexplanatorypower,theriseinincomeinequalitywastakingplacebeforelongbeforetheglobaltradepactsandtheimprovementsintransportationwereinplace(TimothyNoah,2010).Thus,globalizationwhilepartofthestorycannotaccountforthelongtermtrendinU.S.incomedistributionorbethesoleexplanationofwhythetop1percenthasseenalargeincreaseinitsshareofincome. Winner-take-all-markets(WTAM) TheWTAMhypothesistakesthepositionthatsocietyhas been paying larger premiums to the very best in a profession.Whetherinacademics,athletics,business,

14 CWERB Economic Indicators Report - Stevens Point
entertainment,medicine,law,orotherprofessions,thetop people are commanding ever higher premiums abovetheaverageincomelevelintheirprofession.AgoodexampleofaWTAMisthemarketfortournamentgolfers.“WhenhewasatthetopofhisgameTigerWoodswasmaking$12millioninwinningsand$100millioninendorsementswhereasthesecondbestgolfer,PhilMickelson,wasmaking$4millioninwinningsand$47millioninendorsementsand the third best was making less than 15 million combined”(Zingales,2012,23).
Thereasonsforthisaremany,butattheheartofthe story is that new communication technologies haveloweredthecostofreachingvastmarkets.Thiscreatesthepotentialforhugeprofitsforthosepeopleorfirmswhoaremarginallybetterattheiractivitythanthecompetition.Simplystated,newtechnologies now give markets the choice between selectingapersonorafirmwhoisverygoodatwhattheydoandchoosingaperformerwhoistheverybestintheirfield.InaWTAMworldapersonorfirmthat has a slight edge over the competition will have greatpotentialtocommandanincreasingshareoftheincomepie(FrankandCook,1996).Itisimportanttorecognizethattheincreaseinincomeinequalitywasunderwaybeforetheemergenceofthesetechnologicalinnovations.Therefore,WTAMcanexplainsome,butnotallofthegrowingincomedisparityinthiscountry. Institutional&OrganizationalChange:CEOpayandthedeclineinunionization This explanation says that the dramatic rise in CEO payhascontributedtoofrisingincomeinequalityintheU.S.Thechartbelowshowshowtheratioofaverage CEO to average compensation to average production worker compensation has changed
over the past 40 years. In 2011 the average CEO compensationwasapproximately209timesthatoftheaveragepersoninthatorganization(EconomicPolicyInstitute,2013,C.4118).Anecdotalevidencesuggests that the number has risen since 2011. Sowhatarethereasonsforthistrend?MuchoftheincreaseinCEOpaystemsfromchangesincorporategovernance practices that were widely implemented in the late 1980s and early 1990s. Changes in executive compensationthroughtheincreaseintheuseofstockoptionsandotherpayforperformanceschemeswere designed to align managerial and shareholder interests(HolmstromandKaplan,2001).Insteadofreplacingtraditionalformsofcompensationlikesalary,thesenewschemesoftenwereaddedontothese existing methods. Evidence suggests that the stronginfluenceofCEOsonthemembershipofBoardsofDirectorsinfluencedtheadoptionofthesehighlyfavorablepaymentarrangements(BebchukandFried,2003).
In1973,26.7percentofallwageandsalaryworkerswereunionmembers.By2011,unionparticipationhadfallento13.1percentofthelaborforce.CriticssaythedeclineinunionizationhasallowedCEOstocaptureagreaterpercentageofafirm’sproductivity

CWERB Economic Indicators Report - Stevens Point 15
gains,a.k.a.profits(EconomicPolicyInstitute,2013,C.4269).Thechartbelowshowsaclosecorrelationbetween productivity gains and real medium householdincomeuntilabout1979.Afterthat,gainsinworkerproductivityhavehadmuchlessinfluenceonrealmediumfamilyincome(EconomicPolicyInstitute:EconomicIndicators,2013). Taxation policyTaxation policy and the role that it may have played in accelerating income inequality has been a hot button issue in the U.S. The argument is well known andstraightforward.Taxcuttingpolicieshavehad the largest impact on households earning at or above the 95 percentile. The chart below shows the federaltaxratesforvariouspercentilesoftaxpayingunitsin1960andafterthelastmajorroundoftaxratereductions.Thedataindicatesthatournation’sfederaltaxsystemhasbecomemuchlessprogressive.In1960thetop0.01percentofhouseholdsfacedacombinedrateofabout70percent;in2004thecombinedratefelltorateofabout30percent(PikettyandSaez,2007).
Thechartbelowshowsaftertaxincomeshareforvariouspercentilesfrom1979-2007.Theonly group to experience an increase was the top1percentofhouseholds.However,someresearchers believe that tax rate reductions account forjustasmallportionofthegreatdivergences
(Noah,2010,1).Theypointoutthattaxratereductions had little impact on changing income distribution in this country as shown in the CBO chart (CongressionalBudgetOffice,2011). ImmigrationTheimmigrationoflowerskilledworkersintotheU.S.it’sarguedhaspusheddownwagesratesfortheunskilled workers. The Immigration and Nationality Actof1965whichliberalizedimmigrationrestrictionsledtosignificantincreasesinimmigrationratesintotheUnitedStates.“Since1970,theforeign-bornshareoftheU.S.population(legalandillegal)hasrisenfrom4.8percentto11percent.MorethanhalfofU.S.immigrantsnowcomefromMexico,CentralandSouthAmerica,andtheCaribbean.Althoughasubstantialminorityofimmigrantsarehighlyskilled,formostimmigrantsincomesandeducationalattainmentaresignificantlylowerthanforthenative-born”(Noah,2010,5). The rise in immigration has had the greatest negative impactontheincomesonlow-skilled,low-incomeworkers.Studiesshowthat,from1980to2000,Mexicanimmigrantsalonereducedtheincomesofnative-born high school dropouts by over 8 percent (Noah,2010,5).Whileimmigrationhashadsomeimpactinincreasingeconomicinequality,itseffectis much smaller than the other causes that we have presented.Higherratesofimmigration,forexample,dolittletoexplaintherapidriseinthetop1percent’sincome level. Whilewehavediscussedanumberofcausesofrisinginequality,itisimpossibletoisolateonefromanother.Skill-biasedtechnologicalchange,globalization,andwinner-take-allmarkets,forexample,aredeeplyinterrelatedintheireffectsoninequality.Competitivepressuresfromincreasingglobalizationincentivizefirmstoadoptnewtechnologiesthatharmlow-skilled workers but reward highly skilled workers. These new technologies also act to expand global markets by reducing communication and search costsforcustomersandbyfacilitatingcoordinationamong businesses and their suppliers on a greater geographicalscale.Thephenomenonofwinner-take-all markets similarly depends upon both access to globalmarketsandtheutilizationofnewinformationand communication technologies to reach these global markets.

16 CWERB Economic Indicators Report - Stevens Point
EqualityandAmericanValuesDoes the dramatic increase in economic inequality overthelast30yearsrepresentamajorproblem?WhetherinequalityislikelytobeamajorconcerntocitizensdependsuponhowAmericansviewinequality.Thepoliticalfeasibilityofanypolicyresponse to inequality needs to be consistent with Americanvalues.Thoughequalityishighlyvaluedideal,Americanshavearatheruniqueconceptionofequalitycomparedwithpeoplesfromothercountriesand cultures.
PerhapsnopassagebettercapturestheAmericannotionofequalitythanthiscelebratedphrasefromtheDeclarationofIndependence:“Weholdthesetruthstobeself-evident,thatallmenarecreatedequal,that they are endowed by their Creator with certain unalienableRightsthatamongtheseareLife,Liberty,andthepursuitofHappiness.”Here,theemphasisisontheequalityofrightsamongcitizensratherthanonequalityofoutcomesorresults.Consistentwiththisrights-basedconceptionofequalityaretheAmericanidealsofsocialequality,equalitybeforethelaw,andequalityofopportunity.Asideals,Americansrecognizethateachhasn’tbeenfullyrealizedbutremain important goals that society should always strive to achieve. Theidealofsocialequalityrejectsdistinctionsbasedon“rankanddeferenceinsocialrelations”(Ladd,1994,9).Ingeneral,Americansabhortheideaofprivilegeassociatedwithclass,birthright,religion,race,orethnicity.“’I’masgoodasyouare’–that’stheidealofsocialequality”(Ladd,1994,10).Individualsshouldbejudgedonthebasisoftheircharacter,capabilities,andaccomplishments,notoncriteriadivorcedfromtheirownefforts.Equalitybeforethelawasaprinciplereferstoallindividualsreceivingequal treatment and due process under the law. The right to legal representation and the public support oflegalservicesforthepoorreflectsocietaleffortstoensuregreaterequalitybeforethelaw. Therearetwofacetsthatconstituteequalityofopportunityasanideal.Formalequalityofopportunityrepresentsa“standardofdecision-making,stipulatingthatallpeoplebetreatedthesame,exceptwhendistinctionscanbeexplicitlyjustified.Thisstandardhasbeenusedtodefinefairnessinlending,housing,hiring,wageandsalarylevels,jobpromotion,votingrights,andotherconcerns.Artificialbarriers,prejudices,andpersonalpreferencesshouldneitherrestrictnorenhanceopportunitiesforanyone”(DeVries,2005).Thefocus
on“equaltreatment”andtheoppositionto“artificialbarriers”isconsistentwiththeidealsofsocialequalityandequalitybeforethelaw. Thesecondfacetisknownassubstantiveequalityofopportunity. In addition to ensuring that individuals arejudgedfairlyontheirmerits,substantiveequalityofopportunitycallsuponsocietyto“providegoodenoughopportunitiesforallitsmemberstodeveloptheirnativetalentssoastobecomequalifiedforcompetitive positions. The idea here would be thatthereissomethresholdlevelofopportunitytodevelopone’snativetalentsintoskillstowhichallareentitled”(Arneson,2002).Americanshavestronglysupportedpubliceffortsaimedatgivingallitscitizensopportunitiestocultivateandexpandtheircapabilities. Laws requiring that all children receive a basic education extend back to the colonial period ofAmericanhistory.“Thewholethrustinmakingagoodeducationbroadlyavailableisbringing,astheideal,allsegmentsofthepublictothestartingline with more or less an equal chance to succeed. Extendingeducationenlargesopportunity,but,atthesametime,doesn’tguaranteesuccess”(Ladd,1994,41). Whiletheseidealshaveinformedpoliticaldebateandthesubstanceofpolicy,Americansgenerallyhavenotsupportedgovernmentaleffortstoensuregreaterequalityofresults.Thoughalltaxationand expenditure policies unavoidably result in a redistributionofincome,Americanshavenotviewedthereductionofincomeinequalityasalegitimategoalofgovernmentalpolicy.Argumentssupportingprogressive taxation traditionally have been based on attaininga“fair”distributionofthetaxburdenratherthanasameansofredistributingincomefromtherichtothepoor.Thegoalofanti-povertyprogramslikewelfareistoprovidesomeminimaleconomicsupporttothoseunabletofendforthemselvesbutdonotrepresentalegitimatemeansofnarrowingincomeinequality(Plattner,1979). MostAmericansstronglybelievethatthosewhoworkhardfullydeservetherewardstheyreceivefortheirefforts.OpinionpollstakenduringdifferenttimeperiodsinAmericanhistoryhaveshownaremarkableconsistencyinAmericanattitudestowardsgovernmentaleffortsthatredistributeincometoremedyeconomicinequality.In1938,aRoperOrganizationpollaskedrespondentswhethera top limit should be placed on income with any excess income coming to the government as tax revenue.DespitetheeconomichardshipsoftheGreat

CWERB Economic Indicators Report - Stevens Point 17
Depression,onlyone-thirdofrespondentssupportedsuchalimit(Ladd,1994,41). Inequality and Economic Mobility Not only are policies that reduce income inequality through income redistribution inconsistent with Americanvalues,mosteconomistsbelievethatsuchattemptswouldbeharmfultoeconomicgrowth.InEqualityandEfficiency:TheBigTradeoff,economistArthurOkundescribedtheproblemwitheffortstoachieveincomeequality.“Inpursuingsuchagoal,societywouldforegoanyopportunitytousematerialrewardsasincentivestoproduction.Andthatwouldleadtoinefficienciesthatwouldbeharmfultothewelfareofthemajority.Andanyinsistenceoncarvingthepieintoequalsliceswouldshrinkthesizeofthepie”(Okun,1975,48).
Unequal incomes represent the carrots and sticks that ensure that resources are employed in their most productive uses. Because the rich save and invest moreoftheirincome,incomeinequalityalsosupportsawealthaccumulationprocessthatfuelseconomicexpansionandjobcreation.Somedegreeofincomeinequalityisthereforeanecessarycomponentofarapidly growing economy which can improve the standardoflivingforallincomegroupsbecauseitexpandstheeconomicpie.Thougharisingtideliftsallboats,itisreasonabletoexpectthattheyachtsascendfurtherthanthedinghiesiftheactionsofyachtownerslargelyareresponsiblefortherisingtide. Despitetherecognitionoftheeconomicimportanceofincomeinequality,anumberofrecentstudiessuggestthat its sharp rise over the last 30 years has not enhancedincentivesforproductiveeffortandmayreflectgrowinginefficienciesintheeconomy.Suchan increase in inequality would be less problematic ifaccompaniedbyhighratesofeconomicmobilitysothatasignificantproportionofpeoplewhostartoffearninglowincomesmoveintohigherincomecategoriesovertime.Thesestudies,unfortunately,paintapictureofaneconomycharacterizedbyboth increasing income equality and declining income mobility during this period. The decline in income mobility is particularly troubling because itmayindicateadeclineinsubstantiveequalityofopportunity during this period. Onewayofmeasuringeconomicmobilityis by examining intragenerational mobility. Intragenerational mobility measures the “likelihood thatapersonwillmovefromonesegmentoftheincomedistributiontoanother”(Zingales,2012,26).
Some studies show a decline in intragenerational mobilitysincethe1970s.“Inthe1990s,…36percentofthosewhostartedinthesecondpoorestquintileoftheincomedistributionstayedthere,versus32percentinthe1980sand28percentinthe1970s”(Zingales,2012,26). Moststudiesanalyzingincomemobilityfocusonintergenerational mobility which measures the correlationofparents’incomeswiththeirchildren’searnings. The idea here is to determine whether aparent’sincomeisagoodpredictoroftheirchildren’sincome.“Inasocietywithbroadequalityofopportunity,theparents’positionontheincomeladdershouldhavelittleimpactonthatoftheirchildren.”(TheEconomist,2012,10). Awell-acceptedstatisticforintergenerationalmobilityisintergenerationalelasticityinearnings(IGE).TheIGEis“thepercentagedifferenceinearningsinthechild’sgenerationassociatewiththepercentagedifferenceintheparentalgeneration.Forexample,an[IGE]of.6tellsusthatifonefathermakes100%morethananotherthenthesonofthehighincomefatherwill,asanadult,earn60%morethanthesonoftherelativelylowerincomefather.Anelasticityof0.2saysthis100%differencebetweenfatherswouldonlyleadtoa20%differencebetweenthesons.Alowerelasticitymeansasocietywithmoremobility”(Corak,2011,2). EconomistsDanielAaronsonandBhashkarMazumdercalculatedUSIGEestimatesforeachdecadefrom1940to2000.ThefiguresbelowshowthatIGEdeclinedfrom1940to1980butincreaseddramatically in the 1990s and 2000s. These results implythateconomicmobilityincreasedforthefirstfourdecadesoftheirsurveyanddramaticallyfellduringthelasttwodecades(AaronsonandMazumder,2007).
Elasticitiesbetweenparentalincomeandsons’earnings,1950–2000

18 CWERB Economic Indicators Report - Stevens Point
Note:Thehighertheintergenerationalelasticity(IGE),thelowertheextentofmobility.TheIGEsshownarefor40-to44-year-oldsons. Source:Authors’analysisofAaronsonandMazumder(2007,Table1) Inadifferentstudy,economistMilesCorakcalculatedestimatesofintergenerationalelasticitybetweenfatherandsonearningsfor22countries,includingthe United States. Cross-country comparisons show thattheUnitedStatesdoesnotcomparefavorablywithmostdevelopedcountries.OftheOECDnations,onlyGreatBritainandItalyscorelowerthantheUnited States with regard to economic mobility. ThesignificantdifferenceinIGEscoresbetweentheUnitedStates(0.47)andCanada(0.19)isparticularlystriking,giventherelativeculturalsimilaritiesbetweenthetwonations(Corak,2011).TherelativelypoorperformanceoftheUnitedStatesseemstocontradictAmericannotionsthatseetheUnitedStatesasalmostuniquelythelandofopportunity. IntergenerationalcorrelationsbetweentheearningsoffathersandsonsinOECDcountries
Note:Thehighertheintergenerationalelasticity,the lowertheextentofmobility. Source:AdaptedfromCorak(2011,Figure1) PerhapsCorak’smostinterestingresultsaregiveninthenextfigure.Here,Corak“plotstheintergenerationalearningselasticities[of22countries]againstacross-sectionalmeasureofinequality(theGiniCoefficient)”(Corak,2011,5).Thefigureclearly indicates that countries with high degrees ofincomeinequalityalsosufferfromlowratesofintergenerational mobility.
WhileCorak’sanalysisdoesnotexplainthereasonsforthisnegativecorrelationbetweenincomeinequalityandeconomicmobility,itdoessuggestthateconomicinequalitymaybeself-perpetuating.“Fromviolinlessonstotutorsfortests,richerparentscaninvestmoreintheirchildren,improvingtheirchancesofgettingintothebestuniversities”(TheEconomist,2012,22).ThedecentralizedfundingofpubliceducationintheUnitedStatestranslatesintosignificantqualitydifferencesbetweenwealthyand poor districts. “Richer neighborhoods can affordbetterschools,whichreinforcesthegrowinggeographicalgapbetweendifferentsocialgroups”(TheEconomist,2012,12).
These gaps between social groups have been accentuated by a rise in residential segregation by incomeoverthelast30years.APewResearchCenterstudy“findsthat28%oflower-incomehouseholdsin2010werelocatedinamajoritylower-incomecensustract,upfrom23%in1980,andthat18%ofupper-incomehouseholdswerelocatedinamajorityupper-incomecensustract,upfrom9%in1980”(FryandTaylor,2012).Suchchangesarefurtherreinforcedbyothersocialtrends.“In1960Americancoupleswithtwocollege-educatedpartnersaccountedforonly3%ofthetotal.Todaythatfigureis25%andinthetop5%oftheincomedistributionitis75%(TheEconomist,2012,14).
Policy ResponsesInthissection,webrieflyconsideranumberofbroadpolicyresponsestothetwinproblemsofeconomicinequality and declining economic mobility. The data presented in the previous section strongly suggests that increases in economic inequality are linkedtogreaterinequalityofopportunityamongitscitizens.Policyresponsesdesignedtoexpandoverall

CWERB Economic Indicators Report - Stevens Point 19
opportunityareconsistentwithAmericanvaluesand simultaneously help grow the economic pie by encouragingamoreefficientuseofresources.Here,we show how government can improve outcomes by doing more in some arenas while doing less in others. Giventhebreadthandcomplexityoftheseissues,weonlyprovideabriefsketchofseveralareaswherepolicy changes may have a positive impact.
Human CapitalEarlierinthepaper,wedescribedhowskill-biasedtechnological change increased income inequality byincreasingthedemandforhighlyskilledandeducatedworkerswhilereducingthedemandforlessskilledworkers.Therisingwagepremiumforcollegeeducatedworkersisstrongevidenceforthisphenomenon.“Employersarepayingthetypicalfour-yearcollegegraduate[withoutgraduateschool]75%morethantheypayhighschoolgrads.Twenty-fiveyearsago,theywerepaying40%more”(Wessel,2007,A2).
Askepticofthislineofreasoningcouldcorrectlypointoutthatotherperiodsoftechnologicalchangesimilarlyincreasedthedemandforskilledworkersyet did not lead to greater income inequality. The problemwiththestorywehavetoldsofaristhatitfocusessolelyondemandwithoutconsideringsupply.Atthestartofthe20thcentury,forexample,advancesinelectricity,communications,andcontinuousprocessmachinerycreatedademandformanagers,clericalworkers,andhighlyskilledbluecollarworkers(BrynjolfssonandMcAfee,2011).“[O]fficeworkers had to know how to operate typewriters and addingmachines.Theyhadtomasterbookkeeping,billingprocedures,andstenography”(Noah,2010).The education system in the United States during thiserasuccessfullyaccommodatedthisincreaseindemandforhigherskilledworkers.Workerswitha high school level education had learned the skills neededtomeetthisnewdemand.“AverageyearsofschoolingincreasedrapidlyforAmericansbornfrom1875to1950(andeducatedintheUnitedStates).
TheincreaseinsupplyofhigherskilledworkersreflectsAmericans’strongcommitmenttoeducation.“Indeed,Americaledtheworldinuniversaleducationinthefirsthalfofthe20thcentury,beginning with the movement in 1910 to 1940 to expandfreecompulsoryeducationtohighschoolyears and continuing with the post war transition tomasscollegeattendance”(GoldinandKatz,2009,30).Thisincreaseinthesupplyofeducatedworkerseffectivelyreducedthewagepremiumforeducated
workers,therebysupportingtheincreasingincomeequalityexperiencedduringtheGreatCompression.
Thewaveofnewcomputerandinformationtechnologies over the last three decades has once againincreasedthedemandforamorehighlyeducatedworkforce.EconomistsErikBrynjolfssonandAndrewMcAfeedescribethesechanges.“Whilecomputerswinatroutineprocessing,repetitivearithmetic,anderror-freeconsistencyandarequicklygetting better at complex communication and pattern matching,theylackintuitionandcreativityandare lost when asked to work even a little outside a predefineddomain”(BrynjolfssonandMcAfee,2011,55).Peoplewhopossesshigherorder,criticalthinkingskills are in greater demand while moderately skilled workers are increasingly be replaced by thesenewtechnologies.“Inparticular,softerskillslikeleadership,teambuilding,andcreativitywillbe most important. They are the areas least likely to beautomatedandmostindemandinadynamic,entrepreneurialeconomy”(BrynjolfssonandMcAfee,2011,63).Thegreaterneedforthesekindsofskillshasincreasedthedemandforworkerswithcollege-leveland graduate degrees.
Thedifferenceduringthisperiodisthatsupplyhasnotkeptupwithdemand.“Asharpslowdownintheincreaseofeducationalattainmentandhighschoolgraduationratesoccurredforthosebornafter1950.College graduation rates began to slow and high schoolgraduationreachedaplateau”(GoldinandKatz,2010,31).Thisdeclineintherateofgrowthineducationalattainmentisstriking.AtypicalAmericanbornin1945receivedtwomoreyearsofschoolingthantheirparentswhileeducationalattainmentofatypicalAmericanbornin1975exceededtheirparents’byonly6months(Noah,2010).Theinabilityoftheeducation system to adequately increase the supply ofeducatedworkershasdramaticallyincreasedtherelativewagesofthosewithcollegedegrees.
Inthemeantime,muchofthedevelopedworldhascaught up and surpassed the United States. “The UnitedStates,oncetheworldleaderintheproportionofpeoplefinishinghighschoolhasfallentonearthebottomofthe(richandrelativelyrich)nationsthatbelongtotheOrganizationofEconomicCooperationandDevelopment”(GoldinandKatz,2010,31).Though the United States leads the world in the numberofstudentswhogotocollege,it“hasfallenfromfirsttotenthintheshareofcitizenswhoarecollegegraduates”(BrynjolfssonandMcAfee,2011,61).

20 CWERB Economic Indicators Report - Stevens Point
Debatesoverhowtoreformtheeducationalsystemat all levels are widespread and are well beyond thescopeofthisreport.We,therefore,wouldliketobrieflymentionacoupleofotherwaystoimproveeducationaloutcomes.First,theabilityofworkerstoupdatetheirskillsthroughouttheirworkinglifetimesis increasingly important in a dynamic and innovative global economy. The United States badly trails other developedeconomiesinprovidingopportunitiesforjobretraining.TheUnitedStatesgovernment“spendsbarelymorethan0.1%ofGDPof‘activelabormarketpolicies’togetthelessskilledbacktowork,one-fifthoftheOECDaverage”(TheEconomist,2012,24).
Notallofthenewjobsthatareingreatdemandrequireacollegedegreefromafouryearinstitution.Greatersupportfortechnicalandcommunitycollegesthatpossessspecializedknowledgeoftheneedsoflocal businesses can help provide workers with the appropriateskillstofillthisdemand.Inaddition,UniversityofChicagoeconomistsRaghuramRajanandLuigiZingalesbelieve“theremaybereasontorethinktheentirestructureofhighereducation,asystem designed at a time when students typically lefttheuniversityforacareerwithoneemployer.Weneedmoremodulardegreesandlifelongadmissiontoauniversity(atleastforthegeneralprograms)–sothat the student can pick and choose what she wants andwhensheneedsit”(RajanandZingales,2003,304).
Second,scientistsincreasinglyhaverecognizedthecriticalimportanceofearlychildhoodexperiencesinimpactingthedevelopmentofnon-cognitiveabilitieslikeperseverance,motivation,andattentiveness.TheyarefindingthattheseskillsarejustasimportantindeterminingfuturesuccessascognitiveskillsasmeasuredbytraditionalIQtests.Childrengrowingupindisadvantagedfamilies,however,arelesslikelyto develop these non-cognitive skills in their home environments.Byincreasingnon-cognitiveabilities,earlyinterventionthroughtheprovisionofpre-schoolopportunitieslikeHeadStartforthesechildrenhasshownpositive,long-termimpactsonperformanceinlaterlife.Thedevelopmentofstrongnon-cognitiveabilities becomes increasingly important in world that highlyvaluessofterskills.Programsthatfostertheseskillsincreaseequalityofopportunitybyensuringthataccidentsofbirtharenotthedeterminingfactorofone’sfuturesuccess(Heckman,2012).
InvestmentsinInfrastructureandResearch&DevelopmentPublicinvestmentsininfrastructurecanplaya
critical role in expanding economic opportunities. “Inthelongrun,investmentininfrastructureboostsproductivity by enabling people and goods to get to placesfaster,communicatemoreeasily,spendlesstime and money on repairs and so on. One recent studyfoundthattheconstructionofaroadtypicallyled to an increase in economic activity between three and eight times bigger than the initial outlay within eightyearsafteritscompletion”(TheEconomists,2013,13).TheAmericanSocietyofCivilEngineers(ASCE)recentlygavetheUnitedStatesagradeofDontheoverallstateofitsinfrastructure(BrynjolfssonandMcAfee,2011,67).TheASCEalsofoundthatin2009trafficdelayscostAmericansover$78billioninwastedtimeandgasolinewithanadditional$67billion going to car repair attributable to poor road conditions(TheEconomist,2013,13).
Therecentfiscalcrisesatboththefederalandstatelevelshaveconstrainedthegovernment’sabilitytotaptraditionalsourcesinfundinginfrastructureprojects.Statesandmunicipalities,however,arecreativelyusing“public-privatepartnerships”(PPP)topayforsuchprojects.PPPs“helppairinvestorswithprojectsthatwillgeneratearevenuestreamtobehypothecatedtocoverthecostoftheoriginalinvestment,plusareturn”(TheEconomist,2012,14).Byeliminatingimpedimentstoeconomicexpansion,improvements in transportation and communication infrastructurespromisetoexpandopportunities.
Thecreationofnewknowledgefrompublicinvestment in basic research and development has beenanimportantdriverofeconomicgrowthinthepast.Privateinvestmentinbasicresearchisofteninadequatebecauseoftheenormouscostsinvolvedforanyonefirmandbecausethebenefitsareoftensubjecttospillovereffects.
Forexample,thegovernmentfundedHumanGenomeProjectwhichmappedthehumangenomecosttaxpayersover$3.8billionover15years.Anindustrystudyclaimsthattheproject“helpeddrive$796billionineconomicactivityandraised$244billioninpersonalincome;itsupported310,000jobsin2010.Thesenumbersmaybeexaggerated,butthescaleoftheimpactisclearacrosssuchvastfieldsasagriculture and medicine and new areas such as gene therapy”(Zakaria,2012).Despitethesuccessofsuchinvestments,federalfundingofbasicresearchasapercentageofGDPhasbeendecliningfordecades.“Inaknowledgeeconomy,Americanjobswilldependmoreonscientificresearchthantheydidinthe1950s,yetwespendmuchlessasashareofGDP”(Zakaria,2012).

CWERB Economic Indicators Report - Stevens Point 21
Reducing Regulatory Barriers to EntrySometimes the best thing that government can do toexpandopportunitiesistogetoutoftheway.Theeliminationorreductionofregulatorybarrierstoentrycancreatenewopportunitiestofosternewbusinesscreation.“Intoomanyindustries,elaborateregulatoryapprovalsareneededfrommultipleagenciesatmultiplelevelsofgovernment.Thesetoooftenhavetheimplicitgoalofpreservingrents[profits]ofexistingbusinessownersattheexpenseofnewbusinessesandtheiremployees”(BrynjolfssonandMcAfee,2011,67).
TheUnitedStates’intellectualpropertyregimesarebadlyinneedofreform.Thelargeincreaseinthenumberofpatentsgrantedoverthelastseveraldecadeshashadadampeningeffectoninnovation.Theproblemofoverlappingpatentrightshascreateda“patentthicket”thatnewinnovatorshavetoconfrontincommercializingnewproductsandprocesses.Thesystemalsoencouragestheformationof“patenttrolls.”Patenttrollsarefirmsthatbuyuppatents,notformanufacturingpurposesbutsolely to engage in litigation. These developments underminetherationaleforhavingapatentsystem.Theexpansioninthelengthoftermundercopyrightcoverage under the Sonny Bono Copyright Extension Acthasservedtheinterestsofexistingcopyrightholdersratherthanencouragethecreationofnewcontent(BrynjolfssonandMcAfee,2011,69).
Conclusion Inaddressingthechallengesofeconomicinequality,policyproposalsshouldfocusonadvancingsubstantiveequalityofopportunity.Bygivingcitizensopportunitiestodeveloptheirownskillsandcapabilities,theseeffortshavetheeffectofincreasingsocialmobilityasindividual’sabilitiestocompeteforhigherlevelpositionsinsocietyimprove.Thesepolicies thus can decrease economic inequality while expandingtheeconomicpieasthepotentialofscarcehumanresourcesismorefullyrealized. Anotherwaytodealwithincomeinequalityisthroughtheredistributionofincome.Redistributivepolicies,however,faceanumberofproblems.First,suchpoliciesareoftenpoliticallyinfeasiblebecausetheyconflictwithAmericanvalues.Second,theredistributionofincomecandampeneconomicgrowth by distorting economic incentives. Perhaps themostimportantrationaleforavoidingincomeredistributionisbestdescribedbytheNobel-Prizewinningeconomist,JamesHeckman.“Therearemany calls to redistribute income to address poverty
andpromotesocialmobility….[W]hileredistributionsurelyreducessocialinequalityatapointintime,itdoesnot,byitself,improvelong-termsocialmobilityorinclusion”(Heckman,2012,14).Thusgovernmental policies need to provide people a “leg up”ratherthana“handout.”
Appendix:A
Measuring IncomeCBOconstructeddefinitionsforMarketincome,Transfersincome,andFederaltaxes,(CongressionalBudgetOffice,2011,37)• Marketincome—includesallcashincome(bothtaxableandtax-exempt),taxespaidbybusinesses(whichareimputedtohouseholdsasdescribedbelow),andthevalueofincomereceivedin-kindfromsourcessuchasemployer-paidhealthinsurancepremiums. The taxes paid by businesses are the imputedvalueofcorporateincometaxes(whichareconsideredtobepartofcapitalincome)andtheemployer’sshareofpayrolltaxes(whichareconsideredtobepartoflaborincome).Theyareincluded in the measure under the assumption that household income would have been higher by a correspondingamountintheabsenceofthosetaxes.• Transfersincome—addscashtransferpayments(suchasSocialSecurity,unemploymentinsurance,andwelfarebenefits)tomarketincome,alongwithestimatesofthevalueofin-kindbenefits(fromMedicare,Medicaid,theChildren’sHealthInsuranceProgram(CHIP),theSupplementalNutritionAssistanceProgram(formerlyknownastheFoodStampprogram),andotherprograms).• Federalindividualandcorporateincometaxes,socialinsurance(payroll)taxes,andexcisetaxes.Inthisanalysis,CBOdidnotsubtractotherfederaltaxes(suchasestateandgifttaxes)orstateandlocaltaxesinconstructingafter-taxincome.

22 CWERB Economic Indicators Report - Stevens Point
ReferencesAaronson,DanielandMazumder,Bhashksar.2008.“IntergenerationalEconomic MobilityintheU.S.,1940to2000.”Journal of Human Resources 43,no.1:139-72.
Arneson,Richard.2002.“EqualityofOpportunity,”StanfordEncyclopediaofPhilosophy, Retrievedfromhttp://plato.stanford.edu/entries/equal-opportunity/
Bebchuk,LucianA.andFried,Jesse.2003.“ExecutiveCompensationasanAgency Problem,”Journal of Economic Perspectives,17,3,Summer:71-92.
Brynjolfsson,Erik,andMcAfee,Andrew.2011.RaceAgainsttheMachine:Howthe DigitalRevolutionisAcceleratingInnovation,DrivingProductivity,and IrreversiblyTransformingEmploymentandtheEconomy,Lexington, Massachusetts: Digital Frontier Press.
CongressionalBudgetOffice.2011.TrendsintheDistributionofHouseholdIncome Between1979and2007,WashingtonD.C.:TheCongressoftheUnitedStates.
Corak,Miles.2011.“InequalityfromGenerationtoGeneration:TheUnitedStatesin Comparison”fromhttp://milescorak.files.wordpress.com/2012/inequality-from-generation-to -generation-the-united-states-in-comparison-v2.pdf
DeVries,Paul.2005.“EqualOpportunity,”inCaryCooper,ed.,TheBlackwell EncyclopediaofManagement:BlackwellReferenceOnline.Retrievedfrom http://www.blackwellreference.com/public/tocnode?id=9780631233176_chunk-g978140
EconomicReportofthePresident.February,1997.WashingtonD.C:U.S.Government PrintingOffice.
Economic Policy Institute. 2013.StateofWorkingAmerica,12thEdition,Washington D.C.: Economic Policy Institute.
EconomicPolicyInstitute:EconomicIndicators,2013.Retrievedfrom http://stateofworkingamerica.org/charts/productivity-and-real-median-family-income- growth-1947-2009/
Frank,RobertH.andCook,Phillip.1996.TheWinner-Take-AllSociety:WhytheFewat theTopGetSoMuchMoreThantheRestofUs,NewYork,NewYork:PenguinPress.
Fry,RichardandTaylor,Paul.2012.“TheRiseofResidentialSegregationbyIncome,” PewSocialandDemocraticTrends.Retrievedfrom http://www.pewsocialtrends.org/2012/08/01the-rise-of-residential-segregation-by-income/
Goldin,ClaudiaandKatz,Lawrence.2009.“TheFutureofInequality:TheOther ReasonEducationMattersSoMuch,” The Milken Institute Review,ThirdQuarter,pp.26-33.
Heckman,James.2012.“PromotingSocialMobility,” Boston Review, September/October.
Holmstrom,BengtandKaplan,S.2001.“CorporateGovernanceandMergerActivityin theUnitedStates:MakingSenseofthe1980sand1990s,”Journal of Economic Perspectives,Spring,15(2):121-144.

CWERB Economic Indicators Report - Stevens Point 23
Kopczuk,Wojciech,EmmanuelSaez,andJaeSong.2010.“EarningsInequalityand MobilityintheUnitedStates:EvidencefromSocialSecurityDatasince1937.” QuarterlyJournalofEconomics125,no.1:91-128.
Krueger,AlanB.2012.“TheRiseandConsequencesofInequalityintheUnited States,”SpeechforCenterforAmericanProgress,January12,WashingtonD.C.
Ladd,EverettCarll.1994.TheAmericanIdeology:AnExplorationoftheOrigins, Meaning,AndRoleofAmericanPoliticalIdeas.Storrs,CT:TheRoperCenter.
Noah,Timothy.September4,2010.“UnitedStatesofInequality.”Slate,Retrieved http://www.slate.com/Article/news_and_politics/the_great_divergence/features/2
Okun,Arthur.1975.EqualityandEfficiency:TheBigTradeoff,WashingtonDC:The Brookings Institution.
Perry,Mark.October22,2011.“IncomeInequalityExplainedbyDemographics” Retrievedfromhttp://mjperry.blogspot.com/2010_10_17_archive.html
Piketty,ThomasandSaez,Emmanuel.2007.“HowProgressiveistheU.S.FederalTax System?AHistoryandInternationalPerspective,”Journal of Economic Perspectives,21(1),Winter,pp.3-24.
Plattner,Marc.1979.“TheWelfareStatevs.theRedistributiveState,”The Public Interest,Spring,No.55.
Rajan,RaghuramandZingales,Luigi.2003.SavingCapitalismfromtheCapitalists. USA:CrownBusinessPress.
Saez,Emmanuel.2013.“StrikingitRicher:TheEvolutionofTopIncomesintheUnited States(Updatedwith2011Estimates),”UniversityofCalifornia-Berkleyworking Paperpp.1-8,originallyinPathwayMagazine,Winter2008:pp.6-7,Stanford CenterfortheStudyofPovertyandInequality
TheEconomist.2012.“SpecialReport–WorldEconomy:ForRicher,ForPoorer,” October13,2012.
TheEconomist.2013.“SpecialReport:America’sCompetitiveness,”March16,2012.
UnitedStatesCensusBureau.2006.SelectedCharacteristicsofHouseholds,byTotal MoneyIncomein2005),WashingtonD.C.:U.S.DepartmentofCommerce.
United States Census Bureau. February 2012. Household Income Inequality Within U.S. counties:2006-2010,WashingtonD.C:U.S.DepartmentofCommerce.
Wessel,David.April19,2007.“LackofWell-EducatedWorkersHasLotsofRoots,No QuickFix,”WallStreetJournal,PageA2.
Zakaria,Fareed.June20,2012.“HowGovernmentFundingofScienceRewardsU.S. Taxpayers,”WashingtonPost.
Zingales,Luigi.2012.ACapitalismforthePeople:RecapturingtheLostGeniusof AmericanProsperity,NewYork:BasicBooks
24 CWERB Economic Indicators Report - Stevens Point
Notes:

MISSION AND VISION
ThemissionoftheUWSPCentralWisconsinEconomicResearchBureauistofostereconomicdevelopmentbybringingtimelyeconomicanalysistoourregion,focusingonMarathon,PortageandWoodcounties.
The mission has been accomplished through the publicationofEconomicIndicatorReports.ThesereportsarecompiledandreleasedforeachcountyinCentralWisconsin.
TheCWERBaspirestobeWisconsin’spremierresearchcenterfocusedonregionaleconomicdevelopment.
HISTORY
TheCWERBisanonprofitorganizationfoundedinOctober1983.ItsoperatingbudgetcomesfromtheprivatesectorandtheUWSPSchoolofBusinessandEconomics.TheCWERBalsorepresentsanimportantpartoftheoutreacheffortsoftheUWSPSchoolofBusinessandEconomics.
SOURCES OF FUNDING •UWSPSchoolofBusinessandEconomics•BMOHarrisBankofStevensPoint•BMOHarrisBankofMarshfield•BMOHarrisBankofWausau•CentergyInc.ofWausau•CommunityFoundationofGreater South Wood County - Wisconsin Rapids
SCHOOL OF BUSINESS & ECONOMICS •Enrollmentof1,000students;Morethan30%ofourstudentscomefromMarathon,PortageandWoodcounties;approximately50%ofourgraduatesstayinthethree-county area •TheSBEisinthepre-accreditationphasebytheAssociationtoAdvanceCollegiateSchoolsofBusiness(AACSB),oncecompleted,SBEwillbeamongthetop18%ofallbusinessschoolsintheworld.
CWERB CLIENTELE •CentralWisconsinbusinessfirmsarethemostcrucialcomponentintheeconomicdevelopmentofourregion.Businessfirmsarekeenlyawareoftheimportantrolethatinformeddecisionmakingplaysinanydevelopmentalstrategy.
•PrivatesectororganizationsdevotedtoeconomicdevelopmentinCentralWisconsin,suchasareachambersofcommerceandtheiraffiliatedeconomicdevelopmentagencies.
•Publicsectororganizationsdevotedtoeconomicdevelopment in Central Wisconsin.
•Thegeneralpublic,inordertomakeinformeddecisions,takeadvantageoftheunbiasedinformationandanalysisabout the economy.
•TheCWERBemploysstudentresearchassistantswhich provides an excellent educational setting while alsoprovidingtheopportunityforstudentstoearnfundstowardeducation.Faculty,staffandstudentsatUWSPutilizethereportsandresourcesoftheCWERB.
CWERB ACTIVITIES ThedisseminationoftheCWERBresearchtakesplacethroughvarioushardcopypublications,electronicmediareportsandpresentations.Forexample,theEconomicIndicatorReportsarepresentedinMarshfield,StevensPoint,WausauandWisconsinRapids.Theaudiencesconsistofbusiness,politicalandeducationalleaders.
The Economic Indicator Reports also contain a special report section that is devoted to a current issue in economics. These special reports are usually presentedbyUWSPfaculty.
Substantialnewspaper,radioandtelevisioncoverageofthe publications and presentations have been instrumental infocusingattentionontheSchoolofBusinessandEconomics.ChiefEconomistRandyCrayhasbeeninterviewed by the local media as well as the Chicago TribuneandCNNRadioonavarietyofeconomicmatters.
ABOUT THE CENTRAL WISCONSIN ECONOMIC RESEARCH BUREAU

26 CWERB Economic Indicators Report - Stevens Point
uwsp.edu/busecon/cwerbfacebook.com/UWSPsbetwitter.com/UWSPcwerb