q1-2010 results_240710
TRANSCRIPT

8/6/2019 Q1-2010 Results_240710
http://slidepdf.com/reader/full/q1-2010-results240710 1/51
United Bank of IndiaUnited Bank of IndiaFinancial ResultsFinancial Results
(Q1: 2010-11)(Q1: 2010-11)

8/6/2019 Q1-2010 Results_240710
http://slidepdf.com/reader/full/q1-2010-results240710 2/51
Performance HighlightsPerformance Highlights
During First Quarter of 2010-11During First Quarter of 2010-11
Operating Profit grew by 109.8% (y-o-y) at Rs 340.70 croreOperating Profit grew by 109.8% (y-o-y) at Rs 340.70 crore
Net profit grew by 53.5% (y-o-y) at Rs 107.86 croreNet profit grew by 53.5% (y-o-y) at Rs 107.86 crore
CASA Deposits grew by 26.7% (y-o-y) and reached 39.3% of TotalCASA Deposits grew by 26.7% (y-o-y) and reached 39.3% of Total
DepositsDeposits
Credit Deposit Ratio improved to 66.9% from 62.7% in March 2010Credit Deposit Ratio improved to 66.9% from 62.7% in March 2010

8/6/2019 Q1-2010 Results_240710
http://slidepdf.com/reader/full/q1-2010-results240710 3/51
Performance HighlightsPerformance Highlights
During First Quarter of 2010-11During First Quarter of 2010-11
Cost of Deposits reduced to 5.40% from 6.47% last year Cost of Deposits reduced to 5.40% from 6.47% last year
Yield on Advances has reduced to 9.75% from 10.05% last year, Yield on Advances has reduced to 9.75% from 10.05% last year,
however increased from 9.23% during Q4’10however increased from 9.23% during Q4’10
Net Interest Income has grown by 93.2% on y-o-y basisNet Interest Income has grown by 93.2% on y-o-y basis
Net Interest Margin improved to 2.98% from 1.90% last year Net Interest Margin improved to 2.98% from 1.90% last year
Return on Assets improved to 0.58% from 0.44% last year Return on Assets improved to 0.58% from 0.44% last year
CRAR improved from 12.80% in March’10 to 12.99% with Tier I CRAR aCRAR improved from 12.80% in March’10 to 12.99% with Tier I CRAR a
8.59%8.59%
Cost Income ratio reduced to 45.85% from 59.88 last year Cost Income ratio reduced to 45.85% from 59.88 last year

8/6/2019 Q1-2010 Results_240710
http://slidepdf.com/reader/full/q1-2010-results240710 4/51
Performance HighlightsPerformance Highlights
Total BusinessTotal Business
DepositsDeposits
AdvancesAdvances
CA SACA SA
Q1- 2010-11Q1- 2010-11
111317111317 12.012.09937299372
6669466694 11.611.65978359783
2624126241 26.726.72071420714
4462344623 12.712.73958939589
(Rs in Crore)(Rs in Crore)Q1- 2009-10Q1- 2009-10 GrowthGrowth
(Percent)(Percent)

8/6/2019 Q1-2010 Results_240710
http://slidepdf.com/reader/full/q1-2010-results240710 5/51
Operating ProfitOperating Profit
Net ProfitNet Profit
Q1-2010-11Q1-2010-11
340.70340.70 109.8109.8162.43162.43
107.86107.86 53.553.570.2870.28
(Rs in Crore)(Rs in Crore)
Interest IncomeInterest Income 1437.231437.23 20.820.81189.701189.70
Interest ExpensesInterest Expenses 928.66928.66926.41926.41
Q1-2009-10Q1-2009-10 GrowthGrowth
(Percent)(Percent)
Performance HighlightsPerformance Highlights
0.20.2
Net Interest Inc.Net Interest Inc. 263.29263.29 508.57508.57 93.293.2

8/6/2019 Q1-2010 Results_240710
http://slidepdf.com/reader/full/q1-2010-results240710 6/51
Performance HighlightsPerformance Highlights
(Efficiency Ratios)(Efficiency Ratios)
ROA (A)ROA (A)
ROE (A)ROE (A)
NIM (A)NIM (A)
CRARCRAR
Q1- 2010-11Q1- 2010-11
Cost-Income RatioCost-Income Ratio
Q1-2009-10Q1-2009-10
13.1813.18
0.440.44
10.7810.78
1.901.90
59.8859.88
12.9912.99
0.580.58
14.4114.41
2.982.98
45.8545.85
(Percent)(Percent)
Tier-I CRARTier-I CRAR 7.307.30 8.598.59

8/6/2019 Q1-2010 Results_240710
http://slidepdf.com/reader/full/q1-2010-results240710 7/51
61112
71967
111317
99372
40000
60000
80000
100000
120000
June'07 June'08 June'09 Jun'10
Total BusinessTotal Business
Incredible Growth: Aiming for the SkyIncredible Growth: Aiming for the Sky
(Rs
inC
rore)
(Rs
inC
rore)

8/6/2019 Q1-2010 Results_240710
http://slidepdf.com/reader/full/q1-2010-results240710 8/51
BranchesBranches

8/6/2019 Q1-2010 Results_240710
http://slidepdf.com/reader/full/q1-2010-results240710 9/51
100% CBS100% CBSNetwork of Network of
1558 Branches1558 Branches
As on 30.06.2010As on 30.06.2010
Pan-India PresencePan-India Presence
Presence in 28 States & 4 UTsPresence in 28 States & 4 UTs

8/6/2019 Q1-2010 Results_240710
http://slidepdf.com/reader/full/q1-2010-results240710 10/51
Population group wise Branch DistributionPopulation group wise Branch Distribution
(As on 30.06.2010)(As on 30.06.2010)
Semi-
urban, 287,
18%
Urban, 345,22%
Metro, 294,
19%
Rural, 629,
41%
• 106 New Branches opened during last one year 106 New Branches opened during last one year
• 24 New Branches opened during Q1 : 2010-1124 New Branches opened during Q1 : 2010-11
15581558
BranchesBranches

8/6/2019 Q1-2010 Results_240710
http://slidepdf.com/reader/full/q1-2010-results240710 11/51
East, 1003,
64%
Southern, 61,
4%
Northern, 75,
5%
Western, 61,
4%
Central, 96,6%
North East,
262, 17%
Regional distribution of BranchesRegional distribution of Branches
(1558 Branches as on 30.6.2010)(1558 Branches as on 30.6.2010)
Figures: Region / Number / Percentage PresenceFigures: Region / Number / Percentage Presence

8/6/2019 Q1-2010 Results_240710
http://slidepdf.com/reader/full/q1-2010-results240710 12/51
DepositsDeposits
8/6/2019 Q1-2010 Results_240710
http://slidepdf.com/reader/full/q1-2010-results240710 13/51
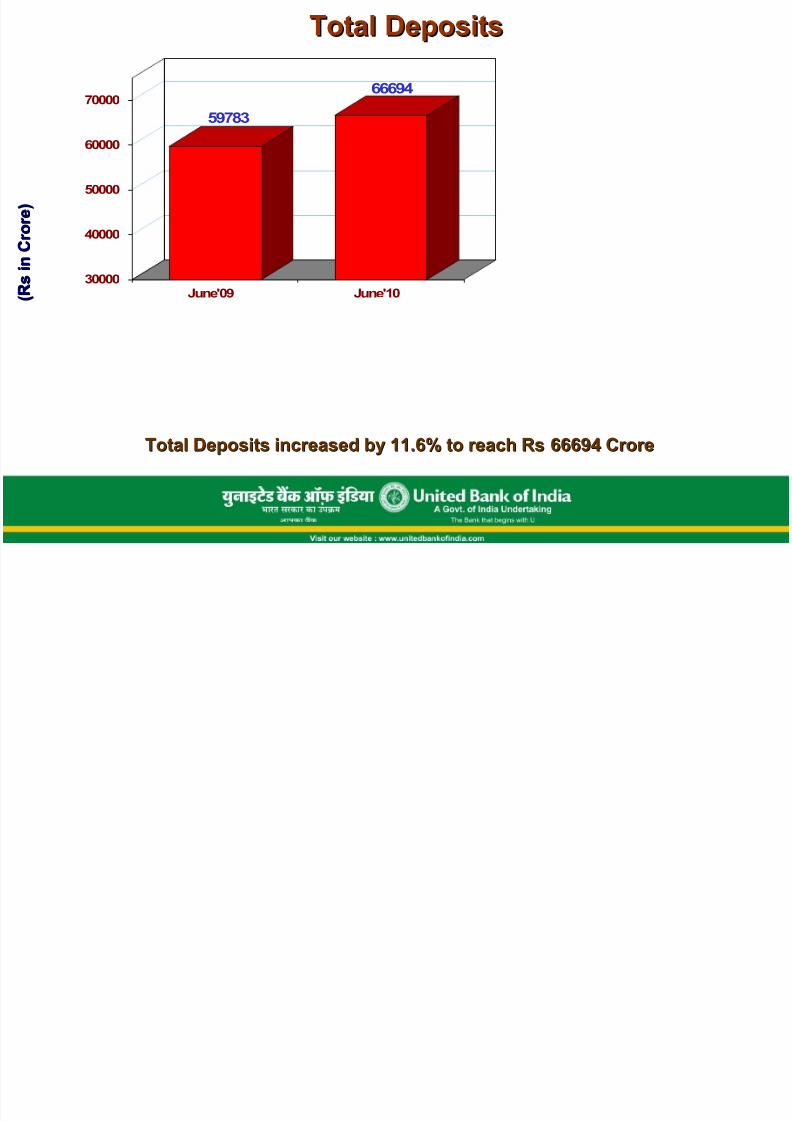
Total DepositsTotal Deposits
(Rs
inC
rore)
(Rs
inC
rore)
Total Deposits increased by 11.6% to reach Rs 66694 CroreTotal Deposits increased by 11.6% to reach Rs 66694 Crore
59783
66694
30000
40000
50000
60000
70000
June'09 June'10
C SCASA D it

8/6/2019 Q1-2010 Results_240710
http://slidepdf.com/reader/full/q1-2010-results240710 14/51
CASA DepositsCASA Deposits
15746
4968
20748
5493
5000
10000
15000
20000
25000
30000
June'09 June'10
Savings Current
(RsinCrore)
(RsinCrore)
34.6
39.3
32
34
36
38
40
June'09 June'10
Share of CASA
SB deposits grew by 31.8% to reach Rs 20748 Crore while Current DepositsSB deposits grew by 31.8% to reach Rs 20748 Crore while Current Deposits
Increased by 10.6% to reach Rs 5493 CroreIncreased by 10.6% to reach Rs 5493 Crore
2624126241
2071420714
D it MiD it Mi

8/6/2019 Q1-2010 Results_240710
http://slidepdf.com/reader/full/q1-2010-results240710 15/51
Deposit MixDeposit Mix
CASA as percentage of Total Deposits stood at 39.3% as on 30.06.10CASA as percentage of Total Deposits stood at 39.3% as on 30.06.10
TermTerm(60.7%)(60.7%)
SavingsSavings(31.1%)(31.1%)
CurrentCurrent(8.2%)(8.2%)
TermTerm(65.4%)(65.4%)
SavingsSavings(26.3%)(26.3%)
CurrentCurrent(8.3%)(8.3%)
As on June 30, 2009As on June 30, 2009 As on June 30, 2010As on June 30, 2010
C t f D itC t f D it

8/6/2019 Q1-2010 Results_240710
http://slidepdf.com/reader/full/q1-2010-results240710 16/51
6.47
5.92
5.40
4
5
6
7
June'09 Mar'10 June'10
Cost of DepositsCost of Deposits
Cost of Deposits reduced from 6.47% to 5.40% during last one year Cost of Deposits reduced from 6.47% to 5.40% during last one year
(Percen
t)
(Percen
t)

8/6/2019 Q1-2010 Results_240710
http://slidepdf.com/reader/full/q1-2010-results240710 17/51
AdvancesAdvances
T t l AdT t l Ad

8/6/2019 Q1-2010 Results_240710
http://slidepdf.com/reader/full/q1-2010-results240710 18/51
Total AdvancesTotal Advances
Total Advances increased by 12.7% to reach Rs 44623 CroreTotal Advances increased by 12.7% to reach Rs 44623 Crore
(Rs
inC
rore)
(Rs
inC
rore)
39589
44623
25000
35000
45000
June'09 June'10
T t l Ad B kTotal Ad ances Break p

8/6/2019 Q1-2010 Results_240710
http://slidepdf.com/reader/full/q1-2010-results240710 19/51
Total Advances: BreakupTotal Advances: Breakup
Scheme June’09 June’10 Growth(%)
Total Advances 39589 44623 12.7
Of which
Retail Advances 4403 6044 37.3
Priority Sector Advances 11915 14400 20.9MSME Advances 4161 6668 60.2
Agriculture 4151 4700 13.2
(Rs in Crore)(Rs in Crore)
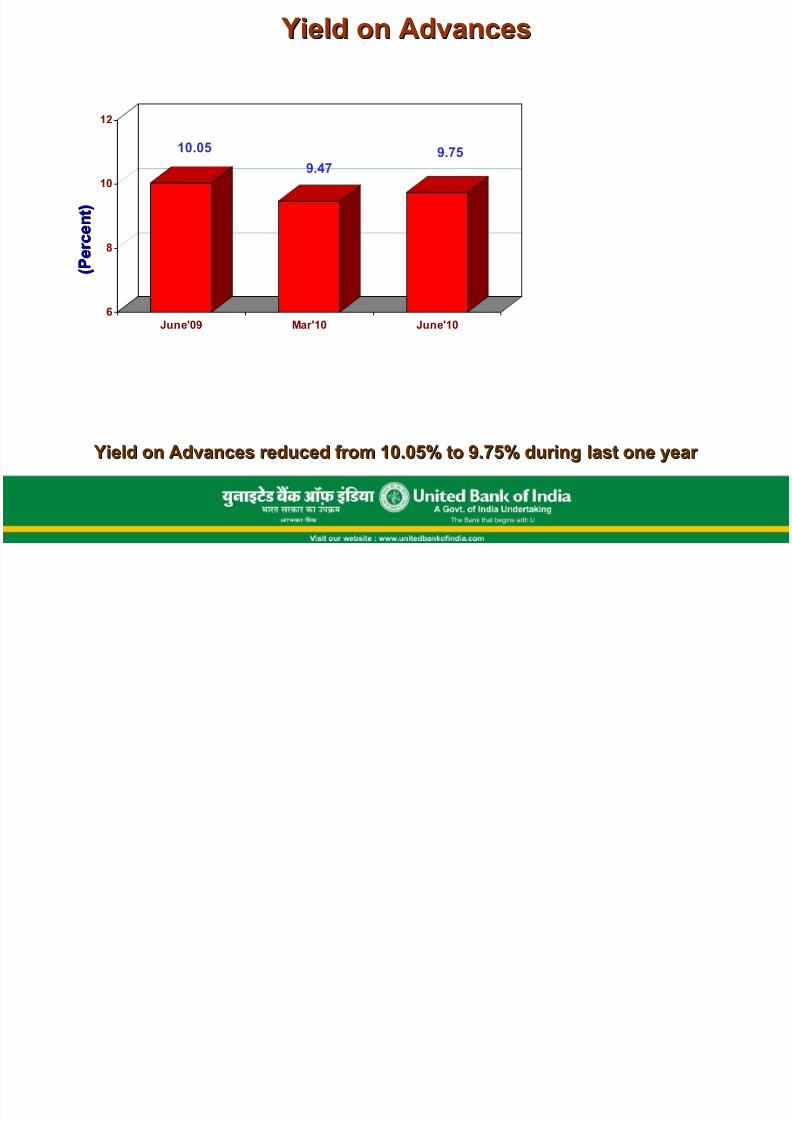
Yield on AdvancesYield on Advances
8/6/2019 Q1-2010 Results_240710
http://slidepdf.com/reader/full/q1-2010-results240710 20/51
10.05
9.479.75
6
8
10
12
June'09 Mar'10 June'10
Yield on Advances Yield on Advances
Yield on Advances reduced from 10.05% to 9.75% during last one year Yield on Advances reduced from 10.05% to 9.75% during last one year
(Percen
t)
(Percen
t)
Retail AdvancesRetail Advances

8/6/2019 Q1-2010 Results_240710
http://slidepdf.com/reader/full/q1-2010-results240710 21/51
Retail AdvancesRetail Advances
Retail Advances registered a growth of 37.3% to reach Rs 6044 CroreRetail Advances registered a growth of 37.3% to reach Rs 6044 Crore
4 4 0
6 0 4
3 5 0 0
4 5 0 0
5 5 0 0
6 5 0 0
J u n e '0 9 J u n e '1 0
(RsinCrore)
(RsinCrore)
Retail Advances: BreakupRetail Advances: Breakup

8/6/2019 Q1-2010 Results_240710
http://slidepdf.com/reader/full/q1-2010-results240710 22/51
Retail Advances: BreakupRetail Advances: Breakup
Retail Scheme June’09 June’10 Growth(%)
Housing Loan 1668 2123 27.3Auto Loan 206 266 29.1
Education Loan 348 410 17.8
Mortgage Loan 674 871 29.2
Others 1507 2374 57.5
TOTAL 4403 6044 37.3
(Rs in Crore)(Rs in Crore)
MSME AdvancesMSME Advances

8/6/2019 Q1-2010 Results_240710
http://slidepdf.com/reader/full/q1-2010-results240710 23/51
MSME AdvancesMSME Advances
MSME Advances witnessed a growth of over 60% to reach Rs 6668 CroreMSME Advances witnessed a growth of over 60% to reach Rs 6668 Crore
(R
sinC
rore)
(R
sinC
rore)
4161
6668
2000
3000
4000
5000
6000
7000
June'09 June'10
Advances to Priority SectorAdvances to Priority Sector

8/6/2019 Q1-2010 Results_240710
http://slidepdf.com/reader/full/q1-2010-results240710 24/51
Advances to Priority Sector Advances to Priority Sector
4151
7764
4700
9700
2000
4000
6000
8000
10000
12000
14000
16000
June'09 June'10
Agriculture
(RsinC
rore)
(RsinC
rore)
14400
Total Priority sector advances registered a growth of 20.9% to reach Rs 14400 CroreTotal Priority sector advances registered a growth of 20.9% to reach Rs 14400 Crore
whereas Agriculture Advances grew by 13.2% to reach Rs 4700 Crore.whereas Agriculture Advances grew by 13.2% to reach Rs 4700 Crore.
11915

8/6/2019 Q1-2010 Results_240710
http://slidepdf.com/reader/full/q1-2010-results240710 25/51
InvestmentsInvestments
Total InvestmentsTotal Investments
8/6/2019 Q1-2010 Results_240710
http://slidepdf.com/reader/full/q1-2010-results240710 26/51
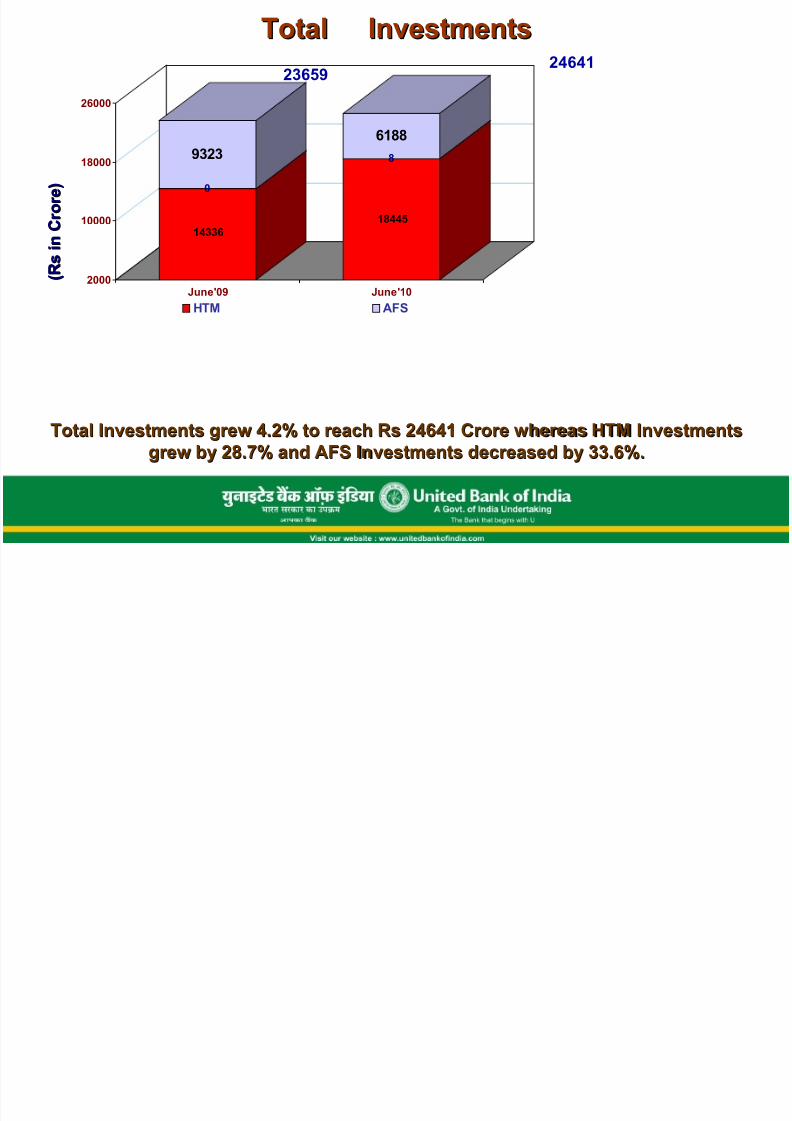
Total InvestmentsTotal Investments
14336
0
9323
18445
8
6188
2000
10000
18000
26000
June'09 June'10
HTM AFS
(RsinC
rore)
(RsinC
rore)
24641
Total Investments grew 4.2% to reach Rs 24641 Crore whereas HTM InvestmentsTotal Investments grew 4.2% to reach Rs 24641 Crore whereas HTM Investments
grew by 28.7% and AFS Investments decreased by 33.6%.grew by 28.7% and AFS Investments decreased by 33.6%.
23659
Yield on InvestmentsYield on Investments

8/6/2019 Q1-2010 Results_240710
http://slidepdf.com/reader/full/q1-2010-results240710 27/51
Yield on Investments Yield on Investments
7.37
7.85
6
7
8
June'09 June'10
Total
Yield on Investments increased from 7.37% to 7.85% during last one year Yield on Investments increased from 7.37% to 7.85% during last one year
(Percen
tage)
(Percen
tage)

8/6/2019 Q1-2010 Results_240710
http://slidepdf.com/reader/full/q1-2010-results240710 28/51
Non Performing AssetsNon Performing Assets
Non Performing AssetsNon Performing Assets

8/6/2019 Q1-2010 Results_240710
http://slidepdf.com/reader/full/q1-2010-results240710 29/51
Non Performing AssetsNon Performing Assets
2.54
1.70
3.21
1.84
3.19
1.80
0
1
2
3
4
June'09 Mar'10 June'10
Gross NPA Net NPA
(Percen
t)
(Percen
t)
Gross NPA Ratio decreased to 3.19% while Net NPA Ratio decreased to 1.80%.Gross NPA Ratio decreased to 3.19% while Net NPA Ratio decreased to 1.80%.The NPA Provision Coverage Ratio is pegged at 68.5%The NPA Provision Coverage Ratio is pegged at 68.5%
Movement of NPAMovement of NPA

8/6/2019 Q1-2010 Results_240710
http://slidepdf.com/reader/full/q1-2010-results240710 30/51
Movement of NPAMovement of NPA
Q1:2009-10 Q1:2010-11
Opening NPA 1020 1372
Reduction 135 198
Cash Recovery 52 52
Up-gradation 56 83
Write-off 27 63
Slippages 121 248
Closing NPA 1006 1422
(Rs in Crore)(Rs in Crore)

8/6/2019 Q1-2010 Results_240710
http://slidepdf.com/reader/full/q1-2010-results240710 31/51

8/6/2019 Q1-2010 Results_240710
http://slidepdf.com/reader/full/q1-2010-results240710 32/51
Profit & Loss AccountProfit & Loss Account(INCOME)(INCOME)
For 1st Quarter 2009-10
For 1st Quarter 2010-11
Growth %
Interest Income 1189.70 1437.23 20.8
Treasury Income 61.20 31.75 -48.1Other Income 80.31 88.85 10.6
Total Income 1331.21 1557.83 17.0
(Rs in Crore)(Rs in Crore)

8/6/2019 Q1-2010 Results_240710
http://slidepdf.com/reader/full/q1-2010-results240710 33/51
Profit & Loss AccountProfit & Loss Account(EXPENSES)(EXPENSES)
For 1st Quarter 2009-10
For 1st Quarter 2010-11
Growth %
Interest Expense 926.41 928.66 0.2
Staff Expense 152.66 178.97 17.2
Other Ops exp 89.71 109.51 22.1
Total Expenses 1168.78 1217.14 4.1
(Rs in Crore)(Rs in Crore)

8/6/2019 Q1-2010 Results_240710
http://slidepdf.com/reader/full/q1-2010-results240710 34/51
Profit & Loss AccountProfit & Loss Account(PROFIT)(PROFIT)
For 1st Quarter 2009-10
For 1st Quarter 2010-11
Growth %
Operating Profit 162.43 340.7 109.8
Prov & Cont 92.15 232.84 152.7Net Profit 70.28 107.86 53.5
(Rs in Crore)(Rs in Crore)
Net Interest IncomeNet Interest Income

8/6/2019 Q1-2010 Results_240710
http://slidepdf.com/reader/full/q1-2010-results240710 35/51
Net Interest Income increased by 93.2% to reach Rs 508.57 CroreNet Interest Income increased by 93.2% to reach Rs 508.57 Crore
263.29
508.57
100
300
500
Q1'10 Q1'11
(RsinCro
re)
(RsinCro
re)
Non-Interest IncomeNon-Interest Income

8/6/2019 Q1-2010 Results_240710
http://slidepdf.com/reader/full/q1-2010-results240710 36/51
Non-interest income decreased by 14.8% to reach Rs 120.60 CroreNon-interest income decreased by 14.8% to reach Rs 120.60 Crore
141.51
120.60
0
100
200
Q1'10 Q1'11
(RsinCro
re)
(RsinCro
re)
B k f N I t t IB k f N I t t I

8/6/2019 Q1-2010 Results_240710
http://slidepdf.com/reader/full/q1-2010-results240710 37/51
Breakup of Non Interest IncomeBreakup of Non Interest Income(CORE INCOME)(CORE INCOME)
80.3188.85
0
50
100
Q1'10 Q1'11
Core Non Interest Income increased by 10.6%Core Non Interest Income increased by 10.6%
(RsinC
rore)
(RsinC
rore)
Breakup of Non Interest IncomeBreakup of Non Interest Income(INCOME FROM TREASURY)(INCOME FROM TREASURY)

8/6/2019 Q1-2010 Results_240710
http://slidepdf.com/reader/full/q1-2010-results240710 38/51
(INCOME FROM TREASURY)(INCOME FROM TREASURY)
61.20
31.75
0.00
25.00
50.00
75.00
Q1'10 Q1'11
Non Interest Income from Treasury decreased by 48.1%Non Interest Income from Treasury decreased by 48.1%
(R
sinCrore)
(R
sinCrore)
Operating ProfitOperating Profit

8/6/2019 Q1-2010 Results_240710
http://slidepdf.com/reader/full/q1-2010-results240710 39/51
Operating Profit for Q1’11 increased by 109.8% to Rs 340.70 CroreOperating Profit for Q1’11 increased by 109.8% to Rs 340.70 Crore
162.43
340.70
0
200
400
Q1'10 Q1'11
(RsinCro
re)
(RsinCro
re)
Net ProfitNet Profit

8/6/2019 Q1-2010 Results_240710
http://slidepdf.com/reader/full/q1-2010-results240710 40/51
Net Profit of the Bank for the 1Net Profit of the Bank for the 1stst Quarter increased by 53.5% to Rs 107.86 CroreQuarter increased by 53.5% to Rs 107.86 Crore
70.28
107.86
0
100
Q1'10 Q1'11
(RsinCro
re)
(RsinCro
re)

8/6/2019 Q1-2010 Results_240710
http://slidepdf.com/reader/full/q1-2010-results240710 41/51
Key RatiosKey Ratios
Capital Adequacy Ratio (Basel-II)Capital Adequacy Ratio (Basel-II)

8/6/2019 Q1-2010 Results_240710
http://slidepdf.com/reader/full/q1-2010-results240710 42/51
13.18 12.99
0
5
10
15
June'09 June'10
p q y ( )p q y ( )
(Percent)
(Percent)
CRAR of the Bank as on June 30, 2010 was at 12.99% as per Basel-II normsCRAR of the Bank as on June 30, 2010 was at 12.99% as per Basel-II norms
Capital Adequacy RatioCapital Adequacy Ratio

8/6/2019 Q1-2010 Results_240710
http://slidepdf.com/reader/full/q1-2010-results240710 43/51
7.30
8.59
6.00June'09 June'10
Capital Adequacy RatioCapital Adequacy Ratio(TIER-I)(TIER-I)
(Percent)
(Percent)
Tier-I CRAR as per Basel-II in June’09 increased to 8.59% from 7.30% in June’10Tier-I CRAR as per Basel-II in June’09 increased to 8.59% from 7.30% in June’10
Cost Income RatioCost Income Ratio

8/6/2019 Q1-2010 Results_240710
http://slidepdf.com/reader/full/q1-2010-results240710 44/51
59.8855.08
45.85
20
45
70
June'09 Mar'10 June'10
Cost Income Ratio reduced from 55.08% to 45.85%Cost Income Ratio reduced from 55.08% to 45.85%
(Percent)
(Percent)
Employee ProductivityEmployee Productivity

8/6/2019 Q1-2010 Results_240710
http://slidepdf.com/reader/full/q1-2010-results240710 45/51
6.48
1.87
7.15
2.81
0
1
2
3
4
5
6
7
8
June'09 June'10
Business per Employee (Rs in Crore) Profit Per Employee (Rs in Lakh) (A)
Business per Employee grew by 10.3% to reach Rs 7.15 Crore per Employee while theBusiness per Employee grew by 10.3% to reach Rs 7.15 Crore per Employee while the
Profit per Employee increased by 50.3% to reach Rs 2.81 Lakh per EmployeeProfit per Employee increased by 50.3% to reach Rs 2.81 Lakh per Employee

8/6/2019 Q1-2010 Results_240710
http://slidepdf.com/reader/full/q1-2010-results240710 46/51
Other ParametersOther Parameters
Market InformationMarket Information

8/6/2019 Q1-2010 Results_240710
http://slidepdf.com/reader/full/q1-2010-results240710 47/51
ParticularsParticulars 30-June-1030-June-10
Book Value per shareBook Value per share Rs 94.59Market CapMarket Cap Rs 2571 Cr
EPS (A)EPS (A) Rs 13.64
Price/Book ValuePrice/Book Value 0.86
P/EP/E 5.95
ROA (A)ROA (A) 0.58
ROE (A)ROE (A) 14.41
Corporate Social ResponsibilityCorporate Social Responsibility

8/6/2019 Q1-2010 Results_240710
http://slidepdf.com/reader/full/q1-2010-results240710 48/51
• Bank has set-up United Bank Socio-Economic DevelopmentBank has set-up United Bank Socio-Economic Development
Foundation (UBSEDF) Trust with a corpus of Rs 2 Crore withFoundation (UBSEDF) Trust with a corpus of Rs 2 Crore with
an objective of improving the standard of living of thean objective of improving the standard of living of the
weaker section of the society.weaker section of the society.
• As on June 30, 2010, Bank had 6 Rural Development & Self As on June 30, 2010, Bank had 6 Rural Development & Self
Employment Training Institutes (RUDSETI) to impart skillEmployment Training Institutes (RUDSETI) to impart skill
and entrepreneurship development training to unemployedand entrepreneurship development training to unemployedyouth, women and people belonging to weaker sections of youth, women and people belonging to weaker sections of
the society.the society.
• Bank also provides loans to the entrepreneurs trained atBank also provides loans to the entrepreneurs trained at
RUDSETIs for setting up their units.RUDSETIs for setting up their units.
Highlights of AchievementsHighlights of Achievements• The Final Dividend at the rate of Rs 2/ per equity share of

8/6/2019 Q1-2010 Results_240710
http://slidepdf.com/reader/full/q1-2010-results240710 49/51
• The Final Dividend at the rate of Rs.2/- per equity share of
Face Value of Rs.10/- each was declared by the Bank at its
maiden Annual General Meeting on July 9th, 2010.
• Handed over to the Hon’ble Union Finance Minister, Sri
Pranab Mukherjee, a cheque of Rs. 53.29 crore, on 21.7.10,
being the Final Dividend for 2009-10 on the GOI
shareholding in the Bank.
• A separate cheque of Rs.15 crore, as preference dividend,
for FY 09-10, was also handed over to Finance Minister for
Preference Shares (PNCPS) held in the Bank by the
Government of India.

8/6/2019 Q1-2010 Results_240710
http://slidepdf.com/reader/full/q1-2010-results240710 50/51

8/6/2019 Q1-2010 Results_240710
http://slidepdf.com/reader/full/q1-2010-results240710 51/51
Thank YouThank You