q-series® equity strategy why do family-controlled … · why do family-controlled public...
TRANSCRIPT

www.ubs.com/investmentresearch
This report has been prepared by UBS Limited. ANALYST CERTIFICATION AND REQUIRED DISCLOSURES BEGIN ON PAGE 38. UBS does and seeks to do business with companies covered in its research reports. As a result, investors should be aware that the firm may have a conflict of interest that could affect the objectivity of this report. Investors should consider this report as only a single factor in making their investment decision.
Global Research 13 April 2015
Q-Series® Why do Family-Controlled Public Companies Outperform? The Value of Disciplined Governance
Family-controlled publicly traded companies have consistently outperformed Markets seem to have under-priced both the growth and risk associated with public companies that have founding families as major shareholders. Our proprietary analysis suggests that family-owned small and midcaps have consistently outperformed their respective indices for the past decade – returning, for instance, 104% in the last five years, vs. 53% for largecaps and 69% for midcaps, with lower volatility.
Disciplined governance is king and queen Floated family-owned businesses have, by and large, passed the perils of the initial founding phase. Evidence shows that companies at this point in their life-cycle usually combine the benefits of funding via capital markets with a focus on core business, less value-destructive M&A, and more effective general governance. The positives of family 'skin in the game' have historically outweighed any potential negatives, and this outperformance window tends to stay open as long as the family ownership persists.
We designed a proprietary framework to assess governance and risks Based on governance areas that we believe drive outperformance (such as transparency, board succession, shareholder rights and remuneration), our analysts ranked close to 250 family-owned small and midcap companies globally to identify those with the best corporate governance. This global balanced index of 250 family-owned stocks has outperformed a global midcap index over 1, 3, 5 and 10 years.
Our list of the 20 best global stocks that fit this theme Our analysis identified 20 stocks in the US, Europe, Asia and LatAm that fit this theme. In the US, our top picks include Fortinet and Installed Building Products; in Europe, Eurazeo, Ebro Foods and GBL; in Asia, Top Glove and RiseSun Real Estate Development; in Japan, Daiichikosho, Seria and CyberAgent; and in LatAm, Fibra Danhos and Iochpe-Maxion. Please see page 5 for a full list.
Figure 1: Our in-house analysis indicates the outperformance of listed firms with a family stake for the past decade
Source: UBS
050
100150200250300350400450500
Feb
-05
Feb
-06
Feb
-07
Feb
-08
Feb
-09
Feb
-10
Feb
-11
Feb
-12
Feb
-13
Feb
-14
Feb
-15
UBS Family-owned Index Global Midcap
Equity Strategy
Global
Hubert Jeaneau, CFA Analyst
[email protected] +44-20-7568 3496
Bosco Ojeda Analyst
[email protected] +34-91-436 9078
Mariko Watanabe Analyst
[email protected] +81-3-5208 6297
Martin Byers Analyst
[email protected] +61-2-9324 3174
Julie Hudson, CFA Analyst
[email protected] +44-20-7568 4632

Q-Series® 13 April 2015
2
Why read this report? We believe the market is likely mispricing the growth and risk associated with public companies that have founding families as major shareholders. In this note, we analyse the factors behind family firms' outperformance and identify specific investment opportunities.
We believe floated family firms have generally passed the risks of the initial founding phase and have the advantage of stable shareholders with long-term value-creation strategies. Since there are specific risks involved in investing with family firms, we developed a proprietary framework to help investors assess the governance of such companies. We identify investment opportunities by combining our analysis of governance risks and UBS analyst views.
Four charts that tell the story
Figure 2: Our in-house analysis indicates the outperformance of family firms over the past decade…
Figure 3: …echoing the findings of the academic literature on the theme…
Source: MSCI ESG Research Inc., UBS Source: EDHEC Business School – Family firms and performance: Where do we
stand? (September 2014)
Figure 4: …and this outperformance does not seem to come at the expense of a higher risk profile
Figure 5: We designed a proprietary framework to rate the governance of family firms
Area of governance Specific aspect rated by UBS analysts
Transparency and access Communicating financial targets to investors
Willingness of senior management to meet investors
Board Quality, representation and risks to minorities' representation
Directors hold shares of the company
Succession Management independent from controlling family
Succession visibility
Capital allocation Sticking to core business
Returning excess cash to shareholders
Motivation of controlling group/management
Shareholders' rights One share, one vote
Absence of anti-takeover provisions
Track record on treatment of minorities
Remuneration targets Alignment with long-term shareholder value creation
Track record of sticking with targets
Source: UBS estimates Source: UBS
050
100150200250300350400450500
Feb
-05
Feb
-06
Feb
-07
Feb
-08
Feb
-09
Feb
-10
Feb
-11
Feb
-12
Feb
-13
Feb
-14
Feb
-15
UBS Family-owned Index Global Midcap
02468
10121416
Large familyshareholder
Large foundingshareholder
Family control Family firmswith controlenhancing
mechanisms
Number of studies exploring the relationship between profitability and family control
Positive effect Negative effect Not stat. significant
UBS Family-owned Index
Largecaps
Midcaps
Smallcaps
3.0%
6.0%
9.0%
12.0%
15.0%
18.0%
15.0% 16.0% 17.0% 18.0% 19.0%
An
nu
ali
sed
Retu
rns
Annualised Risk
Q-Series® 13 April 2015
3
Contents
Why read this report? ...................................................................... 2
Four charts that tell the story ....................................................................... 2
Executive summary .......................................................................... 4
Family-owned midcaps – top picks by region ............................................... 5
Keep it in the family ........................................................................ 6
The academic literature weighs in favour of family businesses ..................... 6
Our in-house analysis suggests family-owned midcaps outperform .............. 8
What about risk? ....................................................................................... 10
What about the fundamentals? ................................................................. 12
Valuations – a family discount? .................................................................. 14
Best-governed family-owned midcaps ......................................... 16
Combining value and governance scoring provides good ideas 20
Europe ....................................................................................................... 20
Asia ex-Japan ............................................................................................. 22
Japan ......................................................................................................... 24
Latin America............................................................................................. 26
US ............................................................................................................. 27
Appendix ........................................................................................ 29
We would like to thank Rajiv Daga and Divya Pathak, employees of the Cognizant group, for their assistance in preparing this research report. Cognizant staff provide research support services to UBS.
Hubert Jeaneau, CFA Analyst
[email protected] +44-20-7568 3496
Bosco Ojeda Analyst
[email protected] +34-91-436 9078
Mariko Watanabe Analyst
[email protected] +81-3-5208 6297
Martin Byers Analyst
[email protected] +61-2-9324 3174
Julie Hudson, CFA Analyst
[email protected] +44-20-7568 4632

Q-Series® 13 April 2015
4
Executive summary
Our in-house analysis suggests that family-owned midcaps outperform large and midcaps indices globally (returning 104% in the past five years, against 53% for largecaps and 69% for midcaps) and with lower volatility.
Family firms seem to earn a higher return on capital (at 17%, i.e. around 60% higher than largecaps and midcaps globally). They also display a superior earnings growth profile, growing earnings by more than 10% per year on average over the past five years. Family firms do not look cheap: they come at a 30% premium to large and midcaps, but we believe that premium is deserved given their superior earnings growth profile.
Most academic studies also find a positive link between family firms and profitability. Family firms tend to engage in less value-destructive R&D, hold less debt and focus on their core business.
While there are risks for minority shareholders, we believe governance tends to be effective at family firms, as the family has 'skin in the game'. We designed a governance framework to address the specific risks of family businesses, and ranked around 250 family-owned midcaps globally.
In each region, we identify family-owned top picks, combining our assessment of governance with UBS analysts' views (please see overleaf).
We focus on listed firms with a substantial family stake. Such firms have survived the riskier founding phase and benefit from long-term-oriented, stable shareholders.
Figure 6: Life-cycle of a family business; we do not focus on the founding stage
Source: UBS
Stage 1- Initial founding phase High risk, low survival rate
Stage 2 - Sweet spot? Floated family firms Long-term value-creation strategies and stable shareholdings
Stage 3 Progressive exit of the family Or in some cases stable family ownership
RETURNS
Q-Series® 13 April 2015
5
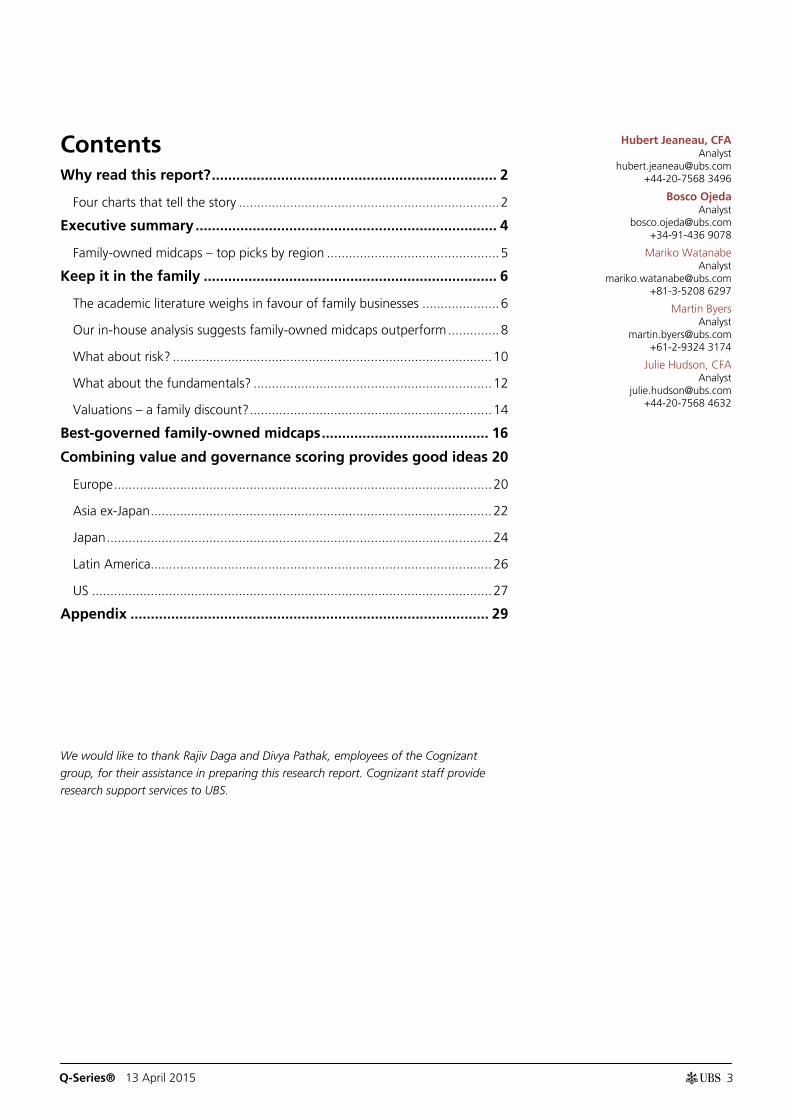
Family-owned midcaps – top picks by region Our family-owned top picks are based on a combination of UBS analysts' fundamental views and an analysis of companies' governance practices.
Figure 7: Our family-owned top picks
Company Stock price
(l.c)
UBS PT
(l.c)
UBS
rating
Market cap
(USD m)
Net
debt/
EBITDA
2015E
Stock
perf.
(12 m)
Stock
perf.
(YTD)
Adj. P/E
2015E
EV/
EBITDA
2015E
Div.
yield
2015E
Region Country Analyst name
Baoxin Auto 4.6 7.5 Buy 1517.83 -1.6 -21.6 8.3 6.8 4.9 0.0 Asia ex-
Japan China Ming Xu
China Life
Insurance
(Taiwan)
28.6 32.6 Buy 2750.46 - 13.6 8.7 13.1 - 1.5 Asia ex-
Japan Taiwan Kelvin Chu, CFA
RiseSun
Real Estate
Development
22.72 20.5 Buy 6873.28 -1.8 80.3 45.4 8.9 7.9 1.5 Asia ex-
Japan China Xiao Ding
Top Glove 5.46 5.9 Buy 931.29 0.2 11.7 20.8 16.3 8.9 3.2 Asia ex-
Japan Malaysia Nicole Goh
UOL Group 7.81 7.7 Buy 4538.42 -6.6 23.6 11.2 14.9 25.5 1.9 Asia ex-
Japan Singapore Michael Lim
Land &
Houses 9.8 12.2 Buy 3306.47 -3.7 -2.5 7.7 14.4 14.5 5.6
Asia ex-
Japan Thailand
Thomas Philippson,
CA
Zumtobel
Group AG 23.635 28.0 Buy 1108.21 -0.9 38.8 26.1 19.7 9.2 2.4 Europe Austria Sven Weier
Groupe
Bruxelles
Lambert SA
78.93 84.0 Buy 13728.15 - 6.1 12.1 - - 3.7 Europe Belgium Denis Moreau
Eurazeo 67.02 72.0 Buy 4951.15 - 10.9 16.8 - - 1.8 Europe France Denis Moreau
Ebro Foods 17.81 17.0 Buy 2953.90 -1.2 10.6 31.6 17.4 10.0 3.9 Europe Spain Bosco Ojeda
Ratos 61.1 65.0 Buy 2377.31 - -2.1 31.6 - - 7.4 Europe Sweden David Hallden
SFS Group AG 71.05 78.0 Buy 2763.01 0.3 - -9.0 18.6 9.9 2.1 Europe Switzer-
land
Andre Rudolf von
Rohr
CyberAgent 7090 8000.0 Buy 3738.86 0.8 89.5 51.3 24.1 11.1 0.6 Japan Japan Sumito Takeda
Daiichikosho 4000 4400.0 Buy 1942.85 -1.0 34.0 24.4 18.6 7.1 2.6 Japan Japan Mariko Watanabe
Hikari Tsushin 8360 10500.0 Buy 3191.05 2.9 6.3 17.0 18.6 4.5 2.0 Japan Japan Mariko Watanabe
Seria 4360 5000.0 Buy 1364.03 0.8 12.5 6.9 24.7 12.1 0.7 Japan Japan Mariko Watanabe
Iochpe-
Maxion 11.5 15.0 Buy 357.69 -3.2 -47.4 -5.7 14.0 5.2 2.7
US &
Latam Brazil Rodrigo Fernandes
Fibra Danhos 36.49 42.0 Buy 3564.02 2.3 38.2 0.4 24.5 31.2 5.3 US &
Latam Mexico
Marimar
Torreblanca, CFA
Fortinet Inc. 34.49 37.0 Buy 5705.99 4.0 48.0 12.5 66.5 30.5 0.0 US &
Latam
United
States Brent Thill
Installed
Building
Products
22.74 21.0 Buy 501.05 -0.7 71.8 27.6 22.7 7.8 0.0 US &
Latam
United
States Susan Maklari
Source: UBS estimates. Price data as of 9th April 2015.

Q-Series® 13 April 2015
6
Keep it in the family Could family ownership help explain the performance of stocks? Is it an advantage or a disadvantage? What does the historical performance of family-owned companies tell us? We try to answer these questions in this report, and to flesh out investment ideas arising from our investigation. Clearly, family stakes can increase the risk of conflicts of interest that weigh against minority shareholders, but there are advantages, too, such as aligned incentives and the family acting like an owner with a long-term perspective and 'skin in the game'. Our analysis indicates that the advantages substantially outweigh the risks.
Our focus is on floated family-owned companies – a possible bias. Some readers may be surprised that family ownership could be perceived as a positive investment driver. In reality, our focus is solely on floated family-owned companies. Having already floated, most of these companies have passed through the riskiest phases of corporate survival, such as the initial phase of foundation, and have enough scale to compete.
We focus on small and midcap stocks. Our analysis focuses on small and midcap stocks (i.e. stocks with market cap below €5bn), for two reasons. Firstly, the number of largecap family-owned companies is small, and does not allow for a credible comparison with largecap indices. And secondly, our 15 October 2013 Q-Series® report Why do smallcaps outperform? (Bosco Ojeda), pointed to corporate governance as a key driver of performance, and – intuitively – family-owned smallcaps may offer many of the advantages that the best-governed smallcaps enjoy.
We define family businesses as companies where there is a substantial influence of the founder or the founding family. We define this influence as the 'family' having either more than 50% of the voting rights, or more than 20% of the voting rights combined with top management or board influence (in line with much of the academic literature).
The academic literature weighs in favour of family businesses From our review of the academic literature 1 , we find that large family shareholdings (which tend to be more common in the small and midcaps space) are correlated with higher levels of profitability and higher valuations. Moreover, family firms tend to share some common characteristics with respect to their attitude to debt, risk-taking and capital allocation:
Higher profitability: There is a growing body of literature on family ownership and performance. Most studies find a positive link between a family-owner (defined as having a substantial stake or being an insider, i.e. director or CEO) and a higher level of profitability2 (Figure 8).
1 Please see the Appendix for a full summary of key papers and findings from the academic literature. 2 Most often measured by return on assets.
Our analysis suggests potential conflicts of interest are outweighed by advantages of having 'skin in the game'
Our definition of family businesses
Most studies find a positive link between family firms and profitability
Q-Series® 13 April 2015
7
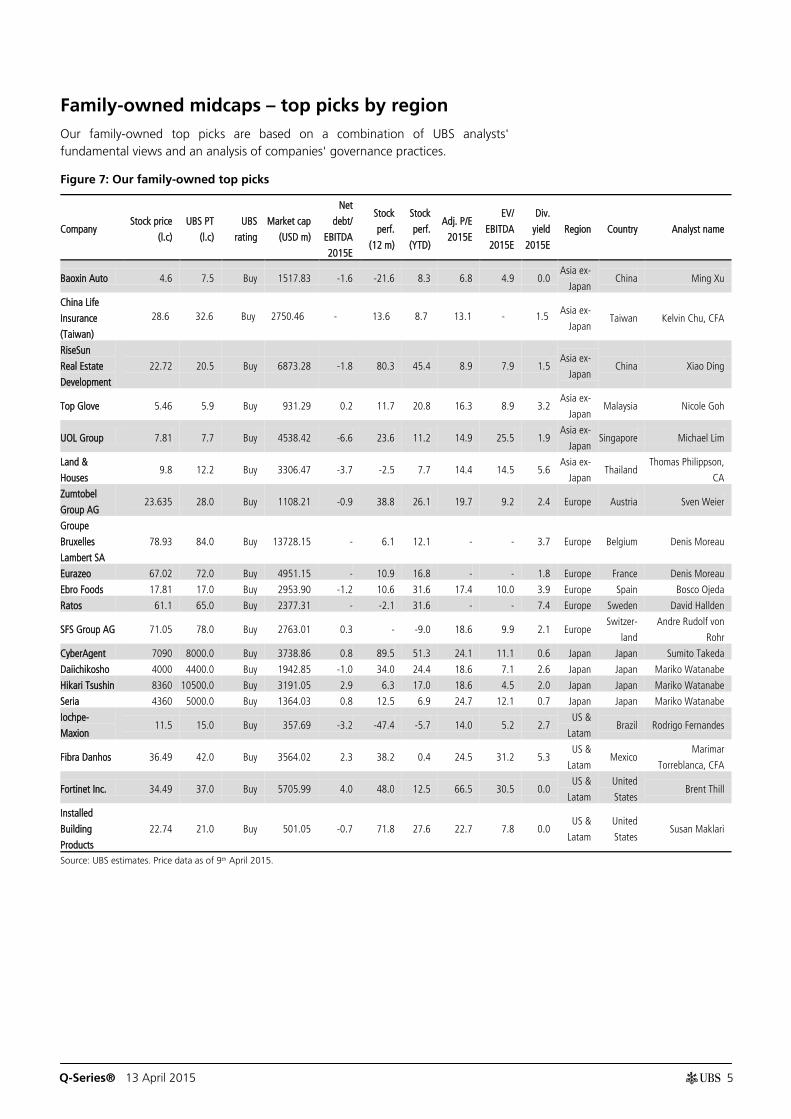
Taking risks in the areas they know well: On the one hand, family firms display greater risk aversion by holding less debt; on the other, they show a higher risk appetite by diversifying less and founders are especially likely to have high risk acceptance (e.g. engage more in R&D spending).
Disciplined capital allocation: Family firms engage in international ventures which have a solid operating rationale rather than the 'empire-building' strategies that may drive non-controlled companies. By being more selective in the first place, family firms subsequently have to take fewer divestment decisions.
Generation matters: Higher profitability tends to be associated with the first generation, and there is evidence of a founders' premium. A family firms 'discount' can be associated with the successor generation, especially when successors have management responsibilities and when there are multiple family members involved. However, floated companies might have surpassed this phase.
Transparency is important: The 'family premium' mostly applies to companies with high levels of transparency. Conversely, opaque companies trade at a discount, especially those firms with governance practices that may be questionable in other respects. Voting rights in excess of cash flow rights negatively affect valuations.
Family directorship seems associated with better governance, as measured by higher sensitivity of pay to performance, greater turnover pressure for CEOs and higher board attendance. More broadly, having a family as a large shareholder can be an effective governance set-up whether the owner is sitting on the board or not. This is effectively what Warren Buffett argues in his 1993 annual letter. Outside directors have little recourse against management in the case of dispersed ownership or of an owner/manager. Directors have a much greater ability to make a difference where there is a controlling owner not involved in management: "if they become unhappy with the competence or integrity of the manager, they can go directly to the owner (who may also be on the board) and report their dissatisfaction. This situation is ideal for an outside director.”
Figure 8: Family businesses seem to outperform their peers on profitability metrics
Source: EDHEC Business School – Family firms and performance: where do we stand? (September 2014)
0
2
4
6
8
10
12
14
16
Large family shareholder Large founding shareholder Family control Family firms with controlenhancing mechanisms
Studies exploring the relationship between profitability and family control
Positive effect
Negative effect
Not stat. significant
Targeted risk-taking
Less value-destructive M&A
Founders vs. successors
Transparency and equal voting rights are key to a family premium
Effective governance

Q-Series® 13 April 2015
8
Our in-house analysis suggests family-owned midcaps outperform The charts below show the results of our study of the stock performance of global family-owned small and midcaps. The data is based on a sample of c250 stocks covered by UBS analysts, which include the most relevant companies under our coverage where a family has a significant stake and board presence. Europe and Asia dominate the sample, while US and Latam stocks are less represented. For the US, for example, the sample size was so small relative to the market that it is considered to be of little statistical value. For that reason, we provide more details on the European and Asian results.
To some extent, the size of our sample (250 stocks) means it is not completely representative. For instance, if take our analysis in Europe, the MSCI European Midcaps Index comprises 235 stocks with a market cap of c€1,650bn, against our sample of c50 stocks with a total market cap of €165bn, or around 10% of the index. The average market cap in the MSCI Midcaps is €6bn, against €4bn for our sample. Our European sample has a strong weighting towards southern Europe (24% vs. 10% for the MSCI Midcaps) and very little in the UK (MSCI at 34%). Finally, our sample has a strong weighting towards consumer-related sectors (31%) and industrials (21%) when compared to the MSCI Midcaps (12% and 10%, respectively).
To avoid market cap distortions, we have created an equal-weight market cap index. Despite the limited sample, which can lead to some difficulties in comparing performance, the results speak for themselves, in our view. As we show below, family-owned companies globally have notably outperformed over the past five and 10 years. To avoid statistical distortions, we have excluded stocks which significantly skew the results, but including the outliers would have made the results even more conclusive.
Figure 9: Global family-owned midcaps have outperformed
Figure 10: UBS Global Family-owned Index vs. Datastream Global Midcap Index
Index Perf. 10y Perf. 5y Perf. 3y Perf. 1y
UBS Global Family-owned
Midcaps 345% 91% 42% 9%
Thomson Datastream Global
Largecap Index 46% 44% 31% 6%
Thomson Datastream Global
Midcap Index 72% 60% 37% 6%
Thomson Datastream Global
Smallcap Index 83% 65% 38% 1%
Source: Thomson Datastream, UBS estimates Source: Thomson Datastream, UBS estimates
0
50
100
150
200
250
300
350
400
450
500
Mar
-05
Mar
-06
Mar
-07
Mar
-08
Mar
-09
Mar
-10
Mar
-11
Mar
-12
Mar
-13
Mar
-14
Mar
-15
UBS Family-Owned Index Global LargecapGlobal Midcap Global Smallcap
Potential biases
A stark performance differential in favour of family-owned firms
Q-Series® 13 April 2015
9
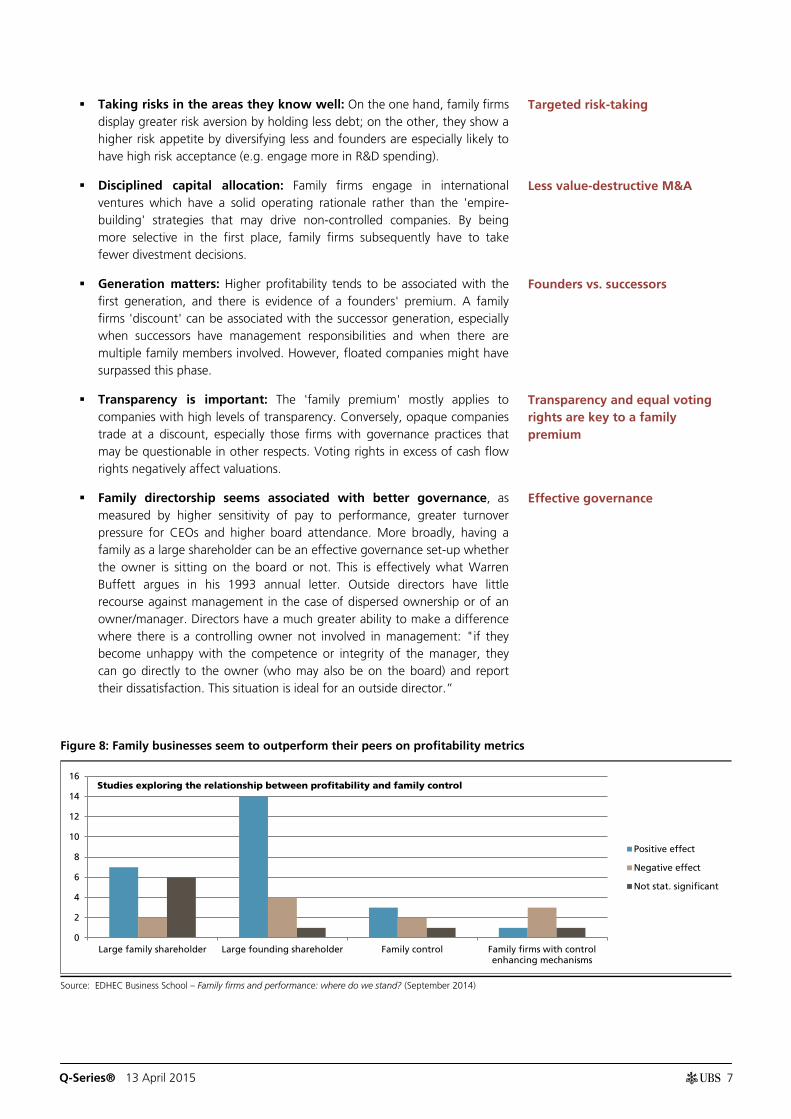
Since the results may have some geographical bias, we also include three regions where we have identified a stronger presence of family-owned midcaps: Asia, Europe and, to a lesser extent, Latam.
As we show below, the results for Europe are also conclusive. And beating the small and midcap indices in Europe is not all that easy. As we discussed in our 15 October 2013 Q-Series® report Why do smallcaps outperform? (Bosco Ojeda), smallcaps as an asset class have outperformed over the past 25 years in nearly all markets, including Europe.
Figure 11: European family-owned midcaps have outperformed
Figure 12: European midcaps, smallcaps, largecaps vs. family-owned stocks
Index Perf. 10y Perf. 5y Perf. 3y Perf. 1y
UBS European Family-owned
Index 204% 96% 71% 20%
Datastream Thomson Europe
Largecap Index 36% 31% 34% 15%
Datastream Thomson Europe
Midcap Index 65% 51% 48% 15%
Datastream Thomson Europe
Smallcap Index 106% 71% 59% 10%
Source: Thomson Datastream, UBS estimates Source: Thomson Datastream, UBS estimates
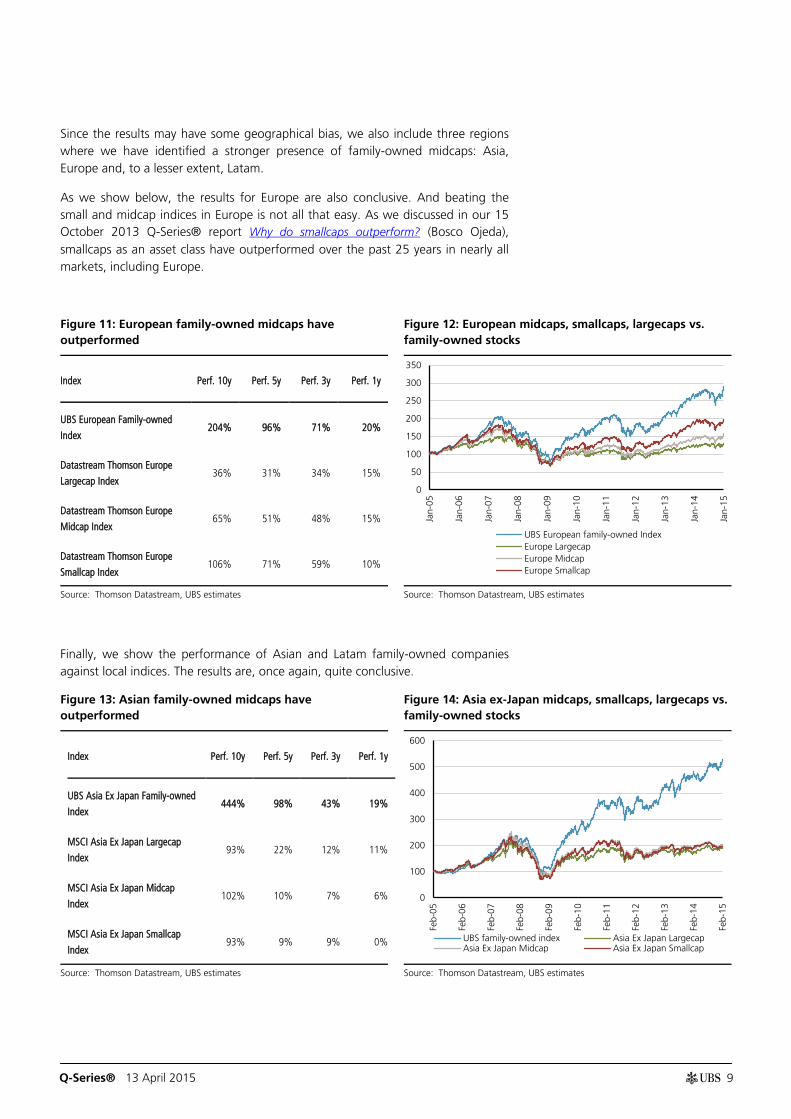
Finally, we show the performance of Asian and Latam family-owned companies against local indices. The results are, once again, quite conclusive.
Figure 13: Asian family-owned midcaps have outperformed
Figure 14: Asia ex-Japan midcaps, smallcaps, largecaps vs. family-owned stocks
Index Perf. 10y Perf. 5y Perf. 3y Perf. 1y
UBS Asia Ex Japan Family-owned
Index 444% 98% 43% 19%
MSCI Asia Ex Japan Largecap
Index 93% 22% 12% 11%
MSCI Asia Ex Japan Midcap
Index 102% 10% 7% 6%
MSCI Asia Ex Japan Smallcap
Index 93% 9% 9% 0%
Source: Thomson Datastream, UBS estimates Source: Thomson Datastream, UBS estimates
0
50
100
150
200
250
300
350
Jan-
05
Jan-
06
Jan-
07
Jan-
08
Jan-
09
Jan-
10
Jan-
11
Jan-
12
Jan-
13
Jan-
14
Jan-
15
UBS European family-owned IndexEurope LargecapEurope MidcapEurope Smallcap
0
100
200
300
400
500
600
Feb-
05
Feb-
06
Feb-
07
Feb-
08
Feb-
09
Feb-
10
Feb-
11
Feb-
12
Feb-
13
Feb-
14
Feb-
15
UBS family-owned index Asia Ex Japan LargecapAsia Ex Japan Midcap Asia Ex Japan Smallcap

Q-Series® 13 April 2015
10
Figure 15: Latam family-owned midcaps have outperformed
Figure 16: Latam midcaps, smallcaps, largecaps vs. family-owned stocks
Index Perf. 10y Perf. 5y Perf. 3y Perf. 1y
UBS Latam Family-owned Index 270% -11% -18% -24%
MSCI Latam Largecap Index 60% -42% -43% -18%
MSCI Latam Midcap Index 50% -33% -43% -20%
MSCI Latam Smallcap Index 55% -40% -50% -26%
Source: Thomson Datastream, UBS estimates Source: Thomson Datastream, UBS estimates
What about risk? It is received wisdom in finance that securing higher returns requires greater risk-taking. We ran an analysis to capture the volatility of family firms versus other smallcap, midcap and largecap companies (as measured by the standard deviation of returns), and found that family firms have an attractive risk profile, both globally and at the regional level in Europe, Asia and Latam.
While our sample of family firms is not exhaustive and there are difficulties in comparing risk/return profiles (for example, this could be specific to the 10-year period under consideration or be distorted by sector or geographical biases), our results appear to refute the assumption that risk is proportionate to the potential returns linked to our Family-owned Index.
We ran the analysis using daily volatility data for MSCI largecap, midcap and smallcap price indices, as well as our index of family-owned companies (although we warn that results could differ if we used weekly or monthly data).
The analysis is most conclusive at the global level and in Asia, as our Family-owned Index displays both the highest annualized returns and the lowest level of risk in the 10-year period. The results are also robust in Europe, but least robust in Latam, although there is no evidence of a risk higher than for largecaps, despite the higher returns (our Latam sample of family firms is the smallest among the three regions, with c20 stocks).
0
100
200
300
400
500
600
Mar
-05
Mar
-06
Mar
-07
Mar
-08
Mar
-09
Mar
-10
Mar
-11
Mar
-12
Mar
-13
Mar
-14
Mar
-15
UBS family owned index LATAM LargecapLATAM Midcap LATAM Smallcap
We found that family firms have an attractive risk profile, both globally and regionally

Q-Series® 13 April 2015
11
Figure 17: Risk/return 10-year analysis in global markets Figure 18: Risk/return 10-year analysis in Europe
Source: UBS estimates, Thomson Datastream. Data based on MSCI daily indices. Source: UBS estimates, Thomson Datastream. Data based on MSCI daily indices.
Figure 19: Risk/return 10-year analysis in Asia ex-Japan Figure 20: Risk/return 10-year analysis in Latam
Source: UBS estimates, Thomson Datastream. Data based on MSCI daily indices. Source: UBS estimates, Thomson Datastream. Data based on MSCI daily indices.
UBS Family-owned Index
Largecaps Midcaps
Smallcaps
3.0%
6.0%
9.0%
12.0%
15.0%
18.0%
15.0% 16.0% 17.0% 18.0% 19.0%
Annu
alis
ed R
etur
ns
Annualised Risk
UBS European
Family-owned Index
Largecaps
Midcaps
Smallcaps
3.0%
6.0%
9.0%
12.0%
15.0%
18.0%
16.0% 17.0% 18.0% 19.0% 20.0%
An
nu
ali
sed
Retu
rns
Annualised Risk
UBS Asia ex Japan
Family-owned Index
Largecapss
Midcaps
Smallcaps
3.0%
6.0%
9.0%
12.0%
15.0%
18.0%
21.0%
17.0% 18.0% 19.0% 20.0% 21.0% 22.0%
An
nu
ali
sed
Retu
rns
Annualised Risk
UBS Latam Family Owned Index
Largecaps Midcaps Smallcaps
3.0%
6.0%
9.0%
12.0%
15.0%
18.0%
21.0%
20.0% 25.0% 30.0% 35.0%
An
nu
ali
sed
Retu
rns
Annualised Risk

Q-Series® 13 April 2015
12
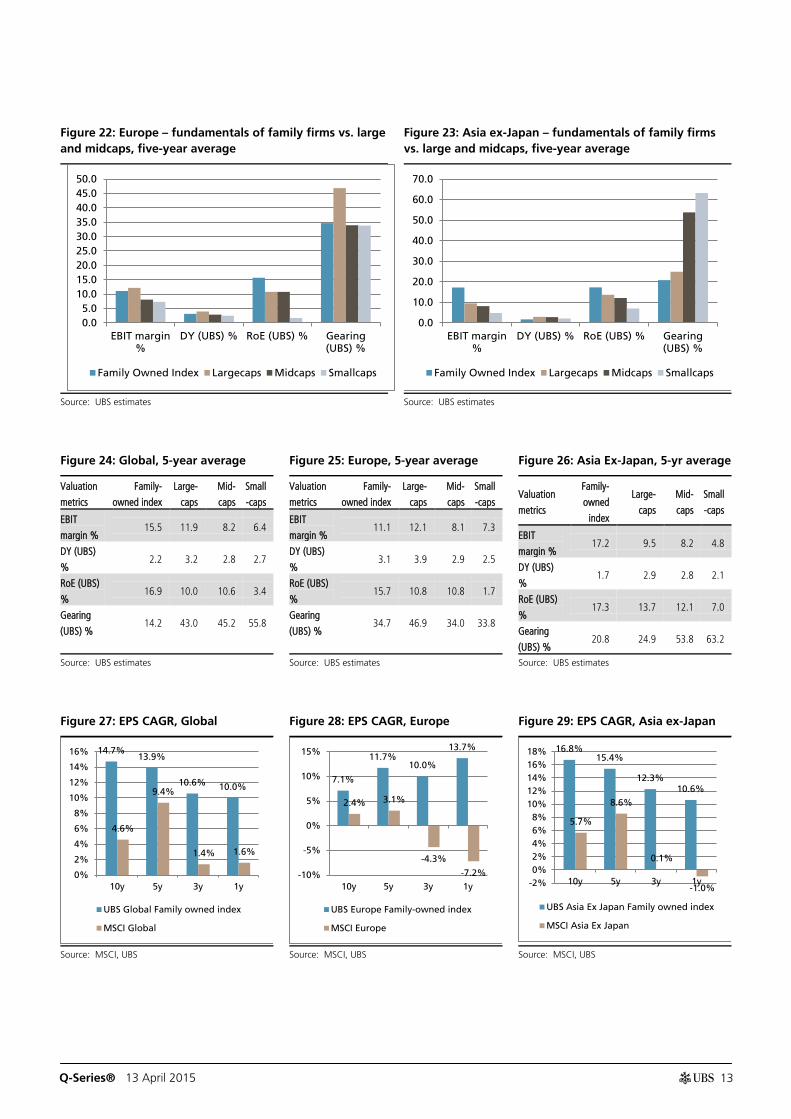
What about the fundamentals? We compared family-owned companies to the wider universe of large and midcap companies covered by UBS on a range of metrics – margins, ROE, gearing and dividend yield – over a five-year period. Family-owned companies screen quite well in terms of margins and returns, despite a lower gearing. There are some regional differences, but the results are broadly consistent across geographies3:
Family firms enjoy high operational margins. At 15.7%, family businesses' EBIT margins are 30% higher than those of largecaps (11.9%), and almost double those of midcaps (8.2%). This seems to be especially true in Asia, and may reflect a more disciplined approach on the part of family firms in relation to costs, although there could also be some sector bias at play. In Europe, family firms lag behind largecaps in terms of margins, but not by much (11% versus 12.1%). To us, this is still a positive result in those mature markets, given the differences in scale with largecaps (e.g. midcaps' margins are substantially lower in Europe at 8.1%).
Returns are unequivocally higher for family firms in all regions. In Europe, the ROEs of family firms are in the mid-teens vs. the low teens for large and midcaps. In Asia, there is a similar gap between the returns of family firms (16.9%) vs. large (13.7%) and midcaps (12.1%). Importantly, these higher returns do not come with a higher gearing – quite the contrary. As suggested by the academic literature, we believe the higher returns likely come from effective governance and a disciplined attitude towards capital allocation.
In our 15 October 2013 Q-Series® report Why do smallcaps outperform? (Bosco Ojeda), we concluded that higher growth was a key driver of outperformance for smallcaps. We looked specifically at family-owned firms and, once again, earnings growth seems above average and explains a large part of the outperformance of family businesses. In addition, family firms have been delivering 10%-plus annual earnings growth at a steady pace.
Dividend yields tend to be lower for family firms at 2.2% vs 3.2% for largecaps and 2.8% for midcaps. This lower yield may be partly explained by the valuation gap between family and non-family firms. As discussed in the next section, family firms in fact enjoy a valuation premium across regions.
Figure 21: Global: Fundamentals of family firms vs. large and midcaps – five-year average
Source: UBS
3 In this analysis, we focus on Europe and Asia ex-Japan at the regional level, as this is where we have more depth in the data.
0.0
10.0
20.0
30.0
40.0
50.0
60.0
EBIT margin % DY (UBS) % RoE (UBS) % Gearing (UBS) %
Family Owned Index
Largecaps
Midcaps
Smallcaps
Family-owned companies screen quite well in terms of margins and returns, despite a lower gearing
Q-Series® 13 April 2015
13
Figure 22: Europe – fundamentals of family firms vs. large and midcaps, five-year average
Figure 23: Asia ex-Japan – fundamentals of family firms vs. large and midcaps, five-year average
Source: UBS estimates Source: UBS estimates
Figure 24: Global, 5-year average Figure 25: Europe, 5-year average Figure 26: Asia Ex-Japan, 5-yr average
Valuation
metrics
Family-
owned index
Large-
caps
Mid-
caps
Small
-caps
EBIT
margin % 15.5 11.9 8.2 6.4
DY (UBS)
% 2.2 3.2 2.8 2.7
RoE (UBS)
% 16.9 10.0 10.6 3.4
Gearing
(UBS) % 14.2 43.0 45.2 55.8
Valuation
metrics
Family-
owned index
Large-
caps
Mid-
caps
Small
-caps
EBIT
margin % 11.1 12.1 8.1 7.3
DY (UBS)
% 3.1 3.9 2.9 2.5
RoE (UBS)
% 15.7 10.8 10.8 1.7
Gearing
(UBS) % 34.7 46.9 34.0 33.8
Valuation
metrics
Family-
owned
index
Large-
caps
Mid-
caps
Small
-caps
EBIT
margin % 17.2 9.5 8.2 4.8
DY (UBS)
% 1.7 2.9 2.8 2.1
RoE (UBS)
% 17.3 13.7 12.1 7.0
Gearing
(UBS) % 20.8 24.9 53.8 63.2
Source: UBS estimates Source: UBS estimates Source: UBS estimates
Figure 27: EPS CAGR, Global Figure 28: EPS CAGR, Europe Figure 29: EPS CAGR, Asia ex-Japan
Source: MSCI, UBS Source: MSCI, UBS Source: MSCI, UBS
0.05.0
10.015.020.025.030.035.040.045.050.0
EBIT margin%
DY (UBS) % RoE (UBS) % Gearing(UBS) %
Family Owned Index Largecaps Midcaps Smallcaps
0.0
10.0
20.0
30.0
40.0
50.0
60.0
70.0
EBIT margin%
DY (UBS) % RoE (UBS) % Gearing(UBS) %
Family Owned Index Largecaps Midcaps Smallcaps
14.7% 13.9%
10.6% 10.0%
4.6%
9.4%
1.4% 1.6%
0%
2%
4%
6%
8%
10%
12%
14%
16%
10y 5y 3y 1y
UBS Global Family owned index
MSCI Global
7.1%
11.7% 10.0%
13.7%
2.4% 3.1%
-4.3%
-7.2% -10%
-5%
0%
5%
10%
15%
10y 5y 3y 1y
UBS Europe Family-owned index
MSCI Europe
16.8% 15.4%
12.3% 10.6%
5.7%
8.6%
0.1%
-1.0% -2%0%2%4%6%8%
10%12%14%16%18%
10y 5y 3y 1y
UBS Asia Ex Japan Family owned index
MSCI Asia Ex Japan
Q-Series® 13 April 2015
14
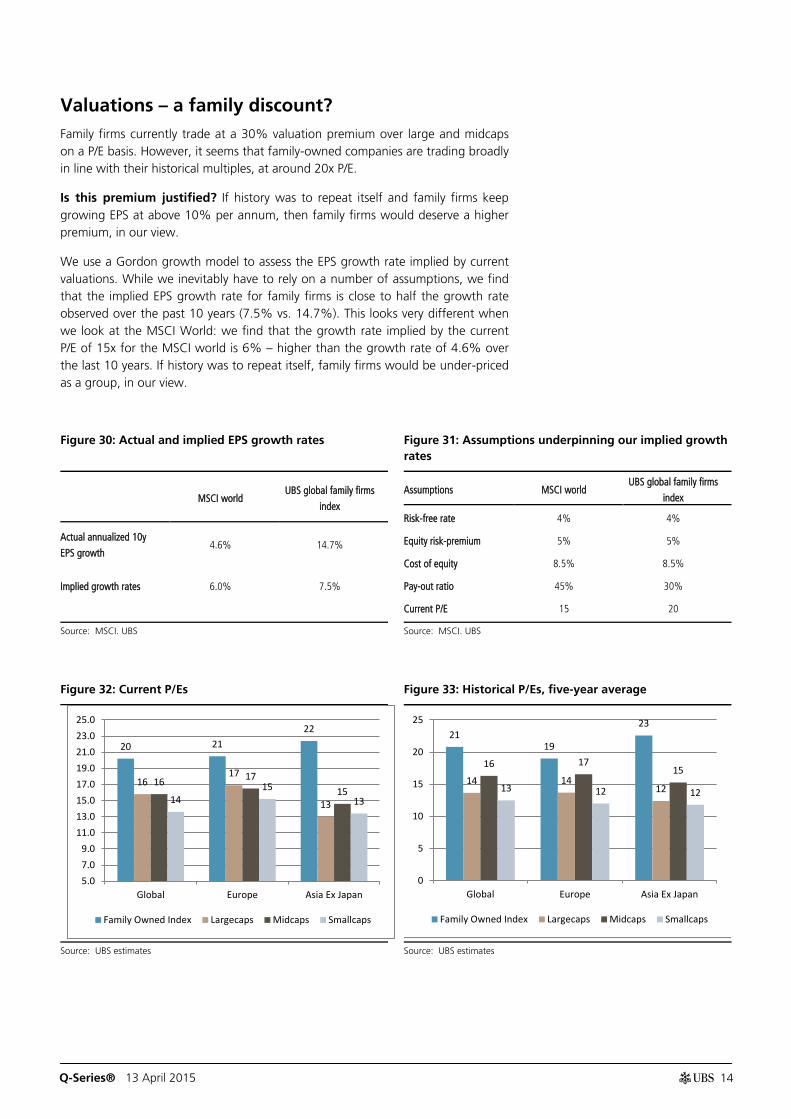
Valuations – a family discount? Family firms currently trade at a 30% valuation premium over large and midcaps on a P/E basis. However, it seems that family-owned companies are trading broadly in line with their historical multiples, at around 20x P/E.
Is this premium justified? If history was to repeat itself and family firms keep growing EPS at above 10% per annum, then family firms would deserve a higher premium, in our view.
We use a Gordon growth model to assess the EPS growth rate implied by current valuations. While we inevitably have to rely on a number of assumptions, we find that the implied EPS growth rate for family firms is close to half the growth rate observed over the past 10 years (7.5% vs. 14.7%). This looks very different when we look at the MSCI World: we find that the growth rate implied by the current P/E of 15x for the MSCI world is 6% – higher than the growth rate of 4.6% over the last 10 years. If history was to repeat itself, family firms would be under-priced as a group, in our view.
Figure 30: Actual and implied EPS growth rates Figure 31: Assumptions underpinning our implied growth rates
MSCI world
UBS global family firms
index
Actual annualized 10y
EPS growth 4.6% 14.7%
Implied growth rates 6.0% 7.5%
Assumptions MSCI world UBS global family firms
index
Risk-free rate 4% 4%
Equity risk-premium 5% 5%
Cost of equity 8.5% 8.5%
Pay-out ratio 45% 30%
Current P/E 15 20
Source: MSCI. UBS Source: MSCI. UBS
Figure 32: Current P/Es Figure 33: Historical P/Es, five-year average
Source: UBS estimates Source: UBS estimates
20 21 22
16 17
13
16 17 15
14 15
13
5.07.09.0
11.013.015.017.019.021.023.025.0
Global Europe Asia Ex Japan
Family Owned Index Largecaps Midcaps Smallcaps
21 19
23
14 14 12
16 17 15
13 12 12
0
5
10
15
20
25
Global Europe Asia Ex Japan
Family Owned Index Largecaps Midcaps Smallcaps

Q-Series® 13 April 2015
15
Figure 34: Global – historical five-year valuations
Figure 35: Europe – historical five-year valuations
Figure 36: Asia ex-Japan – historical five-year valuations
Source: UBS estimates Source: UBS estimates Source: UBS estimates
13
7 8 9
21
14 16
13
0
5
10
15
20
25
EV/EBITDA (core) x PE (UBS) x
10
7 8 7
19
14 17
12
02468
101214161820
EV/EBITDA (core) x PE (UBS) x
16
7 9
11
23
12 15
12
0
5
10
15
20
25
EV/EBITDA (core) x PE (UBS) x
Q-Series® 13 April 2015
16
Best-governed family-owned midcaps We believe that analysing governance is a vital aspect of the investment process, and that good corporate governance has been a key factor driving shareholder returns for smallcaps. Small and midcap stocks are often perceived as opaque and risky, but our analysis suggests that, on the contrary, the space enjoys better corporate governance than largecaps, and in our view this has been a key driver of smallcap indices outperforming for the past 20 years – see our 15 October 2013 Q-Series® report Why do smallcaps outperform? (Bosco Ojeda). Obviously this is not the only factor; other aspects such as growth and M&A are also important, but it is hard to see a company perform well long term without proper governance.
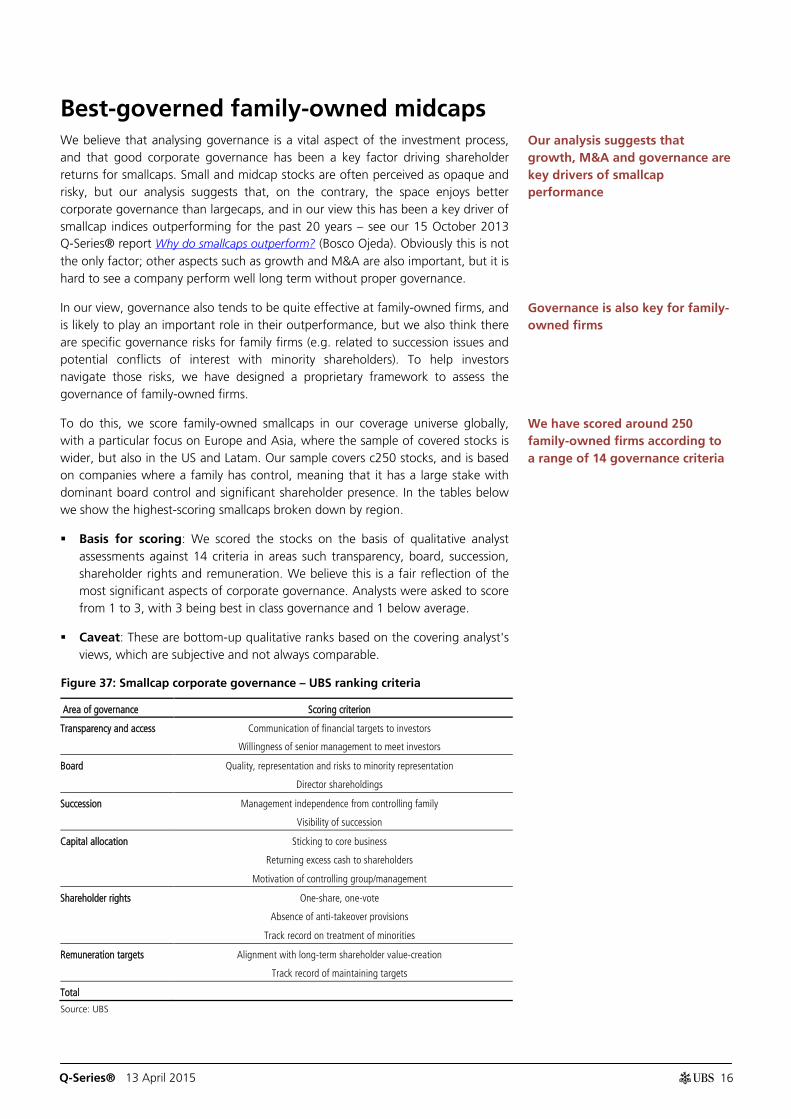
In our view, governance also tends to be quite effective at family-owned firms, and is likely to play an important role in their outperformance, but we also think there are specific governance risks for family firms (e.g. related to succession issues and potential conflicts of interest with minority shareholders). To help investors navigate those risks, we have designed a proprietary framework to assess the governance of family-owned firms.
To do this, we score family-owned smallcaps in our coverage universe globally, with a particular focus on Europe and Asia, where the sample of covered stocks is wider, but also in the US and Latam. Our sample covers c250 stocks, and is based on companies where a family has control, meaning that it has a large stake with dominant board control and significant shareholder presence. In the tables below we show the highest-scoring smallcaps broken down by region.
Basis for scoring: We scored the stocks on the basis of qualitative analyst assessments against 14 criteria in areas such transparency, board, succession, shareholder rights and remuneration. We believe this is a fair reflection of the most significant aspects of corporate governance. Analysts were asked to score from 1 to 3, with 3 being best in class governance and 1 below average.
Caveat: These are bottom-up qualitative ranks based on the covering analyst's views, which are subjective and not always comparable.
Figure 37: Smallcap corporate governance – UBS ranking criteria
Area of governance Scoring criterion
Transparency and access Communication of financial targets to investors
Willingness of senior management to meet investors
Board Quality, representation and risks to minority representation
Director shareholdings
Succession Management independence from controlling family
Visibility of succession
Capital allocation Sticking to core business
Returning excess cash to shareholders
Motivation of controlling group/management
Shareholder rights One-share, one-vote
Absence of anti-takeover provisions
Track record on treatment of minorities
Remuneration targets Alignment with long-term shareholder value-creation
Track record of maintaining targets
Total
Source: UBS
Our analysis suggests that growth, M&A and governance are key drivers of smallcap performance
Governance is also key for family-owned firms
We have scored around 250 family-owned firms according to a range of 14 governance criteria

Q-Series® 13 April 2015
17
We show below the top-ranked family-owned companies for corporate governance in the different regions, as well as the basis of our rankings. As mentioned above, there is an element of subjectivity in the rankings and it can be difficult to compare companies, but in our view the top-ranked firms in these lists do exhibit fairly strong corporate governance standards.
Europe
Figure 38: Top ranked family-owned companies in Europe for corporate governance
Company name
Total governance score
Comm
unication of
financial targets to
investors
Willingness of senior
managem
ent to meet
investors
Quality, representation
and risks to minority
representation
Director shareholdings
Managem
ent
independence from
controlling family
Visibility of succession
Sticking to core business
Returning excess cash to
shareholders
Motivation of controlling
group/managem
ent
One-share, one-vote
Absence of anti-takeover
provisions
Track record on treatment
of minorities
Alignment w
ith long-term
shareholder value-creation
Track record of
maintaining targets
Eurazeo 37 3 3 2 3 3 3 3 3 2 1 2 3 3 3
Ebro Foods 36 3 3 2 2 1 1 3 3 3 3 3 3 3 3
Bucher Industries AG 36 3 2 3 2 3 3 2 2 3 3 2 3 3 2
Wendel 35 3 3 2 3 3 2 3 2 2 1 2 3 3 3
Groupe Bruxelles
Lambert SA 34 3 3 3 3 1 2 3 2 2 2 1 3 3 3
Belimo 34 2 1 3 2 3 3 3 2 2 3 2 2 3 3
SFS Group AG 34 3 3 3 3 2 3 2 2 3 3 2 2 2 1
Electrolux B 33 3 3 3 3 3 2 3 2 2 1 2 2 2 2
Laboratorios
Farmacéuticos Rovi 32 3 3 2 1 1 2 3 1 3 3 2 3 3 2
Bachem 32 2 1 2 3 3 2 3 2 3 3 2 2 2 2
Huber+Suhner 32 2 2 3 1 3 2 3 1 3 3 2 3 2 2
Zumtobel Group AG 31 3 2 2 2 2 1 2 2 3 3 3 2 2 2
Ratos 31 2 2 2 3 3 2 3 2 1 3 2 2 2 2
BIC Group 30 2 2 2 2 2 2 2 3 2 1 1 3 3 3
Source: UBS estimates

Q-Series® 13 April 2015
18
Asia ex-Japan
Figure 39: Top ranked family-owned companies in Asia (ex-Japan) for corporate governance
Company name
Total governance score
Comm
unication of
financial targets to
investors
Willingness of senior
managem
ent to meet
investors
Quality, representation
and risks to minority
representation
Director shareholdings
Managem
ent
independence from
controlling family
Visibility of succession
Sticking to core business
Returning excess cash to
shareholders
Motivation of controlling
group/managem
ent
One-share, one-vote
Absence of anti-takeover
provisions
Track record on treatment
of minorities
Alignment w
ith long-term
shareholder value-creation
Track record of
maintaining targets
Globe Telecom 41 2 3 3 3 3 3 3 3 3 3 3 3 3 3
Thai Union Frozen 39 3 3 3 2 2 2 3 3 3 3 3 3 3 3
Huayi Brothers Media 38 3 3 3 3 1 1 3 3 3 3 3 3 3 3
Marico Ltd 37 3 3 3 2 3 3 3 2 2 3 2 3 2 3
Top Glove 37 3 3 3 2 2 1 3 2 3 3 3 3 3 3
RiseSun Real Estate
Development 35 3 3 2 3 2 2 3 2 3 3 3 2 2 2
Baoxin Auto 34 1 3 2 2 1 3 3 2 3 3 3 2 3 3
Zhongsheng Group
Holdings 34 2 2 2 2 1 3 3 2 3 3 3 2 3 3
NagaCorp 34 3 3 1 2 1 2 3 3 3 3 3 2 3 2
Dialog Group 34 1 3 3 2 2 3 2 2 3 3 3 3 3 1
UOL Group 34 2 3 2 3 2 2 3 2 2 3 2 3 3 2
Land & Houses 34 3 3 2 2 3 2 2 3 2 2 2 2 3 3
Sa Sa International 33 3 2 2 2 1 1 3 3 3 3 1 3 3 3
Central Pattana 33 2 2 3 2 3 2 3 2 2 2 2 3 3 2
China Life Insurance
(Taiwan) 33 2 2 2 3 2 2 3 2 2 3 3 2 3 2
Meisheng Cultural & Creative Corp. 32 1 1 3 3 1 1 3 2 2 3 3 3 3 3
Sino Biopharmaceutical 32 2 2 2 3 2 2 3 2 2 2 2 3 2 3
Source: UBS estimates
Japan
Figure 40: Top ranked family-owned companies in Japan for corporate governance
Company name
Total governance score
Comm
unication of
financial targets to
investors
Willingness of senior
managem
ent to meet
investors
Quality, representation
and risks to minority
representation
Director shareholdings
Managem
ent
independence from
controlling family
Visibility of succession
Sticking to core business
Returning excess cash to
shareholders
Motivation of controlling
group/managem
ent
One-share, one-vote
Absence of anti-takeover
provisions
Track record on treatment
of minorities
Alignment w
ith long-term
shareholder value-creation
Track record of
maintaining targets
Daiichikosho 33 2 2 2 2 2 2 3 3 2 2 3 2 3 3
Hikari Tsushin 33 2 3 2 2 3 3 2 3 2 2 3 2 2 2
GMO Internet 32 2 3 3 1 2 2 3 2 3 2 3 2 2 2
Seria 32 2 3 3 2 2 3 3 2 2 2 2 2 2 2
Sanwa Holdings 31 3 3 2 2 2 1 3 3 2 2 1 2 2 3
Sugi Holdings 30 3 3 2 2 2 2 2 1 2 2 2 2 2 3
CyberAgent 30 2 3 3 1 2 2 3 1 3 2 2 2 2 2
Source: UBS estimates

Q-Series® 13 April 2015
19
Latam
Figure 41: Top ranked family-owned companies in Latam for corporate governance
Company name
Total governance score
Comm
unication of
financial targets to
investors
Willingness of senior
managem
ent to meet
investors
Quality, representation
and risks to minority
representation
Director shareholdings
Managem
ent
independence from
controlling family
Visibility of succession
Sticking to core business
Returning excess cash to
shareholders
Motivation of controlling
group/managem
ent
One-share, one-vote
Absence of anti-takeover
provisions
Track record on treatment
of minorities
Alignment w
ith long-term
shareholder value-creation
Track record of
maintaining targets
Grupo Comercial Chedraui,
S.A.B. de C.V. 38 3 3 3 3 2 3 3 2 3 3 2 3 3 2
Hypermarcas S.A. 36 2 2 3 3 3 2 3 2 3 3 3 3 2 2
Fibra Danhos 35 3 3 2 3 1 2 3 3 3 2 2 2 3 3
Porto Seguro 32 2 3 3 2 2 3 2 2 2 3 2 2 2 2
Iochpe-Maxion 32 2 2 2 3 1 2 3 1 3 3 3 2 3 2
LALA 32 2 2 2 2 3 2 3 2 2 3 3 2 2 2
Fibra Shop 31 3 2 2 2 2 2 3 3 2 2 2 2 2 2
Organizacion Soriana 31 2 2 1 3 2 3 2 2 3 3 2 3 2 1
Banregio 30 3 3 2 2 1 1 3 1 2 3 2 2 2 3
Source: UBS estimates
US
Figure 42: Top ranked family-owned companies in the US for corporate governance
Company name
Total governance score
Comm
unication of
financial targets to
investors
Willingness of senior
managem
ent to meet
investors
Quality, representation
and risks to minority
representation
Director shareholdings
Managem
ent
independence from
controlling family
Visibility of succession
Sticking to core business
Returning excess cash to
shareholders
Motivation of controlling
group/managem
ent
One-share, one-vote
Absence of anti-takeover
provisions
Track record on treatment
of minorities
Alignment w
ith long-term
shareholder value-creation
Track record of
maintaining targets
Fortinet Inc 34 3 3 3 3 2 2 3 2 2 2 2 2 2 3
Installed Building Products 33 3 3 2 2 1 1 3 2 3 3 2 2 3 3
Norcraft Companies 32 2 2 2 2 1 1 3 3 3 3 2 2 3 3
Greenlight Capital Re Ltd 31 2 2 2 2 3 3 2 3 2 2 2 2 2 2
Quotient Limited 30 3 3 2 2 1 1 3 2 3 2 2 2 2 2
Frank's International 29 1 2 2 2 2 3 3 2 2 2 2 2 2 2
Paramount Group, Inc. 29 2 2 2 2 2 2 3 2 2 2 2 2 2 2
Mattress Firm Holding Corp 28 3 3 2 1 2 2 2 1 2 2 2 2 2 2
IAC InterActive 27 2 1 2 2 2 1 2 3 3 1 2 2 2 2
Taubman Centers 27 2 2 2 2 1 1 2 2 3 2 2 2 2 2
Source: UBS estimates
Q-Series® 13 April 2015
20
Combining value and governance scoring provides good ideas In this section we briefly discuss the best-scoring family-owned names from a broader investment perspective, and provide regional lists of top picks including key valuation metrics.
Europe Top picks Europe
Eurazeo – Buy
Eurazeo is an investment company originally created by the families controlling the investment bank Lazard; the families still hold c20% of the capital. Eurazeo's portfolio is a combination of self-help cases (Europcar), high-growth companies (Moncler, Desigual), and cash-generative businesses (Elis). Given the leveraged nature of Eurazeo's investments (LBOs), a moderate increase in earnings should result in a greater increase in NAV, which we find attractive in the current context.
Ebro Foods – Buy
The company has a very significant presence in the US and Europe where it has #1 and #3 market shares for key segments of pasta and rice. The company has been growing through acquisitions of local champion brands and also organically through the development of value-added products. Ebro is a highly cash-generative business, has a good track record on growth, and a solid balance sheet.
Groupe Bruxelles Lambert – Buy
GBL is a holding company 50% controlled by Pargesa, a holding company controlled in turn by the Frere and Desmarais families. GBL's portfolio is focused on a small number of listed companies, with investments including Total, Lafarge, Imerys, SGS and Pernod Ricard. GBL acts as a long-term shareholder, and the portfolio has historically had very little or no financial leverage. We believe the current discount to NAV is too wide given the recent portfolio rotation.
SFS group – Buy
SFS, led by an experienced management team, holds a strong market position in specialty fasteners that is based on close customer relations and the critical importance of its products. SFS offers solid growth driven by end-market growth in construction (c30% of sales), electronics (c25%) and automotive (20%). We expect it to enjoy incremental growth prospects from its accelerating regional expansion in Asia (24%) and North America (10%). SFS has a healthy balance sheet and sees potential for further acquisitions.
Zumtobel – Buy
Zumtobel is a European leader in professional lighting solutions, based in Austria. It has set itself an impressive margin objective, which implies improving from an expected 5-6% margin this year to 8-10% in two years' time, to be achieved by closing four factories (out of 18) and consolidating the sales force. However, if Zumtobel is really consistent, we think it will need to step up these measures further, as when it comes to choosing its margin benchmarks it compares itself more to Acuity (12.2% EBIT margin in FY 14) and Fagerhult (10.1%), rather than
UBS analyst: Denis Moreau
UBS analyst Bosco Ojeda
UBS analyst: Denis Moreau
UBS analyst: Andre Rudolf von Rohr
UBS analyst: Sven Weier

Q-Series® 13 April 2015
21
Philips (8.6%) and Osram (8.7%). We think it has scope to go beyond the current measures, and the recent rise in the shares has only started to anticipate this. Zumtobel has said it is discussing further margin improvement measures, though it is not yet clear whether this will lead to smaller or more profound changes.
Ratos – Buy
Ratos is a listed private equity company that trades on the Stockholm stock exchange. Ratos's strategy is to generate the highest possible return through active ownership of its portfolio companies. Ratos generally prefers an ownership level of at least 20%, and targets an IRR of at least 20% on each investment, with an investment horizon of three to seven years.
Figure 43: Europe – best-ranked corporate governance stocks – valuation criteria
Company Country Stock price
(l.c.)
UBS PT
(l.c.)
UBS
rating
Market cap
(€ m)
Net debt/
EBITDA
2015E
Stock perf.
12m (%)
Stock perf.
YTD (%)
Adj. P/E
2015E
EV/
EBITDA
2015E
Div. yield
2015E (%)
Eurazeo FR 67.02 72.0 Buy 4951.15 - 10.9 16.8 - - 1.8
Ebro Foods ES 17.81 17.0 Buy 2953.90 -1.2 10.6 31.6 17.4 10.0 3.9
Bucher Industries AG CH 241.7 225.0 Neutral 2531.68 0.0 -17.0 -1.9 14.7 7.3 2.4
Wendel FR 114.8 107.5 Neutral 6017.65 - 3.1 25.0 - - 1.8
Groupe Bruxelles Lambert BE 78.93 84.0 Buy 13728.15 - 6.1 12.1 - - 3.7
Belimo CH 2126 2200.0 Neutral 1352.68 0.7 -12.9 -4.8 20.1 12.4 3.0
SFS Group AG CH 71.05 78.0 Buy 2763.02 0.3 - -9.0 18.6 9.9 2.1
Electrolux B SE 236.2 190.0 Sell 7763.16 -0.8 59.5 2.3 15.8 7.5 2.8
Laboratorios Farmacéuticos Rovi ES 16.29 13.1 Neutral 877.95 -0.3 71.6 58.3 28.4 20.5 1.2
Bachem CH 53 42.0 Neutral 747.49 -0.2 6.4 10.0 26.4 14.4 3.0
Huber+Suhner CH 45.05 40.0 Neutral 909.19 2.1 -7.4 -6.4 22.7 7.3 1.6
Zumtobel Group AG AT 23.635 28.0 Buy 1108.21 -0.9 38.8 26.1 19.7 9.2 2.4
Ratos SE 61.1 65.0 Buy 2377.31 - -2.1 31.6 - - 7.4
BIC Group FR 140.35 137.0 Neutral 7119.92 0.5 48.8 29.8 21.6 12.7 3.9
Source: UBS estimates. Price data as of 9th April 2015.
UBS analyst David Hallden

Q-Series® 13 April 2015
22
Asia ex-Japan Top picks Asia
RiseSun – Buy
Positioned in the mid- to low-end of the residential market, RiseSun is a real estate company with projects mainly in tier two/three cities. Small- to mid-size ordinary apartments account for more than 90% of the company's products. It currently has a landbank of c24m sqm, enough for sale in the next four years. Additionally, c20% of its landbank is located in Langfang. If the national strategy for the integration of Beijing-Tianjin-Hebei accelerates, we believe RiseSun's Langfang projects may post significantly higher sell-through rates and a higher average selling price (versus the current cRmb6,500/sqm), resulting in better profitability. We estimate the company's 2014 sales at Rmb28bn, up 4% YoY, and expect it to post 2015 sales of Rmb 32bn, up 14% YoY.
Top Glove – Buy
Top Glove is the world's largest glove manufacturer with a global market share of approximately 25% and annual production capacity of 42bn pieces of gloves. With founder and CEO Tan Sri Lim Wee Chai driving strong leadership, the company has been focused on economies of scale and minimising costs, and has grown net profit by 21% CAGR since its IPO in 2001 (and capacity by 22% CAGR since 2001). Currently, the company is conservatively navigating the overcapacity in the market and building capacity in nitrile gloves, to capture the shift in consumer preference from latex to nitrile.
Baoxin Auto – Buy
Baoxin Auto is one of the leading 4S dealership groups in China. The company has a well-established network comprising 80 4S dealerships, as at June 2014 – 71 of which are for luxury and ultra-luxury brands. Most of the 4S stores are located in populous and affluent regions of China. Baoxin Auto (Baoxin) reported H114 net profit of Rmb547m, up 7.0% YoY. We believe its new car sales margin has bottomed, while its after-sales services and derivative businesses should maintain strong growth. The company has been building its online used-car trading platform since October 2013. The platform became online-to-offline (O2O) in July 2014, when it opened the first dedicated used-car trading store and launched a standalone website for used-car trading and new car sales. We expect the O2O business to enhance earnings and valuation.
UOL Group – Buy
UOL Group is a diversified Singapore real estate company with interests in property development, property investment, and hotel operations. Its net profit has grown at 23.8% CAGR over the past decade, led by an experienced and stable management team. We like the company for its defensive earnings, attractive valuation, and disciplined approach to landbanking. Through its hotel subsidiary, Pan Pacific Hotels Group, we think UOL is well placed to benefit from a pick-up in intra-Asia travel. Over the medium term, the potential consolidation of control over its listed associate, United Industrial Corporation, could lead to efficiency gains, greater flexibility for restructuring, and/or the monetization of assets, which we believe would lead to a narrowing of the discount to RNAV and increased investor interest.
UBS analyst: Xiao Ding
UBS analyst: Nicole Goh
UBS analyst: Ming Xu
UBS analyst: Michael Lim

Q-Series® 13 April 2015
23
Land & Houses – Buy
Land & Houses (LH) is Thailand’s leading housing developer and has high exposure to the low-rise segment of the market, targeting all income thresholds in Bangkok and upcountry Thailand alike. Additionally, LH has shown an ability to launch attractive condominium projects in Bangkok to further diversify its product offering. As it has one of the strongest balance sheets in the sector as well as a four-year landbank, we believe LH has the flexibility to rapidly adjust supply to changes in housing demand. Management maintains an 80% payout ratio, which produced a 2014 yield of 6.4%.
China Life Insurance (Taiwan) – Buy
China Life (TW) has the highest earnings quality among the major Taiwan life insurers, due to the lower cost of its liabilities and breakeven yield. We believe the abundance of liquidity in Taiwan will continue to drive wealth management demand and support sales of bancassurance products. China Life is also a major beneficiary of Formosa bond development in Taiwan and we expect significant improvement in the recurrent investment yield through the reallocation of domestic Taiwan government bonds to long-duration US dollar financial bonds issued in Taiwan. In addition to its Taiwan business, China Life (TW) has a 20% stake in CCB Life in China. We believe this fits well with the financial reforms in China. China Life (TW)'s share price has been lagging major peers, like Cathay & Fubon, since 2013 and we expect China Life (TW) to catch up in 2015 as investors reposition from high-beta to high-quality names.
UBS analyst: Thomas Philippson
UBS analyst: Kelvin Chu

Q-Series® 13 April 2015
24
Figure 44: Asia ex-Japan – Best-ranked corporate governance stocks – valuation criteria
Company Country Stock
price (l.c.)
UBS PT
(l.c.) UBS rating
Market
cap
(US$ m)
Net debt/
EBITDA
2015E
Stock perf.
12m
Stock perf.
YTD
Adj P/E
2015E
EV/
EBITDA
2015E
Div. yield
2015E
Globe Telecom PH 2200 1650.0 Sell 6562.80 -1.2 31.0 27.2 21.3 8.0 3.9
Thai Union Frozen Products TH 20.5 24.5 Buy 3004.37 -3.0 21.9 -8.1 16.0 11.3 3.0
Huayi Brothers Media CN 34.88 33.5 Buy 6802.23 0.2 39.4 29.1 45.4 37.5 0.6
Marico Ltd IN 409 350.0 Neutral 4240.96 -0.4 85.7 21.3 44.9 29.7 0.9
Top Glove MY 5.46 5.9 Buy 931.292 0.2 11.7 20.8 16.3 8.9 3.2
RiseSun Real Estate Development CN 22.72 20.5 Buy 6873.28 -1.8 80.3 45.4 8.9 7.9 1.5
Baoxin Auto CN 4.6 7.5 Buy 1517.83 -1.6 -21.6 8.3 6.8 4.9 0.0
Zhongsheng Group Holdings CN 5.86 8.7 Buy 1443.00 -1.7 -39.3 -10.0 7.1 4.6 2.8
NagaCorp HK 6.88 7.0 Buy 1725.48 1.1 -25.6 -3.6 11.1 7.4 6.3
Dialog Group MY 1.6 1.6 Neutral 2167.29 -1.1 -12.1 6.7 36.7 24.2 1.4
UOL Group SG 7.81 7.7 Buy 4538.42 -6.6 23.6 11.2 14.9 25.5 1.9
Land & Houses TH 9.8 12.2 Buy 3306.47 -3.7 -2.5 7.7 14.4 14.5 5.6
Sa Sa International HK 8.04 4.0 Sell 1493.17 0.8 -33.4 -21.4 14.5 9.2 5.0
Central Pattana TH 43.5 49.0 Neutral 5995.95 -1.1 0.0 -2.2 23.8 15.2 1.6
China Life Insurance (Taiwan) TW 27.55 32.6 Buy 2660.06 - 13.6 8.7 12.7 - 1.6
Meisheng Cultural & Creative Corp. CN 25.2 29.0 Buy 1670 0.5 190.8 88.8 67.3 52.0 0.4
Sino Biopharmaceutical CN 9.38 8.1 Neutral 5980.529 1.2 42.1 29.6 26.7 15.6 1.0
Source: UBS estimates. Price data as of 9th April 2015.
Japan Top picks Japan
Seria (2782) – Buy
Seria is the second-largest 100-yen shop in Japan with 1,200 stores and its net profit has grown by 13x for the past 10 years. Showcasing strong leadership by its family members, Seria has a different product strategy to its competitors, having built a structure capable of making demand forecasts using sales data accumulated over several years to hold down inventories and maximize sales. Additionally, by increasing the efficiency of store-level tasks through IT investment, overall store management has become more efficient, increasing operating profit three-fold over the past 5 years and raising ROE to 25.4% in FY13 from 8.5% in FY08
CyberAgent (4751) – Buy
CyberAgent is one of Japan's foremost comprehensive internet service companies, characterized by a unique managerial style. Its main businesses are Ameba, internet advertising, games, media and others, and investment promotion. Its net profit has grown by 2.4x for the past 10 years, aided by strong leadership by
UBS analyst: Mariko Watanabe
UBS analyst: Sumito Takeda

Q-Series® 13 April 2015
25
founder Susumu Fujita. We favour the company for four reasons: 1) The high sustainability of the game operation. There are no super-hits but we expect it to maintain a certain market share through steady supply and a consistent hit ratio. 2) Its lead in the ad business due to the shift to smartphones. The company boasts much stronger growth rate than at peers and is expanding its share in the broad ad-technology field. 3) The Ameba business's entrance into a new growth phase. The company is aggressively expanding its businesses to native areas and is establishing distribution platforms. 4) The company's good position in the sector shifting away from games. The structural reform of the Ameba operation has turned out to be a clever step, in our view. While realizing continued segmental sales growth and improvement in profit margins after halving its payroll, the company is creating an environment in which it can actively allocate staff to new business areas. In the sector, business ideas and money are becoming commodities, and expectations for success of new businesses are naturally growing in the market.
DaiichiKosho (7458) – Buy
Daiichi Kosho is the largest maker and operator of commercial karaoke in Japan. Its net profit has grown by 2.7X for the past 10 years, and founder Tadahiko Hoshi shows strong leadership. The earnings source for the commercial karaoke business is content distribution, which together with rentals accounts for 80% of earnings. Earnings appear to be very stable, with annual operating cash flow of more than ¥20bn. Management is aggressively returning surplus funds to shareholders, having bought back and retired 20% of the shares since FY06. Market share growth, success in the seniors market, and share buybacks/dividend increases should be catalysts for share price appreciation, in our view.
Hikari Tsushin (9435) – Buy
Hikari Tsushin is Japan’s top distributor with a broad range of products and services, including communications lines, mobile phones, office equipment and insurance. Its net profit has grown by 2.7x for the past 10 years. The company has a balanced business portfolio, spanning communication services, office machinery, corporate marketing tools, and energy-saving electronic equipment. In addition, it is further expanding the provision of solutions to the corporate sector and increasing sales of insurance products for individuals. As a result of expansion in the product line-up, contract growth, and improved productivity, ongoing commissions have more than doubled in the past five years, while cash flow stability and levels have increased substantially.
UBS analyst: Mariko Watanabe
UBS analyst: Mariko Watanabe
Q-Series® 13 April 2015
26
Figure 45: Japan – Best-ranked corporate governance stocks – valuation criteria
Company Stock price
(l.c.)
UBS PT
(l.c.) UBS rating
Market cap
(US$ m)
Net debt/
EBITDA
2015E
Stock perf.
12m
Stock perf.
YTD
Adj. P/E
2015E
EV/EBITDA
2015E
Div. yield
2015E
DaiichiKosho 4055 4400.0 Buy 1964.568 -1.0 34.0 24.4 18.9 7.2 2.6
Hikari Tsushin 8610 10500.0 Buy 3278.134 2.9 6.3 17.0 19.2 4.8 1.9
GMO Internet 1594 1800.0 Buy 1562.653 2.2 68.3 55.1 26.2 8.1 1.3
Seria 4275 5000.0 Buy 1334.048 0.8 12.5 6.9 24.3 11.9 0.7
Sanwa Holdings 903 950.0 Buy 1805.699 -0.7 45.9 7.0 14.3 6.7 1.6
Sugi Holdings 6150 3800.0 Sell 3240.361 2.3 40.1 24.9 22.5 9.2 0.6
CyberAgent 6860 8000.0 Buy 3608.393 0.8 89.5 51.3 23.3 10.7 0.6
Source: UBS estimates. Price data as of 9th April 2015.
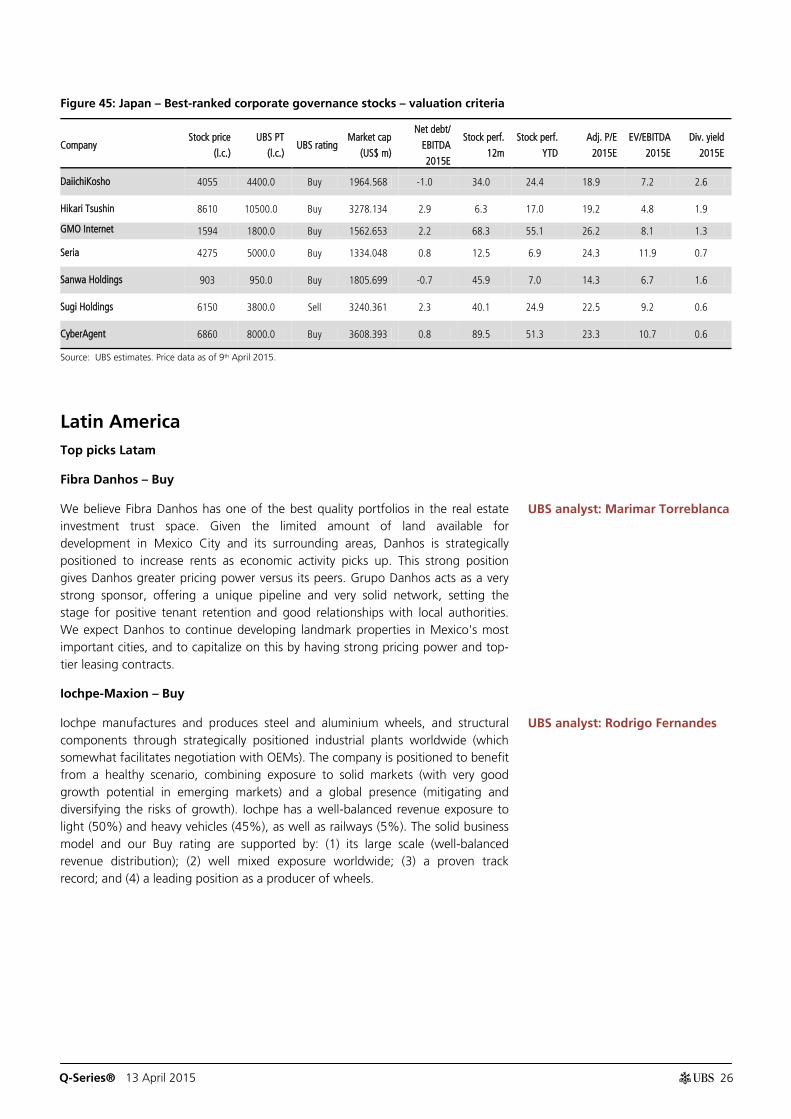
Latin America Top picks Latam
Fibra Danhos – Buy
We believe Fibra Danhos has one of the best quality portfolios in the real estate investment trust space. Given the limited amount of land available for development in Mexico City and its surrounding areas, Danhos is strategically positioned to increase rents as economic activity picks up. This strong position gives Danhos greater pricing power versus its peers. Grupo Danhos acts as a very strong sponsor, offering a unique pipeline and very solid network, setting the stage for positive tenant retention and good relationships with local authorities. We expect Danhos to continue developing landmark properties in Mexico's most important cities, and to capitalize on this by having strong pricing power and top-tier leasing contracts.
Iochpe-Maxion – Buy
Iochpe manufactures and produces steel and aluminium wheels, and structural components through strategically positioned industrial plants worldwide (which somewhat facilitates negotiation with OEMs). The company is positioned to benefit from a healthy scenario, combining exposure to solid markets (with very good growth potential in emerging markets) and a global presence (mitigating and diversifying the risks of growth). Iochpe has a well-balanced revenue exposure to light (50%) and heavy vehicles (45%), as well as railways (5%). The solid business model and our Buy rating are supported by: (1) its large scale (well-balanced revenue distribution); (2) well mixed exposure worldwide; (3) a proven track record; and (4) a leading position as a producer of wheels.
UBS analyst: Marimar Torreblanca
UBS analyst: Rodrigo Fernandes

Q-Series® 13 April 2015
27
Figure 46: LatAm – best-ranked governance stocks – valuation criteria
Company Country Stock price
(l.c.)
UBS PT
(l.c.)
UBS
rating
Market
cap
(local m)
Net debt/
EBITDA
2015E
Stock perf.
12m
Stock perf.
YTD
Adj. P/E
2015E
EV/EBITDA
2015E
Div. yield
2015E
Grupo Comercial Chedraui MX 47.5 44.0 Sell 45796 -0.9 22.9 13.1 23.4 9.8 0.4
Hypermarcas S.A. BR 21.6 19.5 Neutral 13622 -2.5 31.7 31.1 24.6 13.3 0.0
Fibra Danhos MX 36.5 42.0 Buy 53137 2.3 38.2 0.4 24.5 31.2 5.3
Porto Seguro BR 36.8 37.5 Buy 11882 - 19.1 19.5 12.0 - 5.0
Iochpe-Maxion BR 11.5 15.0 Buy 1091 -3.2 -46.9 -4.9 14.0 5.2 2.7
LALA MX 30.2 32.0 Neutral 74678 1.3 10.2 5.7 22.5 11.9 1.7
Fibra Shop MX 17.5 19.0 Neutral 9175 -0.1 5.4 -9.6 14.6 17.3 5.8
Organizacion Soriana MX 39.4 34.0 Sell 70902 0.2 -4.3 -3.7 18.6 8.9 0.8
Banregio MX 82.5 84.0 Neutral 27048 - 9.6 11.5 15.2 - 1.6
Source: UBS estimates. Note: Price data as of 9th April 2015
US Top picks US
Fortinet (FTNT) – Buy
Our Buy rating reflects the following positives for FTNT: (1) it has a long runway ahead, with only a mid- to high-single-digit market share of a $10bn network security market, and it should continue to take share from weak competitors (CSCO/JNPR = $2bn revenue opportunity), given its hardware-centric approach to security appeals to verticals, such as telecom and the small and medium business (SMB) segment; (2) large 4G/LTE telecom upgrade opportunity; (3) security is a high IT budget priority; (4) valuation versus the security peer group is at a significant discount on a relative basis; and (5) it is a potential beneficiary of sector consolidation. The risks include: (1) sizeable service provider vertical exposure; (2) the desire to continue pushing into enterprise could be met with fiercer competition and may limit market share gains outside telecom; and (3) it is behind the curve on virtual solutions wanted by enterprises (and potential industry consolidators).
Installed Building Products (IBP) – Buy
In our view, IBP is well positioned to benefit from an improving housing market, as it leverages company- and industry-specific benefits. Specifically, we note: (1) the installation of insulation is an attractive industry, given the need for local market knowledge and the low cost relative to the homebuilding process; (2) IBP is the second biggest player in the space, affording it significant purchasing advantages; and (3) the company's robust liquidity and successful M&A track record offer protection against volatility in the housing recovery. As such, we view the current valuation as an attractive entry point.
UBS analyst: Brent Thill
UBS analyst: David Goldberg

Q-Series® 13 April 2015
28
Figure 47: US – best-ranked governance stocks – valuation criteria
Company Country Stock price
(l.c.)
UBS PT
(l.c.) UBS rating
Market cap
(local m)
Net debt/
EBITDA
2015E
Stock perf.
12m
Stock perf.
YTD
Adj. P/E
2015E
EV/EBITDA
2015E
Div. yield
2015E
Fortinet Inc US 34.49 37.0 Buy 5705.99 4.0 48.0 12.5 66.5 30.5 0.0
Installed Building Products US 22.74 21.0 Buy 501.05 -0.7 71.8 27.6 22.7 7.8 0.0
Norcraft Companies US 25.65 25.5 Neutral (CBE) 406.04 -2.4 45.3 32.9 21.4 8.2 0.0
Greenlight Capital Re Ltd US 31.24 41.0 Buy 1167.90 - -2.7 -4.3 7.0 - 0.0
Quotient Limited US 17 25.0 Buy 17 0.6 - -5.6 -8.0 -1.2 0.0
Frank's International US 19.06 18.0 Neutral 3965.91 -1.0 -23.4 14.6 23.3 13.1 1.6
Paramount Group Inc US 18.91 20.0 Neutral 4985.64 0.0 - 1.7 -57.3 25.0 2.1
Mattress Firm Holding Corp US 68.35 73.0 Buy 2338.62 -1.6 46.3 17.7 25.8 16.5 0.0
IAC InterActive US 72.52 70.0 Buy 6518.68 0.1 2.7 19.3 21.9 12.0 1.9
Taubman Centers Inc US 75.05 77.0 Neutral 4882.45 -5.4 5.1 -1.8 33.3 17.1 3.0
Source: UBS estimates. Price data as of 9th April 2015.
Q-Series® 13 April 2015
29
Appendix
Q-Series® 13 April 2015
30
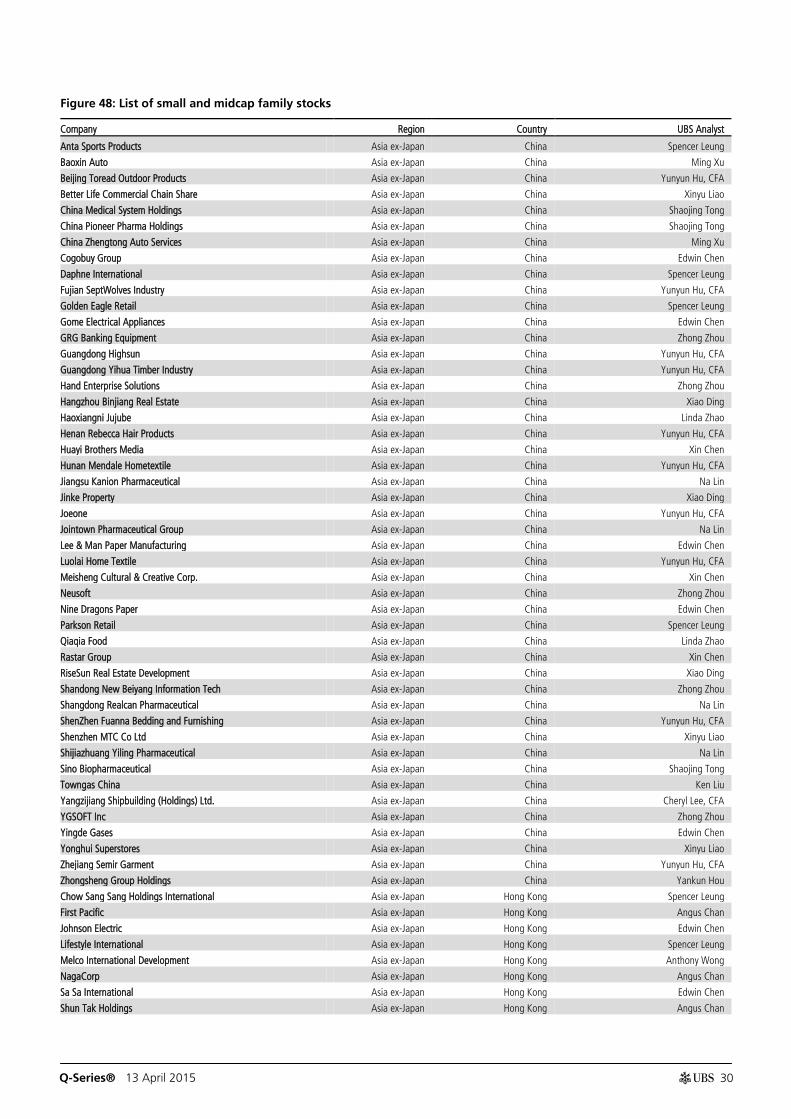
Figure 48: List of small and midcap family stocks
Company Region Country UBS Analyst
Anta Sports Products Asia ex-Japan China Spencer Leung
Baoxin Auto Asia ex-Japan China Ming Xu
Beijing Toread Outdoor Products Asia ex-Japan China Yunyun Hu, CFA
Better Life Commercial Chain Share Asia ex-Japan China Xinyu Liao
China Medical System Holdings Asia ex-Japan China Shaojing Tong
China Pioneer Pharma Holdings Asia ex-Japan China Shaojing Tong
China Zhengtong Auto Services Asia ex-Japan China Ming Xu
Cogobuy Group Asia ex-Japan China Edwin Chen
Daphne International Asia ex-Japan China Spencer Leung
Fujian SeptWolves Industry Asia ex-Japan China Yunyun Hu, CFA
Golden Eagle Retail Asia ex-Japan China Spencer Leung
Gome Electrical Appliances Asia ex-Japan China Edwin Chen
GRG Banking Equipment Asia ex-Japan China Zhong Zhou
Guangdong Highsun Asia ex-Japan China Yunyun Hu, CFA
Guangdong Yihua Timber Industry Asia ex-Japan China Yunyun Hu, CFA
Hand Enterprise Solutions Asia ex-Japan China Zhong Zhou
Hangzhou Binjiang Real Estate Asia ex-Japan China Xiao Ding
Haoxiangni Jujube Asia ex-Japan China Linda Zhao
Henan Rebecca Hair Products Asia ex-Japan China Yunyun Hu, CFA
Huayi Brothers Media Asia ex-Japan China Xin Chen
Hunan Mendale Hometextile Asia ex-Japan China Yunyun Hu, CFA
Jiangsu Kanion Pharmaceutical Asia ex-Japan China Na Lin
Jinke Property Asia ex-Japan China Xiao Ding
Joeone Asia ex-Japan China Yunyun Hu, CFA
Jointown Pharmaceutical Group Asia ex-Japan China Na Lin
Lee & Man Paper Manufacturing Asia ex-Japan China Edwin Chen
Luolai Home Textile Asia ex-Japan China Yunyun Hu, CFA
Meisheng Cultural & Creative Corp. Asia ex-Japan China Xin Chen
Neusoft Asia ex-Japan China Zhong Zhou
Nine Dragons Paper Asia ex-Japan China Edwin Chen
Parkson Retail Asia ex-Japan China Spencer Leung
Qiaqia Food Asia ex-Japan China Linda Zhao
Rastar Group Asia ex-Japan China Xin Chen
RiseSun Real Estate Development Asia ex-Japan China Xiao Ding
Shandong New Beiyang Information Tech Asia ex-Japan China Zhong Zhou
Shangdong Realcan Pharmaceutical Asia ex-Japan China Na Lin
ShenZhen Fuanna Bedding and Furnishing Asia ex-Japan China Yunyun Hu, CFA
Shenzhen MTC Co Ltd Asia ex-Japan China Xinyu Liao
Shijiazhuang Yiling Pharmaceutical Asia ex-Japan China Na Lin
Sino Biopharmaceutical Asia ex-Japan China Shaojing Tong
Towngas China Asia ex-Japan China Ken Liu
Yangzijiang Shipbuilding (Holdings) Ltd. Asia ex-Japan China Cheryl Lee, CFA
YGSOFT Inc Asia ex-Japan China Zhong Zhou
Yingde Gases Asia ex-Japan China Edwin Chen
Yonghui Superstores Asia ex-Japan China Xinyu Liao
Zhejiang Semir Garment Asia ex-Japan China Yunyun Hu, CFA
Zhongsheng Group Holdings Asia ex-Japan China Yankun Hou
Chow Sang Sang Holdings International Asia ex-Japan Hong Kong Spencer Leung
First Pacific Asia ex-Japan Hong Kong Angus Chan
Johnson Electric Asia ex-Japan Hong Kong Edwin Chen
Lifestyle International Asia ex-Japan Hong Kong Spencer Leung
Melco International Development Asia ex-Japan Hong Kong Anthony Wong
NagaCorp Asia ex-Japan Hong Kong Angus Chan
Sa Sa International Asia ex-Japan Hong Kong Edwin Chen
Shun Tak Holdings Asia ex-Japan Hong Kong Angus Chan

Q-Series® 13 April 2015
31
VTech Asia ex-Japan Hong Kong Edwin Chen
Apollo Hospitals Enterprise Asia ex-Japan India Hemant Bakhru
Britannia Industries Asia ex-Japan India Sunita Sachdev
Cadila Healthcare Asia ex-Japan India Hemant Bakhru
Cipla Ltd. Asia ex-Japan India Hemant Bakhru
Dr. Reddy's Labs Asia ex-Japan India Hemant Bakhru
Emami Ltd Asia ex-Japan India Sunita Sachdev
Glenmark Pharmaceuticals Asia ex-Japan India Hemant Bakhru
Godrej Properties Asia ex-Japan India Ashish Jagnani
Ipca Laboratories Asia ex-Japan India Hemant Bakhru
Lupin Limited Asia ex-Japan India Hemant Bakhru
Marico Ltd Asia ex-Japan India Sunita Sachdev
Oberoi Realty Asia ex-Japan India Ashish Jagnani
Phoenix Mills Asia ex-Japan India Ashish Jagnani
Ranbaxy Asia ex-Japan India Hemant Bakhru
Sun Pharmaceuticals Industries Limited Asia ex-Japan India Hemant Bakhru
Torrent Pharmaceuticals Asia ex-Japan India Hemant Bakhru
Ace Hardware Indonesia Asia ex-Japan Indonesia Adrian Joezer
Global Mediacom Tbk PT Asia ex-Japan Indonesia Adrian Joezer
Matahari Department Store Asia ex-Japan Indonesia Adrian Joezer
Media Nusantara Citra Asia ex-Japan Indonesia Adrian Joezer
Mitra Adiperkasa Tbk, PT Asia ex-Japan Indonesia Adrian Joezer
Ramayana Lestari Sentosa Asia ex-Japan Indonesia Adrian Joezer
Sumber Alfaria Trijaya Asia ex-Japan Indonesia Adrian Joezer
Surya Citra Media Tbk Asia ex-Japan Indonesia Adrian Joezer
CJ O Shopping Asia ex-Japan Korea Jennifer Han
E-mart Asia ex-Japan Korea Jennifer Han
Eugene Technology Asia ex-Japan Korea Nicolas Gaudois
Hyundai Department Store Asia ex-Japan Korea Jennifer Han
KH Vatec Asia ex-Japan Korea Bonil Koo
Nexen Tire Asia ex-Japan Korea Josh Bae
Orion Corp. Asia ex-Japan Korea Jennifer Han
Partron Co Ltd Asia ex-Japan Korea Bonil Koo
Shinsegae Asia ex-Japan Korea Jennifer Han
Wonik IPS Asia ex-Japan Korea Nicolas Gaudois
7-Eleven Malaysia Holdings Asia ex-Japan Malaysia Nicole Goh
Berjaya Food Bhd Asia ex-Japan Malaysia Nicole Goh
Berjaya Sports Toto Asia ex-Japan Malaysia Nicole Goh
Bumi Armada Asia ex-Japan Malaysia Nicole Goh
Dialog Group Asia ex-Japan Malaysia Nicole Goh
Mah Sing Asia ex-Japan Malaysia Edwin Siow
Nirvana Asia Asia ex-Japan Malaysia Edwin Siow
SapuraKencana Petroleum Asia ex-Japan Malaysia Nicole Goh
Top Glove Asia ex-Japan Malaysia Nicole Goh
WCT Berhad Asia ex-Japan Malaysia Edwin Siow
YTL Asia ex-Japan Malaysia Edwin Siow
YTL Power International Asia ex-Japan Malaysia Edwin Siow
DMCI Holdings Asia ex-Japan Philippines Karen Hizon
Globe Telecom Asia ex-Japan Philippines Karen Hizon
OUE Limited Asia ex-Japan Singapore Robin Xie
UOL Group Asia ex-Japan Singapore Michael Lim
Yoma Strategic Holdings Asia ex-Japan Singapore Robin Xie
China Life Insurance (Taiwan) Asia ex-Japan Taiwan Kelvin Chu, CFA
EVA Air Asia ex-Japan Taiwan Tiffany Chen
Evergreen Marine Asia ex-Japan Taiwan Tiffany Chen
Shin Kong Financial Holding Asia ex-Japan Taiwan Kelvin Chu, CFA
SinoPac Financial Holding Asia ex-Japan Taiwan Kelvin Chu, CFA
Taishin Financial Holding Asia ex-Japan Taiwan Kelvin Chu, CFA

Q-Series® 13 April 2015
32
Yang Ming Marine Asia ex-Japan Taiwan Tiffany Chen
Yuanta Financial Holding Asia ex-Japan Taiwan Kelvin Chu, CFA
Amata Corporation Asia ex-Japan Thailand Thomas Philippson, CA
BEC World Asia ex-Japan Thailand Youssef Abboud
Central Pattana Asia ex-Japan Thailand Thomas Philippson, CA
Hemaraj Land and Development Asia ex-Japan Thailand Thomas Philippson, CA
Land & Houses Asia ex-Japan Thailand Thomas Philippson, CA
Pruksa Real Estate Asia ex-Japan Thailand Thomas Philippson, CA
Quality Houses Public Co Ltd Asia ex-Japan Thailand Thomas Philippson, CA
Robinson Department Store Asia ex-Japan Thailand Youssef Abboud
Supalai PCL Asia ex-Japan Thailand Thomas Philippson, CA
Thai Union Frozen Products Asia ex-Japan Thailand Youssef Abboud
Domino's Pizza Australia Australia Han Xu
OrotonGroup Limited Australia Australia Jordan Rogers, CFA
Servcorp Limited Australia Australia Doug Macphillamy
Super Retail Group Ltd Australia Australia Ben Gilbert
Technology One Australia Australia Han Xu
Zumtobel Group AG Europe Austria Sven Weier
Groupe Bruxelles Lambert SA Europe Belgium Denis Moreau
BIC Group Europe France Denis Moreau
Eurazeo Europe France Denis Moreau
FFP Europe France Denis Moreau
SEB Europe France Denis Moreau
Wendel Europe France Denis Moreau
Krones Europe Germany Sven Weier
Autogrill Europe Italy Bosco Ojeda
Moncler Spa Europe Italy Fred Speirs
Salvatore Ferragamo SPA Europe Italy Fred Speirs
Tod's Europe Italy Fred Speirs
Orkla Europe Norway David Hallden
NOS, SGPS, S.A. Europe Portugal Bosco Ojeda
Bankinter Europe Spain Ignacio Sanz, CFA
Catalana Occidente Europe Spain Ignacio Sanz, CFA
Ebro Foods Europe Spain Bosco Ojeda
Laboratorios Farmacéuticos Rovi Europe Spain Guillaume van Renterghem
Melia Hotels Europe Spain Bosco Ojeda
OHL Europe Spain Bosco Ojeda
Prosegur Europe Spain Bosco Ojeda
Viscofan Europe Spain Bosco Ojeda
Electrolux B Europe Sweden David Hallden
Husqvarna Europe Sweden David Hallden
Investment AB Kinnevik Europe Sweden David Hallden
Investor AB Europe Sweden David Hallden
Ratos Europe Sweden David Hallden
Bachem Europe Switzerland Andre Rudolf von Rohr
Barry Callebaut Europe Switzerland Joern Iffert, CFA
Belimo Europe Switzerland Torsten Wyss
Bucher Industries AG Europe Switzerland Andre Rudolf von Rohr
Huber+Suhner Europe Switzerland Andre Rudolf von Rohr
Kaba Europe Switzerland Torsten Wyss
Kudelski Europe Switzerland Joern Iffert, CFA
Phoenix Mecano Europe Switzerland Joern Iffert, CFA
Schindler Europe Switzerland Torsten Wyss
SFS Group AG Europe Switzerland Andre Rudolf von Rohr
Adastria Holdings Japan Japan Nozomi Moriya
Asahi Japan Japan Nozomi Moriya
CyberAgent Japan Japan Sumito Takeda
Daiichikosho Japan Japan Mariko Watanabe

Q-Series® 13 April 2015
33
FP Japan Japan Mariko Watanabe
GMO Internet Japan Japan Sumito Takeda
Gree Inc Japan Japan Sumito Takeda
Hikari Tsushin Japan Japan Mariko Watanabe
Kanamoto Japan Japan Mariko Watanabe
Koshidaka Holdings Japan Japan Mariko Watanabe
mixi Japan Japan Sumito Takeda
Park24 Japan Japan Mariko Watanabe
Resorttrust Japan Japan Mariko Watanabe
SAC'S BAR HOLDINGS Japan Japan Mariko Watanabe
Sanwa Holdings Japan Japan Mariko Watanabe
Seria Japan Japan Mariko Watanabe
Sugi Holdings Japan Japan Nozomi Moriya
Xebio Japan Japan Nozomi Moriya
Companhia Siderurgica Nacional US & Latam Brazil Andreas Bokkenheuser
Gerdau US & Latam Brazil Andreas Bokkenheuser
Hypermarcas S.A. US & Latam Brazil Gustavo Oliveira, CFA
Iochpe-Maxion US & Latam Brazil Rodrigo Fernandes
Minerva Foods US & Latam Brazil Alan Alanis
Porto Seguro US & Latam Brazil Mariana Taddeo
Randon US & Latam Brazil Rodrigo Fernandes
SulAmerica US & Latam Brazil Mariana Taddeo
Bombardier US & Latam Canada Darryl Genovesi
Alsea US & Latam Mexico Marimar Torreblanca, CFA
Banregio US & Latam Mexico Frederic De Mariz
Fibra Danhos US & Latam Mexico Marimar Torreblanca, CFA
Fibra Shop US & Latam Mexico Marimar Torreblanca, CFA
GRUMA US & Latam Mexico Alan Alanis
Grupo Comercial Chedraui, S.A.B. de C.V. US & Latam Mexico Gustavo Oliveira, CFA
Grupo Mexico US & Latam Mexico Andreas Bokkenheuser
LALA US & Latam Mexico Alan Alanis
Organizacion Soriana US & Latam Mexico Gustavo Oliveira, CFA
Ternium SA US & Latam Mexico Andreas Bokkenheuser
Avianca US & Latam Panama Rodrigo Fernandes
AMC Networks Inc US & Latam United States Doug Mitchelson
Cablevision Systems US & Latam United States John Hodulik, CFA
Fortinet Inc US & Latam United States Brent Thill
Frank's International US & Latam United States Angie Sedita
hhgregg, Inc. US & Latam United States Michael Lasser
IAC InterActive US & Latam United States Eric Sheridan
Installed Building Products US & Latam United States David Goldberg
Life Time Fitness, Inc. US & Latam United States Michael Lasser
Mattress Firm Holding Corp US & Latam United States Michael Lasser
Norcraft Companies US & Latam United States Susan Maklari
Paramount Group, Inc. US & Latam United States Ross Nussbaum
Paramount Group, Inc. US & Latam United States Ross Nussbaum
Quotient Limited US & Latam United States Andrew Peters
Sonic Automotive Inc. US & Latam United States Colin Langan, CFA
Taubman Centers, Inc. US & Latam United States Jeremy Metz
Urban Outfitters Inc. US & Latam United States Roxanne Meyer, CFA
Zynga US & Latam United States Eric Sheridan Source: UBS
Q-Series®
13 April 2015
34
Figure 49: Review of the academic literature on family firms
Authors Year of
publication Period covered
Number of
companies Geography Definition of family firm Other variable tested
Performance
variable
UBS Summary - Main
conclusions Title Published in
Miller et al 2007 1996-2000 896 US – Fortune
1000 firms
Family firm, first or second
generation, with a lone founder
(defined as having no relatives
in the business). Condition:
Insiders or large owners (5% or
more)
- Market based:
Tobin's Q
Higher (industry-adjusted)
valuations of lone founder
business, i.e. without
relatives associated with
their firms
Are family-firms really
superior performers? Journal of Corporate Finance
Feldman,
Amit,
Villalonga
2013 1994-2010 2110 US
A company founder or member
of his family is an officer,
director or block holder.
Distinction between family CEO
(founder or descendant) and
non-family CEO
Propensity of family
business to divest and
relative value
afterwards
Abnormal returns
after divestment
Family-owned company
less likely to divest, but
market reaction to
divestment more positive,
especially when family
managed
Corporate divestiture
and family control Strategic Management Journal
Essen, Carney,
Gedajlovic 2011
Meta-analysis -
55 studies
187,999 firm year
observations US
Multiple. Distinction between
control from the first
generation versus later
generations
Propensity to engage
in diversification,
international ventures,
and take on debt
Multiple
Family firms (FF)
outperform (both on
market and accounting
measures), but it is not
stable across generations.
Family firms engage in
fewer international
ventures, hold less debt
and diversify less.
Discount for successor
generation FF (less risk
taking, less R&D
investment, more
governance mechanisms
to entrench family
control)
Do US publicly-listed
family firms differ?
Does it matter? A
meta-analysis
Corporate Governance: An
International Review

Q-Series®
13 April 2015
35
Authors Year of
publication Period covered
Number of
companies Geography Definition of family firm Other variable tested
Performance
variable
UBS Summary - Main
conclusions Title Published in
Villalonga,
Amit 2005 1994-2000 Fortune 500 US
Founder or a member of the
family is an officer, director or
block holder (defined by SEC
reporting requirements –
change the condition with 20%
of the vote). Distinction
between founder-run family
firms and run by later
generations
Control in excess of
ownership Tobin's Q
Family control in excess of
ownership reduces value.
Family management turns
into a premium when the
founder serves as the CEO
or chairman. It turns into
a discount when
descendants serve as
chairman or CEO
How do family
ownership, control
and management
affect firm value?
Journal of Financial Economics
Weisskopf 2010 2003-2008 188 Swiss-listed
companies
Founding family controlling
more than 50% of the vote or
between 20% and 50%.
Distinction between family CEO
or not and first or later
generations
Pay-out policies ROIC, Tobin's Q
(control variables)
Founding family firms are
likely to pay higher
dividends than non-family
firms, but not at the
founder stage. Dual share
classes do not influence
pay-out
Do not wake sleeping
dogs: Pay-out policies
in founding family
firms
Working paper – Université de
Fribourg
Weisskopf,
Isakov 2012 2003-2010 185
Swiss-listed
firms
Founding family controlling
more than 50% of the vote or
between 20% and 50%.
Distinction between family
CEO/chairman or outsider, and
whether multiple individuals
and generations
Level of control ROA, Tobin's Q
Founding family firms are
more profitable, both for
a lone founder and
descendants (if there are
no multiple founders or
family members actively
involved).
Are founding families
special block holders? Journal of Banking and Finance
Adams,
Almeida,
Ferreira
2005 1992-1999 Fortune 500 US Focus on founder CEO
ROA, Tobin's Q
Past accounting
performance increases the
likelihood that founder
CEOs will step out.
Understanding the
relationship between
founder CEOs and
firm performance
Journal of Empirical Finance

Q-Series®
13 April 2015
36
Authors Year of
publication Period covered
Number of
companies Geography Definition of family firm Other variable tested
Performance
variable
UBS Summary - Main
conclusions Title Published in
Anderson,
Duru, Reeb 2008 2001-2003 2000
US, excluding
financial firms
and public
utilities
Family with a presence as a
shareholder, top-level
manager, director or chairman
of the board. Distinction
between founders and heirs
Opacity: Trading
volume, bid-ask
spread, analyst
following and analyst
forecast error
ROA, Tobin's Q
Only founder or heir firms
characterised as
transparent receive a
valuation premium
Founders, heirs, and
corporate opacity in
the US
Journal of Financial Economics
Li, Srinivasan 2011 1996-2004 S&P500, 400 mid-
cap, 600 smallcaps US
Focus on founders that are
directors
M&A activity, CEO
turnover, sensitivity of
pay to performance,
directors' attendance
Firms with founder
director tend to have
higher CEO pay-to-
performance sensitivity,
and the CEOs of these
firms face higher turnover
pressure, higher director
attendance
Corporate
governance when
founders are directors
Journal of Financial Economics
Sraer,
Thesmar 2007 1994-2000 700 France
When the founder or a member
of his family is a blockholder
with more than 20% of the
voting rights. Founders, heirs
or professionally managed
Labour productivity,
wages
Many including
ROA, ROE, P/B
Outperformance of family-
run firms on ROA and
ROE, even with heir
CEOs. Premium for
founder-led family firms.
Professional CEOs better
at acquisitions than heirs
Performance and
behaviour of family
firms: Evidence from
the French stock
market
Journal of the European
Economic Association
Boyle, Pollack,
Rutherford 2012 78 studies 80,421 sample size
Meta-analysis
No relationship between
governance and
performance
Journal of Business Venturing
Wang, Zhou
2006-2010 658
US, UK,
Germany,
France, Italy
Four types: Founder or heir
firms (CEO, blockholder >5%
or board members), family
owned (10% ownership
through another vehicle);
leader/owner (with at least 5%
stake)
Operating ROA;
Tobin's Q
Founder firms are better
performers in terms of
operating profitability
during a financial crisis.
Less investment during a
crisis from family firms
Are family-firms
better performers
during the financial
crisis?
SSRN
Source: UBS

Q-Series® 13 April 2015
37
Statement of Risk
There are risks in investing in equities, and smallcaps may entail high specific risks linked to external factors such as the macro performance, financial risks, country risk and specific stock risks that could be subject to uncertain returns. The immediate risk in relation to the subject matter covered by UBS's Global Sustainability Team arises from the lack of definition in the field, reflected in the many names and acronyms in use by practitioners: Sustainability; Responsible Investment (RI); Socially Responsible Investment (SRI); ESG (Environmental, Social and Governance) Investment; Ethical Investing, Impact Investing, and so on. The field covers an enormous range of potential issues, and, over time, their importance fluctuates. At the time of writing, we believe the issues raised in this research to be relevant to investors, but this may change. Additionally, this research should not be read as a complete or definitive account of all relevant issues for firms. Although we attempt to address all significant or nascent issues, these may not always be apparent, and these may change over time. Finally, this document should not be interpreted to mean that all the issues addressed in our research have a financial impact. Whether or not environmental, social and governance issues have a financial impact remains an open question as there is no accepted financial model that can determine whether any given issue - ESG or otherwise - is already reflected in share prices.

Q-Series® 13 April 2015
38
Required Disclosures
This report has been prepared by UBS Limited, an affiliate of UBS AG. UBS AG, its subsidiaries, branches and affiliates are referred to herein as UBS.
For information on the ways in which UBS manages conflicts and maintains independence of its research product; historical performance information; and certain additional disclosures concerning UBS research recommendations, please visit www.ubs.com/disclosures. The figures contained in performance charts refer to the past; past performance is not a reliable indicator of future results. Additional information will be made available upon request. UBS Securities Co. Limited is licensed to conduct securities investment consultancy businesses by the China Securities Regulatory Commission.
Analyst Certification: Each research analyst primarily responsible for the content of this research report, in whole or in part, certifies that with respect to each security or issuer that the analyst covered in this report: (1) all of the views expressed accurately reflect his or her personal views about those securities or issuers and were prepared in an independent manner, including with respect to UBS, and (2) no part of his or her compensation was, is, or will be, directly or indirectly, related to the specific recommendations or views expressed by that research analyst in the research report.
UBS Investment Research: Global Equity Rating Definitions
12-Month Rating Definition Coverage1 IB Services2
Buy FSR is > 6% above the MRA. 45% 37%
Neutral FSR is between -6% and 6% of the MRA. 43% 33%
Sell FSR is > 6% below the MRA. 12% 20%
Short-Term Rating Definition Coverage3 IB Services4
Buy Stock price expected to rise within three months from the time the rating was assigned because of a specific catalyst or event. less than 1% less than 1%
Sell Stock price expected to fall within three months from the time the rating was assigned because of a specific catalyst or event. less than 1% less than 1%
Source: UBS. Rating allocations are as of 31 March 2015. 1:Percentage of companies under coverage globally within the 12-month rating category. 2:Percentage of companies within the 12-month rating category for which investment banking (IB) services were provided within the past 12 months. 3:Percentage of companies under coverage globally within the Short-Term rating category. 4:Percentage of companies within the Short-Term rating category for which investment banking (IB) services were provided within the past 12 months.
KEY DEFINITIONS: Forecast Stock Return (FSR) is defined as expected percentage price appreciation plus gross dividend yield over the next 12 months. Market Return Assumption (MRA) is defined as the one-year local market interest rate plus 5% (a proxy for, and not a forecast of, the equity risk premium). Under Review (UR) Stocks may be flagged as UR by the analyst, indicating that the stock's price target and/or rating are subject to possible change in the near term, usually in response to an event that may affect the investment case or valuation. Short-Term Ratings reflect the expected near-term (up to three months) performance of the stock and do not reflect any change in the fundamental view or investment case. Equity Price Targets have an investment horizon of 12 months.
EXCEPTIONS AND SPECIAL CASES: UK and European Investment Fund ratings and definitions are: Buy: Positive on factors such as structure, management, performance record, discount; Neutral: Neutral on factors such as structure, management, performance record, discount; Sell: Negative on factors such as structure, management, performance record, discount. Core Banding Exceptions (CBE): Exceptions to the standard +/-6% bands may be granted by the Investment Review Committee (IRC). Factors considered by the IRC include the stock's volatility and the credit spread of the respective company's debt. As a result, stocks deemed to be very high or low risk may be subject to higher or lower bands as they relate to the rating. When such exceptions apply, they will be identified in the Company Disclosures table in the relevant research piece.
Research analysts contributing to this report who are employed by any non-US affiliate of UBS Securities LLC are not registered/qualified as research analysts with the NASD and NYSE and therefore are not subject to the restrictions contained in the NASD and NYSE rules on communications with a subject company, public appearances, and trading securities held by a research analyst account. The name of each affiliate and analyst employed by that affiliate contributing to this report, if any, follows.
UBS Limited: Hubert Jeaneau, CFA; Julie Hudson, CFA. UBS Securities España SV, SA: Bosco Ojeda. UBS Securities Japan Co., Ltd.: Mariko Watanabe. UBS Securities Australia Ltd: Martin Byers.
Q-Series® 13 April 2015
39
Company Disclosures
Company Name Reuters 12-month
rating Short-term
rating Price Price date
Bachem5 BANB.S Neutral N/A CHF53.00 10 Apr
2015
Banregio16a GFREGIOO.MX Neutral N/A P82.09 10 Apr
2015
Baoxin Auto 1293.HK Buy N/A HK$4.96 13 Apr
2015
Belimo5 BEAN.S Neutral N/A CHF2,220.00 10 Apr
2015
BIC Group BICP.PA Neutral N/A €144.25 10 Apr
2015
Bucher Industries AG5 BUCN.S Neutral N/A CHF246.50 10 Apr
2015
Central Pattana CPN.BK Neutral N/A Bt44.50 10 Apr
2015
China Life Insurance (Taiwan) 2823.TW Buy N/A NT$29.00 13 Apr
2015
CyberAgent 4751.T Buy N/A ¥6,780 13 Apr
2015
Daiichikosho 7458.T Buy N/A ¥4,110 13 Apr
2015
Dialog Group DIAL.KL Neutral N/A RM1.60 13 Apr
2015
Ebro Foods EBRO.MC Buy N/A €18.04 10 Apr
2015
Electrolux B ELUXb.ST Sell N/A SKr234.10 10 Apr
2015
Eurazeo5 EURA.PA Buy N/A €67.45 10 Apr
2015
Fibra Danhos5 DANHOS13.MX Buy N/A P36.26 10 Apr
2015
Fibra Shop FSHOP13.MX Neutral N/A P17.35 10 Apr
2015
Fortinet Inc4, 5, 6a, 6b, 7, 16c FTNT.O Buy N/A US$35.62 10 Apr
2015
Frank's International5, 16c FI.N Neutral N/A US$19.30 10 Apr
2015
Globe Telecom GLO.PS Sell N/A P2,220.00 13 Apr
2015
GMO Internet 9449.T Buy N/A ¥1,652 13 Apr
2015
Greenlight Capital Re Ltd6b, 7, 16c, 18 GLRE.O Buy N/A US$30.91 10 Apr
2015
Groupe Bruxelles Lambert SA5 GBLB.BR Buy N/A €80.03 10 Apr
2015
Grupo Comercial Chedraui, S.A.B. de C.V.16a
CHDRAUIB.MX Sell N/A P50.16 10 Apr
2015
Hikari Tsushin 9435.T Buy N/A ¥8,770 13 Apr
2015
Huayi Brothers Media 300027.SZ Buy N/A Rmb34.48 13 Apr
2015
Q-Series® 13 April 2015
40
Company Name Reuters 12-month
rating Short-term
rating Price Price date
Huber+Suhner5 HUBN.S Neutral N/A CHF44.40 10 Apr
2015
Hypermarcas S.A. HYPE3.SA Neutral N/A R$21.44 10 Apr
2015
IAC InterActive16c IACI.O Buy N/A US$72.54 10 Apr
2015
Imerys IMTP.PA Buy N/A €72.09 10 Apr
2015
Installed Building Products2, 4, 5, 6a, 13, 16c IBP.N Buy N/A US$22.44 10 Apr
2015
Iochpe-Maxion MYPK3.SA Buy N/A R$11.60 10 Apr
2015
Koninklijke Philips N.V5, 16c PHG.AS Neutral N/A €27.38 10 Apr
2015
Laboratorios Farmacéuticos Rovi ROVI.MC Neutral N/A €16.32 10 Apr
2015
Lafarge3b, 3c, 3d, 4 LAFP.PA Neutral N/A €63.01 10 Apr
2015
LALA LALAB.MX Neutral N/A P30.46 10 Apr
2015
Land & Houses LH.BK Buy N/A Bt9.90 10 Apr
2015
Marico Ltd MRCO.BO Suspended N/A Rs402.65 13 Apr
2015
Mattress Firm Holding Corp2, 4, 5, 6a, 16c MFRM.O Buy N/A US$67.89 10 Apr
2015
Meisheng Cultural & Creative Corp. 002699.SZ Buy N/A Rmb25.67 13 Apr
2015
Moncler Spa2, 4 MONC.MI Buy N/A €16.25 10 Apr
2015
NagaCorp5 3918.HK Buy N/A HK$6.12 13 Apr
2015
Norcraft Companies5, 16c, 19 NCFT.N Neutral (CBE) N/A US$25.73 10 Apr
2015
Organizacion Soriana SORIANAB.MX Sell N/A P38.90 10 Apr
2015
OSRAM Licht AG4, 5, 16b OSRn.DE Sell N/A €47.28 10 Apr
2015
Paramount Group, Inc.2, 4, 5, 6a, 16c PGRE.N Neutral N/A US$18.67 10 Apr
2015
Pargesa Holding2, 4, 5 PARG.S Buy N/A CHF70.40 10 Apr
2015
Pernod Ricard4 PERP.PA Buy N/A €113.95 10 Apr
2015
Porto Seguro2 PSSA3.SA Buy N/A R$36.74 10 Apr
2015
Quotient Limited2, 4, 5, 6a, 16c QTNT.O Buy N/A US$16.01 10 Apr
2015
Ratos RATOb.ST Buy N/A SKr62.50 10 Apr
2015
RiseSun Real Estate Development 002146.SZ Neutral N/A Rmb23.40 13 Apr
2015

Q-Series® 13 April 2015
41
Company Name Reuters 12-month
rating Short-term
rating Price Price date
Sa Sa International 0178.HK Sell N/A HK$4.06 13 Apr
2015
Sanwa Holdings 5929.T Buy N/A ¥907 13 Apr
2015
Seria 2782.T Buy N/A ¥4,155 13 Apr
2015
SFS Group AG2, 4, 5 SFSN.S Buy N/A CHF72.00 10 Apr
2015
SGS4, 5, 13 SGSN.VX Neutral N/A CHF1,909.00 10 Apr
2015
Sino Biopharmaceutical 1177.HK Neutral N/A HK$9.37 13 Apr
2015
Sugi Holdings 7649.T Sell N/A ¥5,990 13 Apr
2015
Taubman Centers, Inc.16c TCO.N Neutral N/A US$74.93 10 Apr
2015
Thai Union Frozen Products1, 3a, 5 TUF.BK Buy N/A Bt20.90 10 Apr
2015
Top Glove TPGC.KL Buy N/A RM5.48 13 Apr
2015
TOTAL2, 4, 5, 16c TOTF.PA Neutral N/A €48.52 10 Apr
2015
UOL Group UTOS.SI Buy N/A S$7.73 13 Apr
2015
Wendel MWDP.PA Neutral N/A €116.20 10 Apr
2015
Zhongsheng Group Holdings 0881.HK Buy N/A HK$7.16 13 Apr
2015
Zumtobel Group AG ZUMV.VI Buy N/A €23.37 10 Apr
2015
Source: UBS. All prices as of local market close. Ratings in this table are the most current published ratings prior to this report. They may be more recent than the stock pricing date
1. UBS is acting as manager/co-manager, underwriter, placement or sales agent in regard to an offering of securities of this company/entity or one of its affiliates.
2. UBS AG, its affiliates or subsidiaries has acted as manager/co-manager in the underwriting or placement of securities of this company/entity or one of its affiliates within the past 12 months.
3a. UBS is acting as sole financial advisor to Thai Union Frozen Products PCL in relation to its US$1.5bn acquisition of Bumble Bee Foods LLC.
3b. UBS is advising Anglo American on the proposed sale of its 50% shareholding in Lafarge Tarmac 3c. UBS Limited is acting as equity advisor to Holcim on its merger with Lafarge 3d. UBS Limited is acting as financial advisor joint corporate broker to CRH Plc on the potential acquisition of certain
assets being disposed of by Lafarge and Holcim in advance of their proposed merger. 4. Within the past 12 months, UBS AG, its affiliates or subsidiaries has received compensation for investment banking
services from this company/entity. 5. UBS AG, its affiliates or subsidiaries expect to receive or intend to seek compensation for investment banking
services from this company/entity within the next three months. 6a. This company/entity is, or within the past 12 months has been, a client of UBS Securities LLC, and investment
banking services are being, or have been, provided. 6b. This company/entity is, or within the past 12 months has been, a client of UBS Securities LLC, and non-investment
banking securities-related services are being, or have been, provided. 7. Within the past 12 months, UBS Securities LLC has received compensation for products and services other than
investment banking services from this company/entity.
Q-Series® 13 April 2015
42
13. UBS AG, its affiliates or subsidiaries beneficially owned 1% or more of a class of this company`s common equity securities as of last month`s end (or the prior month`s end if this report is dated less than 10 days after the most recent month`s end).
16a. UBS Casa de Bolsa S.A. makes a market in the securities of this company. 16b. UBS Limited has entered into an arrangement to act as a liquidity provider and/or market maker in the financial
instruments of this company. 16c. UBS Securities LLC makes a market in the securities and/or ADRs of this company. 18. A U.S.-based global equity strategist, a member of his team, or one of their household members has a long
common stock position in Greenlight Capital Re Ltd. 19. Because this company is an announced takeout candidate, UBS believes the security presents lower-than-normal
risk. We have widened its rating band to +6%/-10% compared with +6%/-6%, respectively, under the normal rating system.
For a complete set of disclosure statements associated with the companies discussed in this report, including information on valuation and risk, please contact UBS Securities LLC, 1285 Avenue of Americas, New York, NY 10019, USA, Attention: Publishing Administration.
Unless otherwise indicated, please refer to the Valuation and Risk sections within the body of this report.

Q-Series® 13 April 2015
43
Global Disclaimer This document has been prepared by UBS Limited, an affiliate of UBS AG. UBS AG, its subsidiaries, branches and affiliates are referred to herein as UBS.
Global Research is provided to our clients through UBS Neo, the UBS Client Portal and UBS.com (each a "System"). It may also be made available through third party vendors and distributed by UBS and/or third parties via e-mail or alternative electronic means. The level and types of services provided by Global Research to a client may vary depending upon various factors such as a client's individual preferences as to the frequency and manner of receiving communications, a client's risk profile and investment focus and perspective (e.g. market wide, sector specific, long-term, short-term, etc.), the size and scope of the overall client relationship with UBS and legal and regulatory constraints.
When you receive Global Research through a System, your access and/or use of such Global Research is subject to this Global Research Disclaimer and to the terms of use governing the applicable System.
When you receive Global Research via a third party vendor, e-mail or other electronic means, your use shall be subject to this Global Research Disclaimer and to UBS's Terms of Use/Disclaimer (http://www.ubs.com/global/en/legalinfo2/disclaimer.html). By accessing and/or using Global Research in this manner, you are indicating that you have read and agree to be bound by our Terms of Use/Disclaimer. In addition, you consent to UBS processing your personal data and using cookies in accordance with our Privacy Statement (http://www.ubs.com/global/en/legalinfo2/privacy.html) and cookie notice (http://www.ubs.com/global/en/homepage/cookies/cookie-management.html).
If you receive Global Research, whether through a System or by any other means, you agree that you shall not copy, revise, amend, create a derivative work, transfer to any third party, or in any way commercially exploit any UBS research provided via Global Research or otherwise, and that you shall not extract data from any research or estimates provided to you via Global Research or otherwise, without the prior written consent of UBS.
For access to all available Global Research on UBS Neo and the Client Portal, please contact your UBS sales representative.
This document is for distribution only as may be permitted by law. It is not directed to, or intended for distribution to or use by, any person or entity who is a citizen or resident of or located in any locality, state, country or other jurisdiction where such distribution, publication, availability or use would be contrary to law or regulation or would subject UBS to any registration or licensing requirement within such jurisdiction. It is published solely for information purposes; it is not an advertisement nor is it a solicitation or an offer to buy or sell any financial instruments or to participate in any particular trading strategy. No representation or warranty, either expressed or implied, is provided in relation to the accuracy, completeness or reliability of the information contained in this document (‘the Information’), except with respect to Information concerning UBS. The Information is not intended to be a complete statement or summary of the securities, markets or developments referred to in the document. UBS does not undertake to update or keep current the Information. Any opinions expressed in this document may change without notice and may differ or be contrary to opinions expressed by other business areas or groups of UBS. Any statements contained in this report attributed to a third party represent UBS's interpretation of the data, information and/or opinions provided by that third party either publicly or through a subscription service, and such use and interpretation have not been reviewed by the third party.
Nothing in this document constitutes a representation that any investment strategy or recommendation is suitable or appropriate to an investor’s individual circumstances or otherwise constitutes a personal recommendation. Investments involve risks, and investors should exercise prudence and their own judgement in making their investment decisions. The financial instruments described in the document may not be eligible for sale in all jurisdictions or to certain categories of investors. Options, derivative products and futures are not suitable for all investors, and trading in these instruments is considered risky. Mortgage and asset-backed securities may involve a high degree of risk and may be highly volatile in response to fluctuations in interest rates or other market conditions. Foreign currency rates of exchange may adversely affect the value, price or income of any security or related instrument referred to in the document. For investment advice, trade execution or other enquiries, clients should contact their local sales representative.
The value of any investment or income may go down as well as up, and investors may not get back the full (or any) amount invested. Past performance is not necessarily a guide to future performance. Neither UBS nor any of its directors, employees or agents accepts any liability for any loss (including investment loss) or damage arising out of the use of all or any of the Information.
Any prices stated in this document are for information purposes only and do not represent valuations for individual securities or other financial instruments. There is no representation that any transaction can or could have been effected at those prices, and any prices do not necessarily reflect UBS's internal books and records or theoretical model-based valuations and may be based on certain assumptions. Different assumptions by UBS or any other source may yield substantially different results.
This document and the Information are produced by UBS as part of its research function and are provided to you solely for general background information. UBS has no regard to the specific investment objectives, financial situation or particular needs of any specific recipient. In no circumstances may this document or any of the Information be used for any of the following purposes:
(i) valuation or accounting purposes;
(ii) to determine the amounts due or payable, the price or the value of any financial instrument or financial contract; or
(iii) to measure the performance of any financial instrument.
By receiving this document and the Information you will be deemed to represent and warrant to UBS that you will not use this document or any of the Information for any of the above purposes or otherwise rely upon this document or any of the Information.
Research will initiate, update and cease coverage solely at the discretion of UBS Investment Bank Research Management. The analysis contained in this document is based on numerous assumptions. Different assumptions could result in materially different results. The analyst(s) responsible for the preparation of this document may interact with trading desk personnel, sales personnel and other parties for the purpose of gathering, applying and interpreting market information. UBS relies on information barriers to control the flow of information contained in one or more areas within UBS into other areas, units, groups or affiliates of UBS. The compensation of the analyst who prepared this document is determined exclusively by research management and senior management (not including investment banking). Analyst compensation is not based on investment banking revenues; however, compensation may relate to the revenues of UBS Investment Bank as a whole, of which investment banking, sales and trading are a part.
For financial instruments admitted to trading on an EU regulated market: UBS AG, its affiliates or subsidiaries (excluding UBS Securities LLC) acts as a market maker or liquidity provider (in accordance with the interpretation of these terms in the UK) in the financial instruments of the issuer save that where the activity of liquidity provider is carried out in accordance with the definition given to it by the laws and regulations of any other EU jurisdictions, such information is separately disclosed in this document. For financial instruments admitted to trading on a non-EU regulated market: UBS may act as a market maker save that where this activity is carried out in the US in accordance with the definition given to it by the relevant laws and regulations, such activity will be specifically disclosed in this document. UBS may have issued a warrant the value of which is based on one or more of the financial instruments referred to in the document. UBS and its affiliates and employees may have long or short positions, trade as principal and buy and sell in instruments or derivatives identified herein; such transactions or positions may be inconsistent with the opinions expressed in this document.
Q-Series® 13 April 2015
44
United Kingdom and the rest of Europe: Except as otherwise specified herein, this material is distributed by UBS Limited to persons who are eligible counterparties or professional clients. UBS Limited is authorised by the Prudential Regulation Authority and regulated by the Financial Conduct Authority and the Prudential Regulation Authority. France: Prepared by UBS Limited and distributed by UBS Limited and UBS Securities France S.A. UBS Securities France S.A. is regulated by the ACPR (Autorité de Contrôle Prudentiel et de Résolution) and the Autorité des Marchés Financiers (AMF). Where an analyst of UBS Securities France S.A. has contributed to this document, the document is also deemed to have been prepared by UBS Securities France S.A. Germany: Prepared by UBS Limited and distributed by UBS Limited and UBS Deutschland AG. UBS Deutschland AG is regulated by the Bundesanstalt fur Finanzdienstleistungsaufsicht (BaFin). Spain: Prepared by UBS Limited and distributed by UBS Limited and UBS Securities España SV, SA. UBS Securities España SV, SA is regulated by the Comisión Nacional del Mercado de Valores (CNMV). Turkey: Distributed by UBS Limited. No information in this document is provided for the purpose of offering, marketing and sale by any means of any capital market instruments and services in the Republic of Turkey. Therefore, this document may not be considered as an offer made or to be made to residents of the Republic of Turkey. UBS AG is not licensed by the Turkish Capital Market Board under the provisions of the Capital Market Law (Law No. 6362). Accordingly, neither this document nor any other offering material related to the instruments/services may be utilized in connection with providing any capital market services to persons within the Republic of Turkey without the prior approval of the Capital Market Board. However, according to article 15 (d) (ii) of the Decree No. 32, there is no restriction on the purchase or sale of the securities abroad by residents of the Republic of Turkey. Poland: Distributed by UBS Limited (spolka z ograniczona odpowiedzialnoscia) Oddzial w Polsce regulated by the Polish Financial Supervision Authority. Where an analyst of UBS Limited (spolka z ograniczona odpowiedzialnoscia) Oddzial w Polsce has contributed to this document, the document is also deemed to have been prepared by UBS Limited (spolka z ograniczona odpowiedzialnoscia) Oddzial w Polsce. Russia: Prepared and distributed by UBS Bank (OOO). Switzerland: Distributed by UBS AG to persons who are institutional investors only. UBS AG is regulated by the Swiss Financial Market Supervisory Authority (FINMA). Italy: Prepared by UBS Limited and distributed by UBS Limited and UBS Italia Sim S.p.A. UBS Italia Sim S.p.A. is regulated by the Bank of Italy and by the Commissione Nazionale per le Società e la Borsa (CONSOB). Where an analyst of UBS Italia Sim S.p.A. has contributed to this document, the document is also deemed to have been prepared by UBS Italia Sim S.p.A. South Africa: Distributed by UBS South Africa (Pty) Limited (Registration No. 1995/011140/07), an authorised user of the JSE and an authorised Financial Services Provider (FSP 7328). Israel: This material is distributed by UBS Limited. UBS Limited is authorised by the Prudential Regulation Authority and regulated by the Financial Conduct Authority and the Prudential Regulation Authority. UBS Securities Israel Ltd is a licensed Investment Marketer that is supervised by the Israel Securities Authority (ISA). UBS Limited and its affiliates incorporated outside Israel are not licensed under the Israeli Advisory Law. UBS Limited is not covered by insurance as required from a licensee under the Israeli Advisory Law. UBS may engage among others in issuance of Financial Assets or in distribution of Financial Assets of other issuers for fees or other benefits. UBS Limited and its affiliates may prefer various Financial Assets to which they have or may have Affiliation (as such term is defined under the Israeli Advisory Law). Nothing in this Material should be considered as investment advice under the Israeli Advisory Law. This Material is being issued only to and/or is directed only at persons who are Eligible Clients within the meaning of the Israeli Advisory Law, and this material must not be relied on or acted upon by any other persons. Saudi Arabia: This document has been issued by UBS AG (and/or any of its subsidiaries, branches or affiliates), a public company limited by shares, incorporated in Switzerland with its registered offices at Aeschenvorstadt 1, CH-4051 Basel and Bahnhofstrasse 45, CH-8001 Zurich. This publication has been approved by UBS Saudi Arabia (a subsidiary of UBS AG), a Saudi closed joint stock company incorporated in the Kingdom of Saudi Arabia under commercial register number 1010257812 having its registered office at Tatweer Towers, P.O. Box 75724, Riyadh 11588, Kingdom of Saudi Arabia. UBS Saudi Arabia is authorized and regulated by the Capital Market Authority to conduct securities business under license number 08113-37. Dubai: The information distributed by UBS AG Dubai Branch is intended for Professional Clients only and is not for further distribution within the United Arab Emirates. United States: Distributed to US persons by either UBS Securities LLC or by UBS Financial Services Inc., subsidiaries of UBS AG; or by a group, subsidiary or affiliate of UBS AG that is not registered as a US broker-dealer (a ‘non-US affiliate’ ) to major US institutional investors only. UBS Securities LLC or UBS Financial Services Inc. accepts responsibility for the content of a document prepared by another non-US affiliate when distributed to US persons by UBS Securities LLC or UBS Financial Services Inc. All transactions by a US person in the securities mentioned in this document must be effected through UBS Securities LLC or UBS Financial Services Inc., and not through a non-US affiliate. Canada: Distributed by UBS Securities Canada Inc., a registered investment dealer in Canada and a Member-Canadian Investor Protection Fund, or by another affiliate of UBS AG that is registered to conduct business in Canada or is otherwise exempt from registration. Brazil: Except as otherwise specified herein, this material is prepared by UBS Brasil CCTVM S.A. to persons who are eligible investors residing in Brazil, which are considered to be: (i) financial institutions, (ii) insurance firms and investment capital companies, (iii) supplementary pension entities, (iv) entities that hold financial investments higher than R$300,000.00 and that confirm the status of qualified investors in written, (v) investment funds, (vi) securities portfolio managers and securities consultants duly authorized by Comissão de Valores Mobiliários (CVM), regarding their own investments, and (vii) social security systems created by the Federal Government, States, and Municipalities. Hong Kong: Distributed by UBS Securities Asia Limited and/or UBS AG, Hong Kong Branch. Singapore: Distributed by UBS Securities Pte. Ltd. [MCI (P) 016/09/2014 and Co. Reg. No.: 198500648C] or UBS AG, Singapore Branch. Please contact UBS Securities Pte. Ltd., an exempt financial adviser under the Singapore Financial Advisers Act (Cap. 110); or UBS AG, Singapore Branch, an exempt financial adviser under the Singapore Financial Advisers Act (Cap. 110) and a wholesale bank licensed under the Singapore Banking Act (Cap. 19) regulated by the Monetary Authority of Singapore, in respect of any matters arising from, or in connection with, the analysis or document. The recipients of this document represent and warrant that they are accredited and institutional investors as defined in the Securities and Futures Act (Cap. 289). Japan: Distributed by UBS Securities Japan Co., Ltd. to professional investors (except as otherwise permitted). Where this document has been prepared by UBS Securities Japan Co., Ltd., UBS Securities Japan Co., Ltd. is the author, publisher and distributor of the document. Distributed by UBS AG, Tokyo Branch to Professional Investors (except as otherwise permitted) in relation to foreign exchange and other banking businesses when relevant. Australia: Clients of UBS AG: Distributed by UBS AG (Holder of Australian Financial Services License No. 231087). Clients of UBS Securities Australia Ltd: Distributed by UBS Securities Australia Ltd (Holder of Australian Financial Services License No. 231098). Clients of UBS Wealth Management Australia Ltd: Distributed by UBS Wealth Management Australia Ltd (Holder of Australian Financial Services Licence No. 231127). This Document contains general information and/or general advice only and does not constitute personal financial product advice. As such, the Information in this document has been prepared without taking into account any investor’s objectives, financial situation or needs, and investors should, before acting on the Information, consider the appropriateness of the Information, having regard to their objectives, financial situation and needs. If the Information contained in this document relates to the acquisition, or potential acquisition of a particular financial product by a ‘Retail’ client as defined by section 761G of the Corporations Act 2001 where a Product Disclosure Statement would be required, the retail client should obtain and consider the Product Disclosure Statement relating to the product before making any decision about whether to acquire the product. The UBS Securities Australia Limited Financial Services Guide is available at: www.ubs.com/ecs-research-fsg. New Zealand: Distributed by UBS New Zealand Ltd. The information and recommendations in this publication are provided for general information purposes only. To the extent that any such information or recommendations constitute financial advice, they do not take into account any person’s particular financial situation or goals. We recommend that recipients seek advice specific to their circumstances from their financial advisor. Korea: Distributed in Korea by UBS Securities Pte. Ltd., Seoul Branch. This document may have been edited or contributed to from time to time by affiliates of UBS Securities Pte. Ltd., Seoul Branch. Malaysia: This material is authorized to be distributed in Malaysia by UBS Securities Malaysia Sdn. Bhd (Capital Markets Services License No.: CMSL/A0063/2007). This material is intended for professional/institutional clients only and not for distribution to any retail clients. India: Prepared by UBS Securities India Private Ltd. (Corporate Identity Number U67120MH1996PTC097299) 2/F, 2 North Avenue, Maker Maxity, Bandra Kurla Complex, Bandra (East), Mumbai (India) 400051. Phone: +912261556000 SEBI Registration Numbers: NSE (Capital Market Segment): INB230951431, NSE (F&O Segment) INF230951431, BSE (Capital Market Segment) INB010951437.
The disclosures contained in research documents produced by UBS Limited shall be governed by and construed in accordance with English law.
UBS specifically prohibits the redistribution of this document in whole or in part without the written permission of UBS and UBS accepts no liability whatsoever for the actions of third parties in this respect. Images may depict objects or elements that are protected by third party copyright, trademarks and other intellectual property rights. © UBS 2015. The key symbol and UBS are among the registered and unregistered trademarks of UBS. All rights reserved.