q final exam topic tuesday, may 21 plus max 4
TRANSCRIPT

R E M I N D E R S v Extra Credit: Maximum of 5
“Think Geographically” Essays from any five Chapters 4-12 - O R - The 3rd topic from req. essay list plus max 4 chapter essays – Last day to submit is May 14
but it is best to do them as you finish reading a chapter.
– Any other form of extra credit proposal must be approved by me in advance by April 16
Ø Any extra credit may be submitted before the deadline.
Ø Don’t wait for the night before to write them.
q EXAM III – Final Exam Tuesday, May 21
from 9 AM - 11 AM. Covers Part III of the course.
Ø Two required essays (10% of your grade) were due April 9. Due by end of semester or else a 0 grade.
Ø Late penalty now applies.
TEXTBOOKREADINGFORPARTIII
SelectedpartsofChapters6-12

FindingSuspectsbyTrackingCellPhoneDataofEveryoneNearCrimeScene
2https://www.nytimes.com/interactive/2019/04/13/us/google-location-tracking-police.html

GEOG 101 PART III
21 Life on Earth:
Population Geography 2 Chapter 6
Prof. Anthony Grande
Hunter College Geography Lecture design, content and presentation ©AFG 0419 Individual images and illustrations may be subject to prior copyright.
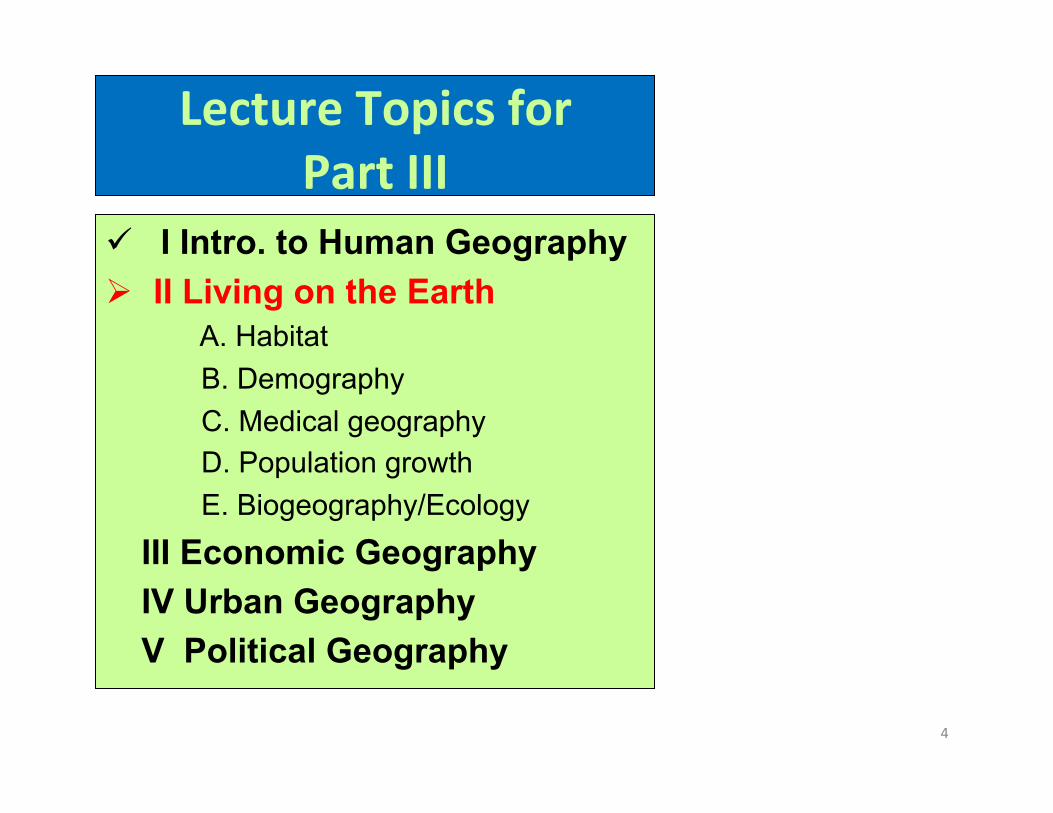
LectureTopicsforPartIII
ü I Intro. to Human Geography Ø II Living on the Earth
A. Habitat B. Demography C. Medical geography D. Population growth E. Biogeography/Ecology III Economic Geography IV Urban Geography V Political Geography
4

5
We need data to evaluate a population. 1. Numbers of people. 2. Concentration of people. 3. Other data to help assess a situation (quality of life within a habitat)
WherethePeopleAreandWhat’sThereforThem

RecentAverageAnnualRateofPopulaNonChange
6
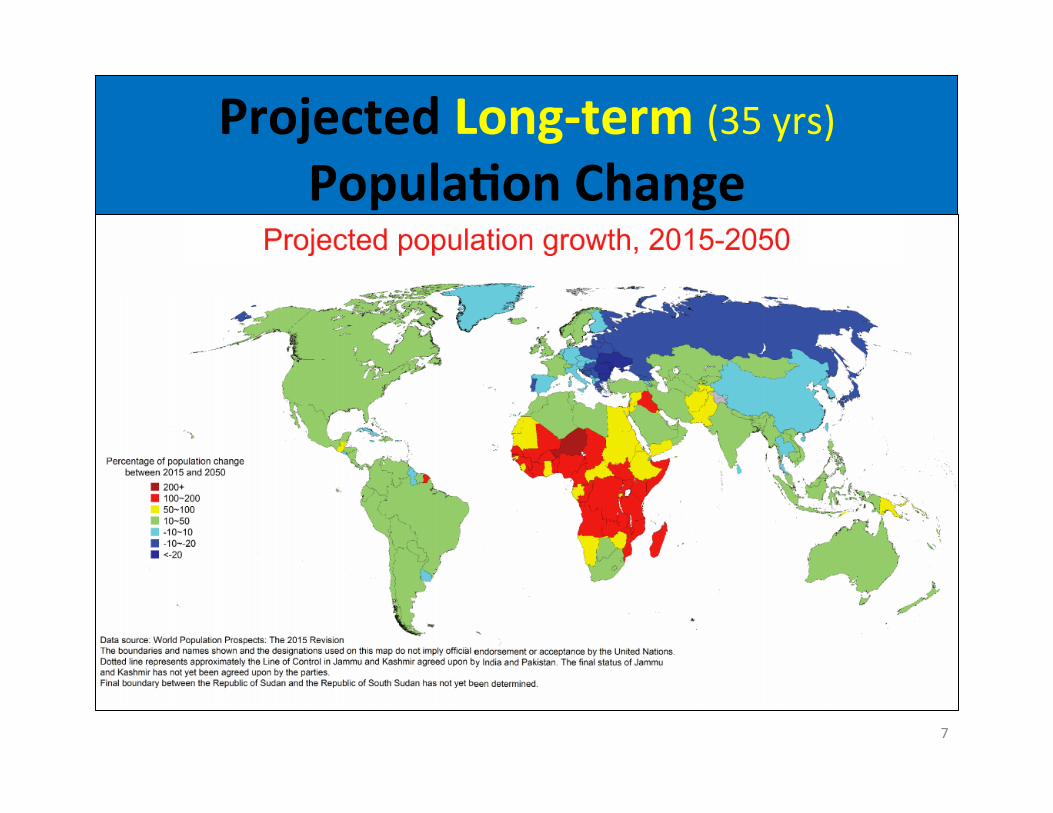
ProjectedLong-term(35yrs)PopulaNonChange
7

Birth Rate and Death Rate
8
Birth Rate
Death Rate

Total Fertility Rate
v ZPG:ZeropopulaNongrowthisconsideredtobethereplace-mentrate(sta%s%callythenumberis2.1children/parents.)
9
v TFR:TotalFerNlityRate.Thenumberofchildrenbornebychild-bearingagewomen.Theyoungerandlargerapopula>on,thehighertheTFRandthehighergrowthpoten>al,especially,ifinfantmortalityratesarereduced.
https://www.nytimes.com/2018/04/25/health/africa-infant-mortality-antibiotic.html : Antibotics reduce infant mortality in Africa.

ChangingAgeStructure1960-2050
10
2018 Age structure not only affects quality of habitat (rela-tionship to potential population growth rates), it also has an economic as-pect with regard to workers and a social aspect with regard to depend-ency ratios (caring for the very young and very old).

Percent of Population UNDER 15 Years of Age
11

Annual Rate of Natural Increase (Birth rate/death rate)
12

Life Expectancy
13
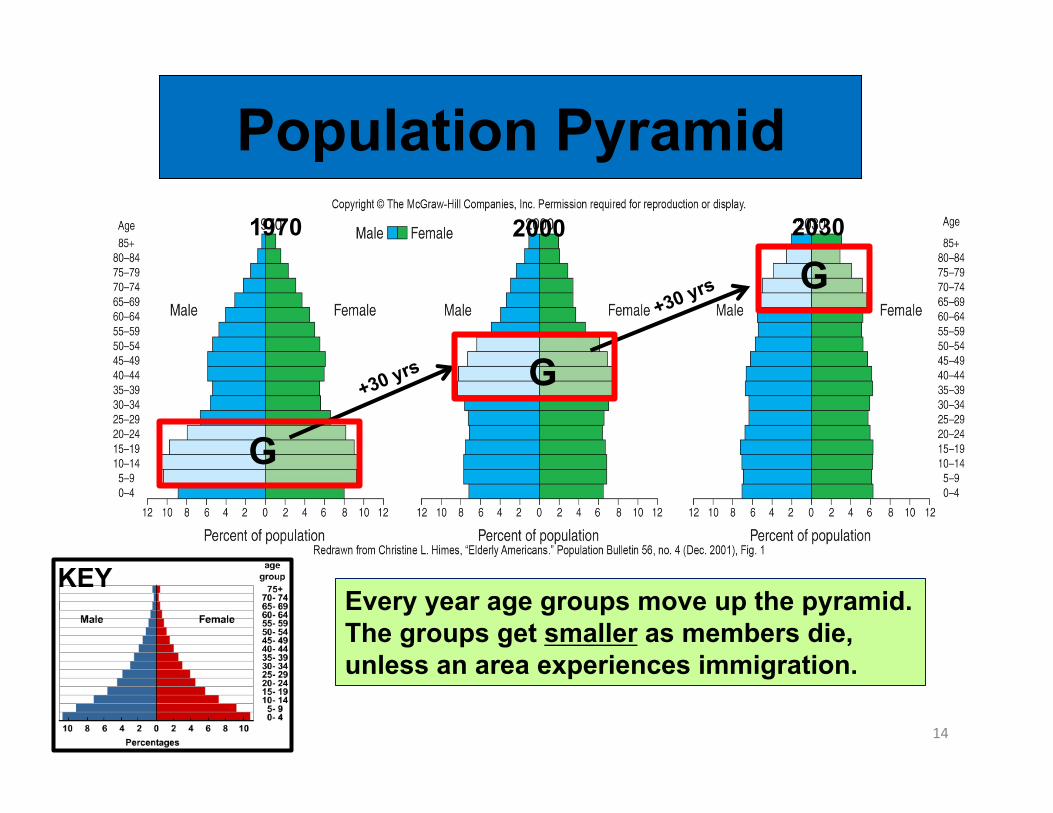
Population Pyramid
14
Every year age groups move up the pyramid. The groups get smaller as members die, unless an area experiences immigration.
G
G
G 1970 2000 2030
KEY

Population Pyramids for Regions of the United States
15
USA
Why the different shapes for areas
of the US?

Malthusian Theory In 1798 Thomas Malthus postulated that unless population growth was slowed (by “self-control”, war or natural disaster), its rate of growth would soon exceed the rate of food production (exceed carrying capacity).
He predicted that people would not be able to feed themselves and wide-spread poverty and hunger would follow. WHY? Because population tends to double in size quickly, while agriculture grows at a steady rate.
16
His prediction did not take into account new tech-nologies that allowed people to produce more food.

Demographic Transition v The J-Curve becomes
an S-Curve when a population reaches carrying capacity.
Ø It returns to a J-Curve when new technologies allow people to live longer.
17

DemographicTransiNonandEconomicDevelopment
18
1 Agrarian society
2 Industrialization
established
3 Urban/economic
society
4 Highly
developed
5 Old-age
population

DemographicTransiNonandEconomicDevelopment
Textbook Fig 6-10
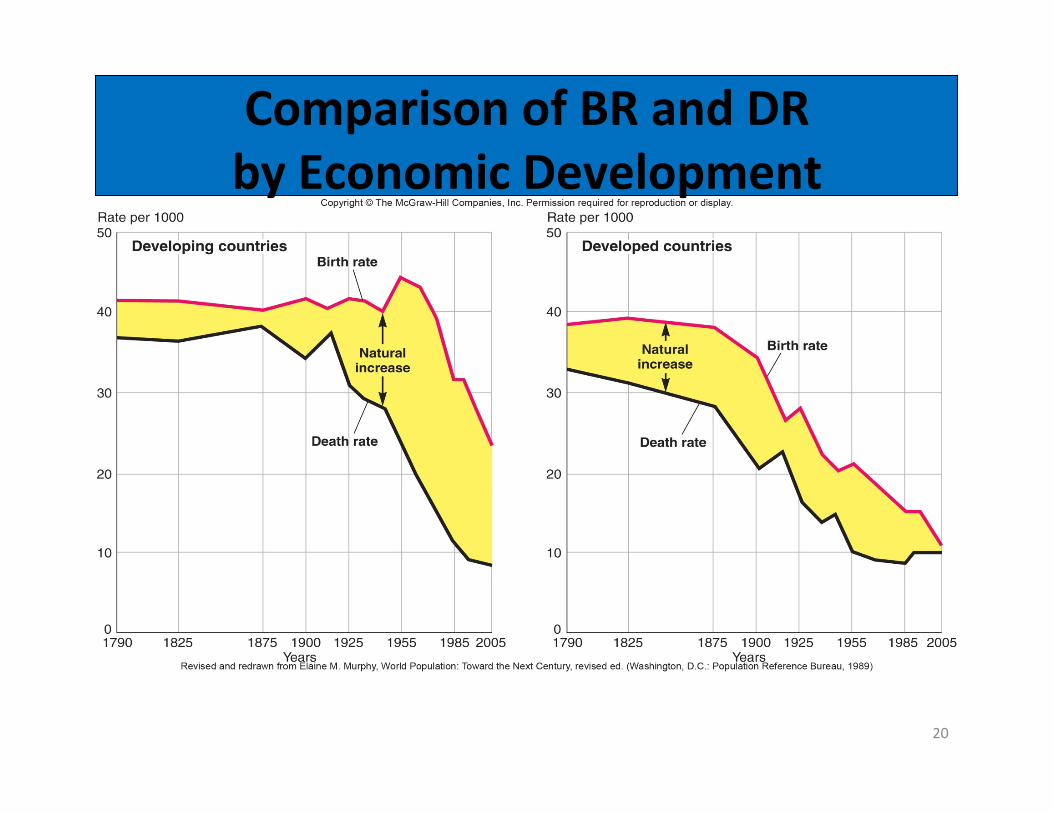
ComparisonofBRandDRbyEconomicDevelopment
20

Homeostatic Plateaus: Balance between population and resources
21
The J-Curve turns into an S-Curve every time some-thing occurs to either increase or slow down the death rate (changes existing equilibrium).
How long can this go on?
What’s the next magic trick?
Flat lines equal periods of stability

Medical Geography
22
v MEDICAL GEOGRAPHY studies the well-being of people as an aspect of habitat. – Medical aspects are studied spatially (where they
occur). – The are correlated to conditions of site and
situation as wind direction, watershed, wells and aquifers, routes of dispersal.
v EPIDEMIOLOGY: the study of the causes and control of disease

Health and Nutrition
23
Important part of the population question. Ø Areas with good health and nutrition can
accommodate large numbers of people. ü They also become PULL factors (drawing more people).
• Conversely, areas prone to food and water shortages or disease can experience PUSH factors, but in many cases it is just the negative version of STAY.
§ Analysis includes: § Food availability (type/diet/caloric value)
§ Life expectancy/infant mortality (BR/DR/wellness)
§ Disease (susceptibility/transmission/DR/social issues)

LeadingCausesofDeath
24