pzdm-#296231-v1-milkprice report 2008 definitive
TRANSCRIPT


2 LTO-International Milk Price Comparison 2008
COLOPHON
Publisher
LTO Nederland Vakgroep Melkveehouderij P.O. Box 29773, 2502 LT Den Haag The Netherlands www.lto.nl
July 2009 In co-operation with
European Dairy Farmers c/o Competence Centre Agriculture and Food Business DLG e.V. Eschborner Landstrasse 122, D-60489 Frankfurt a.M. Germany Telephone (+ 49) 69 24 788 312 e-mail [email protected] www.dairyfarmer.net
Cover design Willemijn de Lint, Haarlem
Ordering
The report can be downloaded at www.milkprices.nl (in English and in Dutch). Alternatively it can be ordered by: telephone: (+31) 79 3681506 e-mail: [email protected]
© Copying the text is authorized subject to acknowledgement of source as follows: LTO-International Milk Price Comparison, www.milkprices.nl

LTO-International Milk Price Comparison 2008 3

4 LTO-International Milk Price Comparison 2008
Table of contents Foreword ............................................................................................................6 1. Introduction and notes for readers ........................................................................8 1.1 Introduction .........................................................................................................8 1.2 Notes for readers .................................................................................................9 2. Milk prices in 2008............................................................................................. 10 2.1 Milk price comparison ........................................................................................ 10 2.2 Dairy markets.................................................................................................... 12 3. Developments in milk prices and markets in 2009................................................ 14 4. Dairy companies and explanation of calculated milk prices ................................... 16 4.1 Choice of dairy companies ................................................................................. 16 4.2 Explanation company by company...................................................................... 17 4.3 New Zealand and the United States .................................................................... 19 5. Looking back over ten years of milk price comparisons ........................................ 22 5.1 Average milk prices 1999 to 2008 ....................................................................... 22 5.2 Dairy farming structure....................................................................................... 24 5.3 Evolution of dairy processors.............................................................................. 26 5.4 Milk price analyses ............................................................................................ 27 5.4.1 Fluctuations in milk price during the year ............................................................ 27 5.4.2 Evolution of milk price in relation to quotations for butter and ............................... 28 skimmed milk powder ........................................................................................ 28 Annex I Key figures dairy companies .............................................................................. 30 Annex II Milk prices 1999 to 2008 and average currency exchange rates 2008 and 2007.................................................................................................. 36 Annex III Additional figures dairy farming structure ............................................................ 38

LTO-International Milk Price Comparison 2008 5

6 LTO-International Milk Price Comparison 2008
Foreword We dairy farmers are all, once more, in the position of being almost forgotten, but the year 2008 was an historic year, and historic in a positive sense. The average farmgate milk price reached its highest level since the LTO-International Milk Price Comparison began ten years ago. After a good year for milk prices in 2007, prices continued to climb in the early months of 2008. Thereafter, to be sure, quotations for dairy products began to drop but most dairy companies kept prices up for some time. The leaders in higher milk prices in 2007, however, had a difficult time in 2008. This is to be explained by the sensitivity to the profits from butter and skimmed milk powder which dropped dramatically in 2008. Bearing in mind the changes in EU dairy policy we knew that milk prices would fluctuate, and we gave a warning to this effect. It is important for dairy farmers to keep this in mind in their business management. The first six months of 2009 have shown that the historically high prices in this report have been replaced, in the meantime, by historically low prices. For an average farm (in the Netherlands) with an annual delivery of 600 000 kg of milk, a fall in price of 10 Eurocents per kilogram means an overall drop in turnover of 60 000 Euros per year. These are difficult times for dairy farmers! This is the 10th edition of the LTO -International Milk Price Comparison. This is an extra reason for undertaking a comparison of average milk prices of the dairy companies in the various countries over the past ten years. The great differences in prices paid to producers are striking. A difference in milk price of 5 Eurocents per kilogram over ten years means a great difference in profits between dairy companies. For a dairy farmer this rapidly means the difference between having an income and not having one! Besides changes in milk prices changes in the structure of dairy farming are also depicted. Countries in which dairy farming was on a relatively large scale in general grew more in the past ten years than those with smaller scale dairy farming. Efficiency was also better, as can be seen from the increase in average annual milk production per cow. In short, dairy farming and the dairy sector as a whole are in a period of change. In conclusion, I would like to express the hope that my Foreword to next year’s edition will be more positive about the development of milk prices.
Siem-Jan Schenk Chairman Dairy Committee Dutch Federation of Agriculture and Horticulture LTO Nederland

LTO-International Milk Price Comparison 2008 7
8 LTO-International Milk Price Comparison 2008
1. Introduction and notes for readers 1.1 Introduction The LTO-International Milk Price Comparison is published every month at the request of the Dairy Committee of the Dutch Federation of Agriculture and Horticulture (LTO Nederland) at www.milkprices.nl. This is a comparison of the prices paid for milk by large European companies and is done in co-operation with European Dairy Farmers (EDF). EDF collects the milk price data and makes them available. Calculations are undertaken by the Dutch Dairy Board (Productschap Zuivel, PZ). The method chosen for the calculations shows the price a dairy farmer would receive if milk of specific (standard) composition, quality and quantity were delivered to the different dairy companies. In this report the following characteristics of the standard milk are taken as a basis: - 4.2% fat; - 3.4% protein; - total bacterial count 24,999 per ml; - somatic cell count 249,999 per ml; - annual delivery 500,000 kg. The prices are exclusive of VAT, ex-farm and inclusive of supplementary payments. It must be emphasized that there is no comparison of the average milk prices paid. The average price paid by a dairy company for milk is dependent on the actual composition, quality, quantity et cetera of the milk delivered. Furthermore, no conclusions can be drawn about the performance of dairy companies on the basis of the milk prices paid. Many more factors play a role in assessing performance. After each calendar year has ended a report is presented with the calculated milk prices paid for that year. This annual report appears when the supplementary payments of the preceding calendar/ financial year are known and can, thus, be incorporated into the milk prices. The present publication comprises the milk prices calculated for the calendar year 2008. As the international comparison of milk prices was started ten years ago we have taken the opportunity in this jubilee publication to cast our eye back over the past ten years and have made a number of extra analyses.

LTO-International Milk Price Comparison 2008 9
1.2 Notes for readers Chapter 2 features the calculated milk prices for 2008 (paragraph 2.1), followed by a short description of the developments in the dairy market (2.2). Then Chapter 3 gives a review of the evolution of milk prices in the first months of 2009 as well as recent developments in the dairy market. Chapter 4 gives an explanation of the chosen dairy companies (4.1), the calculated milk price per dairy company (4.2) and the development of milk prices in New Zealand and the United States (4.3). Chapter 5 glances back over ten years of milk price comparisons. To start with, paragraph 5.1 gives an overview of the development of average milk prices in the past ten years, both for all companies taken as a whole and company by company. A number of developments in the structure of dairy farming in various countries are summarised in paragraph 5.2. The developments that have taken place since 1999 in the dairy companies participating in these comparisons are outlined in paragraph 5.3. This chapter ends with an analysis in which data from ten years of milk price comparisons are used to identify the fluctuations in milk price in the course of the year (5.4.1) and to consider the relationship between prices for milk and the quotations for butter and skimmed milk powder (5.4.2). In the appendices the reader will find certain basic data about the dairy companies (Appendix 1), tables of background information about milk prices per dairy company from 1999 to 2008 and the average currency exchange rates in 2007 and 2008 (Appendix 2) and additional data on the structure of dairy farming (Appendix 3).

10 LTO-International Milk Price Comparison 2008
2. Milk prices in 2008 2.1 Milk price comparison In 2008 the farmgate milk prices of 18 European dairy companies were calculated. The average calculated milk price for these companies, excluding Granarolo1, was 34.63 Euros per 100 kg of standard milk in 2008. This is 2.11 Euros per 100 kg or 6.5% more than in 2007. Table 1. Milk prices 2008 and 2007
In Euros per 100 kg of standard milk (excluding VAT and including supplementary payments)
2008 ranking 2007
ranking 2008-2007 2008/2007
national currency
1) Hämeenlinnan O. FIN 44.43 1 37.61 1 6.82 18.1% Arla Foods DK DK 36.42 2 31.70 11 4.72 14.9% Danone (Pas de Calais) F 35.91 3 30.79 12 5.12 16.6% Sodiaal Union F 35.58 4 30.49 14 5.08 16.7% Bongrain (Basse Normandie) F 35.47 5 30.68 13 4.79 15.6%
Campina 2) NL 35.36 6 33.16 7 2.20 6.6% Friesland Foods 2) NL 35.36 6 33.61 5 1.74 5.2% Lactalis (Pays de la Loire) F 35.27 8 30.48 15 4.79 15.7% Humana Milchunion eG D 35.20 9 33.54 6 1.66 4.9% Alois Müller D 34.34 10 34.92 4 -0.58 -1.7% Glanbia IRL 33.54 11 32.95 8 0.59 1.8% Kerry Agribusiness IRL 33.03 12 32.70 9 0.33 1.0% Dairy Crest (Davidstow) UK 32.73 13 29.70 16 3.03 10.2% 24.1% Milcobel B 32.65 14 35.37 3 -2.72 -7.7% Nordmilch D 31.42 15 32.15 10 -0.73 -2.3% First Milk UK 31.03 16 27.34 17 3.69 13.5% 27.4% DOC Kaas NL 30.97 17 35.68 2 -4.71 -13.2% average 34.63 32.52 2.11 6.5% Granarolo (North) I 41.05 Fonterra NZ 23.13 26.25 -3.12 -11.9% -2.0% USA Class III USA 29.37 32.12 -2.75 -8.6% -2.1%1) Corrected for changes in exchange rate against the Euro. For countries outside the euro zone monthly milk prices are
converted into Euros at the exchange rate prevailing during the month in question. 2) From 2009 Campina and Friesland Foods are merged into FrieslandCampina. In 2008 the former members of the two cooperatives were paid the same milk price. After the unprecedented price rise of nearly 15% in 2007, in 2008 calculated average milk prices rose still further despite the rapidly worsening market situation. Thus in 2008 the average milk price reached its highest level since the start of the LTO -International Milk Price Comparison ten years ago. The most striking phenomenon was that the milk prices of the dairy companies that had risen the most in 2007 were much below the average last year, or even fell, and vice versa. In consequence the rankings of the dairy companies changed considerably in comparison with the previous year.
1 The milk prices of Granarolo (Italy) have been calculated and published as from January 2008. However they have not been included in the averages in order not to disturb the series of comparisons for earlier years.

LTO-International Milk Price Comparison 2008 11
Following their relatively modest increases in 2007, the milk prices of Hämeenlinnan Osuusmeijeri (Finland), Arla Foods (Denmark/Sweden) and the French companies climbed noticeably more than the average in 2008 and were better placed in the rankings for the year. The development of the milk price of Dutch DOC Kaas and Milcobel in Belgium were in stark contrast to this. In 2007 they were in the top positions but they have sunk to the lowest part of the rankings in 2008. The calculated milk price of Hämeenlinnan Osuusmeijeri climbed to a record 44.43 Euros per 100 kg in 2008. In Finland last year there was even talk of a shortage of ex-farm milk. In order to stimulate production not only Hämeenlinnan Osuusmeijeri but also the giant Valio2 cooperative raised milk prices paid by a noticeable amount. The development of the milk prices of French companies follows the trend elsewhere in Europe with a certain delay and this can be explained by the French milk pricing system. National recommendations for the evolution of milk prices per quarter are based on the developments in the dairy market in the preceding 12 months. Arla Foods returned to the top of the rankings in 2008. Arla was not in a position to profit so greatly from the substantial rises in price of commodity products in 2007 as its product range comprises a relatively large proportion of higher added value products and it was only later that it passed the dairy market price increases on to its customers. The differences in milk price between German dairy companies have grown. The calculated milk price for Humana has increased in 2008, while those for Alois Müller and Nordmilch fell. In 2008 FrieslandCampina paid the same price to the former members of Friesland Foods and of Campina. To allow comparison with the previous year the milk prices of the two companies are quoted separately. The calculated milk price of FrieslandCampina is relatively stable. This is not surprising in that the development of the company’s milk price is based on the milk prices of other dairy companies in neighbouring countries. Expressed in national currency the milk prices of Dairy Crest and First Milk rose the most in 2008, by 24.1% and 27.4%, respectively. In 2008 British dairy farmers received their highest milk prices in recent decades. However, for both companies the rise in calculated milk prices is much less when converted into Euros. This is because of the considerable drop in value of the Pound Sterling. The unprecedented rise in British milk prices, furthermore, is partly due to the fall in the Pound Sterling. The relative shortage of milk and milk products on the British market caused by the decline in milk production was filled rather less rapidly by extra imports. After all, when the exchange rat e of the Pound is low exports to Britain are less attractive. The milk prices of the Irish firms Glanbia and Kerry having risen sharply in 2007 hardly grew any further last year. The relatively large share of milk powder in the product range of Milcobel (Belgium) and the developments on the world market for milk powder explain the lower ranking in 2008 and the higher ranking the year before. The evolution of the DOC Kaas milk price reflected the extremely good development in the prices of cheese, whey powder and cream in 2007 and the subsequent heavy fall in the course of 2008. In the United States and in New Zealand (Fonterra), after the extreme rises of the year before, milk prices fell in 2008.
2 According to its own annual report Valio paid an average price of 47.20 Euros per 100 kg in 2008. This is higher than the average milk price of Hämeenlinnan Osuusmeijeri. The explanation is that the fat and the protein contents of milk in Finland are higher than those of the standard milk used for the purposes of the intenational comparison. In comparison with 2007 the average milk price paid by Valio increased by about 20%.

12 LTO-International Milk Price Comparison 2008
2.2 Dairy markets Despite the relatively good milk prices, the market picture in 2008 cannot be described as positive in any way. A combination of rising production, falling demand and stocks increasing once more ensured that, in the course of 2008, the pressure on profits from dairy products worsened steadily. The favourable farmgate milk prices in late 2007 and early 2008 stimulated dairy farmers to increase production. The growth in production took place, in particular, in the United States and in a few countries in South America. In the European Union, too, more milk was produced at the beginning of 2008 but as the market situation deteriorated the rate of growth declined. Finally only slightly more milk was produced in the EU in 2008 than had been in 2007. The unprecedented rise in dairy product prices in 2007 made buyers cautious and products of plant origin began to be substituted for dairy products. The fall in demand was accelerated when the world economy went into a deep crisis at the end of 2008. Just as the world market had been the driving force behind the price rises in the EU in 2007, the opposite happened in 2008: the rapid fall in prices on the world market ensured that prices on the European market came under great pressure. Thus in October 2008 the prices for butter and skimmed milk powder lay 50% below the highest prices of the year before and even fell below levels comparable with those paid in 2006 in the run up to the boom in 2007. The value of milk as raw material, based on market prices for butter and skimmed milk powder, lay below the intervention level at the end of 2008. In the course of 2008 the prices of cheese fell by between 20% (natural cheese) and 40% (foil cheese).

LTO-International Milk Price Comparison 2008 13

14 LTO-International Milk Price Comparison 2008
3. Developments in milk prices and markets in 2009 In the course of 2008 the period of milk price rises that had begun in mid 2007 came to an end. This development did not make itself felt in the calculated ex - farm milk prices for the whole of calendar year 2008, although it did appear in milk prices in the early months of 2009 as shown in Figure 1. Figure 1. Evolution of average milk prices from 2007 to April 2009
In a time span of barely 18 months milk prices went from an historical peak, in late 2007, to an historical low in early 2009. At no point in the ten year period of LTO -International Milk Price Comparison has the calculated average milk price been as low as in April this year, at 23.74 Euros per 100 kg. In view of the rapid fall in prices and the growing uncertainty in the market in 2009 the European Commission felt obliged once again to take some management measures to stabilise the market. Thus private storage was brought forward by three months and export restitutions reactivated to permit European companies to compete better on the world market and release the pressure on the EU internal market. Another measure was the continuation of intervention purchases above the limits of 30 000 tons of butter and 109 000 tons of skimmed milk powder. With these arrangements the market stabilised somewhat and the prices of butter and skimmed milk powder climbed slowly to the level of the net intervention value. Thus, up to now in 2009, the market has been governed by intervention. At this moment (mid June) there is no sign of a speedy recovery. Within the EU buyers are managing to force still lower prices on producers in current market circumstances. Further negative factors are the growing stocks, stagnating exports and the hesitant attitude of buyers. On the positive side the seasonal peak in production is now past and in a number of countries production is falling, owing to the low prices.
20
22
24
26
28
30
32
34
36
38
40
Jan Feb Mrch Apr May Jun Jul Aug Sep Oct Nov Dec
€/10
0 kg
2007 2008 2009

LTO-International Milk Price Comparison 2008 15

16 LTO-International Milk Price Comparison 2008
4. Dairy companies and explanation of calculated milk prices 4.1 Choice of dairy companies Of the 18 European dairy companies in the milk price comparison seven are among the world’s Top 20 in terms of turnover. These are indicated in bold type in Table 2. Table 2. World’s largest dairy companies
Company Country Turnover (€ billion)
1 Nestlé Swiss 18.5
2 Danone France 10.7
3 Lactalis France 9.3
4 FrieslandCampina Netherlands 8.9
5 Dean Foods USA 8.5
6 Fonterra1 New-Zealand 8.1
7 Dairy Farmers of America USA 6.9
8 Arla Foods Denemark/ Sweden 6.9
9 Kraft Foods USA 5.1
10 Unilever2 Netherland/ UK 4.5
11 Saputo Canada 3.8
12 Parmalat Italy 3.7
13 Bongrain France 3.6
14 Meiji Dairies Japan 3.2
15 Morinaga Milk Industry Japan 3.0
16 Land O'Lakes USA 2.8
17 Schreiber Foods2 USA 2.5
18 Mengniu China 2.4
19 Müller Germany 2.3
20 Nordmilch Germany 2.3 Source: Rabobank International 2009 (turnover 2008 plus (proposed) mergers and acquisitions in 2009) 1) Derived from data for 14 months 2) Estimate
The companies chosen for the milk price comparison are large European dairies with a broad geographical spread in the region. Important criteria in the choice of companies are the quantity of milk processed and the share of national milk deliveries. Since the merger FrieslandCampina processes the most milk, about 8,000 million kg per year in the Netherlands. Although DOC Kaas processes less than 1000 million kg of milk it is the second largest dairy company in the Netherlands. FrieslandCampina and DOC Kaas together process nearly 80% of the milk produced in the Netherlands. Arla Foods processed 8,200 million kg of milk in 2008, of which 3,900 million kg was processed in Denmark. This represents about 85% of Danish milk production. Lactalis, Danone, Bongrain and Sodiaal are among the largest French dairy companies and together process about 11,000 million litres of milk annually in France. This is more than 40% of French milk production.

LTO-International Milk Price Comparison 2008 17
Humana Milchunion, Nordmilch and Alois Müller (the last named belongs to the Theo Müller Group) are the three largest dairy companies in Germany and together process about 8,000 million kg of milk which is more than 30% of German milk production. Dairy Crest and First Milk are the two largest dairy companies in the United Kingdom and together process and/or collect more than 4,000 million litres of milk per year. This is slightly less than 30% of the total milk production of the UK. Glanbia and Kerry are also numbers one and two in their country, Ireland. Together they process more than 2,000 million kg of milk yearly, equal to nearly 40% of Irish milk production. Granarolo is the second largest dairy company in Italy, after Parmalat, and annually processes about 30% of Italian milk production. Milcobel is not a European giant but it is the largest dairy company in Belgium with an annual quantity processed of nearly 1,000 million litres. This cooperative thus processes nearly 30% of Belgian milk production. Finland’s Hämeenlinnan Osuusmeijeri is a small cooperative that processes 100 million kg of milk annually – 4% of Finnish milk production. Hämeenlinnan Osuusmeijeri was selected for the comparison as an alternative to the giant Valio. The Valio cooperative processes about 86% of Finnish milk and pays approximately the same milk price to its dairy farmers as does Hämeenlinnan Osuusmeijeri. 4.2 Explanation company by company The Finnish cooperative Hämeenlinnan Osuusmeijeri made a supplementary payment for 2008 of 3 Eurocents per litre or, recalculated, 2.91 Euros per 100 kg of standard milk. This supplementary payment is not corrected for the date of payment or amount of capital invested because the dairy farmer members all receive a market-related compensatory interest payment for both of these. The rise in milk prices in 2008 is paid by means of a (temporary) increase in the seasonal supplement. Granarolo (77% owned by the cooperative Granlatte) applies different milk prices in the northern, central and southern regions in Italy. Milk price calculations are based on the northern region, the largest region in terms of milk production. Granarolo applies a basic price per 100 litres of milk with supplements for extra fat and protein, for quality and for the quantity delivered. The basic price is fixed per quarter year. The supplementary payment of Arla Foods calculated for 2008 for dairy farmers in Denmark was 0.71 Euros per 100 kg. The level of this payment is noticeably less than in the previous year (1.42 Euros per 100 kg). The supplementary payment is 2.1% of the so-called basic value of the milk delivered. While a part of this is not paid directly to the dairy farmer members but is converted into member certificates (3 DKK or about 0.40 Euros per 100 kg of milk), this part is not subtracted from the supplementary payment. However the supplementary payment is corrected for the time of payment and the loss of interest represented by the certificates3.
3 The supplementary payment will be corrected for the time of payment via a calculated loss of interest deducted from the amount. Whenever dairy farmer members have to invest in the cooperative and do not get market-related compensation for the loss of interest this will also be corrected by a new calculation of loss of interest deducted from the amount. The calculated loss of interest for the time of payment is based on 4.64% (EURIBOR 3-monthly rate) and that for capital invested on 3.69% (ten-year government bonds).

18 LTO-International Milk Price Comparison 2008
Following decades of farmgate milk prices in France being determined by national recommendations it appeared from April 2009 that this was coming to an end. This came, on the one hand, from the objections of the French competition authorities to these pricing agreements and, on the other, from the fact that the representatives of the dairy processing industry and the dairy farmers were no longer in agreement over the development of milk prices for the second quarter of 2009. The French processing industry wanted a significant reduction in prices in order to remain competitive abroad, while the dairy farmers, looking at it from the point of view of income, were not prepared to go further than a limited price reduction. The result was that for April 2009 the processing companies determined their own prices. In early June 2009 representatives of the dairy farmers and the processing industry managed to reach a new agreement. For 2009 the average basic price4 is 280 Euros per 1,000 litres. Payments for quality and composition are the subject of regional agreements. Milk prices for Danone and Sodiaal are based on the Nord Pas de Calais region. Following more detailed information on payment for quality in this region the milk prices of both companies are adjusted and applied retrospectively. Therefore they differ from previous publications of the LTO-International Milk Price Comparison. From July 2006 the quality bonus for Danone for butyric acid and fat acidity were discontinued (minus 4.5 Euros per 1,000 litres), while for Sodiaal an additional quality bonus is incorporated into the milk price (plus 6 Euros per 1,000 litres). The calculated milk price of Lactalis is based on the Pays de la Loire region while that of Bongrain is based on the region of Basse Normandie. The milk price for the dairy farmer members of the Netherlands cooperative FrieslandCampina consists of a guaranteed price and a performance bonus. The guaranteed price is independent of the company’s operational results and is based on a weighted average of milk prices in Germany, Arla Foods in Denmark, Milcobel in Belgium and three other dairy companies in the Netherlands. The performance bonus is determined by the financial results of FrieslandCampina and policy with respect to financial reserves. The performance bonus comprises 25% of the net profit paid directly, pro rata to the quantity of milk delivered. Besides this, 15% of the net profit is issued in the form of member bonds and 60% is placed in the general reserve. In 2008 the guaranteed price was obtained by adding 1.815% to the advance price, that is 0.62 Euros per 100 kg of standard milk. And in addition a performance bonus of 1.334% of the guaranteed price (0.46 Euros), was paid directly, and 0.800% (0.28 Euros) by generation of fixed issue member bonds. Because a market-related rate of interest is paid on the fixed member bonds they are included in the calculation of the supplementary payment. For 2008 the calculated correction for time of payment amounted to 1.30 Euros per 100 kg in the supplementary payment. The dairy farmer members of DOC Kaas received a supplementary payment of 4.30% of the advance milk price (excluding quantity and quality bonuses) in 2007 and 2.12% in 2008. Besides the direct payment DOC Kaas has transferred money for the so-called ‘suppliers and members debt account’ (‘suppliers’ - 0.70 Euros per 100 kg in 2007; ‘members’ – 0.454 Euros per 100 kg in both 2007 and 2008). Dairy farmers receive a market-related rate of interest on the money placed on this account. The supplementary payment is also corrected for the time of payment. The supplementary payments made by DOC Kaas were 1.83 Euros per 100 kg in 2007 and 1.04 Euros per 100 kg in 2008. Humana Milchunion in Germany made the supplementary payment to its calculated milk price, as it has done in previous years, in the months of November and December 2008, amounting to 0.65 Euros per 100 kg. For the dairy farmer members of both Humana Michunion and Nordmilch the milk price has been corrected with a negative supplementary ‘payment’ because they have not received compensation for the interest on the capital invested in their respective cooperatives and because neither company made further supplementary payments. The capital invested was 5 Euros per 100 kg for Humana Milchunion and 4 Euros per 100 kg for Nordmilch. After the end of the calendar year the milk prices paid by the private company Alois Müller will be compared with those paid by other dairy companies in the new states of the Federal Republic (formerly in the DDR). Depending on the result Alois Müller may make a supplementary payment. No such payment was made for 2008. For 2007 dairy farmers who deliver to Alois Müller in Leppersdorf received an extra payment of 0.25 Euros per 100 kg of milk. After correction for the time of payment 0.24 Euros per 100 kg has been taken as the calculated supplementary payment for 2007.
4 The basic price is valid for milk containing 38 g of fat and 32 g of (true) protein per litre.

LTO-International Milk Price Comparison 2008 19
In Ireland the milk price differs according to whether the milk is used for industrial products (manufacturing milk) or goes as fresh milk for consumption the whole year round (liquid milk). For the purposes of the milk price comparison the (lower) price for manufacturing milk has been used. Glanbia’s milk prices were corrected retrospectively for a reduction in the seasonal bonuses applied and therefore differ from those in previous publications of this international milk price comparison. Neither Kerry nor Glanbia made supplementary payments for 2008. In the United Kingdom a wide range of milk price contracts applies. Dairy Crest’s milk prices relate to the suppliers who deliver to the Davidstow cheese factory via Dairy Crest Direct. The calculated milk prices for First Milk relate to the so-called dual pricing system. In this system – for which most dairy farmers have opted – a basic price applies to 80% of the milk produced. The marginal price for the remaining part varies month by month. 4.3 New Zealand and the United States Dairy farmer suppliers of New Zealand’s Fonterra receive a milk price based on the number of kilograms of fat and protein (milk solids). In the milk price comparison the figures are converted to the calendar year and expressed in Euros per 100 kg of standard milk. Figure 2 shows the evolution of Fonterra’s milk prices expressed in New Zealand Dollars (NZ$) per kilogram of milk solids. Thus the effect of fluctuations in the exchange rate between the NZ Dollar and the Euro on milk prices calculated in Euros is eliminated. This gives a better picture of the milk price as received by New Zealand dairy farmers. Furthermore the milk prices are not converted to the calendar year but reflect the New Zealand milk year, which runs from June to May of the following year. Figure 2 shows that 2007/2008 was a top year for New Zealand so far as milk price is concerned. Despite the fall in the milk price, from NZ$ 7.90 to NZ$ 5.20 (temporarily) in 2008/2009, last year was still above average for milk prices. The new season began in June 2009 with a forecast milk price of NZ$ 4.55 per kilogram of milk solids. Figure 2. Fonterra milk prices (NZ$ per kilogram of fat and protein (milk solids)
4.55
5.20
7.90
4.464.10
4.594.23
3.63
5.335.00
3.753.58
0
1
2
3
4
5
6
7
8
9
1998/99 1999/00 2000/01 2001/02 2002/03 2003/04 2004/05 2005/06 2006/07 2007/08 2008/09 2009/10
NZ
$/kg
milk
so
lids

20 LTO-International Milk Price Comparison 2008
For the United States the milk price for so-called class III milk is taken as the indicator and converted to standard milk. The class III price relates to milk intended for cheese making. The calculated class III price is based on the monthly announcements of the US Department of Agriculture (USDA). Expressing milk prices in Euros means that the level of the calculated price is influenced by the rate of exchange between the US Dollar and the Euro. In Figure 3 the effect of exchange rates is eliminated by expressing the milk price in Dollars. To make the data more familiar to American readers the milk prices are not only in Dollars, but expressed per hundredweight (cwt)5. The USDA provides the prices in $ per cwt. It is clear from Figure 3 that 2007 and 2008 were also top years for milk prices in the USA. However, just as in Europe, the US milk price is much lower at the moment. The average price of Class III milk in the first 4 months of 2009 was $10.32 per cwt. Figure 3. Class III milk price in the United States ($ per cwt)
5 1 cwt (US) = 45.36 kg
10.32
17.4418.04
14.05
15.40
11.42
10.42
11.8912.45
9.74
13.10
6
8
10
12
14
16
18
20
1999 2000 2001 2002 2003 2004 2005 2006 2007 2008 2009
$ pe
r cw
t

LTO-International Milk Price Comparison 2008 21

22 LTO-International Milk Price Comparison 2008
5. Looking back over ten years of milk price comparisons In the past ten years many things have happened in EU dairy farming and dairying in general. Key events include, for example, the introduction of the Euro, the extensive enlargement of the Union with new Member States in Central and Eastern Europe and – let us not forget – the reform of European dairy policy. A lot has also changed in the structure of dairy farming and that of the dairy industry. 5.1 Average milk prices 1999 to 2008 The calculated average, annual milk price reached a historical peak in 2008 at 34.63 Euros per 100 kg of standard milk. See Figure 4. Figure 4. Average milk prices 1999 to 2008
From 1999, the year in which the LTO-International Milk Price Comparison was started, the average milk price rose, reaching 32.67 Euros per 100 kg in 2001. That year was a relatively good year for dairying. Thanks to good demand and also a strong US Dollar and high prices for petroleum the prices of butter and milk powder rose in the first six months of that year. Later this was followed by a rise in prices for cheese, caused in part by growth in cheese consumption in Germany. Fear of BSE meant less consumption of beef and more of cheese. After 2001 milk prices fell gradually for five years. These falls in price were largely due to changes in EU dairy policy. An important change was the reform from 2004 onwards, with reduction in the intervention prices for butter and skimmed milk powder and, in compensation, the introduction of a dairy premium for farmers. The possible consequences of a freer dairy market became clear in 2007 with, in the first place, unprecedentedly steep rises in price, followed from the end of 2008 by even steeper falls.
34.63
32.52
28.34
28.92
29.7030.10
30.96
32.67
30.88
30.09
25
27
28
30
31
33
34
36
1999 2000 2001 2002 2003 2004 2005 2006 2007 2008
€/10
0 kg

LTO-International Milk Price Comparison 2008 23
The rise in milk prices from mid 2007 shows that, in a situation of shortage on the market, EU dairy policy has little or no influence on the level of profit from dairy products and hence on the milk prices paid to dairy farmers. In this period there was neither intervention price support nor export restitutions from Brussels. In 2007 dairy farmers discovered first the positive side of the liberalisation of the EU dairy market, but in 2008 came firmly back to earth, with both feet on the ground. Milk prices fluctuate from year to year, but what happens to the differences in the prices paid by the dairy companies over the years past? Table 3 shows the average milk price company by company over the past ten years. Table 3. Average milk prices company by company in the past ten years (Euros per 100kg) In Euros per 100 kg of standard milk (excluding VAT and including supplementary payments)
Group average 1)
Hämeenlinnan Osuusmeijeri 36.51 Arla Foods DK 31.87 Friesland Foods 31.65 Danone (Pas de Calais) 31.59 Campina 31.55 Lactalis (Pays de la Loire) 31.42 Bongrain (Basse Normandie) 31.39 Sodiaal Union 31.19 Milcobel 31.06 Humana Milchunion eG 30.85 Glanbia 30.06 Nordmilch 29.52 Kerry Agribusiness 29.21 Dairy Crest (Davidstow) 28.59 First Milk 26.55 average 30.87 Fonterra 18.40 USA Class III 28.97 1) See Table 6 in Appendix 2 for details of the milk prices involved in the calculations
The calculated milk price of Finland’s Hämeenlinnan Osuusmeijeri, with an average over the past ten years of 36.51 Euros per 100 kg, occupies a lonely top position. This is not surprising if one looks at the earlier publications of the international milk price comparison. What is striking is how large the price difference is from the others. The average milk price of number two on the list, Arla Foods, is nearly 5 Euros lower. The calculated prices of Arla (Denmark/Sweden) and the dairy companies in the Netherlands and France average out quite close to each other. Together with Milcobel (Belgium) the average milk prices of these 8 dairy companies are between 31 and 32 Euros per 100 kg. The milk prices of the German and Irish companies fall beteween 29 and 31 Euros per 100 kg. In comparison with the companies in the Netherlands and France the differences between both the Irish companies (Glanbia and Kerry) and the German (Humana Milchunion and Nordmilch) are distinctly greater. The British dairy companies bring up the rear. The calculated price of Dairy Crest (and the former Arla UK) is, at any rate, clearly higher than that of First Milk (and its predecessors) Fonterra’s calculated milk price is on average about 40% lower than in Europe and the United States Class III is about 7% lower than European prices.

24 LTO-International Milk Price Comparison 2008
5.2 Dairy farming structure In the past ten years the structure of dairy farming has changed radically. The number of dairy farmers in the countries in which the milk prices have been calculated has fallen by around 40%. The fall is greatest in Italy, Finland and Denmark. In these countries of every 100 dairy farmers 60 went out of the business between 1998 and 2008. In Ireland and France ‘only’ 33 dropped out. Table 4. Evolution of the number of dairy farmers country by country
In contrast to the reduction in the number of dairy farmers there was a sharp increase in the average size of farms. In Denmark the average annual production of farms doubled in ten years to almost 900,000 kg, thereby overtaking the United Kingdom, at nearly 850,000kg. In Italy and Finland, the average size of dairy farms more than doubled between 1998 and 2008 but, despite this, the relative size remains modest. Table 5. Evolution of average production per farm in the varous countries
In Appendix 2 further information about the evolution in the structure of farming operations is given.
Number of dairy farmers (x thousand) 1998 2007 2008 index
(1998=100) Belgium * 19.5 12.6 11.7 60 Denmark 11.4 4.9 4.9 43 Germany 163.6 99.0 95.9 59 Ireland 31.0 21.9 20.9 67 France 141.3 97.0 94.3 67 Italy 100.0 40.9 37.8 38 Netherlands 33.3 21.3 20.7 62 Finland 28.7 13.3 12.1 42 United Kingdom 32.5 17.3 16.1 50 New-Zealand 14.7 11.6 11.4 78 United States of America 117.1 70.0 67.0 57 * 1998 figure Belgium is based on Belgium and Luxembourg Source: Statistical Yearbook Dutch Dairy Board
Average milk production per farm 1998 2007 2008 index
(1998=100)
Belgium * 200,845 221,188 231,824 115 Denmark 416,232 934,027 944,459 227 Germany 171,666 288,027 300,709 175 Ireland 163,538 244,591 251,201 154 France 188,697 252,771 268,938 143 Italy 111,345 267,879 290,573 261 Netherlands 330,279 527,056 561,329 170 Finland 92,078 170,916 190,957 207 United Kingdom 457,159 805,552 843,740 185 New-Zealand 780,576 1,354,223 1,417,122 182 United States of America 609,856 1,202,793 1,284,319 211 * 1998 figure Belgium is based on Belgium and Luxembourg Source: Statistical Yearbook Dutch Dairy Board

LTO-International Milk Price Comparison 2008 25
At the start of the LTO -International Milk Price Comparison the calculations of milk price were based on a standard milk containing 4.2% fat and 3.35% protein, total bacterial count of 50,000 per ml, somatic cell count of 300,000 per ml and an annual quantity of milk delivered of 350,000 kg. At the moment the milk price comparison is for milk with 4.2% fat and 3.4% protein. A protein content of 3.4% is also applied in other comparisons. The standard fat and protein contents correspond reasonably with the average in the various countries (see Figure 5). Total bacterial count is now 24 999 per ml and somatic cell count 249,999 per ml. The greater part of milk delivered in the various countries complies with these quality requirements. A standard quantity for delivery of milk during a year of 500,000 kg has been chosen, despite the fact that the average is clearly less than this at the moment, in order to be closer to the target group of specialised and forward-looking dairy farmers. Figure 5. Average fat and protein contents in the various countries
F
IIRL
B
UK
FINDE DK
NL
3,10
3,40
3,60 4,20
fat value (%)
pro
tein
val
ue
(%)
26 LTO-International Milk Price Comparison 2008
5.3 Evolution of dairy processors The structural development of the dairy industry in general can be illustrated by the development of the companies participating in the milk price comparison. At this moment the milk prices of 18 European dairy companies are calculated and published. At the start there were 16 companies. In the year 2000 MD Foods (Denmark) merged with Arla (Sweden) to form Arla Foods. Because the dairy farmers of Arla and MD Foods did not get the same payment from the time of the merger, it was only from 2007 that a single price was calculated for Arla Foods. A choice was made in favour of the price paid in Denmark because of the greater stability of the rate of exchange of the Danish Krone with the Euro. In principle the Swedish dairy farmers receive the same price as their Danish colleagues. Differences can occur only when there are big changes in exchange rates. In the year 2000 the British cooperative Milk Marque was split into three regional cooperatives, one of which was Axis. In 2001 Axis merged with Scottish Milk to form First Milk. Since 2001 the milk price comparison has been enlarged by the addition of Sodiaal cooperative (France). Before this the French milk prices had been calculated exclusively on information from private dairy companies. In the same year in Ireland Golden Vale was taken over by the Kerry Group. In New Zealand in 2001 Fonterra was formed by the merger of the New Zealand Dairy Group and Kiwi. In 2003 the publication of figures from Parmalat (Italy) was discontinued in view of the firm’s heavy debts which raised questions about the level of the calculated milk price. In 2004 Express Dairies in Britain was taken over by Arla Foods (Denmark/Sweden) and the British subsidiary continued under the name Arla Foods UK. From 2007 Arla Foods UK was replaced by Dairy Crest in the milk price comparison. Dairy Crest’s milk price relates to milk that is used for cheese making. Taken together with First Milk, Dairy Crest gives a more representative picture of British milk prices. Arla Foods UK , almost completely, specialises in liquid milk for consumption while First Milk is involved to the extent of about 60% in milk for consumption. Milk prices from Milcobel (Belgium) have been published in the comparison since 2005. This cooperative was formed by the merger of Belgomilk and Belgische Zuivelunie, BZU (Belgian Dairy Union). After Friesland Coberco Dairy Foods acquired a ‘royal’ epithet this Netherlands cooperative went under the name Royal Friesland Foods. The merger with Campina at the end of 2008 resulted in FrieslandCampina. At the start of the milk price comparison the price paid by the Finnish Kymmpi Group was published. This group of dairy companies, among which was Hämeenlinnan Osuusmeijeri, broke up later and thus the milk price comparison continued with Hämeenlinnan Osuusmeijeri after 2005. From 2008 the milk price comparison has been further enlarged with Alois Müller (Germany), DOC Kaas (Netherlands) and Granarolo (Italy). The reason was the desire of LTO (Dutch Organisation for Agriculture and Horticulture) and European Dairy Farmers (EDF) to enlarge the comparison with a private dairy from Germany, a second dairy from the Netherlands (alongside FrieslandCampina), and a southern European dairy. In Appendix 2 some essential information is given about the participating dairy companies.

LTO-International Milk Price Comparison 2008 27
5.4 Milk price analyses 5.4.1 Fluctuations in milk price during the year The level of the farmgate milk prices paid monthly depends partly on the seasonal pattern of production. Figure 6 shows that in the months when production is greatest (April, May, June) the price is at its lowest, and vice versa when the prices reach a peak production is at its lowest (in the autumn)6. Figure 6. Average monthly milk price and supply
The difference in milk price between the months differs between the companies. Arla Foods pays the most consistent milk price throughout the year, followed at a certain distance by Kerry (Ireland) and the German companies. However, it should be noted in relation to Arla Foods that this consistency is because the seasonal bonuses and deductions are not included in the monthly payment for milk but the balance is only worked out after the end of the milk price year. It is striking, in Ireland, that Kerry’s milk price fluctuates only a little throughout the year while that of Glanbia is very great because of the use of winter bonuses. Elsewhere the variation in milk prices during the year is relatively great for Sodiaal (France), the Netherlands companies and Milcobel (Belgium).
6 The milk supply concerns the average monthly delivery of milk in the following countries: Belgium, Denmark, Finland, France, Germany, Ireland, the Netherlands and the United Kingdom in the years 1997 to 2007 (thus, not all of the countries covered in the international milk price comparison). The milk price is the monthly average of the calculated milk prices of the European companies from 1999 to 2008.
700
750
800
850
900
950
1000
1050
1100
Jan Feb Mrch Apr May Jun Jul Aug Sep Oct Nov Dec25
26
27
28
29
30
31
32
33
34
supply milk price

28 LTO-International Milk Price Comparison 2008
5.4.2 Evolution of milk price in relation to quotations for butter and skimmed milk powder Figure 7 shows the evolution of the average farmgate milk price in comparison with that of the official quotations for butter and skimmed milk powder. For this purpose the prices of butter and skimmed milk powder are converted to a theoretical price for 100 kg of milk with a fat content of 3.7%. In these calculations assumptions are made about the quantity of milk needed to produce different dairy products (yield) and processing costs. Because of these assumptions the absolute level of the calculated theoretical price must be accorded less value in relation to the calculated LTO milk prices. Their value lies in the exercise of comparing the two sets of prices over the years. From figure 7. Average milk prices and quotations for butter and skimmed milk powder
From Figure 7 the conclusion can be drawn, circumspectly, that the price of ex-farm milk follows the quotations for butter and skimmed milk powder, albeit after a delay and with the fluctuations toned down. In the year 2000 and in 2007 farmgate milk prices clearly rose less than the profits on butter and skimmed milk powder, while in 2001, 2002 and 2008 the fall in milk prices was less and, moreover. it came later. That there is a relationship between the prices paid for ex – farm milk and the profits on butter and skimmed milk powder is not to be wondered at. In general in economics higher and lower profits are passed back to the previous links in the chain, with a delay and fluctuations toned down, and the relative strength of the participants in the chain also plays a role. That the profits from butter and skimmed milk powder have a strong influence on the evolution of milk prices should not be called surprising. It is not for nothing that from the very start of EU dairy policy the floor of the market was formed by the possibility of intervention purchasing for these products. Ex-farm milk is perishable but can be processed completely into these two non-perishable basic products. The prices of butter and skimmed milk powder are also related to the profits from other dairy products because dairy companies will always strive to process their milk into the most profitable products. When the prices of butter and skimmed milk powder climb more milk will be processed into these products and less milk will be available for processing into other dairy products. The consequence is that the prices of these other products will also rise, and the converse is true when prices fall.
25
27
29
31
33
35
37
39
41
43
45
1999 2000 2001 2002 2003 2004 2005 2006 2007 2008
€/10
0kg
quotations milk price

LTO-International Milk Price Comparison 2008 29

30 LTO-International Milk Price Comparison 2008
Annex I Key figures dairy companies Souce: annual reports of dairy companies
Milcobel Group developed six categories of activities in five companies. One is, Belgomilk, specialized in the production and marketing of cheese, milk powders and powder mixtures. The milk supply came in 2008 from 3,439 members and was representing a total turnover of 820 million Euros.
Alois Müller is one of the largest milk producers in Germany and the United Kingdom. Alois Müller is leader in fresh milk (23% market share) in the United Kingdom. The majority of sales (65%) in 2007 was in Germany.
Humana Milchunion
Humana Milch Union is the second largest milk processors in Germany. This supplier and international trading partner, which is located in more than 70 countries, consists of various divisions. Humana Milch Union eG is the largest division (34%) of the turnover and production of basic dairy products, yoghurt and dessert, ice and industrial products.
Milcobel
Alois Müller
Product share Belgomilk2007 (in %)
6%
13%
4%
5%
12%
16%
44%
Butter
Cream
Whole milk powder
Skimmed milkpowderMixtures
Small package
Cheese
Production share Humana 2007 (in %)
15% 32%
11%28%
2%
12%
Consumption milk
Cream cheese,quarkCheese
Butter
Milk powder
Bulk milk
Turnover share Milcobel 2008 (in%)
23%
16%
61%
Dairy
Ice cream
Distribution &cheesepackaging
Turnover per country Alios Müller 2007 (in %)
65%
35%
Germany(estimated)
UK, Italy,Netherlands &international
Turnover Humana 2008 (in %)
14%2%
3%
21%
10%
3%7%
6%
34%
Humana Milchunion eG
Humana GmbH
Milchwerke ThüringenGmbHKüstenland Milchunion
Euro Cheese Vertriebs-GmbHMilchwerke Oder-SpreeGmbHAuslands-TochtergesellschaftenÜbrige Konzern-GesellschaftenHansa-Milch AG(coöperatiepartner)

LTO-International Milk Price Comparison 2008 31
The north German company Nord Milch is flexible to market a versatile product package into milk powder, sustainable milk and fresh milk. In 2007 this product package was set for 34% of fresh products and 34% from condensation, which together comprise the largest share. The membership has compared to pervious year declined by 8% in 2008 to 8,500 members.
Arla Foods is a dairy co-operation owned by almost 4,000 Danish and Swedish dairy farmers. Several products are produced in a dozen countries and are in more than 100 countries in the shelves.
Hämeenlinnan Osuusmeijeri with focus on fresh milk, but they have also cream and buttermilk in the product package. All these products are marketed by Arla Ingman Foods, the second dairy company in Finland (after Valio) and 70% owned by Arla Foods.
Nordmilch
Arla Foods
Hämeenlinnan Osuusmeijeri
Product share Nordmilch 2008 (in %)
24%
18%
7%11%
40%
Fresh dairy
Cheese
Butter
Milk powder
Condens
Product share Arla 2008 (in %)
45%
25%
13%4%
13%
Fresh dairy
Cheese
Butter andspreadsMilkpowders
Other
Product share Hämeenlinnan Osuusmeijeri 2007
5%2%
93%
Milk
Cream
Buttermilk
Market share Arla per country 2008 (in %)
2%
5%
5%
3%
1%
26%
19%
21%18%
Sweden
Denmark
UK
Other worldcountriesAsia
US
Middle East
Other EU countries
Other countries EU

32 LTO-International Milk Price Comparison 2008
In France, Bongrain is one of the largest dairy companies and the company is world leader with their specialty cheese. Bongrain is located in 26 countries and the production of cheese has the highest turnover of the company in 2008.
In 2007, Danone processed over the world 4.5 billion liters of milk, supplied by 24,000 dairy farmers from more than 20 countries. Danone sees itself as a world leader in fresh dairy products with a market share of 20% worldwide and presence in 40 countries.
More than half of processed milk form Lactalis is supplied in France. Their production is mainly cheese, butter and cream.
Bongrain
Danone
Lactalis
Product share Bongrain 2008 (in %)
34% 66%
Cheeseproducts
Other dairyproducts
Market share Danone 2008 (in %)
24%
49%
12%
15%
West Europe
East Europe
Oceania
Other countries
Product share Danone 2008 (in %)
57%
19%
18%
6% Fresh dairy
Water
Baby food
Medicalnutrition
Product share Lactalis 2007 (in %)
6%
32%
25%
26%
5%6%
Milk
Cheese
Butter
Cream
Fresh dairy
Industrialproducts

LTO-International Milk Price Comparison 2008 33
The French dairy company Sodiaal has its largely marketing area in Western Europe with France as home. The broad product range consists of Candia (milk), Fromagieres Riches Monts (cheese), Sodiaal Industry (casein), Beuralia (butter), Registro Lait (coffee milk) and Yoplait (yogurt and drinks).
Dairy Crest
Dairy Crest achieved in 2007/08 a turnover of 808 million Euros of which 32% of food products and 68% of dairy products. Dairy Crest sells its products to various British supermarket chains. They are also manufacturing cheese (including Davidstow) and spreads.
First Milk is the largest dairy co-operation in the United Kingdom with 2,600 members. First Milk is distinguished by its own plants in different areas as England, Wales and Scotland to make cheese from milk from the same areas.
Sodiaal
First Milk
Production share Sodiaal 2008 (in %)
47%
9%
30%
13%
1%
Fresh milk
Cheese
Ingredients
Sold milk
Other
Product revenue Sodiaal 2008 (in %)
20%3%9%
3%
31% 34%
Candia
FromagieriesRiches MontsSodiaalIndustrieBeuralia
Régilait
Yoplait
Product share Dairy Crest (in %)
32%
16%
1%4%
47%
Milk products
Cheese, yoghurtand desserts
Butter andspreads
Cream
Fresh milk
Product share First Milk 2008 (in %)
35%
9%
56%
Milk
Cheese
Ingredients
Turnover per division DC, end-of-year 31 maart 2008 (in %)
32%
68%
Food (spreads,cheese, Yoplait)
Dairy (fresh,household,ingredients)

34 LTO-International Milk Price Comparison 2008
Glanbia Group is located in Ireland, United States, Mexico and Nigeria. Glanbia has a number one position in fresh milk, cream, fruit yoghurts, cheeses, fresh soup and block Cheddar in Ireland.
Ireland's Kerry Group is an international company. Kerry Foods supplies the largest supermarket chains in Ireland and the United Kingdom.
The Dutch dairy company DOC kaas processed 86% of its milk into cheese, 4% goes to whey products and the remaining 10% to milk and cream sales. Almost all production is sold in the Netherlands.
Glanbia
Kerry
DOC kaas
Product share Glanbia Group 2008 (in %)
34%
66%
Cheese
Foodingredients
Market share per country Glanbia 2008 (in %)
14%
57%
29%
Ireland
International
Joint venturesand associates
Production share Kerry 2008 (in %)
66%
34%
Consumerfood
Foodingredients
Market share per country Kerry 2008 (in %)
28%
62%
10%
Europe
America
Asia &Oceania
Product share DOC kaas 2008 (in %)
86%
4%10%
cheese
whey and wheyproducts
milk and creamsales

LTO-International Milk Price Comparison 2008 35
The merged diaries Friesland Foods and Campina achieves 30% of total turnover in the Netherlands. In 2008, the milk was supplied by more than 15,800 members from the Netherlands, Germany and Belgium.
The unlisted Stock Exchange company Granarolo Group is the largest fresh milk producer in Italy. The milk production is guaranteed by the 2,000 members and other dairy co-operations in 14 different regions.
The total milk supply of New Zealand dairy company Fonterra was in season 2008/09 12.5 billion kg. This milk is supplied by 11,000 dairy farmers from across New Zealand and consumed in more than 140 countries.
FrieslandCampina
Granarolo
Fonterra
Market revenue per country FC 2008 (in %)
28% 16%
14%
3%
30%9%
Netherlands
Germany
Other EU
Asia and Australia
Africa and theMiddle EastNorth and SouthAmerica
Market share per country Granlatte 2007 (in %)
30%
70%
Italy
Other countries
Product share Fonterra 2008 (in %)
27% 73%
Ingredients
Milk New-Zealand
Turnover per division FC 2008 (in %)
1%32%
26%26%
15%
Consumer productsWest EUConsumer productsInternationalCheese & butter
Ingredients
Business
Turnover per division Fonterra 2008 (in %)
47%
6%
26%
16%
5%Commodities &ingredientsAustralia & NewZealandAsia, Africa &Middle EastLatin America
Inter-Group
36 LTO-International Milk Price Comparison 2008
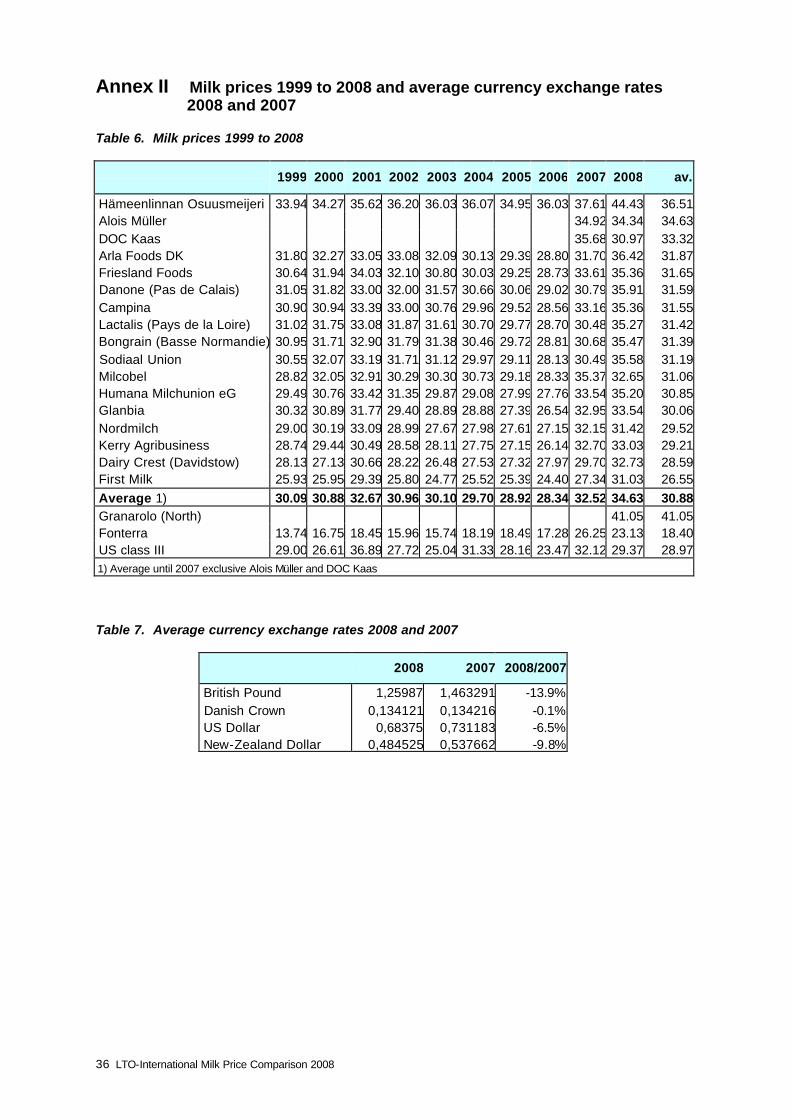
Annex II Milk prices 1999 to 2008 and average currency exchange rates 2008 and 2007 Table 6. Milk prices 1999 to 2008
1999 2000 2001 2002 2003 2004 2005 2006 2007 2008 av.
Hämeenlinnan Osuusmeijeri 33.94 34.27 35.62 36.20 36.03 36.07 34.95 36.03 37.61 44.43 36.51 Alois Müller 34.92 34.34 34.63 DOC Kaas 35.68 30.97 33.32 Arla Foods DK 31.80 32.27 33.05 33.08 32.09 30.13 29.39 28.80 31.70 36.42 31.87 Friesland Foods 30.64 31.94 34.03 32.10 30.80 30.03 29.25 28.73 33.61 35.36 31.65 Danone (Pas de Calais) 31.05 31.82 33.00 32.00 31.57 30.66 30.06 29.02 30.79 35.91 31.59 Campina 30.90 30.94 33.39 33.00 30.76 29.96 29.52 28.56 33.16 35.36 31.55 Lactalis (Pays de la Loire) 31.02 31.75 33.08 31.87 31.61 30.70 29.77 28.70 30.48 35.27 31.42 Bongrain (Basse Normandie) 30.95 31.71 32.90 31.79 31.38 30.46 29.72 28.81 30.68 35.47 31.39 Sodiaal Union 30.55 32.07 33.19 31.71 31.12 29.97 29.11 28.13 30.49 35.58 31.19 Milcobel 28.82 32.05 32.91 30.29 30.30 30.73 29.18 28.33 35.37 32.65 31.06 Humana Milchunion eG 29.49 30.76 33.42 31.35 29.87 29.08 27.99 27.76 33.54 35.20 30.85 Glanbia 30.32 30.89 31.77 29.40 28.89 28.88 27.39 26.54 32.95 33.54 30.06 Nordmilch 29.00 30.19 33.09 28.99 27.67 27.98 27.61 27.15 32.15 31.42 29.52 Kerry Agribusiness 28.74 29.44 30.49 28.58 28.11 27.75 27.15 26.14 32.70 33.03 29.21 Dairy Crest (Davidstow) 28.13 27.13 30.66 28.22 26.48 27.53 27.32 27.97 29.70 32.73 28.59 First Milk 25.93 25.95 29.39 25.80 24.77 25.52 25.39 24.40 27.34 31.03 26.55 Average 1) 30.09 30.88 32.67 30.96 30.10 29.70 28.92 28.34 32.52 34.63 30.88 Granarolo (North) 41.05 41.05 Fonterra 13.74 16.75 18.45 15.96 15.74 18.19 18.49 17.28 26.25 23.13 18.40 US class III 29.00 26.61 36.89 27.72 25.04 31.33 28.16 23.47 32.12 29.37 28.97 1) Average until 2007 exclusive Alois Müller and DOC Kaas Table 7. Average currency exchange rates 2008 and 2007
2008 2007 2008/2007
British Pound 1,25987 1,463291 -13.9% Danish Crown 0,134121 0,134216 -0.1% US Dollar 0,68375 0,731183 -6.5% New-Zealand Dollar 0,484525 0,537662 -9.8%

LTO-International Milk Price Comparison 2008 37

38 LTO-International Milk Price Comparison 2008
Annex III Additional figures dairy farming structure In ten years time, there are many visible changes in the European dairy sector. The following tables give an addition to the structural data of EU countries from the LTO -International Milk Price Comparison, as mentioned in Chapter 5. Table 8. Average milk yield per cow
Average milk yield per cow (x thousand) 1998 2007 2008 index (1998=100)
Belgium * 5,299 5,573 5,467 103 Denmark 6,790 8,352 8,399 124 Germany 5,744 6,977 7,000 122 Ireland 4,086 4,917 4,991 122 France 5,530 6,454 6,749 122 Italy 5,240 5,957 6,002 115 Netherlands 6,777 7,945 7,926 117 Finland 6,416 7,893 7,806 122 United Kingdom 5,886 7,061 6,952 118 New-Zealand 3,560 3,763 3,772 106 United States of America 7,798 9,193 9,282 119 * 1998 figure Belgium is based on Belgium and Luxembourg Source: Statistical Yearbook Dutch Dairy Board
Table 9. Number of cows
Number of milk cows (x thousand) 1998 2007 2008 index
(1998=100)
Belgium * 679 500 495 73 Denmark 680 551 551 81 Germany 4,833 4,087 4,121 85 Ireland 1,277 1,088 1,050 82 France 4,432 3,799 3,759 85 Italy 2,110 1,839 1,830 87 Netherlands 1,611 1,413 1,466 91 Finland 380 288 296 78 United Kingdom 2,480 1,978 1,954 79 New-Zealand 3,223 4,185 4,296 133 United States of America 9,158 9,158 9,271 101 * 1998 figure Belgium is based on Belgium and Luxembourg Source: Statistical Yearbook Dutch Dairy Board