pyramid analytics training - mccc knowledge base - home training guide - dashboards.pdf · from the...
TRANSCRIPT
Blackboard Inc. Confidential – All Rights Reserved Page | 53
Dashboards are a way to display key components, goals for specific or like pieces of information for ease of access and use of the information. A dashboard can be organized by the person or types of individuals that will be using the dashboard or by departments, etc.
Creating a Dashboard
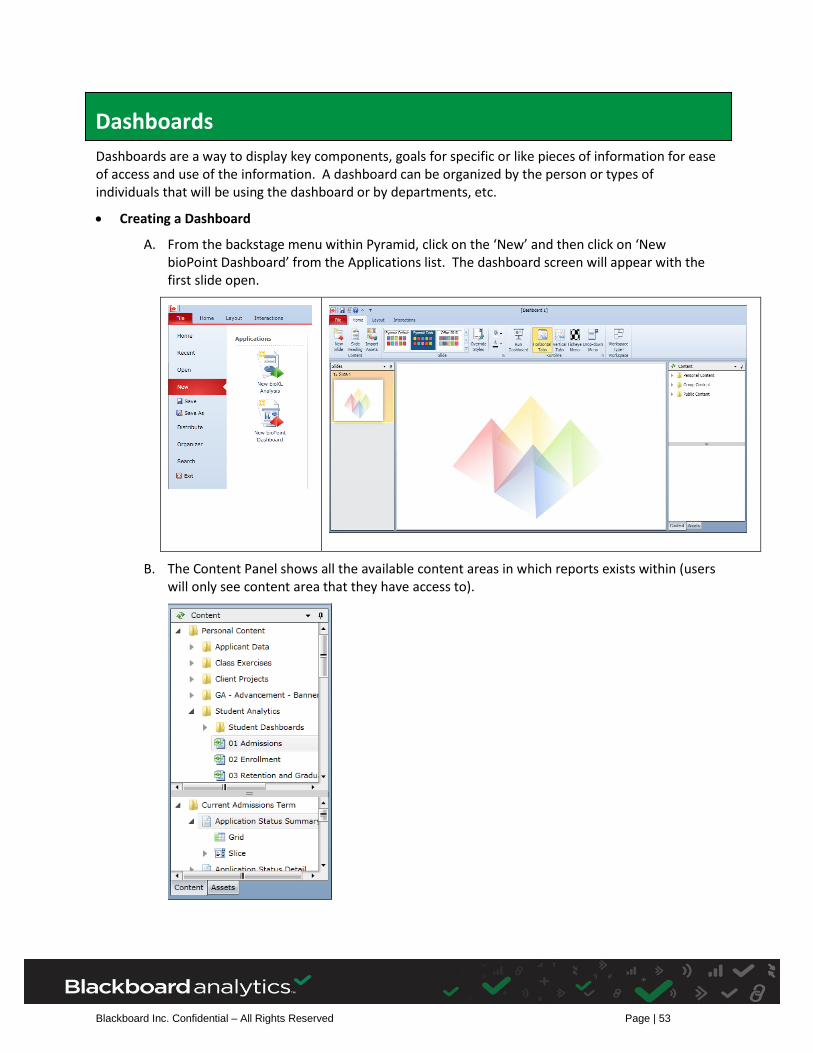
A. From the backstage menu within Pyramid, click on the ‘New’ and then click on ‘New bioPoint Dashboard’ from the Applications list. The dashboard screen will appear with the first slide open.
B. The Content Panel shows all the available content areas in which reports exists within (users will only see content area that they have access to).
Dashboards

Blackboard Inc. Confidential – All Rights Reserved Page | 54
C. Before selecting a report from the Content panel, you can determine sections of the slide to place the slicers, charts, grids and/or map within. To create sections, click on the ‘Layout’ ribbon panel and click on the Horizontal Dissection and create a section within the slide. You can also click on Vertical to then create a vertical dissection. The example below show one Horizontal dissection creating 2 areas within the slide.
You can click on the green button to move the line up or down to size each section.
D. Select a report to add to the slide from the content area. This can be down by clicking the arrows next to the folders/books/reports within the Content panel. Once you have clicked on the arrow to the left of the report, you will see the contents of the report, (ie, Grid, Chart, Slice).
1. Select the grid or chart by clicking on it and then dragging it into the slide workspace.
2. Click on the arrow next to Slice for the report and you will see each of the slicers for the selected report. Click and drag into the slide to where you would like to place the slicers.
Blackboard Inc. Confidential – All Rights Reserved Page | 55
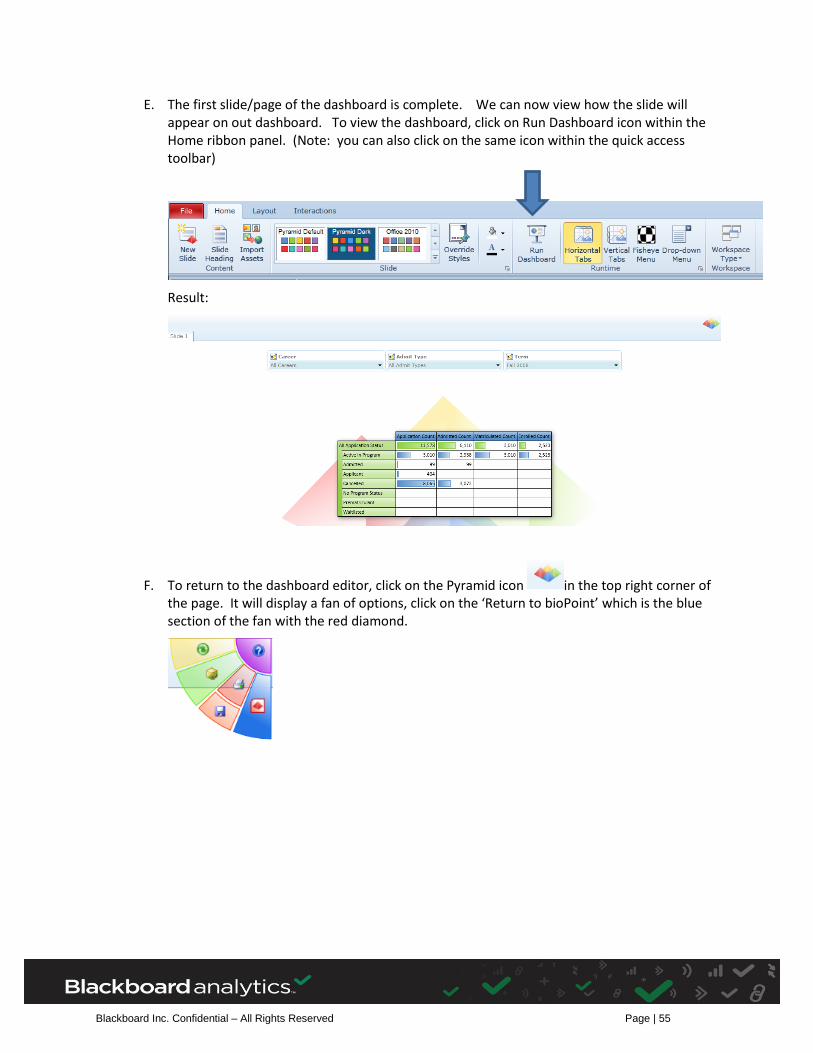
E. The first slide/page of the dashboard is complete. We can now view how the slide will appear on out dashboard. To view the dashboard, click on Run Dashboard icon within the Home ribbon panel. (Note: you can also click on the same icon within the quick access toolbar)
Result:
F. To return to the dashboard editor, click on the Pyramid icon in the top right corner of the page. It will display a fan of options, click on the ‘Return to bioPoint’ which is the blue section of the fan with the red diamond.

Blackboard Inc. Confidential – All Rights Reserved Page | 56
Adding a New Slide – To add a new slide, click on the ‘New Slide’ option on the Home ribbon panel.
A. Click on the Layout ribbon panel and create 3 sections on the slide using the Horizontal and Vertical Dissections.
B. Select the first report and add it to a section of the slide; add the second report to the other section and then add the slicers to the top section. (Note: only select slicers from one of the reports if they are the same).

Blackboard Inc. Confidential – All Rights Reserved Page | 57
Adding Slicer Interactions – Slicers that have been added will automatically link/interact with the report that they were created within. These slicers can be linked to other reports on the slide even though the slicer was not part of the report. To link/interact these slicers to other reports on the slide, we need to create interactions between the slicers and the report. This can be done by clicking on the ‘Interactions’ ribbon panel.
1. Click on the ‘Slice’ icon within the ‘Interactions’ ribbon panel. Once highlighted, click on the first slicer; a purple arrow/line will appear. Drag the arrow from the slicer to the report you want to create the interaction with. Repeat this for each of the slicers.
2. Once the interaction has been made, click on the Slice icon. The arrows will disappear, but the interactions will be saved.
You can run the dashboard to test the slicers and view each slide.

Blackboard Inc. Confidential – All Rights Reserved Page | 58
Global Slicers – Global Slicers are similar to report slicers, but are not created within the reports. A Global slicer will be used for each dashboard slide. For instance, if every dashboard slide for your Admission dashboard will include a slicer for TERM, you can create this as a global slicer and it will then default in on each dashboard slide as you create them.
A. To create a Global Slicer, click on ‘New Global Slicer’ from the ‘Interactions’ ribbon panel
B. Once you have clicked on ‘New Global Slicer’, the Global Slicer Wizard box will appear. Click the ‘Next’ button at the bottom to continue.
C. Enter in the name of the new global slicer in the Slice Name box and then select the server and cube to which hierarchy/dimension to use for the slicer. Click on the Next button at the bottom.

Blackboard Inc. Confidential – All Rights Reserved Page | 59
D. Now select the measure/dimension to use for the slicer. To switch to see the list of dimensions, click the small down arrow next to Measures within the Dimension field.
E. Once you have selected a Dimension and Hierarchy, you can then select the specific members. In addition, you can determine which member you would like to default in for the global slicer (First, Last or a specific member).

Blackboard Inc. Confidential – All Rights Reserved Page | 60
F. Click on Finish once you are done. You slide will automatically update and include the new global slicer as shown below. Notice that the global slicer will have a little globe on it. As you add new slides to your dashboard, this slicer will automatically appear.
G. Each global slicer on each slide will need to have an Interaction link to the reports on the slide. This is done the same manner at the other slicers. (Click on Slice and drag from the global slicer to the report(s) you wish to have an interaction with.)

Blackboard Inc. Confidential – All Rights Reserved Page | 61
Renaming Slides – To change the names of the slides, since the default is ‘Slide 1…2’, right click on the slide and select the Slide Header Name from the content menu.
Removing the Pyramid watermark – Click on small down arrow in the slide portion of the Home ribbon panel.
The following Slide Options screen will appear. Click on Gradient or Flat (and can select a color) and click OK.

Blackboard Inc. Confidential – All Rights Reserved Page | 62
Results:
Adding Report Panels – Each report can display the reporting panel, which will box in the report and show the report title (selection criteria, filters, etc). To add the reporting panels to display, within the Layout ribbon panel, click on ‘Show Panels’. Results:

Blackboard Inc. Confidential – All Rights Reserved Page | 63
Adding Assets – Dashboard content that is NOT derived from bioXL reports and queries are called "Assets". An example of an asset would be an image documents such as the college logo. There are 2 kinds of asset types:
Image Assets – imported images such as png or jpg files General Assets – template items such as Date/Time stamps, Text Box/Titles
A. To import an image document to appear on a dashboard slide, click on the ‘Import Access’
button within the Home ribbon panel
B. The Dashboard Asset Wizard screen will appear:
C. Image will already be highlighted. Enter in a name for your asset within the Asset Name field. You can also enter in a brief description if needed. Not required.
D. Select the type of access for the asset. Public or Private. (Public will allow others to use the asset, Private it will only be available to you).

Blackboard Inc. Confidential – All Rights Reserved Page | 64
E. Click the Next button to continue. The next screen will appear to select the image.
F. Click on the … to access the location of the image. 1. Once located, click open to use the image document. The Dashboard Asset Wizard
screen will update to display the image/asset. 2. Click the Next button to continue.
G. The Dashboard Asset Wizard will prompt you to select the folder to place the asset within. Select the folder and click on the Finish button at the bottom of the screen.

Blackboard Inc. Confidential – All Rights Reserved Page | 65
H. You will be prompted to select the security access for the asset type. This is determining whom can access the asset to modify or to use(read). Click OK when done.
Results: Within the Content Panel, change the view by clicking on the Asset tab. You can now see the
asset that was just added.
Blackboard Inc. Confidential – All Rights Reserved Page | 66
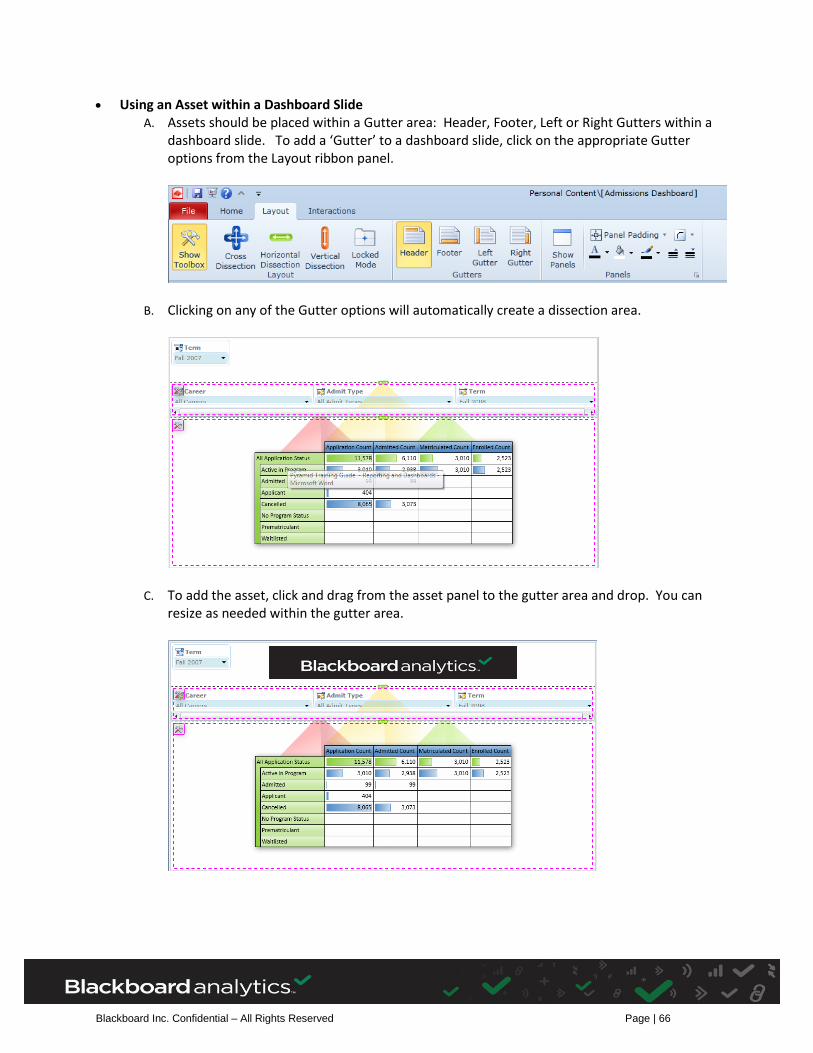
Using an Asset within a Dashboard Slide A. Assets should be placed within a Gutter area: Header, Footer, Left or Right Gutters within a
dashboard slide. To add a ‘Gutter’ to a dashboard slide, click on the appropriate Gutter options from the Layout ribbon panel.
B. Clicking on any of the Gutter options will automatically create a dissection area.
C. To add the asset, click and drag from the asset panel to the gutter area and drop. You can resize as needed within the gutter area.

Blackboard Inc. Confidential – All Rights Reserved Page | 67
Saving the Dashboard – Click on the save button within the quick access toolbar to save the dashboard and slides. This will prompt you with the ‘Save Book’ screen.
1. Select the content area for where you wish to save the dashboard.
2. Enter in a Book name for the dashboard and click on Save Book.
Result: