pycon hk 2015 - monitoring the performance of python web applications
TRANSCRIPT

Monitoring the performance of Python
web applications
Graham Dumpleton PyCon HK - November 2015


http://blog.newrelic.com/wp-content/uploads/rum_timeline_diagram_aligned_web_res.jpg


Why it matters
• Reduce transaction response times so users are happier.
• Reduce costs by making better use of the resources you have available.

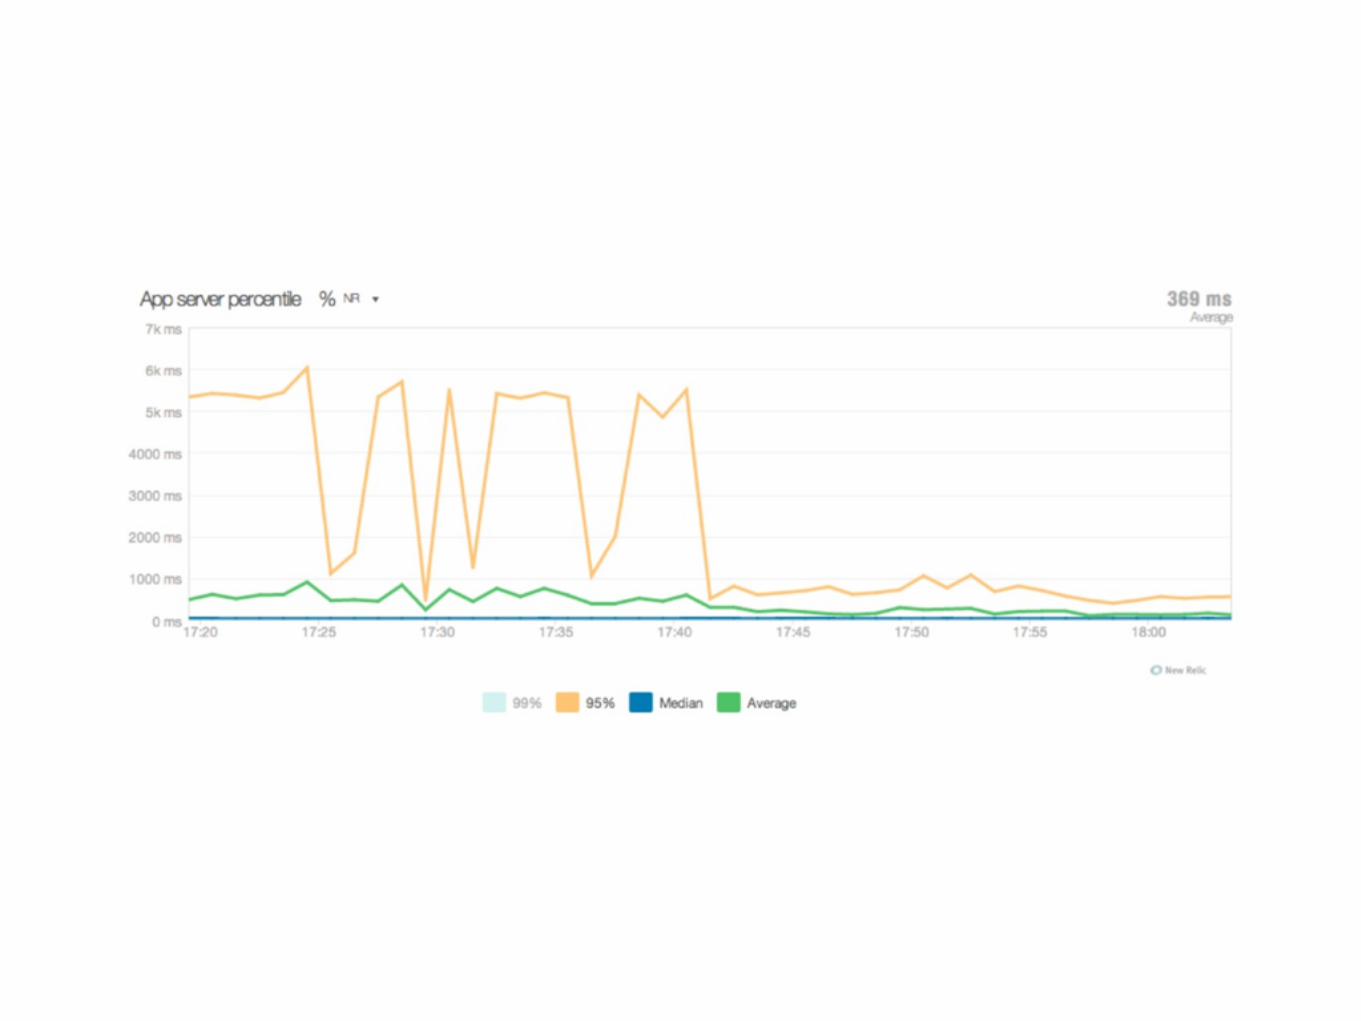
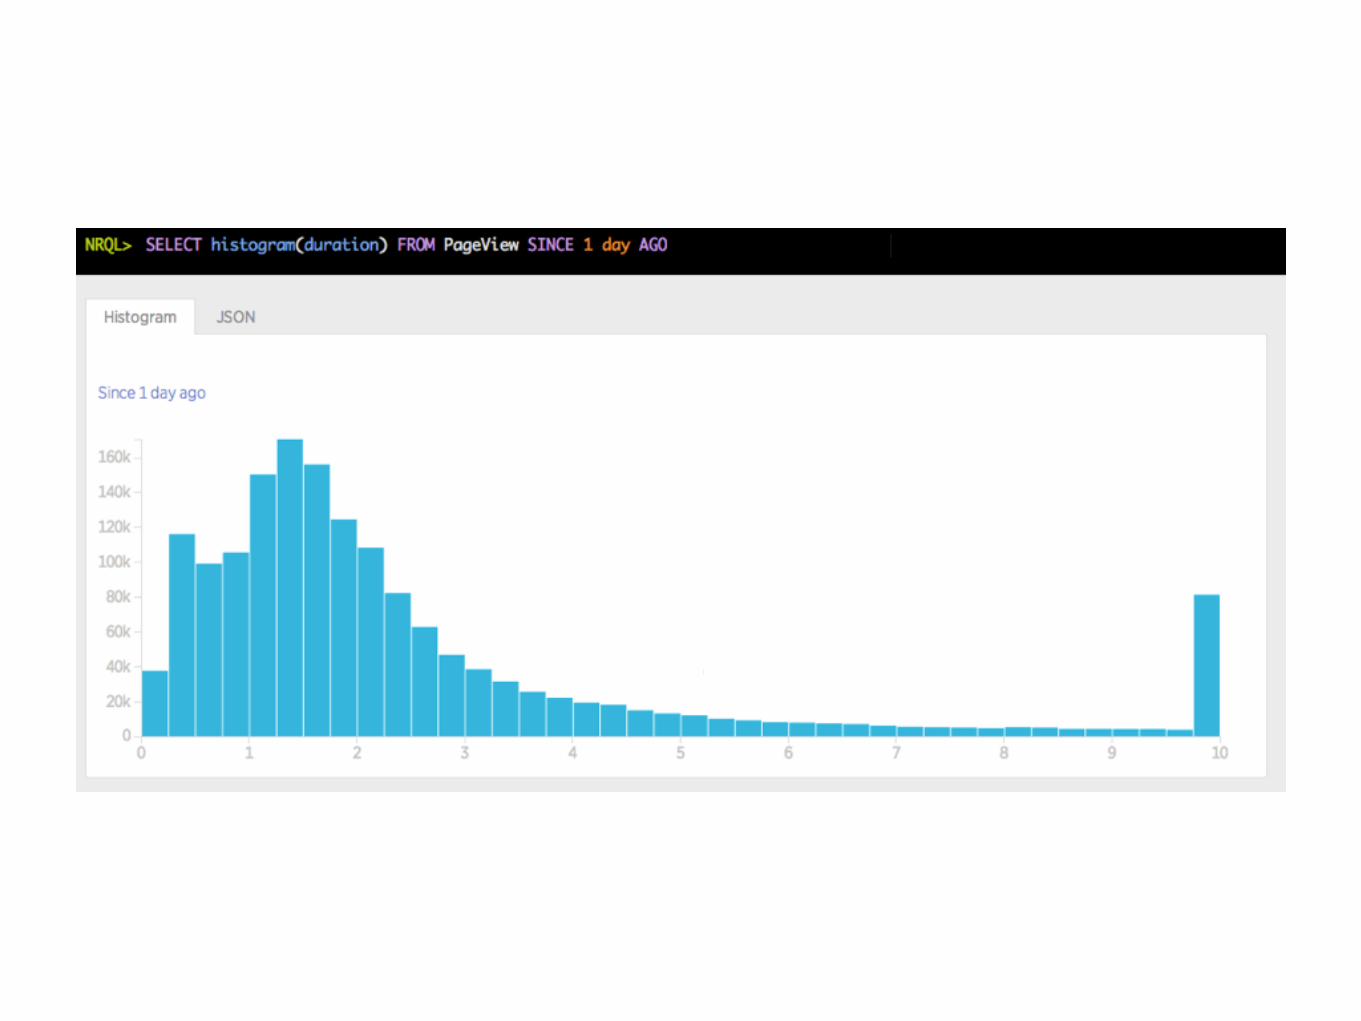
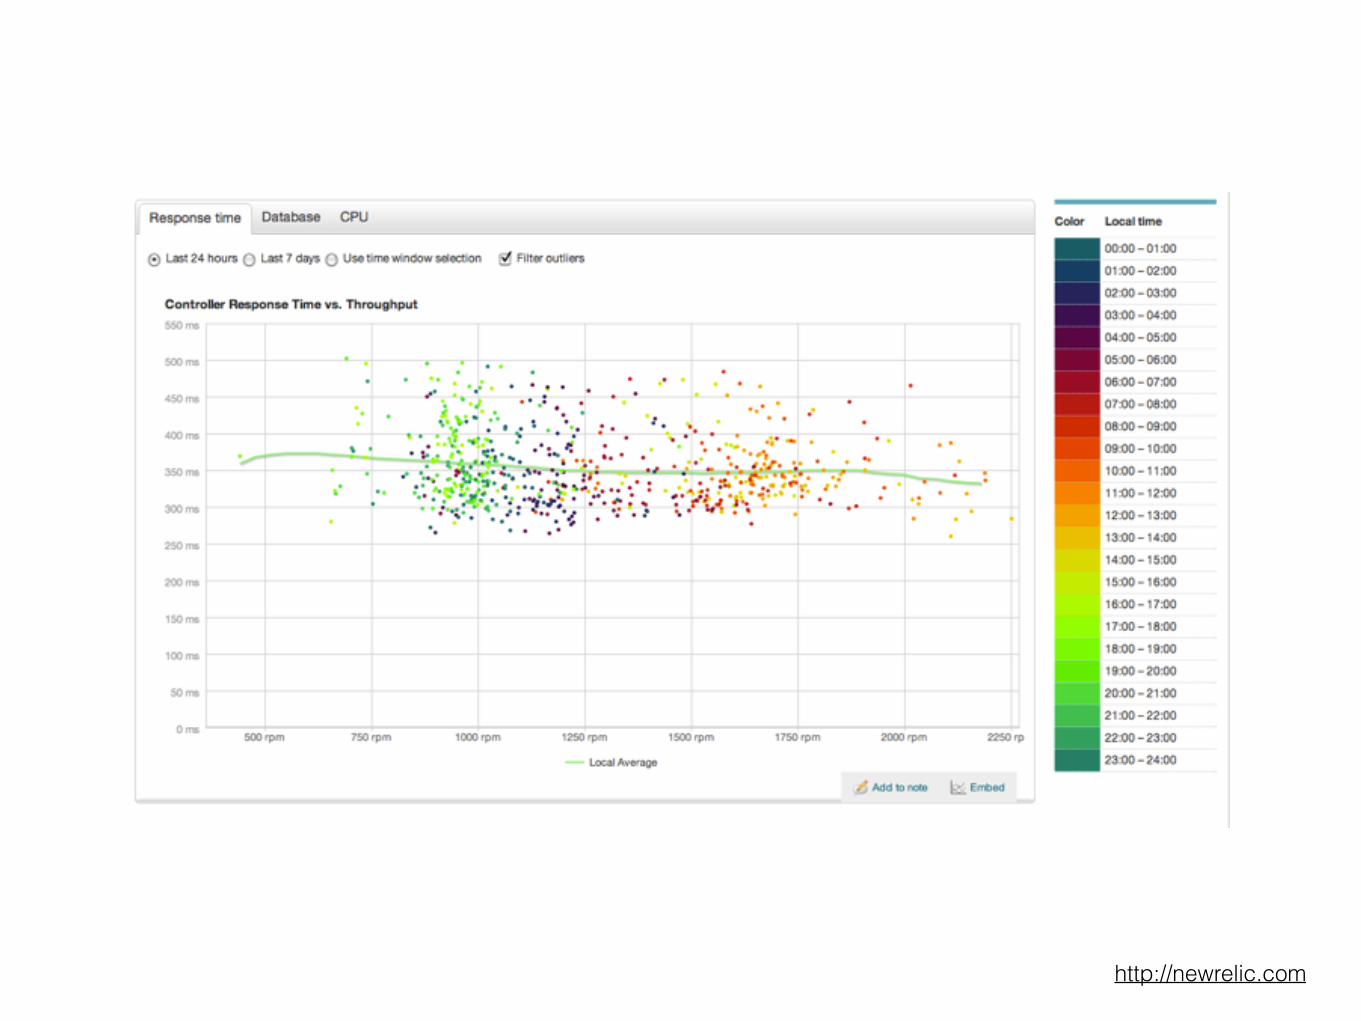
Visualising traffic

Concurrent requests
3
2
1
Proc
esse
s Threads
1
23
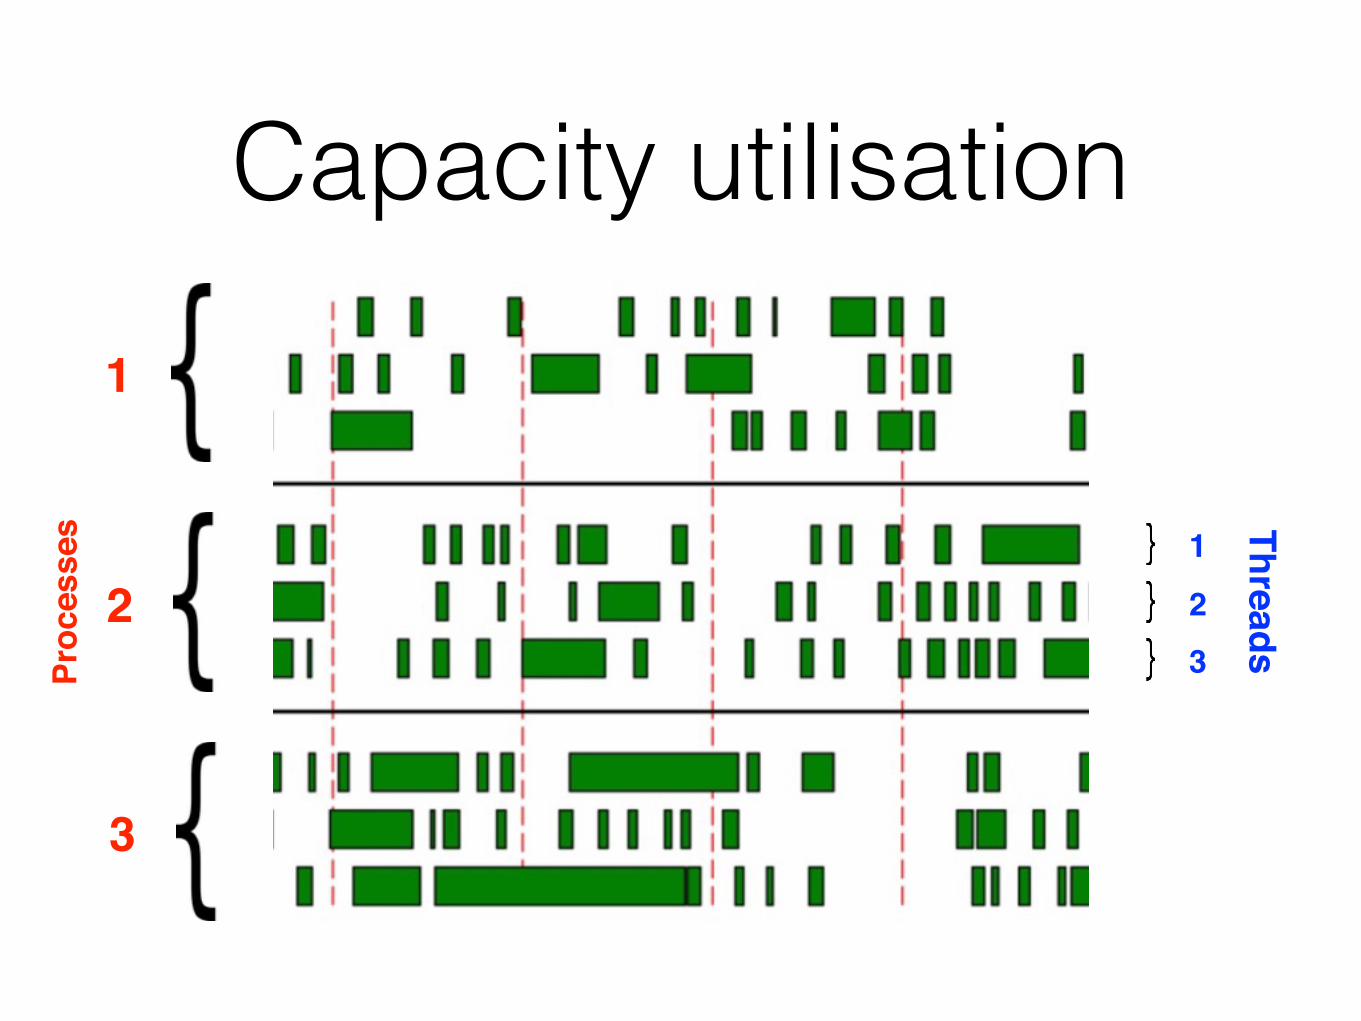
Capacity utilisation
3
2
1
Proc
esse
s Threads
1
23

CPU burn (request)

I/O Bound - 1 Client

I/O Bound - 4 Clients

CPU Bound - 1 Client

CPU Bound - 2 Clients

CPU Bound - 4 Clients (1)
4
1
2

CPU burn calculation
CPU usage CPU burn = ————
request time
CPU usage = user CPU time + system CPU time

Increasing concurrency
0%
25%
50%
75%
100%
0 secs
3 secs
6 secs
9 secs
12 secs
1 2 3 4 5 6 7 8 9 10
Request time CPU time (request) CPU burn (request)
Concurrent requests

CPU burn (process)

CPU Bound - 4 Clients (2)
4
1
2

100% CPU burn
0%
40%
80%
120%
160%
0 secs
3 secs
6 secs
9 secs
12 secs
1 2 3 4 5 6 7 8 9 10
Request time CPU time (request) CPU burn (request)CPU burn (process)
Concurrent requests
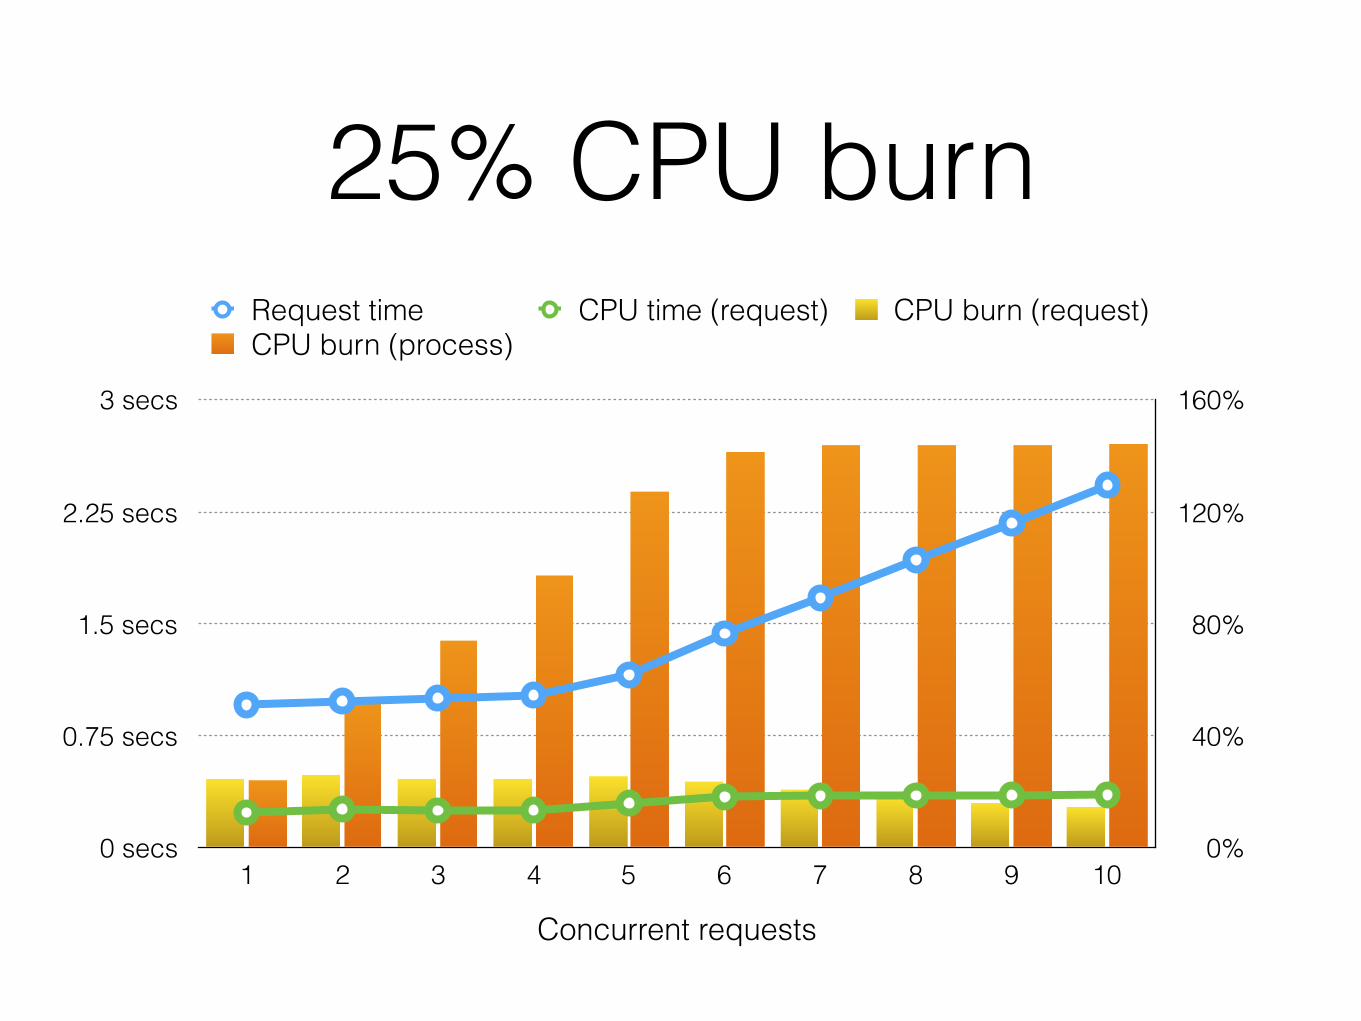
25% CPU burn
0%
40%
80%
120%
160%
0 secs
0.75 secs
1.5 secs
2.25 secs
3 secs
1 2 3 4 5 6 7 8 9 10
Request time CPU time (request) CPU burn (request)CPU burn (process)
Concurrent requests

Global interpreter lock

Poor mans threading
Waiting for I/O (thread is blocked)
Running (thread active)
Waiting for GIL
Thread 1
Thread 2
1
2
3
4
5
6

100% CPU burn 4 Processes / 1 Thread
0%
40%
80%
120%
160%
0 secs
0.25 secs
0.5 secs
0.75 secs
1 secs
1 2 3 4 5 6 7 8 9 10
Request time CPU time (request) CPU burn (request)CPU burn (process)
Concurrent requests

100% CPU burn + Queue time4 Processes / 1 Thread
0%
40%
80%
120%
160%
0 secs
0.5 secs
1 secs
1.5 secs
2 secs
1 2 3 4 5 6 7 8 9 10
Request time CPU time (request) CPU burn (request)CPU burn (process) Queue time (max)
Concurrent requests

Reaching capacity4 Clients ==> 4 Processes / 1 Thread
1
1
1
1
2
2
2
2
3
3
3
3
4
4
4
4

5 clients ==> 4 Processes / 1 Thread
Capacity reached
Delayed
1
1
1
1
1
2
2
2
2
2
3
3
3
3
3 4

All requests are not the same

Don’t trust benchmarks

Is there an answer?

I/O vs CPU• I/O bound request handlers.
• Okay to use multiple threads.
• CPU bound request handlers.
• Better to use multiple processes.
• Restrict processes to single threads, or at most two if requests have very short response time.

I/O and CPU
• Use no more than 3 to 5 threads per process.
• Use a small number of processes.
• Watch the CPU utilisation of processes.
• Be prepared to scale out to more hosts.

Partitioning
Proxy
CPU
I/O
CPU
Multiple threads.
Single threaded. Multiple processes./cpu-tasks
/io-tasks

Daemon modeWSGIDaemonProcess mixed \ processes=3 threads=5
WSGIDaemonProcess io \ processes=1 threads=25
WSGIDaemonProcess cpu \ processes=5 threads=1
WSGIProcessGroup mixed

Request DelegationWSGIScriptAlias / /some/path/app.wsgi \ application-group=%{GLOBAL}
<Location /io-tasks>WSGIProcessGroup io</Location>
<Location /cpu-tasks>WSGIProcessGroup cpu</Location>

DEMO TIME(If we have enough time)
