pw3365-20 - usedsite.co.kr · model pw3365 instrument accessories and options accessories and...
TRANSCRIPT

PW3365-20 C
LAM
P ON
POW
ER LO
GG
ER Instruction M
anual
EN
PW3365-20CLAMP ON POWER LOGGER
Instruction Manual
Feb. 2019 Revised edition 3 PW3365A981-03 19-02H
p.5
p.223
Be sure to read this manual before using the instrument. Safety Information
TroubleshootingMaintenance and ServiceError Indication
When using for the first timeNames and FunctionsMeasurement Preparations
p.18p.27 p.227
Video Scan this code to watch an instructional video.Carrier charges may apply.


Contents
i
1
2
Contents
Introductions ............................................................................1Confirming Package Contents ................................................2
Storing the Instrument in the Carrying Case (Option) ........4Safety Information....................................................................5Operating Precautions.............................................................9Measurement Flowchart ........................................................13
Chapter 1 Overview __________________________________ 15
1.1 Product Overview ....................................................151.2 Features ....................................................................161.3 Names and Functions (PW3365) ............................181.4 Names and Functions
(PW9020 Safety Voltage Sensor) ...........................211.5 Screen Configuration ..............................................221.6 On-Screen Indicators ..............................................24
Chapter 2 Measurement Preparations___________________ 27
2.1 Preparation Flowchart .............................................272.2 Preparing to Use the Instrument after Purchase ..28
Attaching Color Clips around Voltage Sensors andGrouping Together Cords ................................................28Attaching Color Clips around Clamp Sensors andGrouping Together Cords ................................................30Installing (replacing) the Battery Pack ..............................32Setting the Language and Measurement TargetFrequency (50 Hz/60 Hz) .................................................35Setting the Clock ..............................................................36
2.3 Pre-Operation Inspection ........................................372.4 Inserting (Removing) an SD Memory Card ...........382.5 Connecting the AC Adapter ....................................412.6 Turning the Power On/Off .......................................42
PW3365A981-03

Contents
ii
Chapter 3 Connecting to Target to be Measured __________43
3.1 Checking the Equipment before Connecting the Instrument ............................................................... 43
3.2 Connection Procedure ........................................... 443.3 Setting Measurement Conditions on the Wiring
Diagram Screen ...................................................... 453.4 Connecting the Current Sensors to the
Instrument ............................................................... 533.5 Connecting the Clamp Sensors to the Instrument 553.6 Connecting the Voltage Sensors to Target to be
Measured ................................................................. 573.7 Connecting Clamp Sensors to Target to be
Measured ................................................................. 60Load Current Measurement ............................................. 61Leakage Current Measurement ....................................... 62
3.8 Checking the Current Range ................................. 633.9 Verifying Correct Wiring (Wiring Check) .............. 65
Chapter 4 Changing Settings __________________________71
4.1 Viewing and Using the Settings Screen ............... 714.2 Changing Measurement Settings .......................... 72
Measurement 1 Setting Screen ....................................... 72Measurement 2 Setting Screen ....................................... 74
4.3 Changing Recording (Save) Settings ................... 78Recording 1 Setting Screen ............................................. 78Recording 2 Setting Screen ............................................. 83
4.4 Changing System Settings (as Necessary) .......... 89System 1 Setting Screen ................................................. 89System 2 Setting Screen ................................................. 91
4.5 Initializing the Instrument (System Reset) ........... 92When the Instrument Is Operating in an Odd or Unexpected Manner (System Reset) ............................... 92Reverting All Settings to the Factory Defaults (Factory Reset) ................................................................ 93Factory Settings ............................................................... 94

Contents
iii
3
4
5
6
Chapter 5 Viewing Measurement Data __________________ 97
5.1 Viewing and Using the Measurement Screen .......971P2W x 2 or 1P2W x 3 Wiring ..........................................98
5.2 List of Measurement Screens .................................995.3 Viewing Data (Voltage, Current, Power, and Energy)
as a List ..................................................................1015.4 Viewing Voltage and Current Value Details
(RMS/Fundamental Wave/Peak Values, and Phase Angles) ................................................102
5.5 Viewing Power Details (Channel Power Values) 1045.6 Viewing Energy
(Active Energy and Reactive Energy) ..................1055.7 Viewing a Demand Graph .....................................1065.8 Viewing a Harmonic Graph ...................................1075.9 Viewing a Harmonic List .......................................1085.10 Viewing Waveforms ...............................................109
Changing the Zoom Factor for the Vertical Axis Used to Display Voltage and Current Waveforms .......................110
5.11 Enlarging Measured Values on the Display ........1115.12 Viewing a Trend Graph .........................................1135.13 If No Measured Value Is Displayed ......................115
Chapter 6 Starting and Stopping Recording and Measurement _________________________ 117
6.1 Starting Recording ................................................118Starting Recording Manually ..........................................118Staring Recording by Specifying a Time [TIME] ............ 119Starting Recording at a Good Time Division [INTERVAL] ..120
6.2 Stopping Recording ..............................................121Stopping Recording Manually ........................................121Stopping Recording by Specifying a Time [TIME] ..........122Stopping Recording with a Timer [TIMER] .....................123
6.3 Repeat Recording [REPEAT] ................................124

Contents
iv
6.4 Operation When a Power Outage Occurs While Recording .............................................................. 125
Chapter 7 Quick Set_________________________________127
7.1 Settings Configured with the Quick Set ............. 1277.2 Settings That Can Be Added to
Quick Set Settings ................................................ 128
Chapter 8 Saving Data and Manipulating Files ___________131
8.1 Viewing and Using the File Screen ..................... 1328.2 Folder and File Structure ..................................... 134
SD Memory Card ........................................................... 134Internal Memory ............................................................. 138
8.3 Saving Copies of the Screen (SD Memory Card Only) ....................................... 139
8.4 Saving Settings Files ............................................ 1408.5 Loading Settings Files ......................................... 141
SD Memory Card ........................................................... 141Internal Memory ............................................................. 142
8.6 Copying Internal Memory Files to the SD Memory Card ................................................... 143
8.7 Deleting Folders and Files ................................... 1448.8 Formatting the SD Memory Card or
Internal Memory .................................................... 145
Chapter 9 Analyzing Data on a Computer _______________147
9.1 Copying Data to a Computer (SD) ....................... 1489.2 Copying Data to a Computer (USB) .................... 1509.3 SF1001 Power Logger Viewer (Optional) ............ 1539.4 Checking Recording and Measurement Data
with Excel® ............................................................. 155Opening recording and measurement data ................... 155Saving Data as an Excel® File ....................................... 156Example of Data from a Measurement File ................... 157

Contents
v
12
8
9
10
11
AppendixIndex
7
Measurement File Contents ...........................................158Converting Measured Value Exponential Data ..............165
9.5 Using the PW3360/PW3365 Excel automatic graphing software .................................................166
Chapter 10 Using Communications (USB/LAN) ___________ 167
10.1 Preparing for USB Communications ...................16810.2 Preparing for LAN Communications ...................169
Configure the Instruments LAN Settings ........................170Connecting the Instrument and Computer with a LAN Cable ......................................................................172
10.3 Using the PW3360/PW3365 configuration and data downloading software ..................................175Installing the PW3360/PW3365 configuration and data downloading software ....................................................175Using USB Communications ..........................................176Using LAN Communications ..........................................180
10.4 Remote Control of the Instrument by Internet Browser (LAN Communications Only) ................182Preparing for Remote Operation ....................................182Operating the Instrument Remotely ...............................184Setting a Password ........................................................185If You Forget Your Password .........................................185
Chapter 11 Specifications_____________________________ 187
11.1 General Specifications ..........................................18711.2 Basic Specifications ..............................................18811.3 Detailed Measurement Specifications .................19211.4 Functional Specifications .....................................19911.5 Calculation Formulas ............................................20811.6 Range Configuration and Accuracy by
Clamp Sensor ........................................................217When Model 9660, 9661, or 9695-03 Clamp on Sensor is Used ...........................................................................217When Model 9669 Clamp on Sensor is Used ................218When Model 9694 or 9695-02 Clamp on Sensor is Used ..218

Contents
vi
When Model CT9667 Flexible Clamp on Sensor is Used .. 21911.7 PW9020 Safety Voltage Sensor ........................... 220
Chapter 12 Maintenance and Service ___________________223
12.1 Trouble Shooting .................................................. 223Before Having the Instrument Repaired ......................... 225
12.2 Cleaning ................................................................. 22712.3 Error Indication ..................................................... 22712.4 Disposing of the Instrument ................................ 233
Appendix____________________________________ A1Appendix 1 Voltage Sensor Measurement Principles ......A1Appendix 2 How the Instrument Samples Data.................A1Appendix 3 Three-phase 3-wire Measurement..................A2Appendix 4 Method for Calculating Active
Power Accuracy...............................................A9Appendix 5 Terminology ...................................................A11
Index___________________________________Index 1

Introductions1
Thank you for purchasing the HIOKI PW3365 Clamp on Power Logger. To obtain maximum performance from the instrument, please read this manual first, and keep it handy for future reference.
Trademarks• Microsoft and Windows are either registered trademarks or trademarks of Micro-
soft Corporation in the United States and other countries.
• The SD logo is a trademark of SD-3C, LLC.
• Microsoft and Excel are either registered trademarks or trademarks of Microsoft Corporation in the United States and other countries.
Model NumbersIn this Instruction Manual, “PW3365” is used as the instrument model.
Introductions
Model No. Operation panelPW3365-10 JapanesePW3365-20 EnglishPW3365-30 Chinese

Confirming Package Contents2
When you receive the instrument, inspect it carefully to ensure that no damage occurred during shipping. In particular, check the accessories, panel keys, switch, and connectors. If damage is evident, or if it fails to operate according to the spec-ifications, contact your authorized Hioki distributor or reseller.
Check that the package contents are correct.
Confirming Package Contents
PW3365 Clamp on Power Logger.................................1
Accessories
PW9020 Safety Voltage Sensor...... 4
See: "3.4 Connecting the Current Sensors to the Instrument" (p.53)
Z1008 AC Adapter ..............1 (includes power cord)
USB Cable ..........................1 (Ver.2.0, with ferrite cores, approx. 0.9 m)
Instruction manual ............. 1 Measurement guide ........... 1
Colored clip in red, yellow, blue and white (color coding for current sensors and voltage sensors)....... ×4 eachSpiral tubes in black (cord bundling for current sensors and voltage sensors).............. 10
See: "Attaching Color Clips around Voltage Sensors and Grouping Together Cords" (p.28) "Attaching Color Clips around Clamp Sensors and Grouping Together Cords" (p.30)

Confirming Package Contents3
Transport precautionsWhen transporting the instrument, use the original packing materials in which it was shipped, and pack in a double carton. Damage occurring during transporta-tion is not covered by warranty.
OptionsThe following options are provided for the PW3365. For purchase, contact your authorized Hioki distributor or reseller.
For current measurement9660 Clamp on Sensor (100 Arms rated)9661 Clamp on Sensor (500 Arms rated)9669 Clamp on Sensor (1000 Arms rated)9694 Clamp on Sensor (5 Arms rated)9695-02 Clamp on Sensor (50 Arms rated)9695-03 Clamp on Sensor (100 Arms rated)9219 Connection Cable (For use with Model 9695-02/9695-03)CT9667 Flexible Clamp on Sensor (5000 A rms rated)9657-10 Clamp on Leak Sensor9675 Clamp on Leak Sensor9290-10 Clamp on Adapter
For voltage measurementPW9020 Safety Voltage Sensor (for replacement use)
Power supplyPW9002 Battery Set (9459 Battery Pack and battery case set)9459 Battery Pack (for replacing the 9459 Battery Pack that comes with PW9002)Z1008 AC Adapter
Media for recordingZ4001 SD Memory Card (2GB)Z4003 SD Memory Card (8GB)
For communications9642 LAN Cable
SoftwareSF1001 Power Logger Viewer To request a paper copy of the SF1001 user manual (PDF), please contact an authorized Hioki distributor or reseller. A fee applies.
Carrying caseC1005 Carrying CaseC1008 Carrying Case

Confirming Package Contents4
The instrument can be stored in the C1005 Carrying Case and C1008 Carrying Case as follows:
C1005 Carrying Case
C1008 Carrying Case
Storing the Instrument in the Carrying Case (Option)
Model PW3365 instrument
Accessories and options
Accessories and options
Instruction manual and Measurement guide
This divider is attached by means of Velcro-style fasteners and can be removed. It can be ar-ranged as desired to accommodate the case’s contents.
Model PW3365 instrument
Accessories and options
Accessories and options
Instruction manual and Measurement guide

Safety Information5
This instrument is designed to conform to IEC 61010 Safety Standards, and has been thoroughly tested for safety prior to shipment. However, using the instrument in a way not described in this manual may negate the provided safety features.Before using the instrument, be certain to carefully read the following safety notes.
Symbols on the instrument
Safety Information
Mishandling during use could result in injury or death, as well as damage to the instrument. Be certain that you understand the instructions and precautions in the manual before use.
With regard to the electricity supply, there are risks of electric shock, heat generation, fire, and arc discharge due to short cir-cuits. If persons unfamiliar with electricity measuring instrument are to use the instrument, another person familiar with such instruments must supervise operations.
Indicates cautions and hazards. When the symbol is printed onthe instrument, refer to a corresponding topic in the Instruction Manual.
Indicates a double-insulated device.
Indicates a grounding terminal.
Indicates AC (Alternating Current).
Indicates DC (Direct Current).
Indicates the ON side of the power switch.
Indicates the OFF side of the power switch.
Safety Information6
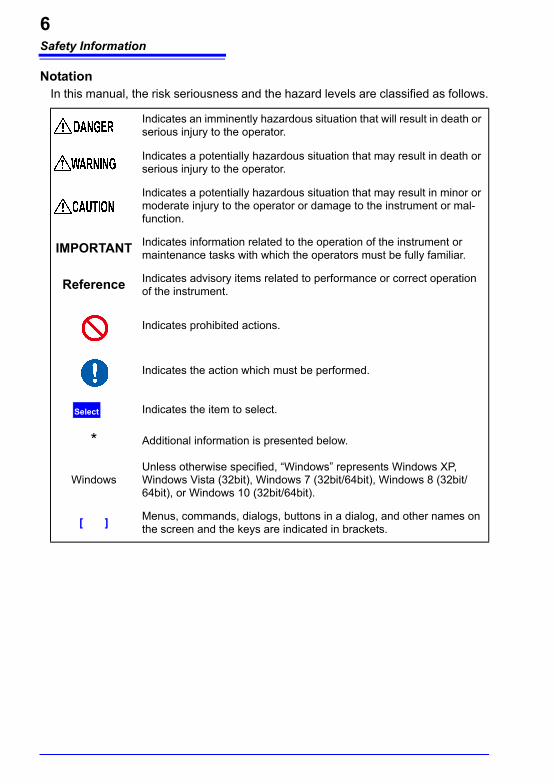
NotationIn this manual, the risk seriousness and the hazard levels are classified as follows.
Indicates an imminently hazardous situation that will result in death or serious injury to the operator.
Indicates a potentially hazardous situation that may result in death or serious injury to the operator.
Indicates a potentially hazardous situation that may result in minor or moderate injury to the operator or damage to the instrument or mal-function.
IMPORTANT Indicates information related to the operation of the instrument or maintenance tasks with which the operators must be fully familiar.
Reference Indicates advisory items related to performance or correct operation of the instrument.
Indicates prohibited actions.
Indicates the action which must be performed.
Select Indicates the item to select.
* Additional information is presented below.
WindowsUnless otherwise specified, “Windows” represents Windows XP, Windows Vista (32bit), Windows 7 (32bit/64bit), Windows 8 (32bit/64bit), or Windows 10 (32bit/64bit).
[ ] Menus, commands, dialogs, buttons in a dialog, and other names on the screen and the keys are indicated in brackets.

Safety Information7
Symbols for various standards
AccuracyWe define measurement tolerances in terms of f.s. (full scale), rdg. (reading) and dgt. (digit) values, with the following meanings:
WEEE marking:This symbol indicates that the electrical and electronic appliance is put on the EU market after August 13, 2005, and producers of the Member States are required to display it on the appliance under Article 11.2 of Directive 2002/96/EC (WEEE).
This is a recycle mark established under the Resource Recycling Pro-motion Law (only for Japan).
Indicates that the product conforms to regulations set out by the EU Directive.
f.s. (maximum display value)The maximum displayable value. This is usually the name of the cur-rently selected range.
rdg. (displayed value)The value currently being measured and indicated on the measuring instrument.
dgt.
(resolution)The smallest displayable unit on a digital measuring instrument, i.e., the input value that causes the digital display to show a "1" as the least-sig-nificant digit.
Ni-MH

Safety Information8
Measurement categoriesTo ensure safe operation of measuring instruments, IEC 61010 establishes safety standards for various electrical environments, categorized as CAT II to CAT IV, and called measurement categories.
This instrument conforms to the safety requirements for CAT III 600 V, CAT IV 300 V measuring instruments. (when using the PW9020 Voltage Sensor)
• Using a measuring instrument in an environment designated with a higher-numbered category than that for which the instru-ment is rated could result in a severe accident, and must be carefully avoided.
• Using a measuring instrument without categories in an environ-ment designated with the CAT II to CAT IV category could result in a severe accident, and must be carefully avoided.
CATIIhen directly measuring the electrical outlet receptacles of the primary electrical circuits in equipment connected to an AC electrical outlet by a power cord (portable tools, household appliances, etc.)
CATIIIWhen measuring the primary electrical circuits of heavy equipment (fixed installations) connected directly to the distribution panel, and feeders from the distribution panel to outlets
CATIVWhen measuring the circuit from the service drop to the service entrance, and to the power meter and primary overcurrent protection device (distribution panel)
Operating Precautions9
Follow these precautions to ensure safe operation and to obtain the full benefits of the various functions.
Operating Precautions
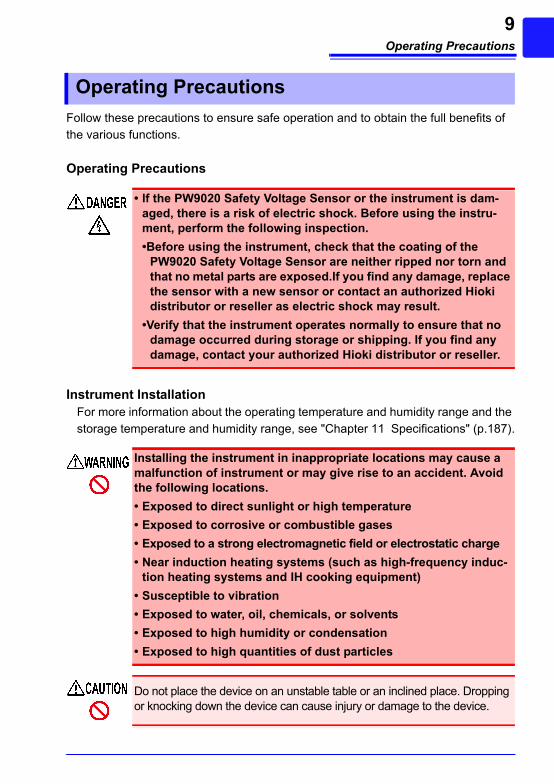
Instrument InstallationFor more information about the operating temperature and humidity range and the storage temperature and humidity range, see "Chapter 11 Specifications" (p.187).
Operating Precautions
• If the PW9020 Safety Voltage Sensor or the instrument is dam-aged, there is a risk of electric shock. Before using the instru-ment, perform the following inspection.•Before using the instrument, check that the coating of the
PW9020 Safety Voltage Sensor are neither ripped nor torn and that no metal parts are exposed.If you find any damage, replace the sensor with a new sensor or contact an authorized Hioki distributor or reseller as electric shock may result.
•Verify that the instrument operates normally to ensure that no damage occurred during storage or shipping. If you find any damage, contact your authorized Hioki distributor or reseller.
Installing the instrument in inappropriate locations may cause a malfunction of instrument or may give rise to an accident. Avoid the following locations.• Exposed to direct sunlight or high temperature• Exposed to corrosive or combustible gases• Exposed to a strong electromagnetic field or electrostatic charge• Near induction heating systems (such as high-frequency induc-
tion heating systems and IH cooking equipment)• Susceptible to vibration• Exposed to water, oil, chemicals, or solvents• Exposed to high humidity or condensation• Exposed to high quantities of dust particles
Do not place the device on an unstable table or an inclined place. Dropping or knocking down the device can cause injury or damage to the device.

Operating Precautions10
Handling the Instrument
Handling the Voltage Sensor
To avoid damage to the instrument, protect it from physical shock when transporting and handling. Be especially careful to avoid physical shock from dropping.
Reference
This instrument and Model PW9020 Safety Voltage Sensor may cause interference if used in residential areas. Such use must be avoided unless the user takes special measures to reduce electromagnetic emissions to prevent interference to the reception of radio and televi-sion broadcasts.
Touching any of the high-voltage points inside the PW9020 Safety Voltage Sensor is very dangerous.Customers are not allowed to modify, disassemble, or repair the PW9020.Doing so may cause fire, electric shock, or injury.
IMPORTANT
• The instrument may not be able to accurately measure waveforms that contain components outside the frequency range indicated in the "Effective measuring range" (p.189) section of the specifications (45 Hz to 66 Hz).
• If the measurement target is an insulated wire with dirt or moisture on its insulation, the instrument may display lower values than the actual voltage and power. If the surface of the measurement target’s insulation has dirt or moisture on it, wipe it clean with a dry cloth before measurement.

Operating Precautions11
Handling the Clamp Sensor
Handling the Cords
Handling the Battery Pack
• Be careful to avoid dropping the clamp sensor or otherwise subjecting them to mechanical shock, which could damage the mating surfaces and adversely affect measurement.
• Keep the clamp jaws and core slits free from foreign objects, which could interfere with clamping action.
• Keep the clamp closed when not in use, to avoid accumulating dust or dirt on the facing core surfaces, which could interfere with clamp per-formance.
To prevent cord damage, do not step on cords or pinch them between other objects. Do not bend or pull on cords at their base.
• To avoid the possibility of explosion, do not short circuit, disas-semble or incinerate battery pack. Handle and dispose of batter-ies in accordance with local regulations.
• For battery operation, use only the HIOKI Model PW9002 Battery Set. We do not take any responsibility for accidents or damage related to the use of any other batteries and/or screws.
• To avoid electric shock, turn off the power switch and discon-nect the cords and cables before replacing (removing) the bat-tery pack.
• After replacing the battery pack, replace the cover and screws before using the instrument.

Operating Precautions12
• Do not use the screw holes used for installing the protector or the battery case for other purposes. Doing so may damage the product.
• Avoid using an uninterruptible power supply (UPS) or DC/AC inverter with rectangular wave or pseudo-sine-wave output to power the instrument. Doing so may damage the instrument.
• Install the battery case onto the PW3365 using the screws supplied with the PW9002 (M3 x 25 mm), keeping the protector attached to the case. Installing the battery case with the protector removed or using screws longer than the accompanying screws may damage the PW3365.
• Observe the following to avoid damage to the instrument.•Use the battery pack in an ambient temperature range of 0°C to 40°C
and charge it in an ambient temperature range of 10°C to 40°C.•If the battery pack fails to finish charging within the stipulated time,
disconnect the AC adapter to stop charging and contact your dealer or Hioki representative.
•Consult your dealer or nearest service station should liquid leaks, strange odor, heat, discoloration, deformation and other abnormal conditions occur during use, charging or storage. Should these con-ditions occur during use or charging, turn off and disconnect the instrument immediately.
Reference • The battery pack is a consumable. If you are able to use the instru-ment for only a limited period of time despite the battery pack being properly charged, the battery pack’s service life is at an end, and it should be replaced.
• When a battery pack that has not been used for a long time is used, charging may end before the battery pack is fully charged. In such a case, repeat charging and discharging a number of time before use. (A battery pack may also be in such a state immediately after pur-chase.)
• When a battery pack is used, the instrument turns off automatically when the capacity drops. Leaving the instrument in this state for a long time may lead to over discharge so be sure to turn off the power switch on the instrument.

Measurement Flowchart13
This section presents a series of instrument operations without using the Quick Set function. For more information about the Quick Set function, see the Measurement Guide (published separately in color).
Measurement Flowchart
Verifying that the proper wiring method is being used(p.65)
Checking the current range (p.63)
Turning the power on (p.42)
At purchase• Attach the color clips around the voltage sensor cords. (p.28)• Group together voltage sensor codes. (p.28)• Attach the color clips around the clamp sensor cords. (p.30)• Group together clamp sensor codes. (p.30)• Install the battery pack. (p.32)• Set the language and measurement object frequency. (p.35)• Set the clock. (p.36)
Pre-Operation Inspection (p.37)
Inserting an SD memory card (p.38)
Connecting the AC adapter (p.41)
Connecting to Target to be Measured (p.57)(p.60)
Setting measurement conditions on the Wiring Diagram Screen (p.45)
Wiring Check screen
Measurement preparations
Connecting voltage sensors to the instrument
Connecting voltage sensors to the measurement target (p.53)
Connecting clamp sensors to the measurement target (p.55)

Measurement Flowchart14
Turn off the instrument. (p.42)
Starting recording (p.118)/ Stopping recording (p.121)
Disconnect the voltage sensors and clamp sensors from the measurement target.
Save destination
Save interval
Save items
Change the settings as follows when required.• Measurement settings
(Calculation selection (p.75), Energy cost (p.76))
• System settings (p.89)• LAN settings (p.170)
[MEAS, LIST] Screen
Folder/File name
Recording start
Recording stop
Clock (p.36)
Measurement is complete
Analyzing data on a computer (p.147)
Viewing measurement data (p.97)
Recording settings(p.78)
Disconnect the AC adapter, voltage sensors, and clamp sensors from the instrument.
1.1 Product Overview15
Chapter 1 O
verview
1
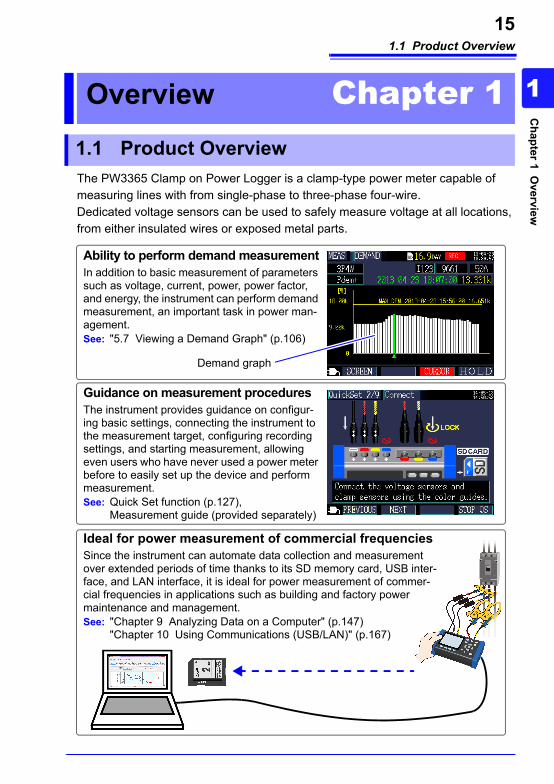
The PW3365 Clamp on Power Logger is a clamp-type power meter capable of measuring lines with from single-phase to three-phase four-wire.Dedicated voltage sensors can be used to safely measure voltage at all locations, from either insulated wires or exposed metal parts.
Overview Chapter 11.1 Product Overview
Guidance on measurement proceduresThe instrument provides guidance on configur-ing basic settings, connecting the instrument to the measurement target, configuring recording settings, and starting measurement, allowing even users who have never used a power meter before to easily set up the device and perform measurement.See: Quick Set function (p.127),
Measurement guide (provided separately)
Ability to perform demand measurementIn addition to basic measurement of parameters such as voltage, current, power, power factor, and energy, the instrument can perform demand measurement, an important task in power man-agement.See: "5.7 Viewing a Demand Graph" (p.106)
Demand graph
Ideal for power measurement of commercial frequenciesSince the instrument can automate data collection and measurement over extended periods of time thanks to its SD memory card, USB inter-face, and LAN interface, it is ideal for power measurement of commer-cial frequencies in applications such as building and factory power maintenance and management.See: "Chapter 9 Analyzing Data on a Computer" (p.147)
"Chapter 10 Using Communications (USB/LAN)" (p.167)

1.2 Features16
1.2 FeaturesAbility to perform measurement safely using metal contactless voltage sensorsThe PW9020 Voltage Sensor can be used to measure voltage from insulated wires. Since no contact is made with metal parts, measurement can be performed safely. The PW9020 features a safe design that is compatible with CAT IV (300 V) and CAT III (600 V) use.
Quick Set functionSimply follow guidance provided by the instrument to set up and operate the instru-ment by configuring basic settings, connecting the instrument to the measurement target, configuring recording settings, and starting measurement. See: "Chapter 7 Quick Set" (p.127), Measurement guide (published separately in
color)
Wiring Check (wiring confirmation)If the instrument has been connected improperly, tips for connecting it properly will be shown.See: "3.9 Verifying Correct Wiring (Wiring Check)" (p.65)
Ability to operate for about 5 hours on battery powerEven when AC power is unavailable, the optional battery pack can be used to enable about five hours of measurement.See: " Installing (replacing) the Battery Pack" (p.32)
Corresponding to the various power lineThe instrument can perform single-phase/2-wire (up to three circuits), single-phase/3-wire, 3-phase/3-wire (2-power measurement/3-power measurement), and 3-phase/4-wire measurement. When performing single-phase/3-wire, or 3-phase/3-wire 2-power measurement, the instrument can perform power and leakage current measurement simultaneously.See: "4.2 Changing Measurement Settings" (p.72)
Broad operating temperature rangeThe instrument can be used at temperatures ranging from 0°C to 50°C. However, the operating temperature range is limited to 0°C to 40°C when operating on battery power.
TFT color LCDThe instrument uses an LCD that is easy to see in both dim and bright conditions.

1.2 Features17
Chapter 1 O
verview
1
Extensive line of clamp sensorsChoose the clamp sensor that’s right for your application, with modelsdesigned for targets ranging from leakage currents to a maximum ranting of 5,000 A.Ability to store data on SD memory cardsUsed with a high-capacity, 2 GB SD memory card, the instrument can recorddata continuously for up to one year.
Communications functionalitySince the instrument ships standard with USB and LAN interfaces, it can be con-nected to a computer in order to configure instrument settings, download data, or remotely operate the instrument.See: "Chapter 10 Using Communications (USB/LAN)" (p.167)

1.3 Names and Functions (PW3365)18
1.3 Names and Functions (PW3365)
Keys Description ReferenceMeasurement key. Displays the Measurement screen and switches tabs (screens). (p.97)
Settings key. Displays the Settings screen and switches tabs (screens). (p.71)
File key. Displays the File (SD memory card/internal mem-ory) screen and switches tabs (screens). (p.131)
Wiring key. Displays the Wiring Diagram/Wiring Check screen and switches tabs (screens). (p.43)
Quick Set key. Displays the Quick Set screen. (p.127), Mea-surement guide
Cursor keys. Moves the cursor on the screen. The cursor keys are also used to scroll graphs and waveforms.
: Enter key. Selects items on the screen and accepts changes.
How to change settings and values (p.71)
Cancel key. Cancels selections and changes, reverting set-tings to their previous values. Switches to the previous screen.Pressing and holding the ESC key for 3 or more seconds activates the key lock (which is canceled by pressing and holding the key again).
Screen Copy key. Outputs an image of the currently displayedscreen to the SD memory card. (p.139)
Start/Stop key. Starts and stops recording. (p.117)
Front
Display3.5" TFT color LCD (p.22)
POWER LEDGreen lit up: Power on (p.42)Green flashing:Backlight auto-off setting on (p.89) Recording LED
Flashing green: When in the recording standby stateSolid green: When recording
Function key (F1 to F4 key)Select and change display contents and settings.
Tab (Screen name)*Screen name* *: See "1.5 Screen Configuration" (p.22).
KEY LOCKPress 3 sec

1.3 Names and Functions (PW3365)19
Chapter 1 O
verview
1
RightLeft
LAN interfaceConnect a computer here using the optional LAN cable.See: (p.169)
SD memory card slotInsert an SD memory card here.Be sure to close the cover when recording.See: (p.38)
USB interfaceConnect a computer here using the included USB cable.See: (p.150), (p.176)
AC adapter hookLoop the AC adapter cord through this hook.See: (p.41)
POWER switchTurns the instrument on and off.See: (p.42)
AC adapter connection jackSee: (p.41)
CHARGE LEDLights up while the 9459 Battery Pack is charging.See: (p.32)

1.3 Names and Functions (PW3365)20
"3.5 Connecting the Clamp Sensors to the Instrument" (p.55)
Back
Upper
MAC address labelDisplays the instrument's unique MAC address, which is used when configur-ing a LAN connection. Do not remove the label as the information it contains is necessary in order to manage the de-vice.
Serial numberDisplays the instrument's serial num-ber. Do not remove the label as the in-formation is contains is necessary in order to manage the device.
ProtectorRemove when using the battery. Connect the PW9002 Battery Set (including the 9459 Battery Pack and a battery case).See: (p.32)
Indicates the CE mark, KC mark, WEEE Direc-tive mark, and country of manufacture.
"3.4 Connecting the Current Sen-sors to the Instrument" (p.53)
Voltage sensor input terminalsConnect the included PW9020 Safety Voltage Sensor here.
Current sensor input terminalsConnect optional clamp sen-sors here.

1.4 Names and Functions (PW9020 Safety Voltage Sensor)21
Chapter 1 O
verview
1
1.4 Names and Functions (PW9020 Safety Voltage Sensor)Relay boxIncorporates electronic circuitry. Do not drop or subject to excessive force.
Cord
ClipsClamp the sensor to the wire and orient it so that the wire coincides to the center of the marks.
BarriersTo prevent short-circuits and bodily in-jury, do not touch the sensor in front of these barriers while connecting it.
Side
Cord
ConnectorConnect to the PW3365’s volt-age sensor in-put terminals.
Upper
MarksClamp the sensor to the wire and orient it so that the wire coincides to the center of the marks.
Bottom

1.5 Screen Configuration22
1.5 Screen Configuration
Measurement Screen
LIST
POWER
INTEG. (Integrate)
WAVE (Waveform)
ZOOM
U/I (Voltage/current)
Setting Screen
MEAS 1 (Measurement)
REC 1(Recording)
REC 2
SYS 1 (System)
SYS 2
MEAS 2
LAN
See: "Chapter 5 Viewing Measurement Data" (p.97)
See: "Chapter 4 Changing Settings" (p.71)
HARMONIC LIST
TREND
Tab (displays current screen name)Bottom screen: Measurement screen’s list screen (shown as [MEAS, LIST] in this manual)
There are a total of seven Setting screens. This field indicates which screen is being displayed.
DEMAND
HARMONIC GRAPH

1.5 Screen Configuration23
Chapter 1 O
verview
1
Wiring Screen
DIAG (Wiring Diagram) CHK (Wiring Check)
See: "Chapter 3 Connecting to Target to be Measured" (p.43)
File Screen
SD (SD memory card) Memory (Internal memory)
See: "Chapter 8 Saving Data and Manipulating Files" (p.131)
Quick Set Screen
Pressing the ENTER key on the Quick Set Start dialog box will display the Quick Set screen.
See: "Chapter 7 Quick Set" (p.127), Measurement guide (published separately in color)

1.6 On-Screen Indicators24
1.6 On-Screen Indicators
Marks DescriptionLights up when the save destination is [SD CARD] and an SD memory card is loaded in the instrument.
Lights red when the SD memory card is being accessed.
Lights up when the save destination is [INTERNAL M] (instrument's internal memory). Lights up when recording is started with the save destination set to [SD CARD] but no card inserted (in this case, data will be saved to the instrument’s internal memory).Lights red when the instrument’s internal memory is being accessed.Lights up when data is being sent and received over the LAN inter-face. (p.169)Lights up when data is being sent and received using the HTTP server function. (p.182)Lights up when data is being sent and received via both the LAN interface and the HTTP server function.Lights up when data is being sent and received over the USB inter-face.
Lights up while recording and measurement are being performed.
Lights up while the instrument is standing by for recording and mea-surement to start.Indicates how much recording time remains on the SD memory card or in the instrument’s internal memory.
Lights up when the voltage exceeds the peak.
Lights up when the current exceeds the peak.
Lights up when the key lock has been activated. (p.18)
Shown instead of the measured value when the upper limit of the display range has been exceeded (p.190), causing the value to be over-range.If the voltage is over-range, the voltage that the instrument is capa-ble of measuring is being exceeded. Immediately disconnect the instrument. If the current is over-range, increase the current range.Shown instead of the measured value when measurement is not possible. When there is no input, shown during power factor mea-surement.

1.6 On-Screen Indicators25
Chapter 1 O
verview
1
Lights up when the PW3365 is being operated using the AC adapter.(p.41)Lights up when the PW3365 is being operated on battery power.(p.32)Lights up when the PW3365 is being operated on battery power and there is inadequate battery life remaining. Connect the AC adapter and charge the battery. (p.32)Marks Description

1.6 On-Screen Indicators26
2.1 Preparation Flowchart27
Chapter 2 M
easurement Preparations
2
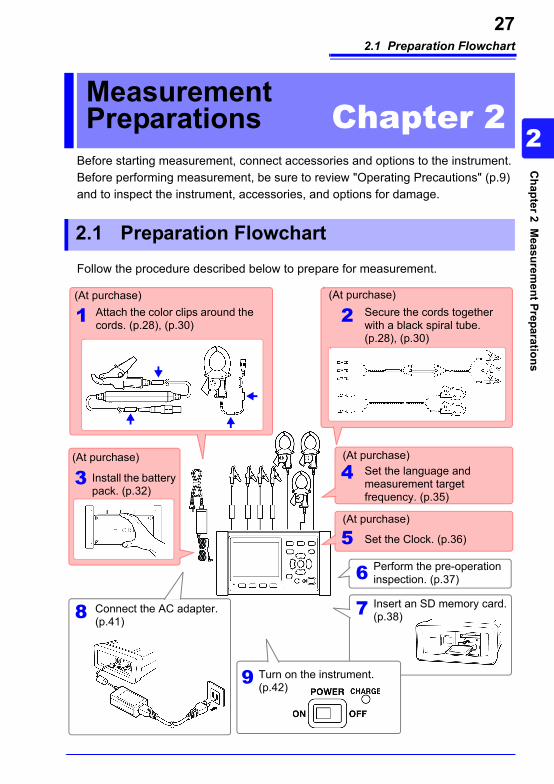
Before starting measurement, connect accessories and options to the instrument. Before performing measurement, be sure to review "Operating Precautions" (p.9) and to inspect the instrument, accessories, and options for damage.Follow the procedure described below to prepare for measurement.
Measurement Preparations Chapter 2
2.1 Preparation Flowchart
(At purchase)
(At purchase)
Connect the AC adapter. (p.41)
Insert an SD memory card. (p.38)78
3
9
(At purchase)
Install the battery pack. (p.32)
Turn on the instrument. (p.42)
Perform the pre-operation inspection. (p.37)6
Set the language and measurement target frequency. (p.35)
4(At purchase)
Attach the color clips around the cords. (p.28), (p.30)1 Secure the cords together
with a black spiral tube. (p.28), (p.30)
2
Set the Clock. (p.36)5(At purchase)

2.2 Preparing to Use the Instrument after Purchase28
The instrument includes color clips for use with voltage sensors. In order to pre-vent erroneous connections, these clips are attached around voltage sensor cords and color-coded to help recognize channels. Once you have attached the color clips around the cords, group multiple voltage sensor cords together with the black spiral tubes as necessary.
Preparation items: single-phase/3-wire (1P3W) and 3-phase/3-wire (3P3W2M)
2.2 Preparing to Use the Instrument after Purchase
Attaching Color Clips around Voltage Sensors and Grouping Together Cords
Measurement target Voltage sensors (CH, clip color)Single-phase/2-wire (1P2W) Two sensors
(N none, CH1 red)Single-phase/3-wire (1P3W1U)Single-phase/2-wire (1P3W) Three sensors
(N none, CH1 red, CH2 yellow)3-phase/3-wire (3P3W2M)3-phase/3-wire (3P3W3M) Four sensors
(N none, CH1 red, CH2 yellow, CH3 Blue)3-phase/4-wire(3P4W)
1 Attach color clips of the same color around the connector and sensor sides of the voltage sensor cord.
N :Do not attach any clip.CH1: Red clipsCH2: Yellow clips
Four color clips (For color-coding voltage sensors)
PW9020 Safety Voltage Sensor Three voltage sensors in use
Red
Yellow
Five spiral tubes (For grouping together cords)
Black

2.2 Preparing to Use the Instrument after Purchase29
Chapter 2 M
easurement Preparations
2
2 Group together multiple voltage sensor cords with black spiral tubes.
Line up the ends of multiple voltage sensor cords so that they can be more easily grouped together. Wrap spiral tubes around multiple cords so as to group them together.The instrument includes five spiral tubes, which should be placed at appropriate in-tervals.
Black
None
RedRed
N
CH1
Yellow YellowCH2
None

2.2 Preparing to Use the Instrument after Purchase30
The instrument includes color clips for use with clamp sensors. In order to prevent erroneous connections, these clips are attached around clamp sensor cords and color-coded to help recognize channels. Once you have attached the color clips around the cords, group multiple clamp sensor cords together with the black spiral tubes as necessary.
Preparation items: single-phase/3-wire (1P3W) and 3-phase/3-wire (3P3W2M)
Attaching Color Clips around Clamp Sensors and Grouping Together Cords
Measurement target Clamp sensors (CH, clip color)
Single-phase/2-wire (1P2W) One sensor (CH1 red)
Single-phase/2-wire (1P2W) (2 circuit) Two sensors (CH1 red, CH2 yellow)
Single-phase/2-wire (1P2W) (3 circuits) Three sensors (CH1 red, CH2 yellow, CH3 blue)
Single-phase/3-wire (1P3W) Two sensors (CH1 red, CH2 yellow)
Single-phase/3-wire (1P3W)+current only Three sensors (CH1 red, CH2 yellow, CH3 blue)
3-phase/3-wire (3P3W2M) Two sensors (CH1 red, CH2 yellow)
3-phase/3-wire (3P3W2M)+current only Three sensors (CH1red, CH2 yellow, CH3 blue)3-phase/3-wire (3P3W3M)
3-phase/4-wire (3P4W)
1 Attach color clips of the same color around the connector and sensor sides of the voltage sen-sor cord.
CH1: RedCH2: Yellow
Four color clips (For color-coding voltage sensors)
Red
Yellow
Five spiral tubes (For grouping together cords)
Black
Two clamp sensors in use
Model 9661

2.2 Preparing to Use the Instrument after Purchase31
Chapter 2 M
easurement Preparations
2
2 Group together multiple clamp sensor cords with black spiral tubes.Line up the ends of multiple clamp sensor cords so that they can be more easily grouped together. Wrap spiral tubes around multiple cords so as to group them together.The instrument includes five spiral tubes, which should be placed at appropriate in-tervals.
BlackRed
Yellow
Red
Yellow
CH1
CH2

2.2 Preparing to Use the Instrument after Purchase32
• The battery pack is used to power the instrument during power outages and as a backup power supply. When fully charged, it can provide backup power for approx-imately 5 hours in the event of a power outage.
• Note that if a power outage occurs while the battery pack is not being used, dis-played measurement data will be erased. (Data that has been recorded on the SD memory card and instrument's internal memory is retained.)
• The battery pack is subject to self-discharge. Be sure to charge the battery pack before initial use. If the battery capacity remains very low after correct recharging, the useful battery life is at an end.
• For more information about the operating temperature and humidity range and the storage temperature and humidity range, see "Chapter 11 Specifications" (p.187).
Preparation items
Procedure
Installing (replacing) the Battery Pack
When removing the PW9002 Battery Set from the back of the instru-ment and operating the instrument without the battery pack installed, attach the protector, following Step 2 to 7 in reverse order. Attach the protector using the four accompanying screws (M3×6 mm), which secured the protector onto the instrument when you received the instrument. Securing the protector using screws longer than the accompanying screws may damage the instrument.
Reference To remove the 9459 Battery Pack, follow Step 4 to 7 in reverse order.
1 Turn off the POWER switch and remove all cords and cables.
Phillips screwdriver
PW9002 Battery Set
9459 Battery PackA battery case Four screws
(M3×25 mm)
Protector

2.2 Preparing to Use the Instrument after Purchase33
Chapter 2 M
easurement Preparations
2
2 Turn the instrument over and use a Phil-lips screwdriver to remove the screws holding the protector in place.
3 Remove the protector from the recessed area in the case.
Store the protector and the four screws (M3×6 mm) you removed with care because you will need them when not using the PW9002 Battery Set.
4 Fit the 9459 Battery Pack into the battery case.
Position the battery pack so that the cables are routed through the cutout in the case.
ReferenceWhen the PW9002 Battery Set is shipped from Hioki factory, the 9459 Bat-tery Pack has already fit into the battery case.
5 Insert the connector from the battery pack into the port on the instrument.
Take care to orient the connector properly and in-sert it as far as it will go.
Safekeeping
Cutout
2.2 Preparing to Use the Instrument after Purchase34
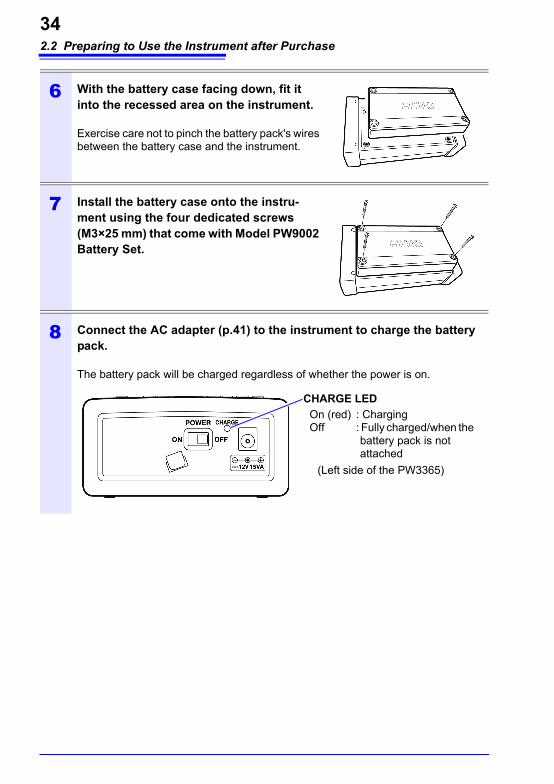
6 With the battery case facing down, fit it into the recessed area on the instrument.
Exercise care not to pinch the battery pack's wires between the battery case and the instrument.
7 Install the battery case onto the instru-ment using the four dedicated screws (M3×25 mm) that come with Model PW9002 Battery Set.
8 Connect the AC adapter (p.41) to the instrument to charge the battery pack.
The battery pack will be charged regardless of whether the power is on.
CHARGE LED On (red) : Charging Off : Fully charged/when the
battery pack is not attached
(Left side of the PW3365)

2.2 Preparing to Use the Instrument after Purchase35
Chapter 2 M
easurement Preparations
2
When you turn on the instrument (p.42) for the first time after purchase, the Lan-guage Setting screen and Frequency Setting screen will be displayed. Configure the settings as desired. Similarly, these settings must be configured if a factory reset is performed to reset the instrument to its default settings.See: "Reverting All Settings to the Factory Defaults (Factory Reset)" (p.93)Setting the Language and Measurement Target Frequency (50 Hz/60 Hz)
Reference Once you have set the display language and frequency, this settings screen will not be shown again when the instrument is turned on. The settings can be changed at any time on the Settings screen.See: Language setting: "System 1 Setting Screen" (p.89)See: Frequency setting: "Measurement 1 Setting Screen" (p.72)
1 Turn on the POWER switch.
The Language Setting screen will be displayed.
2 Select the desired language with the function keys.The language will be set, and the Frequency Setting screen will be displayed.
ReferencePressing the key [OTHERS] en-ables you to select a language between JAPANESE, ENGLISH, CHINESE, GER-MAN, ITALIAN, FRENCH,SPANISH, and TURKISH.
3 Select the desired measurement line frequency with the function keys.
SelectF1: 50 Hz range, F2: 60 Hz range
Select the measurement target’s fre-quency.
The frequency will be set, and the [MEAS, LIST] screen will be displayed.

2.2 Preparing to Use the Instrument after Purchase36
Set the clock before performing measurement. The clock will also need to be set if you perform a factory reset to revert the instrument to its default settings.See: "Reverting All Settings to the Factory Defaults (Factory Reset)" (p.93)
Once the instrument has been used for an extended period of time, the clock may not show the correct time. Check the clock regularly and re-set it as necessary.
Setting the Clock
1Press the key to display the [SET5/7, SYS1] screen.
2 Move the cursor to the setting you
wish to change and press the [ENTER] key.The cursor will expand to the size of one digit, and you will be able to change the digit.
3 Change the value with the cursor’s keys and then press the
[ENTER] key to accept the setting.

2.3 Pre-Operation Inspection37
Chapter 2 M
easurement Preparations
2
Before using the instrument, verify that it operates normally to ensure that no dam-age occurred during storage or shipping. If you find any damage, contact your authorized Hioki distributor or reseller.2.3 Pre-Operation Inspection
Yes
No
Inspect the voltage sensors1
Do not use if damage is present, as you could receive an electric shock.Contact your autho-rized Hioki distribu-tor or reseller if you find any damage.
2 Inspect the clamp sensors• Is a clamp cracked or damaged?• Is the cord's insulation damaged?
3 Inspect the AC adapter• Is damage to the AC adapter evident?• Is the power cord’s insulation damaged?
No
No
4
Yes
Inspect the instrumentIs damage to the instrument evident?
No
Inspection complete
• Is there any cracking or damage visible on the clips and relay box?
• Is the insulation on the cords torn?

2.4 Inserting (Removing) an SD Memory Card38
Measurement data can be stored either on SD memory cards or in the instru-ment's internal memory. When saving data on an SD memory card, insert an SD memory card and select [SD CARD] as the storage destination on the [SET3/7, REC1] screen.
2.4 Inserting (Removing) an SD Memory Card
• Inserting a SD memory card upside down, backwards or in the wrong direction may damage the instrument.
• Some SD memory cards are susceptible to static electricity. Exercise care when using such products because static electricity could damage the SD memory card or cause malfunction of the instrument.
IMPORTANT
• Use only HIOKI-approved SD memory cards. Other SD memory cards may not work with the instrument, and Hioki is unable to guar-antee proper operation.
• Format SD memory cards with the instrument. Using a computer to format the card may reduce the card's performance.See: "8.8 Formatting the SD Memory Card or Internal Memory" (p.145)
• No compensation is available for loss of data stored on the SD mem-ory card, regardless of the content or cause of damage or loss. Be sure to back up any important data stored on an SD memory card.
• Observe the following to avoid corruption or loss of stored data:(1) Do not touch the electrical contacts on the card or inside the
insertion slot with your skin or metallic objects.(2) While writing or reading data, avoid vibration or shock, and do not
turn the power off or remove the card from the instrument.(3) Before formatting (initializing) a card, confirm that it contains no
important information (files).(4) Do not bend or drop the card, or otherwise subject it to intense
shock.

2.4 Inserting (Removing) an SD Memory Card39
Chapter 2 M
easurement Preparations
2
Reference • The operating lifetime of the SD memory card is limited by its flash memory. After long-term or frequent usage, data reading and writing capabilities will be degraded. In that case, replace the card with a new one.
• If you are unable to write data to an SD memory card, manipulate folders and files, or format the card, check the position of the write-protect lock and disengage it if necessary. The SD memory card's connector is used to judge whether the card is write-protected. If the write-protected lock is in an intermediate posi-tion, the determination of whether the card is write-protected will depend on the connector. For example, even if the instrument deter-mines that the card is not write-protected and allows data to be written to it, a computer may determine that it is write-protected, preventing data from being written to it.

2.4 Inserting (Removing) an SD Memory Card40
Inserting the SD memory card
1 Turn off the POWER switch.
2 Open the SD memory card slot cover.
3 Disengage the SD memory card’s write-protect lock.
4 Positioning the SD memory card with the top surface facing up, insert it into the slot in the direction shown by the arrow and push it all the way in.
Keep the card level as you insert it. Inserting it at an angle may cause the write-protect lock to engage, preventing data from being written to the card.
5 Close the SD memory card slot cover.Be sure to close the cover.
Format new SD memory cards before use.See: "8.8 Formatting the SD Memory Card or
Internal Memory" (p.145)
To remove the card, open the cover and push in the SD memory card.
LOCK key

2.5 Connecting the AC Adapter41
Chapter 2 M
easurement Preparations
2
Connect the Z1008 AC Adapter to the instrument and plug it into an outlet as follows:
2.5 Connecting the AC Adapter
• Use only the specified Model Z1008 AC Adapter. AC adapter input voltage range is 100 to 240 V AC at 50 Hz/60 Hz. To avoid electrical hazards and damage to the instrument, do not apply voltage outside of this range.
• To avoid electrical accidents and to maintain the safety specifi-cations of this instrument, connect the power cord provided only to a 3-contact (two-conductor + ground) outlet.
To avoid damaging the power cord, grasp the plug, not the cord, when unplugging it from the power outlet.
ReferenceMake sure the power is turned off before connecting or disconnecting the AC adapter.
1 Turn off the POWER switch.
2 Connect the power cord to the inlet on the AC adapter.
3 Connect the AC adapter's output plug to the instrument.
Once the output plug is connected, route the cord underneath the hook (to keep it from being pulled out).
4 Connect the power cord's input plug to an outlet.
24
3Power OFF1
AC adapter hook
2.6 Turning the Power On/Off42
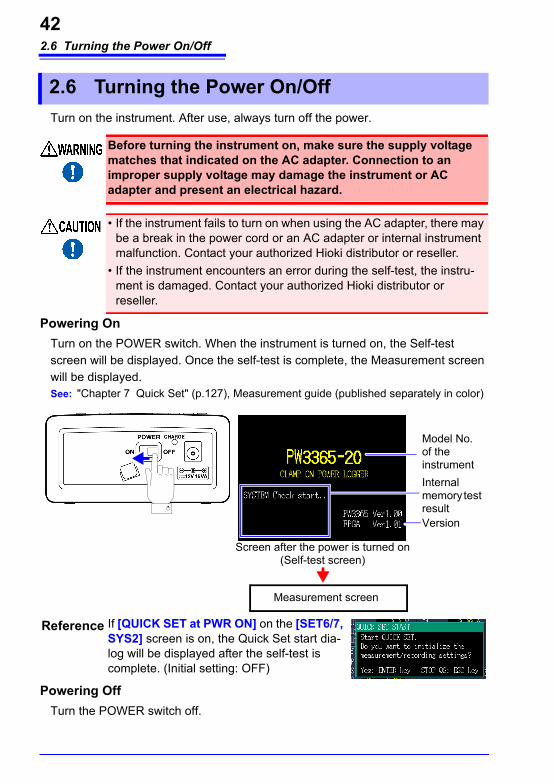
Turn on the instrument. After use, always turn off the power.
Powering OnTurn on the POWER switch. When the instrument is turned on, the Self-test screen will be displayed. Once the self-test is complete, the Measurement screen will be displayed.See: "Chapter 7 Quick Set" (p.127), Measurement guide (published separately in color)
Powering OffTurn the POWER switch off.
2.6 Turning the Power On/Off
Before turning the instrument on, make sure the supply voltage matches that indicated on the AC adapter. Connection to an improper supply voltage may damage the instrument or AC adapter and present an electrical hazard.
• If the instrument fails to turn on when using the AC adapter, there may be a break in the power cord or an AC adapter or internal instrument malfunction. Contact your authorized Hioki distributor or reseller.
• If the instrument encounters an error during the self-test, the instru-ment is damaged. Contact your authorized Hioki distributor or reseller.
Reference If [QUICK SET at PWR ON] on the [SET6/7, SYS2] screen is on, the Quick Set start dia-log will be displayed after the self-test is complete. (Initial setting: OFF)
Internal memory test result
Screen after the power is turned on(Self-test screen)
Model No. of the instrument
Version
Measurement screen

3.1 Checking the Equipment before Connecting the Instrument43
Chapter 3 C
onnecting to Target to be Measured
3
Please read the "Operating Precautions" (p.9) before making connections.
Connecting to Target to be Measured Chapter 3
3.1 Checking the Equipment before Connect-ing the Instrument
• Voltage sensor and clamp sensor should only be connected to the secondary side of a breaker, so the breaker can prevent an accident if a short circuit occurs. Connections should never be made to the primary side of a breaker, because unrestricted cur-rent flow could cause a serious accident if a short circuit occurs.
• To prevent electrical shock and personnel injury, do not touch any input terminals on the VT (PT), CT or the instrument when they are in operation.
• The PW9020 Voltage Sensor’s maximum rated conductor-to-ground voltages are as follows: (CAT III) 600 V AC, (CAT IV) 300 V AC Attempting to measure voltages exceeding this level with respect to ground could damage the instrument and result in personal injury.
• To avoid damaging the instrument, do not short the voltage sensor input terminals or current sensor input terminals or input any voltage to them.
• To ensure safe operation, use only voltage sensor and clamp sensor specified by our company.

3.2 Connection Procedure44
Connect the instrument as follows:
3.2 Connection Procedure
1
[WIR, DIAG] screen (Wiring diagram screen)
Set the measurement conditions. (p.45)
3 Connect to the instrument. (p.55)
5 Connect to the measurement target. (p.60)
2 Connect to the instrument. (p.53)
6
[WIR, CHK] screen (Wiring Check screen)
Check the current range. (p.63)
Check the wirings. (p.65)
32
Clamp sensors
4 Connect to the measurement target. (p.57)
Voltage sensors

3.3 Setting Measurement Conditions on the Wiring Diagram Screen45
Chapter 3 C
onnecting to Target to be Measured
3
Display the [WIR, DIAG] screen and set the wiring method, clamp sensor, and current range as described below.
3.3 Setting Measurement Conditions on the Wiring Diagram Screen
1Press the key to display the [WIR, DIAG] screen.
2 Select the wiring method.Select
Accept the selection.
Select an item
Select an item.
Display a pull-down menu.
Changing an item
Enter Enter
1P2W
For more information about settings, see the chart below.
1P3W1P3W1U3P3W2M3P3W3M3P4WI only
3.3 Setting Measurement Conditions on the Wiring Diagram Screen46
Selecting the wiring method
Wiring selection
Sub-
selection
Name Detailed description [WIR, DIAG] Screen (Wiring diagram screen)
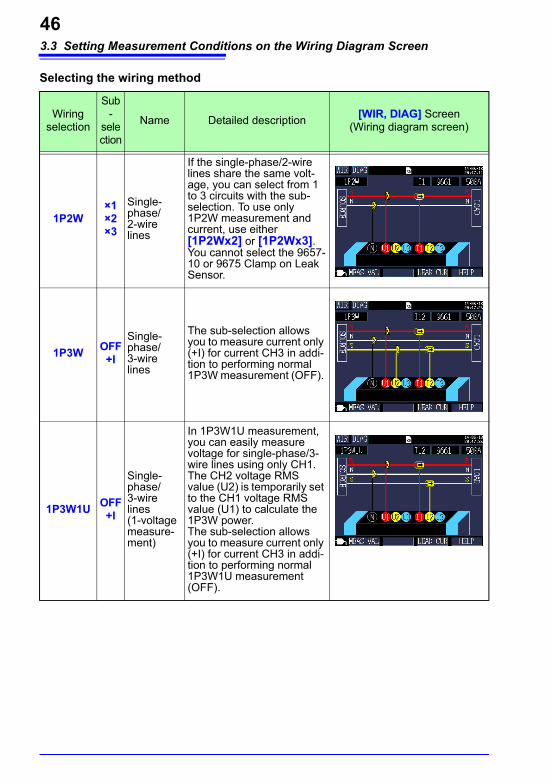
1P2W×1×2×3
Single-phase/ 2-wire lines
If the single-phase/2-wire lines share the same volt-age, you can select from 1 to 3 circuits with the sub-selection. To use only 1P2W measurement and current, use either [1P2Wx2] or [1P2Wx3]. You cannot select the 9657-10 or 9675 Clamp on Leak Sensor.
1P3W OFF+I
Single-phase/ 3-wire lines
The sub-selection allows you to measure current only (+I) for current CH3 in addi-tion to performing normal 1P3W measurement (OFF).
1P3W1U OFF+I
Single-phase/ 3-wire lines (1-voltage measure-ment)
In 1P3W1U measurement, you can easily measure voltage for single-phase/3-wire lines using only CH1. The CH2 voltage RMS value (U2) is temporarily set to the CH1 voltage RMS value (U1) to calculate the 1P3W power. The sub-selection allows you to measure current only (+I) for current CH3 in addi-tion to performing normal 1P3W1U measurement (OFF).
3.3 Setting Measurement Conditions on the Wiring Diagram Screen47
Chapter 3 C
onnecting to Target to be Measured
3
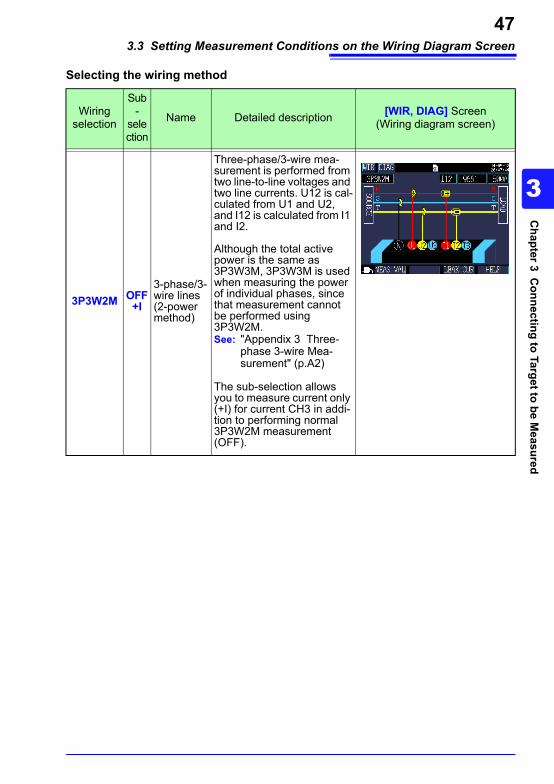
3P3W2M OFF+I
3-phase/3-wire lines (2-power method)
Three-phase/3-wire mea-surement is performed from two line-to-line voltages and two line currents. U12 is cal-culated from U1 and U2, and I12 is calculated from I1 and I2.
Although the total active power is the same as 3P3W3M, 3P3W3M is used when measuring the power of individual phases, since that measurement cannot be performed using 3P3W2M. See: "Appendix 3 Three-
phase 3-wire Mea-surement" (p.A2)
The sub-selection allows you to measure current only (+I) for current CH3 in addi-tion to performing normal 3P3W2M measurement (OFF).
Selecting the wiring method
Wiring selection
Sub-
selection
Name Detailed description [WIR, DIAG] Screen (Wiring diagram screen)

3.3 Setting Measurement Conditions on the Wiring Diagram Screen48
3P3W3M -3-phase/3-wire lines (3-power method)
In 3P3W3M measurement, you can measure 3-phase/3-wire lines from three con-ductor-to-ground voltages (phase voltages from the virtual neutral point) and three wire currents using the load-side grounding wire or a grounded metal part as a virtual neutral point. 3P3W3M measure-ment can be performed when the measurement tar-get is connected via Y wir-ing. To measure a target connected via Δ wiring, use the 3P3W2M setting.See: "Appendix 3 Three-
phase 3-wire Mea-surement" (p.A2)
This setting is used when you wish to check the line voltage for a 3-phase/4-wire line. The 9657-10 and 9675 Clamp On Leak Sensors cannot be used with this setting.
3P4W - 3-phase/4-wire lines
In 3P4W measurement, you can measure 3-phase/4-wire lines from three phase voltages and three phase currents (line currents). To check line voltages, use the 3P3W3M wiring setting with 3P4W wiring. You cannot select the 9657-10 or 9675 Clamp on Leak Sensor.
Selecting the wiring method
Wiring selection
Sub-
selection
Name Detailed description [WIR, DIAG] Screen (Wiring diagram screen)

3.3 Setting Measurement Conditions on the Wiring Diagram Screen49
Chapter 3 C
onnecting to Target to be Measured
3
I only×1×2×3
Current only
Use this setting when you wish to measure only cur-rent and not voltage.The sub-selection allows you to select from one to three circuits.
Reference Four PW9020 Voltage Sensors are required when performing mea-surement using the [3P3W3M] or [3P4W] setting. Since the instrument only includes three of the sensors, you will need to purchase one addi-tional PW9020 Voltage Sensor.
3 (When measuring multiple cir-cuits only)Select the current channel.
ReferenceSelect each channel and set the clamp sensor (see Step 4) and current range (see Step 5) for each.
Selecting the wiring method
Wiring selection
Sub-
selection
Name Detailed description [WIR, DIAG] Screen (Wiring diagram screen)
1P2W×2 I1, I21P2W×3 I1, I2, I31P3W+I I12, I31P3W1U+I I12, I33P3W2M+I I12, I3I only×2 (I×2) I1, I2I only×3 (I×3) I1, I2, I3
Select

3.3 Setting Measurement Conditions on the Wiring Diagram Screen50
4 Select the clamp sensor.
Reference• When measuring power lines using multiple channels, combine multiple
clamp sensor types. For example, when measuring 3-phase/4-wire lines, use the same clamp sensor for channels 1 to 3.
• When using the CT9667 Flexible Clamp on Sensor, use the same value for the sensor range setting and the instrument’s clamp sensor range setting.
• When using the 9667 Flexible Clamp on Sensor, select the CT9667.• Because the 9657-10 and 9675 Clamp On Leak Sensors have a large
phase error, they cannot be selected for power measurement. Only chan-nel 3 ([I3]) can be selected when the wiring method is [I only], or when [+I] has been set with the sub-selection.
9660
Load current (power) measure-ment sensors
9661CT9667-500A
CT9667-5kA966996949695-029695-039657-10 Leakage current
measurement sen-sors9675
Select

3.3 Setting Measurement Conditions on the Wiring Diagram Screen51
Chapter 3 C
onnecting to Target to be Measured
3
5 Select the current range.
ReferenceIf you do not know the appropriate range, configure the current range setting while checking the current value on the [WIR, CHK] screen after connecting the instru-ment.See: "Selecting an appropriate range" (p.63)
9660 5A, 10A, 50A, 100A
9661 5A, 10A, 50A, 100A, 500A
CT9667-500A 50A, 100A, 500ACT9667-5kA 500A, 1kA, 5kA9669 100A, 200A, 1kA9694 500mA, 1A, 5A, 10A,
50A9695-029695-03 5A, 10A, 50A, 100A9657-10 50mA, 100mA,
500mA, 1A, 5A9675
Select

3.3 Setting Measurement Conditions on the Wiring Diagram Screen52
Reference The wiring method, clamp sensor, and current range settings can be configured on the following screens. The CT ratio and VT (PT) ratio settings, if needed, can be configured on the Settings screen.See: "4.2 Changing Measurement Settings" (p.72)
[SET1/7, MEAS1] screen(Settings screen)
[SET2/7, MEAS2] screen(Setting screen)
[MEAS, LIST] screen(Measurement screen)
3.4 Connecting the Current Sensors to the Instrument53
Chapter 3 C
onnecting to Target to be Measured
3
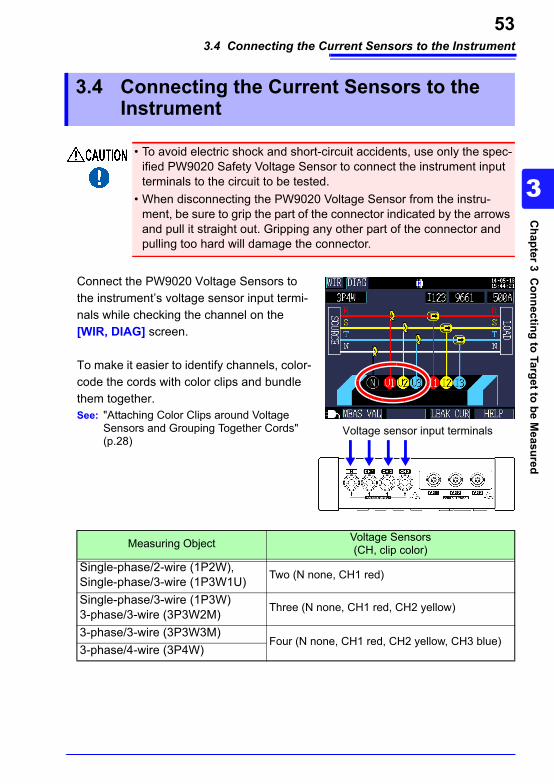
Connect the PW9020 Voltage Sensors to the instrument’s voltage sensor input termi-nals while checking the channel on the [WIR, DIAG] screen.
To make it easier to identify channels, color-code the cords with color clips and bundle them together.See: "Attaching Color Clips around Voltage
Sensors and Grouping Together Cords" (p.28)
3.4 Connecting the Current Sensors to the Instrument
• To avoid electric shock and short-circuit accidents, use only the spec-ified PW9020 Safety Voltage Sensor to connect the instrument input terminals to the circuit to be tested.
• When disconnecting the PW9020 Voltage Sensor from the instru-ment, be sure to grip the part of the connector indicated by the arrows and pull it straight out. Gripping any other part of the connector and pulling too hard will damage the connector.
Measuring Object Voltage Sensors(CH, clip color)
Single-phase/2-wire (1P2W), Single-phase/3-wire (1P3W1U) Two (N none, CH1 red)
Single-phase/3-wire (1P3W)3-phase/3-wire (3P3W2M) Three (N none, CH1 red, CH2 yellow)
3-phase/3-wire (3P3W3M)Four (N none, CH1 red, CH2 yellow, CH3 blue)
3-phase/4-wire (3P4W)
Voltage sensor input terminals

3.4 Connecting the Current Sensors to the Instrument54
Align the arrow marks on the voltage sensor connector and voltage sensor input terminal and insert.
To disconnect the sensor, grip the part of the connector indicated by the arrow and pull it straight out.
Align
3.5 Connecting the Clamp Sensors to the Instrument55
Chapter 3 C
onnecting to Target to be Measured
3
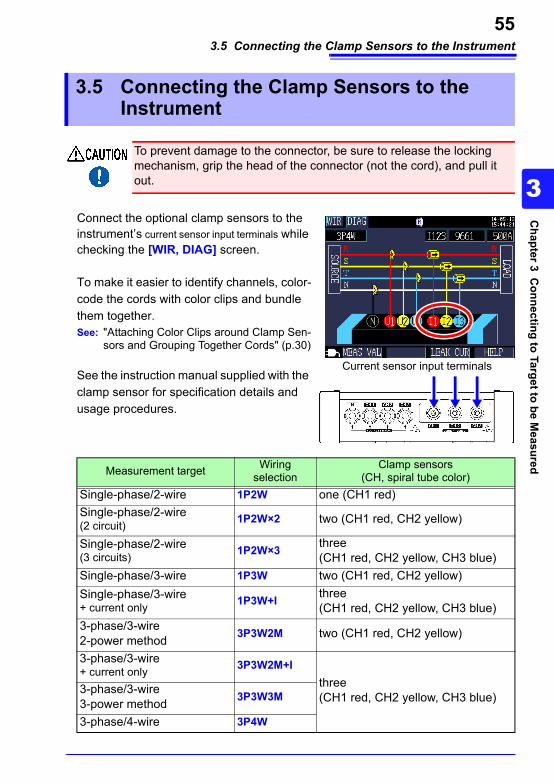
Connect the optional clamp sensors to the instrument’s current sensor input terminals while checking the [WIR, DIAG] screen.To make it easier to identify channels, color-code the cords with color clips and bundle them together.See: "Attaching Color Clips around Clamp Sen-
sors and Grouping Together Cords" (p.30)
See the instruction manual supplied with the clamp sensor for specification details and usage procedures.
3.5 Connecting the Clamp Sensors to the Instrument
To prevent damage to the connector, be sure to release the locking mechanism, grip the head of the connector (not the cord), and pull it out.
Measurement target Wiringselection
Clamp sensors(CH, spiral tube color)
Single-phase/2-wire 1P2W one (CH1 red)Single-phase/2-wire (2 circuit) 1P2W×2 two (CH1 red, CH2 yellow)
Single-phase/2-wire (3 circuits) 1P2W×3 three
(CH1 red, CH2 yellow, CH3 blue)Single-phase/3-wire 1P3W two (CH1 red, CH2 yellow)Single-phase/3-wire + current only 1P3W+I three
(CH1 red, CH2 yellow, CH3 blue)3-phase/3-wire 2-power method 3P3W2M two (CH1 red, CH2 yellow)
3-phase/3-wire + current only 3P3W2M+I
three (CH1 red, CH2 yellow, CH3 blue)
3-phase/3-wire 3-power method 3P3W3M
3-phase/4-wire 3P4W
Current sensor input terminals

3.5 Connecting the Clamp Sensors to the Instrument56
1 Insert the clamp sensor’s BNC con-nector into the current sensor input terminal.
Align the groove on the BNC connector with the connector guide on the instrument and push it into place.
2 Turn the connector clockwise to lock it in place.
To disconnect the connector, turn it counter-clockwise to unlock it and then pull.
BNC connector of the clamp sen-sor
Connector guides on instrument cur-rent sensor input terminal
Lock

3.6 Connecting the Voltage Sensors to Target to be Measured57
Chapter 3 C
onnecting to Target to be Measured
3
Connect the voltage sensor to the measure-ment target while checking the wiring target on the [WIR, DIAG] screen.
3.6 Connecting the Voltage Sensors to Target to be Measured
To avoid short circuits and potentially life-threatening hazards, never attach the voltage sensor to a circuit that operates at more than the maximum rated voltage to earth. Do not grip any sensor in front of the barrier.
IMPORTANT
If the measurement target is an insulated wire with dirt or moisture on its insulation, the instrument may display lower values than the actual voltage and power. If the surface of the measurement target’s insula-tion has dirt or moisture on it, wipe it clean with a dry cloth before measurement.
3.6 Connecting the Voltage Sensors to Target to be Measured58
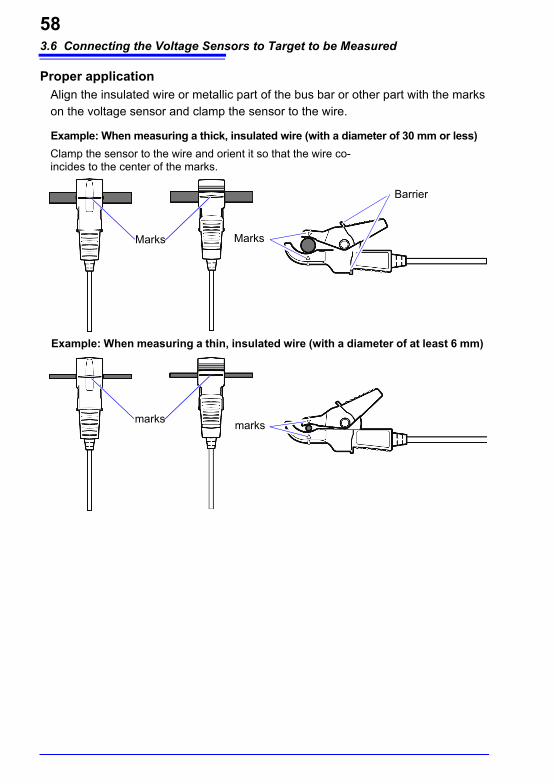
Proper applicationAlign the insulated wire or metallic part of the bus bar or other part with the marks on the voltage sensor and clamp the sensor to the wire.
Example: When measuring a thick, insulated wire (with a diameter of 30 mm or less)Clamp the sensor to the wire and orient it so that the wire co-incides to the center of the marks.
Barrier
Marks Marks
Example: When measuring a thin, insulated wire (with a diameter of at least 6 mm)
marksmarks

3.6 Connecting the Voltage Sensors to Target to be Measured59
Chapter 3 C
onnecting to Target to be Measured
3
Improper applicationFailure to apply the sensor properly will prevent you from being to make an accu-rate measurement.
Clamped with the tips of the clip Clamped with the measurement target at an angle
Example:
Clamped too far back in the clip Clamping targets with different voltages at the same time

3.7 Connecting Clamp Sensors to Target to be Measured60
Connect the clamp sensor to the measure-ment target while checking the [WIR, DIAG] screen.
3.7 Connecting Clamp Sensors to Target to be Measured
• To avoid short circuits and potentially life-threatening hazards, never attach the clamp sensor to a circuit that operates at more than the maximum rated voltage to earth.
• Connect the clamp sensors to the instrument first, and then to the active lines to be measured. Observe the following to avoid electric shock and short circuits.•When the clamp sensor is opened, do not short-circuit two
wires to be measured by bringing the metal part of the clamp into contact with them, and do not use over bare conductors.
Note that the clamp sensor may be damaged if the current exceeds the maximum input current. For more information about clamp sensor specifications, see the instruction manual that came with the clamp sensor.

3.7 Connecting Clamp Sensors to Target to be Measured61
Chapter 3 C
onnecting to Target to be Measured
3
Make certain that the current flow direction arrow points toward the load.
Attach the clamp around only one conductor. Single-phase (2-wire) or three-phase (3-wire) cables clamped together will not produce any reading.
Load Current Measurement
Line
Load side
Source side
Line
Load side
Current Flow Direction Arrow
Source side
Example
Model 9660 Clamp on Sensor Model 9661 Clamp on Sensor
Current Flow Direction Arrow
OK
Example

3.7 Connecting Clamp Sensors to Target to be Measured62
Pressing F3 [LEAK CUR] displays a leak current connection diagram.
Leakage Current Measurement
single-phase/2-wire: Place the clamp around two wires.single-phase/3-wire: Place the clamp around three wires. 3-phase/3-wire: Place the clamp around three wires.3-phase/4-wire: Place the clamp around four wires.Grounding wire: Place the clamp around one wire.
Current direction arrow in the direction as shown.
Example
Load DeviceB-type grounding wire
Current Flow Direction Arrow

3.8 Checking the Current Range63
Chapter 3 C
onnecting to Target to be Measured
3
Check the current value on the [WIR, CHK] screen to verify whether the current range is appropriate.
3.8 Checking the Current Range
1Press the key to display the [WIR, CHK] screen.
2 Check the current value. If it is abnormal, re-set the current range.
Selecting an appropriate rangeSet the current range based on the an-ticipated maximum load current during the measurement interval. (Refer to the operating status, load rating, breaker rating, and other data to make this de-termination.) If the range is too low, the instrument will experience an over-range event during measurement, mak-ing accurate measurement impossible. If the range is too high, a large error compo-nent will result, making accurate measurement impossible.
9660 5A, 10A, 50A, 100A9661 5A, 10A, 50A, 100A, 500ACT9667-500A 50A, 100A, 500ACT9667-5kA 500A, 1kA, 5kA9669 100A, 200A, 1kA9694
500mA, 1A, 5A, 10A, 50A9695-029695-03 5A, 10A, 50A, 100A9657-10
50mA, 100mA, 500mA, 1A, 5A9675
Select
3.8 Checking the Current Range64
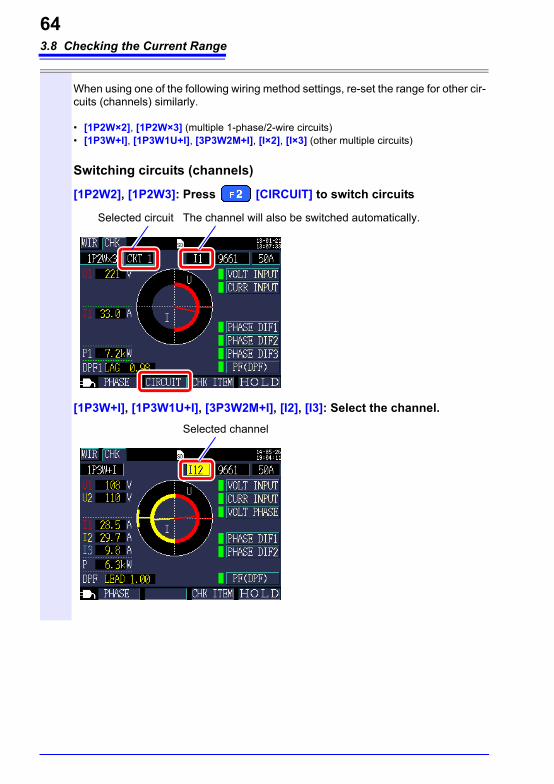
When using one of the following wiring method settings, re-set the range for other cir-cuits (channels) similarly.
• [1P2W×2], [1P2W×3] (multiple 1-phase/2-wire circuits)• [1P3W+I], [1P3W1U+I], [3P3W2M+I], [I×2], [I×3] (other multiple circuits)
Switching circuits (channels)
[1P2W2], [1P2W3]: Press [CIRCUIT] to switch circuits
[1P3W+I], [1P3W1U+I], [3P3W2M+I], [I2], [I3]: Select the channel.
Selected circuit The channel will also be switched automatically.
Selected channel
3.9 Verifying Correct Wiring (Wiring Check)65
Chapter 3 C
onnecting to Target to be Measured
3
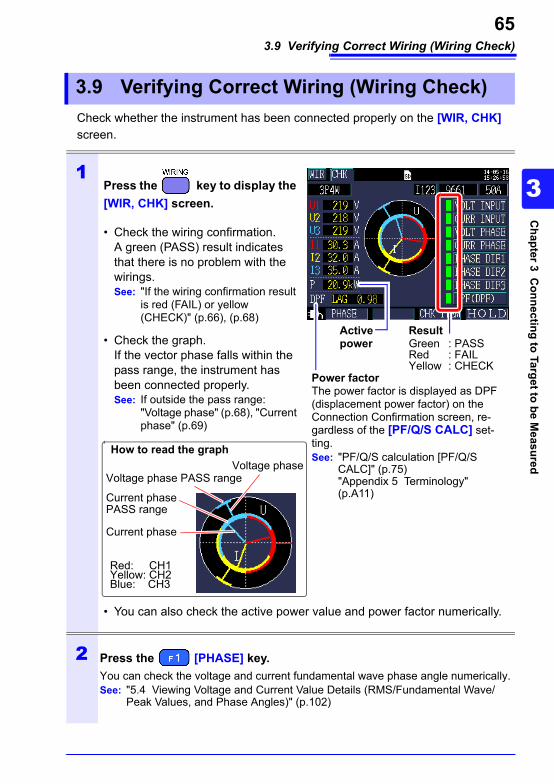
Check whether the instrument has been connected properly on the [WIR, CHK] screen.
3.9 Verifying Correct Wiring (Wiring Check)
1Press the key to display the [WIR, CHK] screen.
• Check the wiring confirmation. A green (PASS) result indicates that there is no problem with the wirings. See: "If the wiring confirmation result
is red (FAIL) or yellow (CHECK)" (p.66), (p.68)
• Check the graph. If the vector phase falls within the pass range, the instrument has been connected properly. See: If outside the pass range:
"Voltage phase" (p.68), "Current phase" (p.69)
• You can also check the active power value and power factor numerically.
2 Press the [PHASE] key.You can check the voltage and current fundamental wave phase angle numerically.See: "5.4 Viewing Voltage and Current Value Details (RMS/Fundamental Wave/
Peak Values, and Phase Angles)" (p.102)
ResultGreen : PASSRed : FAILYellow : CHECK
Power factorThe power factor is displayed as DPF (displacement power factor) on the Connection Confirmation screen, re-gardless of the [PF/Q/S CALC] set-ting.See: "PF/Q/S calculation [PF/Q/S
CALC]" (p.75) "Appendix 5 Terminology" (p.A11)
Active power
How to read the graph
Voltage phase PASS rangeVoltage phase
Current phase
Current phase
PASS range
Red: CH1Yellow: CH2Blue: CH3

3.9 Verifying Correct Wiring (Wiring Check)66
3 If you have selected a 1P2W×2 or 1P2W×3 circuits
Change the circuit with [CIRCUIT] and check the wiring similarly.
You cannot check the wiring for circuits for which you are measuring current on-ly.
4 If the wiring confirmation result is red (FAIL) or yellow (CHECK)
Press [CHK ITEM] so that you can move the cursor to the wiring check items.
5 Move the cursor to the item that has been tagged as red (FAIL) or
yellow (CHECK) and press the [ENTER] key
A dialog box with helpful information for fixing the wiring will be displayed. Re-view its content.
The selected wiring check items will be displayed in red.

3.9 Verifying Correct Wiring (Wiring Check)67
Chapter 3 C
onnecting to Target to be Measured
3
6Press the key to close the dialog box.Review similar information for other wiring confirmation items as necessary.
To complete your check of the check items, press [CHK ITEM] again.
7Press the key to display the [WIR, DIAG] screen and verify that the actual wiring connections are the same as shown on the screen.
8 If the wiring is wrong, correct it and check the [WIR, CHK] screen again.

3.9 Verifying Correct Wiring (Wiring Check)68
If the wiring check result is red (fail) or yellow (check)
wiring confir-mation item Judgment conditions Confirmation steps
Voltage input
FAIL will display when voltage value is less than 50V. FAIL will display when at wir-ing other than 1P2W, the low-est voltage value is 70% or less of the highest voltage value.
• Are the voltage sensors completely inserted into the voltage sensor input ter-minals?
• Have the voltage sensors been clamped to the measurement target at the proper positions (indicated by the marks on the sensors)?
See: "3.4 Connecting the Current Sensors to the Instrument" (p.53)See: "3.6 Connecting the Voltage Sensors to Target to be Measured"
(p.57)
Current input
FAIL will display when input is less than 1% of the current range.CHECK will display when input is less than 10% of the current range.
When no current is flowing, a Wiring Check cannot be performed. Operate the equip-ment and keep current flowing in order to check the wiring.If the equipment cannot be operated, a proper Wiring Check cannot be conducted. Visually check for proper wiring before measuring.• Are the clamp sensors properly inserted
into the current sensor input terminals?• Are the clamp-on sensors clamped cor-
rectly?• Is the set current range too large for the
input level?
See: "3.5 Connecting the Clamp Sensors to the Instrument" (p.55)See: "3.7 Connecting Clamp Sensors to Target to be Measured" (p.60)
Voltage phase
FAIL will display when the volt-age phase exceeds the range (±10 degrees of reference.)
• Are the wiring settings correct?• Are the voltage sensor correctly wired?• Were the phases incorrectly laid out dur-
ing construction? Switch the voltage sen-sors and adjust the connections of the clamp-on sensors so that PASS is dis-played. To double-check, use a phase detector to confirm that the phases are in the correct sequence.
See: "3.3 Setting Measurement Conditions on the Wiring Diagram Screen" (p.45)
See: "3.6 Connecting the Voltage Sensors to Target to be Measured" (p.57)

3.9 Verifying Correct Wiring (Wiring Check)69
Chapter 3 C
onnecting to Target to be Measured
3
Current phaseFAIL will display when the cur-rent phase sequence is incor-rect.
• Are the clamp sensors connected in the right places (on both the measurement target and the instrument’s input termi-nals)?
• Does the arrow of the clamp-on sensor point to the load side?
See: "3.3 Setting Measurement Conditions on the Wiring Diagram Screen" (p.45)
See: "3.7 Connecting Clamp Sensors to Target to be Measured" (p.60)
Phase difference
FAIL will display when each current phase is not within 90° with respect to the voltage of each phase.
• Are the voltage sensors and clamp sen-sors connected in the right places (on both the measurement target and the instrument’s input terminals)?
• Is arrow of clamp sensor pointed to the load?
CHECK appears if curr. phase is w/in ±60 to ±90°of each volt. phase.
• Are the voltage sensors and clamp sen-sors connected in the right places (on both the measurement target and the instrument’s input terminals)?
• Is arrow of clamp sensor pointed to the load?
• In light loads, PF may be low and phase diff. may be large. Check wiring for prob-lems and proceed if OK.
• When phase advances too much due to phase advancer in light loads, PF may be low and phase diff. may be large. Check wiring for problems and proceed if OK.
See: "3.4 Connecting the Current Sensors to the Instrument" (p.53) to "3.7 Connecting Clamp Sensors to Target to be Measured" (p.60)
wiring confir-mation item Judgment conditions Confirmation steps

3.9 Verifying Correct Wiring (Wiring Check)70
Power factor
CHECK will display if the power factor of the line to be measured is less than 0.5.
• Are the clamp sensors connected in the right places (on both the mea-surement target and the instrument’s input terminals)?
• Does the arrow of the clamp-on sen-sor point to the load side?
• When the load is light, the power fac-tor may be low and the phase differ-ence may be large. Check the wiring and if no problems are observed, you may proceed with the measurement
• When the phase advances too much due to the use of a phase advance capacitor during a light load, the power factor may be low and the phase difference may be large. Check the wiring and if no problems are observed, you may proceed with the measurement
See: "3.5 Connecting the Clamp Sensors to the Instrument" (p.55)See: "3.7 Connecting Clamp Sensors to Target to be Measured" (p.60)
wiring confir-mation item Judgment conditions Confirmation steps

4.1 Viewing and Using the Settings Screen71
Chapter 4 C
hanging Settings
4
You can change any setting item on the setting screen.See: About LAN settings (p.169)
Changing Settings Chapter 4
4.1 Viewing and Using the Settings Screen
Allows you to review settings details (help function).
Allows you to select a Settings screen.
Selects a screen name from a list.
Enter
Allows you to switch to the Settings screen and change the Setting screen.
Saves settings files. (p.140)
Accept the se-lection.
Select an item.
Select an item.
Display a pull-down
menu.
Accept the value.
Select an item.
Make it editable.
Increase the value by 1.
Decrease the value
by 1.
Changing a value
Move to the desired digit.
Changing an item
Enter Enter EnterEnter

4.2 Changing Measurement Settings72
You can change measurement conditions on the [SET1/7, MEAS1] and [SET2/7, MEAS2] Settings screens.
WiringSelects the measurement line wiring method.See: "Selecting the wiring method" (p.46)
FrequencySelects the frequency. Use of an improper frequency setting will prevent accurate measurement. Be sure to set the frequency to the measurement line frequency.
Selection
4.2 Changing Measurement Settings
Measurement 1 Setting Screen
50Hz, 60Hz
Reference • When a factory reset (p.93) is performed to reset the instrument to its default settings, no measurement line frequency will have been set. When you turn on the instrument, first set the frequency to the mea-surement line frequency. See: "Setting the Language and Measurement Target Frequency (50 Hz/
60 Hz)" (p.35)• The [Frequency Setting Error] dialog
box will be displayed if the instrument detects voltage input and determines that the frequency differs from the set frequency. Press the [ENTER] key and change the frequency settings.

4.2 Changing Measurement Settings73
Chapter 4 C
hanging Settings
4
Clamp sensor, Current range [SENSOR], [RANGE]Selects the clamp sensor being used and the current range.See: "3.3 Setting Measurement Conditions on the Wiring Diagram Screen" (p.45)
CT ratio [CT]Set when using an external CT.
Selection
MANUAL 0.01 to 9999.99(Select) 1/40/60/80/120/160/200/240/300/400/600/800/1200
Reference • When taking measurements on the secondary side of a current trans-former (CT), you can set the CT ratio in order to convert the readings to their primary-side equivalents and display the results. For a CT with a primary-side current of 200 A and a secondary-side current of 5 A, the CT ratio would be 40 (200 A / 5 A).
• If the 5 A current range were selected with the current sensor, it would be multiplied by the CT ratio of 40 to yield a current range of 200 A.

4.2 Changing Measurement Settings74
Voltage sensorThe voltage sensor is fixed to PW9020.
Voltage range [V RANGE]The voltage range is fixed to 400 V.
VT ratio (PT ratio) [VT(PT)]Set when using a VT (PT) to perform measurement.
Selection
Measurement 2 Setting Screen
MANUAL 0.01 to 9999.99
(Select) 1/60/100/200/300/600/700/1000/2000/2500/5000
Reference • When taking measurements on the secondary side of a voltage trans-former (VT), you can set the VT ratio in order to convert the readings to their primary-side equivalents and display the results. For a VT with a primary-side voltage of 6.6 kV and a secondary-side voltage of 110 V, the VT ratio would be 60 (6,600 V / 110 V).
• Since the current range is fixed at 400 V, it would be multiplied by the VT ratio of 60 to yield a voltage range of 24 kV.

4.2 Changing Measurement Settings75
Chapter 4 C
hanging Settings
4
PF/Q/S calculation [PF/Q/S CALC]Select the method for calculating power factor (PF), reactive power (Q), and apparent power (S). See: "11.5 Calculation Formulas" (p.208)
RMS calculation is generally used in applications such as checking transformer capacity, but fundamental wave calculation is used when measuring power factor and reactive power, which are related to electricity fees.
Selection
RMS
Uses voltage and current RMS values to calculate the power factor, reactive power, and apparent power. • Power factor PF (RMS power factor)• Reactive power Q (calculated from RMS values)• Apparent power S (calculated from RMS values)
FUNDAMENTAL
Uses voltage and the current fundamental wave to calcu-late the power factor, reactive power, and apparent power. • Power factor DPF (displacement power factor)• Reactive power Q (fundamental wave reactive power)• Apparent power S (fundamental wave apparent power)This is the same measurement method as is used by reactive-power meters installed at large electricity con-sumers’ facilities. The value will be close to that obtained when using the 3169-20/21 Clamp on Power HiTester’s “Use reactive power measurement method” option.

4.2 Changing Measurement Settings76
Energy costYou can display electricity charges by setting the unit cost (per kWh) and having the instrument multiply the electricity charge unit cost by the active energy (con-sumption) WP+ value.
Selection
Setting the Unit Cost
UnitCost 0.00000 to 99999.9/kWh
CURRENCYSet to any three alphanumeric characters.For example, to use the US dollar as the currency, set to “USD,” etc.
1 Move the cursor to [UnitCost].
2 Press the [ENTER] key.
3 A dialog box for setting the unit cost will be displayed.
To slide the decimal point, move the cursor to the decimal point with the cursor keys, and slide it with the cursor keys.
4 To set the unit cost, move the cursor to the digit to be changed with the cursor keys, and change the figure with the cursor keys.
5 Accept the new value with the [ENTER] key.

4.2 Changing Measurement Settings77
Chapter 4 C
hanging Settings
4
Setting the Currency
THD calculation Selects the method used to calculate total harmonic distortion (THD). The THD-F method is typically used.
1 Move the cursor to [CURRENCY].
2 Press the [ENTER] key.
3 A dialog box for setting the currency will be displayed.
Select one character at a time with the cursor keys and then accept
the entered currency with the [ENTER] key.
4 Once you have entered the currency, accept it with the [OK] key.
Pressing [Cancel] will cancel the entered currency.
Selection
THD-F(Fundamental)
Calculates by dividing the harmonic component (total of 2nd to 13th order) by the fundamental wave.
THD-R(RMS)
Calculates by dividing the harmonic component (total of 2nd to 13th order) by the RMS value (total of 1st to 13th order).

4.3 Changing Recording (Save) Settings78
You can change the conditions used to record (save) measurement data on the [SET3/7, REC1] and [SET4/7, REC2] Settings screens.
Save destination [SAVE TO...]Selects the save destination for measurement data.
Selection
Save intervalSelects the interval at which to save measurement data.
Selection
4.3 Changing Recording (Save) Settings
Recording 1 Setting Screen
SD CARDSaves data on the SD memory card. If no SD memory card is inserted, data will be saved in the instrument’s internal memory.
INTERNAL Saves data in the instrument’s internal memory (capacity: approximately 320 KB).
1 sec/2 sec/5 sec/10 sec/15 sec/30 sec, 1 min/2 min/5 min/10 min/15 min/20 min/30 min/60 min
Data storage timeSince the instrument can perform recording and mea-surement for a maximum of one year, the maximum data storage time is one year.
Even after the elapse of the specified storage time, the instrument continues the measurement; however, it does not save any mea-sured values.

4.3 Changing Recording (Save) Settings79
Chapter 4 C
hanging Settings
4
Save itemsSelects items to be saved at the save intervals.
Selection
Energy- and demand-related measurement data is saved regardless of this setting. To save harmonic data, set the save destination to [SD CARD].When the save destination is set to [Internal M], harmonic data is not saved; only recorded measurement data such as voltage, current, power, demand, energy, and other data are saved to the instrument’s internal memory.
AVG only (no Harmonic)
Saves average values only, excluding harmonic data.
ALL data (no Harmonic)
Saves all values (average, maximum, and minimum values), excluding harmonic data.
AVG only (w/Harmonic)
Saves average values only, including harmonic data.
ALL data (w/Harmonic)
Saves all values (average, maximum, and minimum), including harmonic data.
Reference • Normally, select [AVG only]. In the following circumstances, select [ALL data] (average, maximum, and minimum values). Examples•When you wish to check the maximum value for current, power, etc. •When you wish to check the minimum value for voltage, power factor, etc.
• Because the voltage and current peak values are not average values, peak values will not be output when [AVG only] is selected. To check peak values, select [ALL data].”
• When a [I only] (current only) connection is being used, average val-ues are not used for the current fundamental wave phase angle.
• Average values are calculated from the results of continuous calcula-tions performed every 200 ms during the save interval.
• Maximum and minimum values indicate the largest and smallest results obtained from continuous calculations performed every 200 ms during the save interval.
• For more information about how average, maximum, and minimum values are processed, see "Maximum/minimum/average value pro-cessing methods" (p.201).
• Recording and measurement data (CSV format) (including values such as normal voltage, current, power, demand, and energy) and harmonic measurement data (binary format) are saved in different files.See: "Chapter 8 Saving Data and Manipulating Files" (p.131)
4.3 Changing Recording (Save) Settings80
Screen saveSets whether to save the screen being displayed as a BMP-format file every time the save interval elapses. However, screen copies will be saved every 5 minutes if the save interval time set-ting is less than 5 minutes.Screen copies cannot be saved in the instrument’s internal memory. To save screen copies, set the save destination to [SD CARD].
Selection
Waveform saveSets whether to save waveform data for each time interval as a binary-format file.However, waveform data will be saved every minute if the save interval time set-ting is less than 1 minute.Waveforms are not saved in the instrument’s internal memory. To save wave-forms, set the save destination to [SD CARD].
Selection
ON Saves screen copies.
OFF Does not save screen copies.
Reference Be sure to perform recording and measurement after displaying the screen you wish to save. The screen being displayed is the screen that will be copied.
ON The waveforms will be saved.
OFF The waveforms will not be saved.

4.3 Changing Recording (Save) Settings81
Chapter 4 C
hanging Settings
4
Folder/File nameSets the filename used to save data.See: "8.2 Folder and File Structure" (p.134)
Selection
MANUAL
• Allows the user to set a folder name with a dialog box (up to five byte characters).
• If recording and measurement are performed again without changing the [FOLDER/FILE NAME] setting, a sequentially numbered folder will be automatically cre-ated, and the data will be saved there.
AUTO
• If the save destination is [SD CARD], a suffix will be automatically appended in the manner of “YYMMD-DXX.” The first six characters indicate the date, while the remaining characters comprise a sequential number (00 to 99).
• If the save destination is [INTERNAL M], a suffix such as “65SETXX” or “65MEMXX” will be automatically appended (where “XX” indicates a sequential number [00 to 99]).
Reference If the recording and measurement data file or waveform data file is larger than 200MB, all files will be segmented, and a new file will be added (using the [FOLDER/FILE NAME] setting + a folder sequential number (if [AUTO], 00 to 99; if [MANUAL], 0 to 99)).

4.3 Changing Recording (Save) Settings82
Procedure
1 Move the cursor to [FOLDER/FILE NAME].
2 Press the [ENTER] key and select [MANUAL/AUTO].
3 If you selected [MANUAL]:
A dialog box for inputting the folder and file name will be displayed.
Select one character at a time with the cursor keys and then accept the entered name with the
[ENTER] key.
The last character can be deleted with the key.
4 Once you have entered the folder/filename, accept it with the [OK] key.
Pressing [Cancel] will cancel the entered folder/filename.
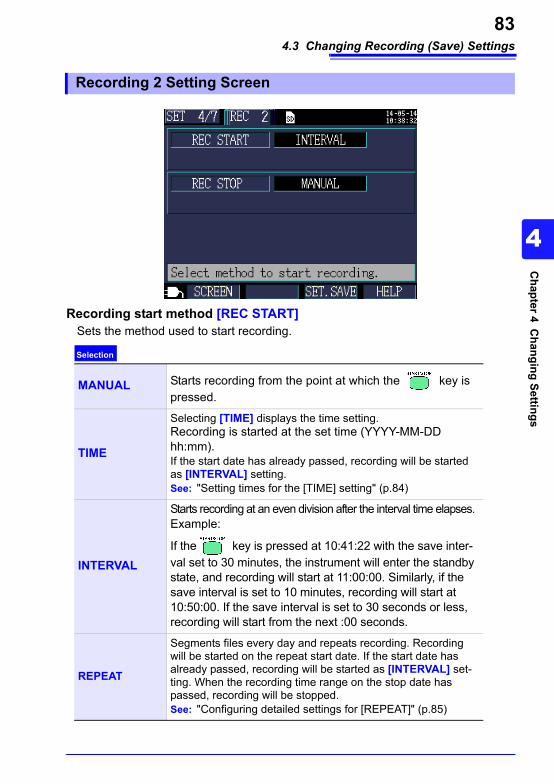
4.3 Changing Recording (Save) Settings83
Chapter 4 C
hanging Settings
4
Recording start method [REC START]Sets the method used to start recording.
Selection
Recording 2 Setting Screen
MANUAL Starts recording from the point at which the key is pressed.
TIME
Selecting [TIME] displays the time setting.Recording is started at the set time (YYYY-MM-DD hh:mm).If the start date has already passed, recording will be started as [INTERVAL] setting.See: "Setting times for the [TIME] setting" (p.84)
INTERVAL
Starts recording at an even division after the interval time elapses. Example:
If the key is pressed at 10:41:22 with the save inter-val set to 30 minutes, the instrument will enter the standby state, and recording will start at 11:00:00. Similarly, if the save interval is set to 10 minutes, recording will start at 10:50:00. If the save interval is set to 30 seconds or less, recording will start from the next :00 seconds.
REPEAT
Segments files every day and repeats recording. Recording will be started on the repeat start date. If the start date has already passed, recording will be started as [INTERVAL] set-ting. When the recording time range on the stop date has passed, recording will be stopped.See: "Configuring detailed settings for [REPEAT]" (p.85)

4.3 Changing Recording (Save) Settings84
Setting times for the [TIME] setting
1 Move the cursor to [REC START]
or [REC STOP], press the [ENTER] key, and select [TIME].
2 Move the cursor to the field you wish to change (year, month, day,
hour, or minute) and press the [ENTER] key. The cursor will expand to the size of one digit, and you will be able to change the digit.
3 Change the setting with the cursor keys and then accept the
new value with the [ENTER] key.

4.3 Changing Recording (Save) Settings85
Chapter 4 C
hanging Settings
4
Configuring detailed settings for [REPEAT]
1 Move the cursor to [REC START],
press the [ENTER] key, and select [REPEAT].The [REC STOP] will also be set to [RE-PEAT] automatically.
2 Move the cursor to the year, month, or day setting you wish to
change and press the [ENTER] key.The cursor will change to the size of one digit, and you will be able to change the setting.
3 Change the setting with the cursor keys and then accept the
new value with the [ENTER] key.
4 Move the cursor to the [RECORD PERIOD] start time or stop time
and press the [ENTER] key.The cursor will change to the size of one digit, and you will be able to change the setting.

4.3 Changing Recording (Save) Settings86
5 Change the setting with the cursor keys and then accept the
new value with the [ENTER] key.(Valid setting range: 00:00 to 24:00)
ExampleFor a setting of 00:00 to 24:00, recording (integrating power) will be reset every day at 24:00, and recording will resume immediately. For a setting of 08:00 to 18:00, recording and measurement (integrating power) will be performed during this time range only. From 00:00 to 08:00 and from 18:00 to 24:00, recording and measurement (integrating power) are not performed.
6 Move the cursor to the [SEGMENT
FOLDER] and press the [ENTER] key.
7 Select the folder creation timing with the cursor keys and
accept the setting with the [ENTER] key.
OFF Disables folder segmentation.
DAY Creates a save folder every day. The maximum save length is 100 days.
WEEK Creates a save folder every seven days from the start of record-ing. The maximum save length is one year.
MONTH Creates a save folder on the first of every month. The maximum save length is one year.
Configuring detailed settings for [REPEAT]

4.3 Changing Recording (Save) Settings87
Chapter 4 C
hanging Settings
4
Recording stop methodSets the method used to stop recording.
Selection
RERER-ENCE
• If the savable time for the SD memory card or internal memory is shorter than the specified interval, recording will be started, but data will only be recorded during the savable time.
• If the number of folders in the SD memory card’s PW3365 base folder exceeds 50, you will not be able to start recording. Either format the SD memory card or delete unnecessary folders.
See: "8.7 Deleting Folders and Files" (p.144), "8.8 Formatting the SD Memory Card or Internal Memory" (p.145)
MANUAL Stops recording when the key is pressed.
TIME
Selecting [TIME] causes a dialog box for setting the time to be displayed. Recording is stopped at the set time (YYYY-MM-DD hh:mm).If the set time has already passed when recording starts, recording will be stopped manually.See: "Setting times for the [TIME] setting" (p.84)
TIMER Stops recording automatically when the set timer time elapses.See: "Setting the [TIMER]" (p.88)
REPEAT
Segments files every day and repeats recording. Recording will be stopped when the recording time range on the repeat stop date passes. The stop method cannot be changed for repeat recording.See: "Configuring detailed settings for [REPEAT]" (p.85)
Reference The maximum recording and measurement time is up to one year. Recording will stop automatically in one year.

4.3 Changing Recording (Save) Settings88
Setting the [TIMER]
1 Move the cursor to the [REC
STOP], press the [ENTER] key, and select [TIMER].
2 Move the cursor to the time set-
ting and press the [ENTER] key.The cursor will change to the size of one digit, and you will be able to change the setting.
3 Change the setting with the cursor keys and then accept the
new value with the [ENTER] key.(Valid setting range: 1 sec. to 1,000 hr.)

4.4 Changing System Settings (as Necessary)89
Chapter 4 C
hanging Settings
4
You can change system settings on the [SET5/7, SYS1] and [SET6/7, SYS2] Set-tings screens.
ClockSets the date and time (using the Western calendar and 24-hour time).See: "Setting the Clock" (p.36)
Beep soundTurns the key press beep on and off.
Selection
LCD backlightSelects whether to automatically turn off the LCD backlight.
Selection
4.4 Changing System Settings (as Necessary)
System 1 Setting Screen
Reference The seconds cannot be set. After changing the time, pressing the Enter key causes the seconds to be reset to 00.
ON/OFF
AUTO OFFAutomatically turns off the backlight once two minutes have elapsed since the last key operation. The POWER LED will flash while the backlight is off.
ON Keeps the backlight on at all times.

4.4 Changing System Settings (as Necessary)90
Phase nameSelects the phase names for the measurement lines displayed on the [WIR, DIAG] screen.
Selection
Screen color [DISPLAY COLOR]Selects the screen color.
Selection
LanguageSelects the display language.
Selection
R S T, A B C, L1 L2 L3, U V W
COLOR 1 to COLOR3
JAPANESE Selects the Japanese display.
ENGLISH Selects the English display.
CHINESE Selects the Chinese display.
GERMAN Selects the German display.
ITALIAN Selects the Italian display.
FRENCH Selects the French display.
SPANISH Selects the Spanish display.
TURKISH Selects the Turkish display.

4.4 Changing System Settings (as Necessary)91
Chapter 4 C
hanging Settings
4
Start Quick Set at power-on [QUICK SET at PWR ON]Selects whether to display the Quick Set start dialog box when the instrument is turned on.
Selection
Instrument information [ABOUT...]Displays the instrument’s serial number and software and FPGA versions.
System 2 Setting Screen
OFF
Display the Measurement screen instead of displaying the Quick Set start dialog box when the instrument is turned on. The Quick Set can be displayed by pressing the
key, even when this option is set to OFF.
ON Displays the Quick Set start dialog box when the instru-ment is turned on.

4.5 Initializing the Instrument (System Reset)92
There are two methods by which the instrument can be initialized:
System resetPerform when the instrument is operating in an odd or unexpected manner (with no clear cause).
Factory resetPerform when you wish to revert all settings to their factory defaults.
Before performing a system reset, check "Before Having the Instrument Repaired" (p.225). If you are unable to find the cause of the problem, perform the system reset.
All settings other than the frequency setting, clock, language setting, IP address, subnet mask, and default gateway to be initialized to their default values. The instrument’s internal memory will not be erased.
4.5 Initializing the Instrument (System Reset)
When the Instrument Is Operating in an Odd or Unexpected Manner (System Reset)
Select Enter
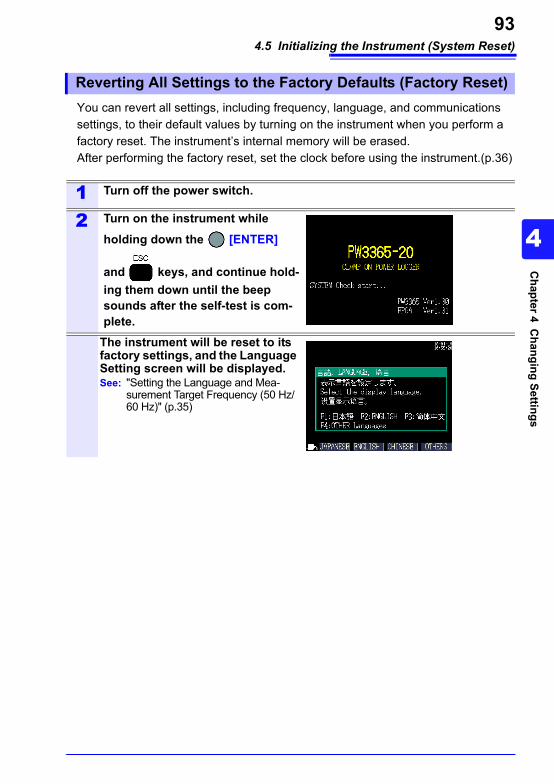
4.5 Initializing the Instrument (System Reset)93
Chapter 4 C
hanging Settings
4
You can revert all settings, including frequency, language, and communications settings, to their default values by turning on the instrument when you perform a factory reset. The instrument’s internal memory will be erased.After performing the factory reset, set the clock before using the instrument.(p.36)
Reverting All Settings to the Factory Defaults (Factory Reset)
1 Turn off the power switch.
2 Turn on the instrument while
holding down the [ENTER]
and keys, and continue hold-ing them down until the beep sounds after the self-test is com-plete.
The instrument will be reset to its factory settings, and the Language Setting screen will be displayed. See: "Setting the Language and Mea-
surement Target Frequency (50 Hz/60 Hz)" (p.35)
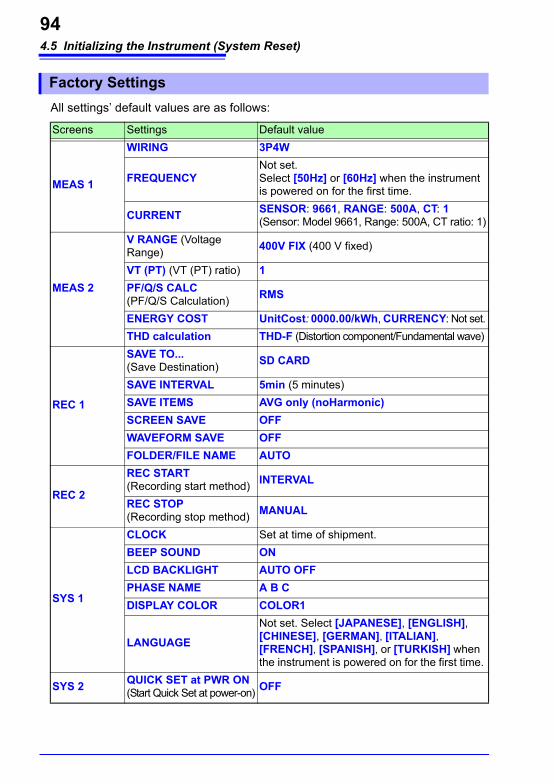
4.5 Initializing the Instrument (System Reset)94
All settings’ default values are as follows:
Factory Settings
Screens Settings Default value
MEAS 1
WIRING 3P4W
FREQUENCYNot set.Select [50Hz] or [60Hz] when the instrument is powered on for the first time.
CURRENT SENSOR: 9661, RANGE: 500A, CT: 1(Sensor: Model 9661, Range: 500A, CT ratio: 1)
MEAS 2
V RANGE (Voltage Range) 400V FIX (400 V fixed)
VT (PT) (VT (PT) ratio) 1PF/Q/S CALC (PF/Q/S Calculation) RMS
ENERGY COST UnitCost: 0000.00/kWh, CURRENCY: Not set.THD calculation THD-F (Distortion component/Fundamental wave)
REC 1
SAVE TO... (Save Destination) SD CARD
SAVE INTERVAL 5min (5 minutes)SAVE ITEMS AVG only (noHarmonic)SCREEN SAVE OFFWAVEFORM SAVE OFFFOLDER/FILE NAME AUTO
REC 2
REC START (Recording start method) INTERVAL
REC STOP (Recording stop method) MANUAL
SYS 1
CLOCK Set at time of shipment.BEEP SOUND ONLCD BACKLIGHT AUTO OFFPHASE NAME A B CDISPLAY COLOR COLOR1
LANGUAGE
Not set. Select [JAPANESE], [ENGLISH], [CHINESE], [GERMAN], [ITALIAN], [FRENCH], [SPANISH], or [TURKISH] when the instrument is powered on for the first time.
SYS 2 QUICK SET at PWR ON (Start Quick Set at power-on) OFF

4.5 Initializing the Instrument (System Reset)95
Chapter 4 C
hanging Settings
4
LAN
IP ADDRESS 192.168.1.31SUBNET MASK 255.255.255.0DEFALT GATEWAY (Default Gateway) 192.168.1.1
Screens Settings Default value

4.5 Initializing the Instrument (System Reset)96

5.1 Viewing and Using the Measurement Screen97
Chapter 5 View
ing Measurem
ent Data
5
The PW3365 allows you to view measured values, waveforms, and graphs on the Measurement screen.
Viewing Measurement Data Chapter 5
5.1 Viewing and Using the Measurement Screen
Reference • If a setting is changed while measured values are being held, the hold will be canceled.
• The time display is not fixed while measured values are being held.
Holds measured values. While values are being held, the HOLD indicator will turn red.
Allows you to select a Measurement screen.
Selects a screen name from a list.
Enter
Switches to the Measurement screen and changes the Mea-surement screen.
Current channel Current rangeClamp sensor
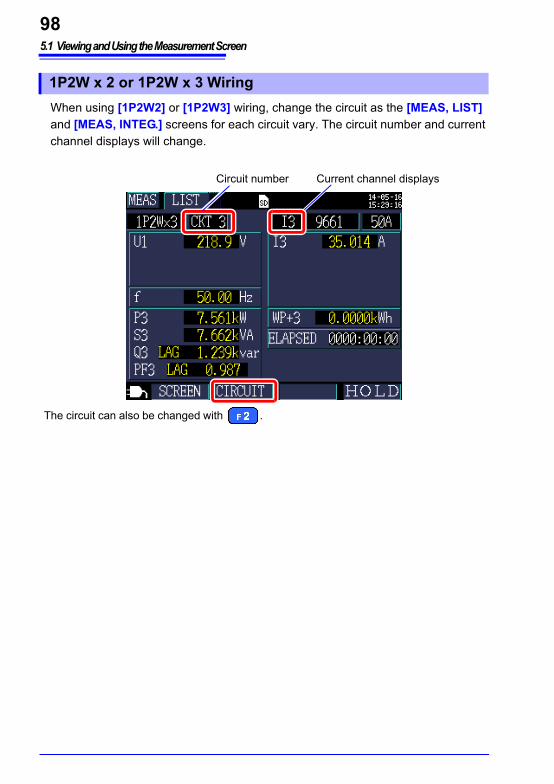
5.1 Viewing and Using the Measurement Screen98
When using [1P2W2] or [1P2W3] wiring, change the circuit as the [MEAS, LIST] and [MEAS, INTEG.] screens for each circuit vary. The circuit number and current channel displays will change.
1P2W x 2 or 1P2W x 3 Wiring
The circuit can also be changed with .
Circuit number Current channel displays

5.2 List of Measurement Screens99
Chapter 5 View
ing Measurem
ent Data
5
5.2 List of Measurement Screens
Screen name Displayed data Reference
List
Voltage RMS (U), current RMS (I), frequency (f), active power (P), reactive power (Q), apparent power (S), power factor (PF) or displacement power factor (DPF), active energy (consumption) WP+, and elapsed time(The display can be switched between two and three circuits when using a 1P2W connection.)
"5.3" (p.101)
U/I
Voltage RMS (U), voltage fundamental wave value (Ufnd), voltage waveform peak (Upeak or Upk), volt-age fundamental wave phase angle (Udeg), current RMS (I), current fundamental wave value (Ifnd), cur-rent waveform peak (Ipeak or Ipk), and current funda-mental wave phase angle (Ideg)
"5.4" (p.102)
PowerPer-channel and total active power P, apparent power S, reactive power Q, power factor PF or displacement power factor DPF
"5.5" (p.104)
Integ.
Active energy (consumption WP+, regeneration WP-), reactive energy (lag WQ+, lead WQ-), recording start time, recording stop time, elapsed time, energy cost(The display can be switched between two and three circuits when using a 1P2W connection.)
"5.6" (p.105)
Demand
Can be switched to active power demand value (con-sumption Pdem+, regeneration Pdem-), reactive power demand value (lag QdemLAG, lead Qdem-LEAD), power factor demand value (PFdem), or pulse input. Maximum demand value: Displays the maximum active power demand value MAX_DEM and the time at which it occurred.
"5.7" (p.106)
Harmonic graph Harmonic graph(voltagea and current levels, content percentage) "5.8" (p.107)
Harmonic list Harmonic list (voltagea and current levels, content percentage) "5.9" (p.108)
Waveform Displays voltage and current waveforms, voltage and current RMS values, and frequency. "5.10" (p.109)
Zoom Enlarged view of 4 user-selected parameters "5.11" (p.111)

5.2 List of Measurement Screens100
TrendDisplays one measurement parameter as selected by the user. Displays the maximum, average, and minimum val-ues and allows cursor measurement.
"5.12" (p.113)
Screen name Displayed data Reference

5.3 Viewing Data (Voltage, Current, Power, and Energy) as a List101
Chapter 5 View
ing Measurem
ent Data
5
Press the or [SCREEN] key to display the [MEAS, LIST] screen.
5.3 Viewing Data (Voltage, Current, Power, and Energy) as a List
Frequency
Voltage RMS Current RMS
Apparent power
Selects between power factor PF (RMS calcula-tion) and displacement power factor DPF (fun-damental wave calculation) with settings.See: "PF/Q/S calculation [PF/Q/S CALC]"
(p.75)
Active power
Reactive power
Active energy(consumption)

5.4 Viewing Voltage and Current Value Details (RMS/Fundamental Wave/Peak Values, and Phase Angles)102
Press the or [SCREEN] key to display the [MEAS, U/I] (VOLT/CURR) screen.
5.4 Viewing Voltage and Current Value Details (RMS/Fundamental Wave/Peak Values, and Phase Angles)
Term Description
RMS value The square root of the squares of 2,048 sampling points in a 200 ms interval.
Fundamental wave value (FND)
The value obtained by extracting only the funda-mental wave (50 Hz/60 Hz) component from the voltage or current waveform. “FND” stands for “fun-damental.”
Peak value The maximum value of the absolute values of the sampling points (2,048 points) in a 200 ms interval.
Fundamental wave phase angle (PHASE)
The phase angle of the fundamental wave compo-nent of U1 expressed in terms of 0°. For current only, the fundamental wave phase angle of I1 expressed in terms of 0°.
RMS values Fundamental wave values
Peak values Phase angles
Current
Voltage

5.4 Viewing Voltage and Current Value Details (RMS/Fundamental Wave/Peak Values, and Phase Angles)103
Chapter 5 View
ing Measurem
ent Data
5
Reference When using [3P3W3M] wiring, the line-to-line voltage is used for volt-age RMS values, while the conductor-to-ground voltage (phase volt-age) is used for the fundamental wave value, peak value, and fundamental wave phase angle. See: "Appendix 3 Three-phase 3-wire Measurement" (p.A2)
To check the line-to-line voltage RMS value, fundamental wave value, peak value, or fundamental wave phase angle for a 3-phase/3-wire cir-cuit, perform measurement using the 3P3W2M wiring method. Alterna-tively, to check the phase voltage RMS value, fundamental wave value, peak value, or fundamental wave phase angle, perform measurement with the instrument set to 3P4W after connecting it as per the 3P3W3M wiring method.

5.5 Viewing Power Details (Channel Power Values)104
Press the or [SCREEN] key to display the [MEAS, POWER] screen.
When using the 3-phase/3-wire/2-wattmeter method (3P3W2M), the active power, reactive power, apparent power, and power factor for each channel are obtained by means of a two-wattmeter calculation process and do not have physical signifi-cance. However, values for individual channels can serve as reference data when checking the connection.However, the 3-wattmeter method can be used with the Y wiring method. Even if you use the 3-wattmeter method with the Δ wiring method, the active power, reac-tive power, and apparent power for each channel will be the same as would be obtained using the 2-wattmeter method. In this situation, the 3-wattmeter method is meaningless. Use the 2-wattmeter method with the Δ wiring method.See: "Appendix 3 Three-phase 3-wire Measurement" (p.A2)
5.5 Viewing Power Details (Channel Power Values)
Per-channel reactive power
Per-channel active power
Total active power
Total power factor
Total reactive power
Per-channel power factor
Total apparent power
Per-channel apparent power

5.6 Viewing Energy (Active Energy and Reactive Energy)105
Chapter 5 View
ing Measurem
ent Data
5
Press the or [SCREEN] key to display the [MEAS, INTEG.] (INTE-GRATE) screen.
5.6 Viewing Energy (Active Energy and Reactive Energy)
Reference • Total energy from the start of recording will be displayed. • Energy cost displays the result of multiplying the active energy con-
sumption value WP+ by the Unit cost setting (p.76).

5.7 Viewing a Demand Graph106
Press the or [SCREEN] key to display the [MEAS, DEMAND] screen.The instrument stores data for up to 48 of the latest time intervals in its internal memory for user review.
5.7 Viewing a Demand Graph
Reference • You can review data for up to 48 of the latest time intervals.• The zoom factor for the vertical axis is set automatically. First, it is set
to 1/10, and then switched automatically to 1/5, 1/2, and 1/1 in series according to displayed data levels.
• When measured values exceed the display range, the relevant bars are colored.
Performs cursor measurement.The cursor keys can be used to move the cursor. When the cursor is se-lected, the demand display is not updated. The display will be updated to the latest demand value once the cursor is cleared.
Cursor measured value
When active power demand value (consump-tion Pdem+) is selected, a line representing the maximum value (maximum active power demand value MAX_DEM) for the active de-mand value (consumption Pdem+) from the start of recording is shown along with the time and date of its occurrence.
Cursor position
Switches the display parameter. (The display parameter can be switched even when the cursor is selected and values are being held.)Active power demand value (consumption Pdem+, regeneration Pdem-)Reactive power demand value (lag QdemLAG, lead QdemLEAD)Power factor demand value (PFdem)
Year, month, date, hours, minutes, and seconds at the cursor position

5.8 Viewing a Harmonic Graph107
Chapter 5 View
ing Measurem
ent Data
5
Press the or [SCREEN] key to display the [MEAS, HARM](HARMONIC G)screen.
5.8 Viewing a Harmonic Graph
Switches the display parameter.
Total harmonic distortion (THD-F or THD-R)See: "THD calculation" (p.77)
Performs cursor measurement.The order can be changed using the cursor keys.
Cursor measured value
Cursor position
Display parameter DescriptionVoltage U1, U2, U3Current I1, I2, I3
LEVELHarmonic level for each orderSwitching between the linear (LINEAR) and logarithmic (LOG) scale axis is available.
%ofFND
Each order’s harmonic component expressed as a percentage of the fundamental wave.Switching between the linear (LINEAR) and logarithmic (LOG) scale axis is available.

5.9 Viewing a Harmonic List108
Press the or [SCREEN] key to display the [MEAS, HARM](HARMONIC L)screen.
5.9 Viewing a Harmonic List
Total harmonic distortion (THD-F or THD-R)See: "THD calculation" (p.77)
Switches the display parameter.
Display parameter DescriptionVoltage U1, U2, U3Current I1, I2, I3LEVEL Harmonic level for each order
%ofFND Each order’s harmonic component expressed as a percentage of the funda-mental wave.

5.10 Viewing Waveforms109
Chapter 5 View
ing Measurem
ent Data
5
Press the or [SCREEN] key to display the [MEAS, WAVE] (WAVE-FORM) screen.
5.10 Viewing Waveforms
Voltage waveforms U1: Red U2: Yellow U3: Blue
Voltage vertical axisVoltage value for 1 division
Changes the zoom factor for the vertical axis used to display voltage and current waveforms (p.110).
Voltage RMS
Current RMS
Current waveforms I1: Red I2: Yellow I3: Blue
Current vertical axisCurrent value for 1 division
Frequency

5.10 Viewing Waveforms110
Changing the Zoom Factor for the Vertical Axis Used to Display Voltage and Current Waveforms
1 Press the [MAGNIFY] key.The cursor will move to the zoom factor field, and you will be able to change the set-ting.
2 Move the cursor to the voltage or current zoom factor and press the
[ENTER] key.A dialog box for selecting the zoom fac-tor will be displayed.
3 Select the desired zoom factor with the cursor’s keys and
press the [ENTER] key.
Reference • For 1P2W x 2 or 1P2W x 3 wirings, changes to the vertical axis zoom factor will affect all channels, even if individual channels use different clamp sensors or current ranges.
• When using the 3P3W3M wiring method, the terminal-to-ground volt-age (phase voltage) is displayed for the voltage waveform, but the line-to-line voltage is displayed for the voltage (RMS value).

5.11 Enlarging Measured Values on the Display111
Chapter 5 View
ing Measurem
ent Data
5
Press the or [SCREEN] key to display the [MEAS, ZOOM] screen.
Changing display parameters
5.11 Enlarging Measured Values on the Display
1Press the [SELECT] key.The cursor will move to the display parameter field, and you will be able to change the setting.
2 Using the cursor keys, move to the parameter whose enlarged display you wish to change and
press the [ENTER] key. A dialog box for selecting the enlarged display will be displayed.
Selects the parameter to enlarge.
Display of selection position of the scrolling parameter

5.11 Enlarging Measured Values on the Display112
3 Select the desired parameter with the cursor keys and accept the new
setting with the [ENTER] key.Change other parameters similarly.
4 Press the [SELECT] key to cancel the setting process.
Reference On the expanded display, you cannot select demand or harmonic parameters.

5.12 Viewing a Trend Graph113
Chapter 5 View
ing Measurem
ent Data
5
Press the or [SCREEN] key to display the [MEAS, TREND] screen.
Changing the vertical axis or horizontal axis (time axis) zoom factor
5.12 Viewing a Trend Graph
Maximum value during the save interval
Switches the display parameter.The display parame-ter can be switched even when the cur-sor is selected and values are being held.
Average value during the save intervalMinimum value during the save interval
The cursor keys can be used to move the cursor. When the cursor is selected, the trend display is not updated. The trend graph will be updated to the latest values once the cursor is cleared.
Cursor position
1 Press the [MAGNIFY] key.The axis selection dialog box will be displayed.

5.12 Viewing a Trend Graph114
2 Select either [Vertical axis] or [Horizontal axis] with the cursor and press the [ENTER] key.The magnify selection dialog box will be displayed.
3 Select the desired zoom factor with the cursor keys and press the [ENTER] key.
The other axis can be changed in the same manner.
Reference • You cannot select demand or harmonic parameters (other than THD) on the time-series display.
• Data for up to 288 time intervals can be displayed on one screen. If this number is exceeded, older data will be discarded. For example: Save interval time setting: 1 sec. Amount of time that can be displayed on 1 screen: 4 minutes 48 sec-onds Save interval time setting: 5 min. Amount of time that can be displayed on 1 screen: 24 hours
• Time-series data used for display purposes will be lost if the power goes out during recording since that data is not backed up. (However, this is not problematic since the same data will have been saved on the SD memory card or in the instrument’s internal memory.) The time-series data will be updated when power is restored.
• The Plus sign “+” of reactive power (Q) represents a LAG, whereas the minus sign “−” represents a LEAD.
• When measured values exceed the display range, the background color is changed.
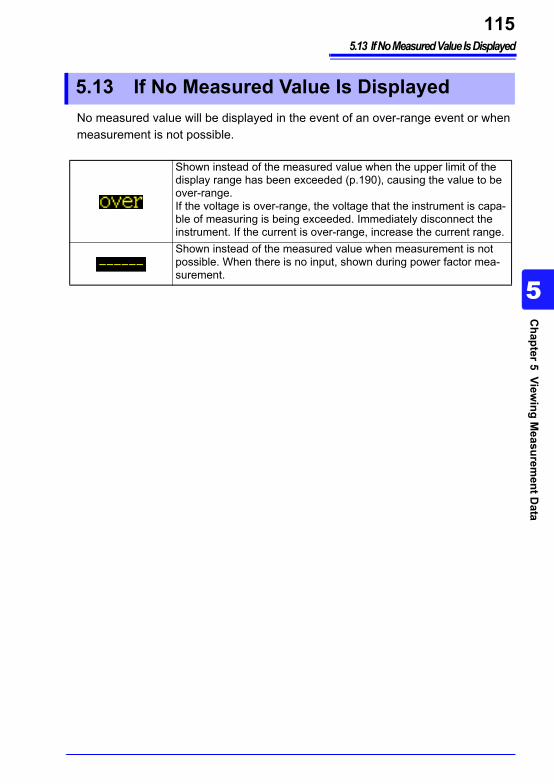
5.13 If No Measured Value Is Displayed115
Chapter 5 View
ing Measurem
ent Data
5
No measured value will be displayed in the event of an over-range event or when measurement is not possible.
5.13 If No Measured Value Is Displayed
Shown instead of the measured value when the upper limit of the display range has been exceeded (p.190), causing the value to be over-range.If the voltage is over-range, the voltage that the instrument is capa-ble of measuring is being exceeded. Immediately disconnect the instrument. If the current is over-range, increase the current range.Shown instead of the measured value when measurement is not possible. When there is no input, shown during power factor mea-surement.

5.13 If No Measured Value Is Displayed116
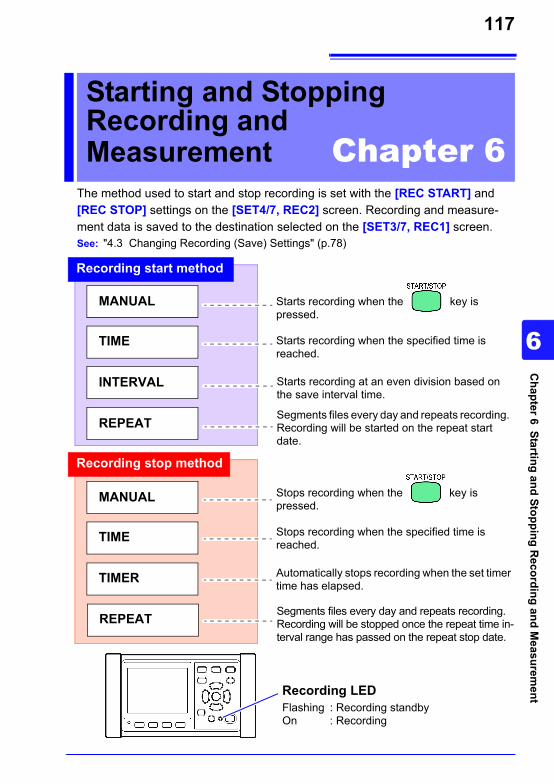
117C
hapter 6 Starting and Stopping Recording and M
easurement
6
The method used to start and stop recording is set with the [REC START] and [REC STOP] settings on the [SET4/7, REC2] screen. Recording and measure-ment data is saved to the destination selected on the [SET3/7, REC1] screen.See: "4.3 Changing Recording (Save) Settings" (p.78)
Starting and Stopping Recording and Measurement Chapter 6
MANUAL
TIME
INTERVAL
Recording start method
Starts recording when the key is pressed.
Starts recording when the specified time is reached.
Starts recording at an even division based on the save interval time.
REPEAT Segments files every day and repeats recording. Recording will be started on the repeat start date.
MANUAL
TIME
Recording stop method
Stops recording when the key is pressed.
Stops recording when the specified time is reached.
TIMER Automatically stops recording when the set timer time has elapsed.
REPEAT Segments files every day and repeats recording. Recording will be stopped once the repeat time in-terval range has passed on the repeat stop date.
Recording LEDFlashing : Recording standbyOn : Recording

6.1 Starting Recording118
6.1 Starting Recording
Reference Do not remove the SD memory card while recording is in progress. If the SD memory card is removed during recording, measurement data will be saved in a new file (with a sequentially numbered suffix) when the card is reinserted.Similarly, if either the recording and measurement data file or waveform data file surpasses 200MB, all data files being recorded (recording/measurement and waveform) will be segmented and new files saved (with a sequential number at the end of each).See: "8.2 Folder and File Structure" (p.134)
Starting Recording Manually
1 Set the [REC START] on the [SET4/7, REC2] screen to [MANUAL].
2Press the key on the Measurement screen.Recording will start (and the Record-ing LED will light up).
The recording LED On

6.1 Starting Recording119
Chapter 6 Starting and Stopping R
ecording and Measurem
ent
6
Staring Recording by Specifying a Time [TIME]
1 Set the [REC START] on the [SET4/7, REC2] screen to [TIME] and set the start time.See: "Setting times for the [TIME] setting"
(p.84)
2Press the key on the Mea-surement screen.The instrument will enter the standby state.
When the set start time is reached, recording will start (and the recording LED will light up).
ReferenceIf the recording start time has already passed when the key is pressed, the “interval time” starting method will be used.
See: "Starting Recording at a Good Time Division [INTERVAL]" (p.120)
Flashing recording LED
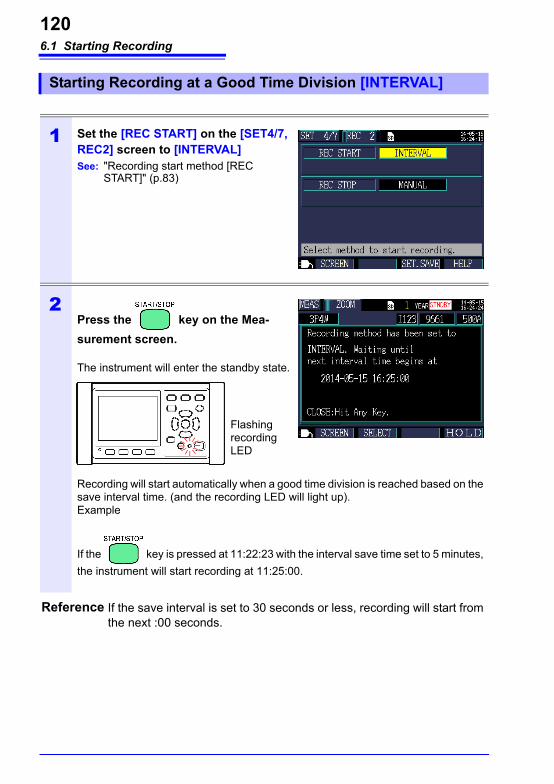
6.1 Starting Recording120
Starting Recording at a Good Time Division [INTERVAL]
1 Set the [REC START] on the [SET4/7, REC2] screen to [INTERVAL]See: "Recording start method [REC
START]" (p.83)
2Press the key on the Mea-surement screen.
The instrument will enter the standby state.
Recording will start automatically when a good time division is reached based on the save interval time. (and the recording LED will light up).Example
If the key is pressed at 11:22:23 with the interval save time set to 5 minutes, the instrument will start recording at 11:25:00.
Reference If the save interval is set to 30 seconds or less, recording will start from the next :00 seconds.
Flashing recording LED

6.2 Stopping Recording121
Chapter 6 Starting and Stopping R
ecording and Measurem
ent
6
6.2 Stopping Recording
Stopping Recording Manually
1 Set the [REC STOP] on the [SET4/7, REC2] screen to [MANUAL].
2Press the key on the Mea-surement screen.A confirmation dialog box will be displayed.
3 Press the [ENTER] key to stop recording.
Reference The maximum recording and measurement period is one year. Record-ing will stop after one year.

6.2 Stopping Recording122
Stopping Recording by Specifying a Time [TIME]
1 Set the [REC STOP] on the [SET4/7, REC2] screen to [TIME] and set the stop time.See: "Recording stop method" (p.87),
"Setting times for the [TIME] setting" (p.84)
2 Once recording has been started and the set recording stop time is reached, recording will stop automatically. (and the recording LED On)
To stop recording before the set stop time is reached, press the key, just as when stopping recording manually.
Reference If the recording stop time has already passed when starting recording, the instrument will begin recording and continue until recording is
stopped manually. To stop recording manually, press the key.

6.2 Stopping Recording123
Chapter 6 Starting and Stopping R
ecording and Measurem
ent
6
Stopping Recording with a Timer [TIMER]
1 Set the [REC STOP] the [SET4/7, REC2] screen to [TIMER] and set the time.See: "Recording stop method" (p.87),
"Setting the [TIMER]" (p.88)
2 Once recording has been started and recording will stop automatically when the set timer time elapses. (and the recording LED On)
To stop recording before the set stop time is reached, press the key, just as when stopping recording manually.

6.3 Repeat Recording [REPEAT]124
Repeat recording resets recording every day, segments files, and repeats recording.
6.3 Repeat Recording [REPEAT]
1 Set the [REC START] on the [SET4/7, REC2] screen to [REPEAT] and set the recording start date, recording stop date, recording time range, and folder segmentation. See: "Recording start method [REC
START]" (p.83), "Configuring detailed settings for [REPEAT]" (p.85)
2Press the key on the Mea-surement screen.
The instrument will enter the standby state.
Recording will be started at the start time on the set start date. (The recording LED will light up.) Recording will repeat at the set interval and time range. (Outside this time range, the recording LED will flash.) Once the recording time range on the stop date has passed, recording will be stopped.
To stop recording before the set stop time is reached, press the key, just as when stopping recording manually.
ReferenceIf the key is pressed after the starting time of the recording time period, the interval time starting method is employed.
Flashing recording LED

6.4 Operation When a Power Outage Occurs While Recording125
Chapter 6 Starting and Stopping R
ecording and Measurem
ent
6
If the supply of power to the instrument is cut off while recording is in progress, measurement operation will stop during the outage, but previously recorded mea-surement data and setting conditions will be backed up. When power returns, a new file will be created, and recording and measurement will continue. If the PW9002 Battery Set (Model 9459 Battery Pack) has been installed, the instrument will automatically switch to battery power in the event of a power outage and con-tinue recording.
6.4 Operation When a Power Outage Occurs While Recording
Reference If the supply of power to the instrument is cut off while accessing the SD memory card, files on the card may be corrupted. Since the SD memory card is accessed frequently when recording with a short save interval time, file corruption is more likely if a power outage occurs dur-ing such use. It will take about 10 seconds for measured values to stabilize once power to the instrument is restored.It is recommended to avoid power outages by using the optional PW9002 Battery Set (Model 9459 Battery Pack).

6.4 Operation When a Power Outage Occurs While Recording126

7.1 Settings Configured with the Quick Set127
Chapter 7 Q
uick Set
7
The Quick Set function provides guidance concerning the following settings and operations, which constitute the minimum level necessary in order to perform recording and measurement:
Basic settings→Connections→Voltage wiring (2 screens)→Current wiring→Selecting range→Wiring check→Recording settings→Starting record.See: Measurement Guide (published separately in color)
When not using the Quick Set, configure all settings as desired.See: "Measurement Flowchart" (p.13)See: "Chapter 4 Changing Settings" (p.71)
The settings listed below can be configured with the Quick Set. To configure other settings, exit the Quick Set without starting recording after proceeding to [Quick Set 9/9, Start] and add the desired settings. See: "7.2 Settings That Can Be Added to Quick Set Settings" (p.128)
Quick Set Chapter 7
7.1 Settings Configured with the Quick Set
• Wiring (1P2W/1P3W/3P3W2M/3P3W3M/3P4W)
• Clamp sensor• Clock• Current range
• Save interval time• Save item• Recording start method• Recording stop method• File name

7.2 Settings That Can Be Added to Quick Set Settings128
Using the following procedure, normal settings can be applied in combination with the Quick Set to perform recording and measurement as desired:
7.2 Settings That Can Be Added to Quick Set Settings
1Press the key to start the Quick Set.
2 Following the instructions pro-vided by the Quick Set function, proceed to the [QuickSet9/9, Start] screen and then press the
[STOP QS] key.
3 The [QUICK SET END] dialog box will be displayed.
Press the [ENTER] key to exit the Quick Set function.
The settings configured with the Quick Set up to this point will be saved.

7.2 Settings That Can Be Added to Quick Set Settings129
Chapter 7 Q
uick Set
7
4Press the key and config-ure the necessary settings on the Settings screen.
See: "4.2 Changing Measurement Set-tings" (p.72)
5 Reconfirm the wirings and mea-sured values.
See: "3.9 Verifying Correct Wiring (Wir-ing Check)" (p.65)
See: "Chapter 5 Viewing Measurement Data" (p.97)
6 Press the key on the Measurement screen to start recording.

7.2 Settings That Can Be Added to Quick Set Settings130

131C
hapter 8 Saving Data and M
anipulating Files
8
The PW3360 can save the following data on an SD memory card or in its internal memory.
The File screen allows you to perform operations such as loading settings data, deleting folders and files, and formatting the SD memory card or internal memory.
Saving Data and Manipulating Files Chapter 8
File contents Extension Format SD memory card
Internal mem-ory
Recording and measurement data CSV CSV Available Available
Harmonic data HRM Binary Available Not availableScreen copy data BMP BMP Available Not availableWaveform data WUI Binary Available Not availableSetting data SET Text Available Available

8.1 Viewing and Using the File Screen132
SD memory card file screen
8.1 Viewing and Using the File Screen
Function keys Reference
USB Drive "9.2 Copying Data to a Computer (USB)" (p.150)
SET.LOAD "8.5 Loading Settings Files" (p.141)
DELETE "8.7 Deleting Folders and Files" (p.144)
FORMAT "8.8 Formatting the SD Memory Card or Internal Memory" (p.145)
Displays the File screen and switches screens (SD memory card/internal memory).Displays the amount of space used on the
SD memory card.
Displays the current display location. In this case, the screen is displaying the PW3365 folder on the SD memory card.
When you scroll the screen with the cursor keys, the scroll bar indicates your current position.
Displays a folder and file list. The list order reflects the order in the save area on the SD memory card.
: Move within the folder hierarchy (select folders and files).
: Move up and down.
or: Folder: File

8.1 Viewing and Using the File Screen133
Chapter 8 Saving D
ata and Manipulating Files
8
Internal memory file screen
Reference • The File screen can display folder and file names of up to eight byte characters in length (or four double-byte characters). Longer names are truncated and displayed. Example: Filename: 1234567890, Display on File screen: 123456~X (X: number)
• Up to 204 folders and files can be displayed. Folders and files in excess of that number will not be shown.
Function keys Reference
COPY "8.6 Copying Internal Memory Files to the SD Memory Card" (p.143)
SET.LOAD "8.5 Loading Settings Files" (p.141)
DELETE "8.7 Deleting Folders and Files" (p.144)
FORMAT "8.8 Formatting the SD Memory Card or Internal Memory" (p.145)
Displays the File screen and switches screens (SD memory card/internal memory).Displays the amount of space used on the
internal memory.
When you scroll the screen with the cursor keys, the scroll bar indicates your current position.
Displays a folder and file list. The list order reflects the order in the save area on the internal memory.

8.2 Folder and File Structure134
This section describes the folder and file structure on the SD memory card and in the instrument’s internal memory.
The PW3365 base folder is required in order for the instrument to save data on the SD memory card. If the PW3365 base folder does not exist on the SD memory card, it can be created as follows:
8.2 Folder and File Structure
SD Memory Card
1 Insert the SD memory card.If the PW3365 base folder does not ex-ist on the card, a dialog box asking whether you wish to create it will be dis-played.
2 Accept with the [ENTER] key.The PW3365 base folder (includ-ing screen copy and settings fold-ers) will be created in the root folder on the SD memory card.
Reference • Even if you choose [NO] on the dialog box asking whether you wish to create the PW3365 base folder, the folder will be created the first time data is saved on the SD memory card.
• The PW3365 base folder cannot be deleted using the instrument.
Screen copy folderPW3365 base folder
SD memory card root folder
PW3365
SETTING
HARDCOPYSD
Settings folder
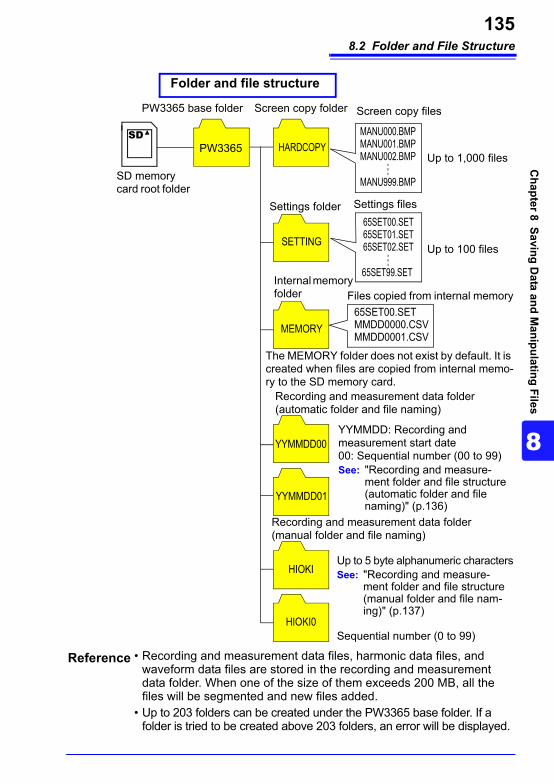
8.2 Folder and File Structure135
Chapter 8 Saving D
ata and Manipulating Files
8
Folder and file structure
Reference • Recording and measurement data files, harmonic data files, and waveform data files are stored in the recording and measurement data folder. When one of the size of them exceeds 200 MB, all the files will be segmented and new files added.
• Up to 203 folders can be created under the PW3365 base folder. If a folder is tried to be created above 203 folders, an error will be displayed.
Screen copy folderPW3365 base folder Screen copy files
Up to 100 files
Up to 1,000 files
Settings folder
Internal memory folder
Recording and measurement data folder (automatic folder and file naming)
SD memory card root folder
Settings files
Up to 5 byte alphanumeric charactersSee: "Recording and measure-
ment folder and file structure (manual folder and file nam-ing)" (p.137)
Sequential number (0 to 99)
Recording and measurement data folder (manual folder and file naming)
YYMMDD: Recording and measurement start date00: Sequential number (00 to 99)See: "Recording and measure-
ment folder and file structure (automatic folder and file naming)" (p.136)
Files copied from internal memory
The MEMORY folder does not exist by default. It is created when files are copied from internal memo-ry to the SD memory card.
65SET00.SETMMDD0000.CSVMMDD0001.CSV
MANU000.BMPMANU001.BMPMANU002.BMP
MANU999.BMP
65SET00.SET65SET01.SET65SET02.SET
65SET99.SET
PW3365
SETTING
HARDCOPY
MEMORY
YYMMDD00
YYMMDD01
HIOKI
HIOKI0
SD
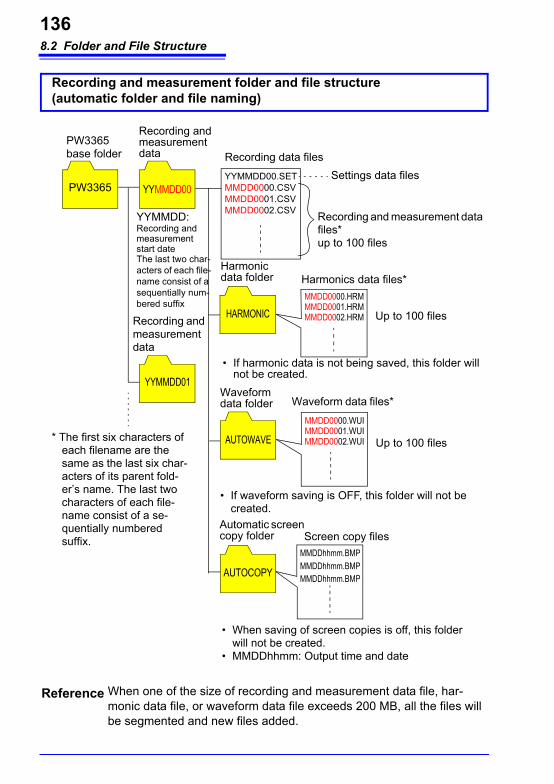
8.2 Folder and File Structure136
Reference When one of the size of recording and measurement data file, har-monic data file, or waveform data file exceeds 200 MB, all the files will be segmented and new files added.
Recording and measurement folder and file structure (automatic folder and file naming)
PW3365 base folder
Recording and measurement data
* The first six characters of each filename are the same as the last six char-acters of its parent fold-er’s name. The last two characters of each file-name consist of a se-quentially numbered suffix.
YYMMDD01
YYMMDD:Recording and measurement start dateThe last two char-acters of each file-name consist of a sequentially num-bered suffix
Recording and measurement data
Recording and measurement data files*up to 100 files
Up to 100 files
Waveform data files*Waveform data folder
MMDDhhmm.BMPMMDDhhmm.BMPMMDDhhmm.BMP
• When saving of screen copies is off, this folder will not be created.
• MMDDhhmm: Output time and date
Screen copy filesAutomatic screen copy folder
• If waveform saving is OFF, this folder will not be created.
MMDD0000.WUIMMDD0001.WUIMMDD0002.WUI
YYMMDD00.SETMMDD0000.CSVMMDD0001.CSVMMDD0002.CSV
Recording data filesSettings data files
PW3365 YYMMDD00
AUTOWAVE
AUTOCOPY
Harmonic data folder Harmonics data files*
Up to 100 filesHARMONICMMDD0000.HRMMMDD0001.HRMMMDD0002.HRM
• If harmonic data is not being saved, this folder will not be created.

8.2 Folder and File Structure137
Chapter 8 Saving D
ata and Manipulating Files
8
Recording and measurement folder and file structure (manual folder and file naming)
Reference When one of the recording and measurement data file, harmonic data file, or waveform data file exceeds 200 MB, all the files will be seg-mented and new files added.
PW3365
PW3365 base folder
Recording and measurement data Recording data files
HIOKI.SETHIOKI00.CSVHIOKI01.CSVHIOKI02.CSV
Settings data files
MMDDhhmm.BMPMMDDhhmm.BMPMMDDhhmm.BMP
• When saving of screen copies is off, this folder will not be created.
• MMDDhhmm: Output time and date
Screen copy files
Automatic screen copy folder
Recording and measurement data
Recording and measurement data files*up to 100 files
HIOKI00.WUIHIOKI01.WUIHIOKI02.WUI Up to 100 files
Waveform data files*Waveform data folder
• If waveform saving is OFF, this folder will not be created.
* Filenames[FOLDER/FILE NAME] (p.81) + file sequential number (00 to 99)
If recording and measurement are repeated without manually changing the [FOLDER/FILE NAME](p.81), a sequential number (0 to 99) will be added to the end of the names.
HIOKI
HIOKI0
AUTOWAVE
AUTOCOPY
Harmonic data folder Harmonics data files*
Up to 100 filesHARMONICMMDD0000.HRMMMDD0001.HRMMMDD0002.HRM
• If harmonic data is not being saved, this folder will not be created.

8.2 Folder and File Structure138
Setting files and recording and measurement data files can be stored in the instru-ment’s internal memory. Since harmonic measurement data, screen copies, and waveform data cannot be saved in internal memory, they must be saved on the SD memory card.
Internal Memory
Reference The maximum number of files that can be created in the instrument’s internal memory is 100. Attempting to create more than 100 files will result in an error.
If [FOLDER/FILE NAME] is [MANUAL] (p.81) (for example, “HIOKI”)
Internal memory root folder
Setting file (.SET)
Recording and measurement file (.CSV)
65SETXX.SET65MEMXX.CSVHIOKI.CSVHIOKIXX.CSV65BACKXX.CSV
If [FOLDER/FILE NAME] is [AUTO] (p.81)
If recording is stopped and then restarted while [FOLDER/FILE NAME] is [MANUAL] and the filename is set to [HIOKI] (p.81)
Data that was backed up in the internal memory because no SD memory card was inserted when the save destination was set to [SD CARD]When recording and measurement are stopped, if an SD memory card has been insert-ed into the instrument, data will be moved from the instrument’s internal memory to the SD memory card’s recording and measurement data file.
(XX: 00 to 99)

8.3 Saving Copies of the Screen (SD Memory Card Only)139
Chapter 8 Saving D
ata and Manipulating Files
8
The screen currently being displayed can be saved in BMP file format on the SD memory card.
8.3 Saving Copies of the Screen (SD Memory Card Only)
Reference Even if the [SAVE TO...] (p.78) is set to [INTERNAL M], screen copies are saved on the SD memory card. If no SD memory card has been inserted, screen copies cannot be saved.
1 Verify that an SD memory card has been inserted into the instrument.
2 Display the screen you wish to save and press the key.
You can save a hold screen by pressing the [HOLD] key.
The screen will be saved in the [PW3365]-[HARDCOPY] folder in the SD memory card’s root folder (at the top of the card’s folder hierarchy).See: "8.2 Folder and File Structure" (p.134)
SD memory card mark
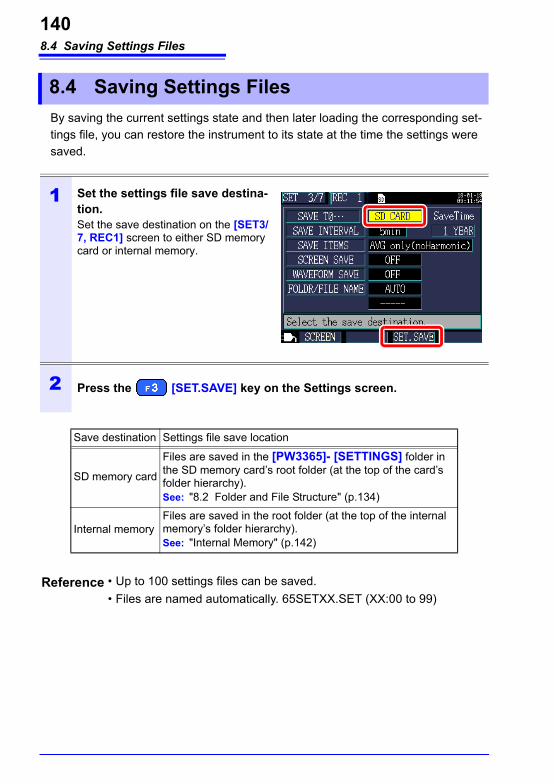
8.4 Saving Settings Files140
By saving the current settings state and then later loading the corresponding set-tings file, you can restore the instrument to its state at the time the settings were saved.
8.4 Saving Settings Files
1 Set the settings file save destina-tion.Set the save destination on the [SET3/7, REC1] screen to either SD memory card or internal memory.
2 Press the [SET.SAVE] key on the Settings screen.
Save destination Settings file save location
SD memory card
Files are saved in the [PW3365]- [SETTINGS] folder in the SD memory card’s root folder (at the top of the card’s folder hierarchy).See: "8.2 Folder and File Structure" (p.134)
Internal memoryFiles are saved in the root folder (at the top of the internal memory’s folder hierarchy).See: "Internal Memory" (p.142)
Reference • Up to 100 settings files can be saved.• Files are named automatically. 65SETXX.SET (XX:00 to 99)

8.5 Loading Settings Files141
Chapter 8 Saving D
ata and Manipulating Files
8
This section describes how to load a settings file that was previously saved on the SD memory card or in the instrument’s internal memory.
8.5 Loading Settings Files
Reference LAN settings are not loaded.
SD Memory Card
1Press the key to display the [FILE, SD] screen.
2 Select the settings file (with the .SET extension) to load.
: Move within the folder hierarchy.
: Move up and down. (Select folders and files)
Settings files saved using the functional-ity provided by the instrument for saving settings can be found in the [PW3365] -[SETTING] folder.
3 Press the [SET.LOAD] key.
4 When the confirmation dialog box
is displayed, press the [ENTER] key.
or
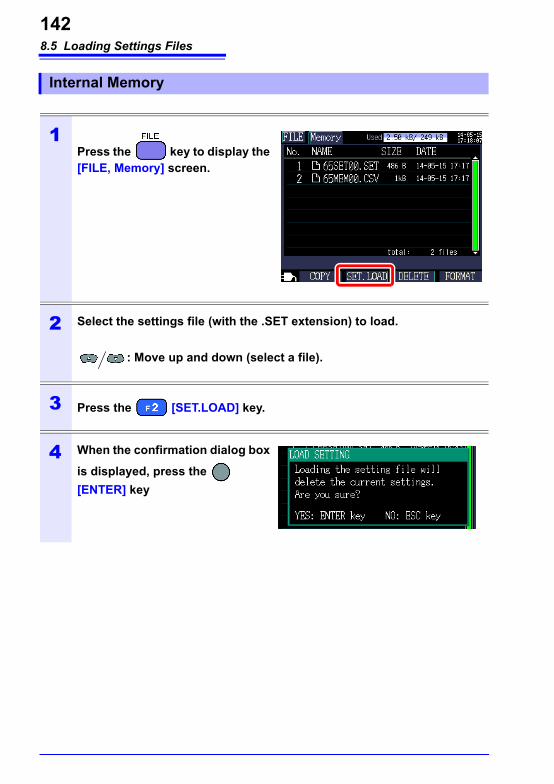
8.5 Loading Settings Files142
Internal Memory
1Press the key to display the [FILE, Memory] screen.
2 Select the settings file (with the .SET extension) to load.
: Move up and down (select a file).
3 Press the [SET.LOAD] key.
4 When the confirmation dialog box
is displayed, press the [ENTER] key
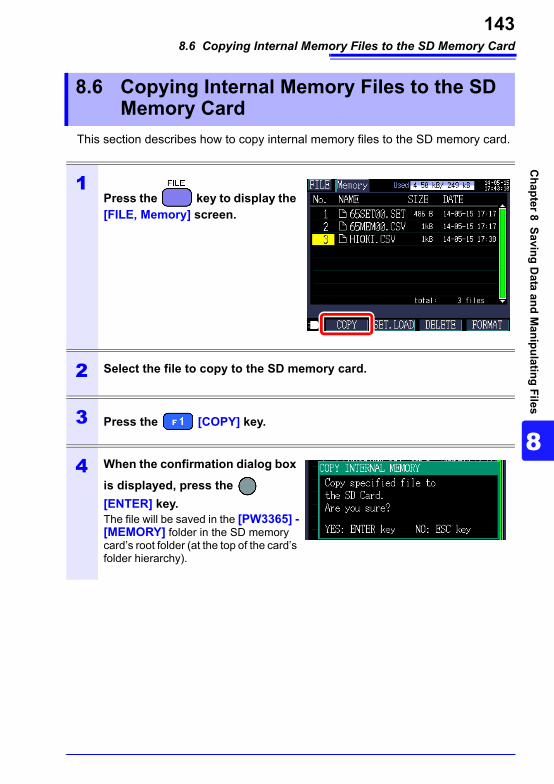
8.6 Copying Internal Memory Files to the SD Memory Card143
Chapter 8 Saving D
ata and Manipulating Files
8
This section describes how to copy internal memory files to the SD memory card.
8.6 Copying Internal Memory Files to the SD Memory Card
1Press the key to display the [FILE, Memory] screen.
2 Select the file to copy to the SD memory card.
3 Press the [COPY] key.
4 When the confirmation dialog box
is displayed, press the [ENTER] key.The file will be saved in the [PW3365] -[MEMORY] folder in the SD memory card’s root folder (at the top of the card’s folder hierarchy).

8.7 Deleting Folders and Files144
This section describes how to delete folders and files stored on the SD memory card or in the instrument’s internal memory.
8.7 Deleting Folders and Files
1Press the key to display the [FILE, SD] or [FILE, Memory] screen.
2 Select the folder or file to delete.
: Move within the folder hierarchy. (SD memory card only): Move up and down. (Select folders and files)
3 Press the [DELETE] key.A confirmation dialog box will be dis-played.
4 Accept with the [ENTER] key.
Reference The [PW3365] folder cannot be deleted.
or

8.8 Formatting the SD Memory Card or Internal Memory145
Chapter 8 Saving D
ata and Manipulating Files
8
This section describes how to format an SD memory card or the instrument’s inter-nal memory.
8.8 Formatting the SD Memory Card or Inter-nal Memory
IMPORTANT
Formatting will cause all saved data to be erased, and it cannot be undone. Check the contents of the card or memory before formatting. It is recommended to back up important data on SD memory cards and in the instrument’s internal memory.
1Press the key to display the [FILE, SD] screen or the [FILE, Memory] screen.
2 Press the [FORMAT] key.A confirmation dialog box will be dis-played.
3 Accept with the [ENTER] key.When formatting of an SD memo-ry card completes, the PW3365 basic folder (which is used to store screen copies and settings folders) will be automatically cre-ated in the root folder of the card.
Screen copy folderPW3365 base folder
SD memory card root folder
PW3365
SETTING
HARDCOPYSD
Settings folder

8.8 Formatting the SD Memory Card or Internal Memory146
Reference • Use the instrument to format SD memory cards. Formatting a card with a computer may prevent the media from being initialized with the dedicated SD format, causing decreased performance in the form of slower read and write speeds.
• The instrument can only save data to SD memory cards that have been initialized with the dedicated SD format.

147C
hapter 9 Analyzing D
ata on a Com
puter
9
This section describes how to load data recorded with the instrument onto a com-puter and analyze it using the optional SF1001 Power Logger Viewer application. Recording and measurement data can also be checked by loading it into the graphics software such as Excel®.See: SF1001 Power Logger Viewer Instruction Manual
To access data, either load it from the SD memory card on which it was saved using a computer with an SD memory card reader, or use a USB cable to copy data from the SD memory card or internal memory to the computer.
You can also download data to a computer using the PW3360/PW3365 configura-tion and data downloading software, which is freeware.See: "Chapter 10 Using Communications (USB/LAN)" (p.167)
Analyzing Data on a Computer Chapter 9
File content Extension Format
Supported application softwareModel
SF1001 supported
Other than SF1001
Recording and measurement data CSV CSV Available
• Spreadsheet software• PW3360/PW3365
Excel automatic graphing software (p.166)
Harmonic data HRM Binary Available -Waveform data WUI Binary Available -Screen copy data BMP BMP Not Available • Graphics SoftwareSetting data SET Text Not Available • Text editor
SF1001 Power Logger Viewer
Recording data

9.1 Copying Data to a Computer (SD)148
This section describes how to eject the SD memory card from the instrument and copy data from the card to a computer. If the computer does not have an SD mem-ory card slot, please purchase an SD memory card reader. You can also download instrument data (from the SD memory card or the instru-ment’s internal memory) to a computer using the instrument’s USB or LAN com-munications. See: "Chapter 10 Using Communications (USB/LAN)" (p.167)
Windows7
9.1 Copying Data to a Computer (SD)
1 Verify that recording and mea-surement have stopped.Removing a card while data is being written to it may damage the card.
2 Eject the SD memory card from the instrument.
3 Insert the SD memory card into the SD memory card slot on the com-puter.
Extinction

9.1 Copying Data to a Computer (SD)149
Chapter 9 A
nalyzing Data on a C
omputer
9
4 Click the start button - [Computer].
5 Double click the [[PW3365SD].
ReferenceIf the SD memory card was not formatted with instrument, [Removable Disk] will be displayed.
6 Copy the necessary folders or files to the specified folder on the com-puter.
2 Click
1 Click
Double Click

9.2 Copying Data to a Computer (USB)150
This section describes how to copy data from an SD memory card or the instru-ment’s internal memory to a computer by connecting the instrument and computer with the included USB cable. When connecting the instrument with USB, there is no need to configure any instrument settings.
9.2 Copying Data to a Computer (USB)
To avoid malfunctions, do not connect or disconnect the USB cable while the instrument is operating.
Reference • If the instrument and computer are both off and connected with the USB cable, turn on the computer and then the instrument. Powering up the devices in a different order may prevent the instrument and computer from communicating.
• Copying large data files from the SD memory card to a computer via the instrument’s USB interface can be time-consuming. When you need to copy a large data file to a computer, it is recommended to use an SD memory card reader.
1 Turn on the computer.
2 Turn on the instrument.
3 Connect the instrument and computer with the included USB cable.
4 Press the key to display the File screen.
USB interface To computer’s LAN interface
USB cable (supplied with the instrument)

9.2 Copying Data to a Computer (USB)151
Chapter 9 A
nalyzing Data on a C
omputer
9
5 Press the [USB Drive] key on the [FILE, SD] screen.If the instrument is connected to the computer, the following message will be dis-played on the instrument:
The computer will recognize the SD memory card and internal memory as remov-able disks.
6 Copy the necessary folders or files to the specified folder on the computer.
Reference • Data on the instrument’s SD memory card or internal memory cannot be manipulated (to delete files, change filenames, etc.) from the com-puter.
• No USB drive can be connected if no SD memory card has been inserted.
Connecting to mass storage.To cancel, hit ESC.Cancel: ESC
SD memory cardIf the SD memory card was formatted with the PW3365, “PW3365SD” will have been written to the volume label, and that label will be displayed. If the SD memory card was not formatted with the PW3365, [Removable Disk] (or the previously written volume label) will be displayed.
Internal memory
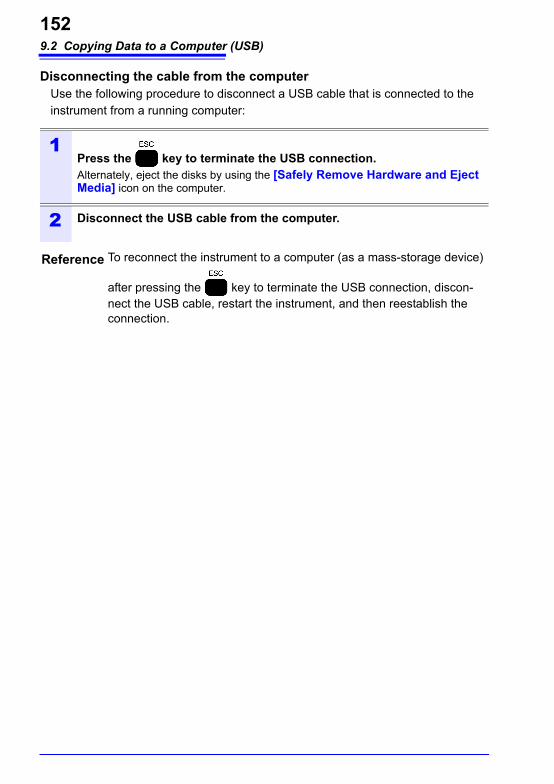
9.2 Copying Data to a Computer (USB)152
Disconnecting the cable from the computerUse the following procedure to disconnect a USB cable that is connected to the instrument from a running computer:
1Press the key to terminate the USB connection.Alternately, eject the disks by using the [Safely Remove Hardware and Eject Media] icon on the computer.
2 Disconnect the USB cable from the computer.
Reference To reconnect the instrument to a computer (as a mass-storage device)
after pressing the key to terminate the USB connection, discon-nect the USB cable, restart the instrument, and then reestablish the connection.

9.3 SF1001 Power Logger Viewer (Optional)153
Chapter 9 A
nalyzing Data on a C
omputer
9
The SF1001 Power Logger Viewer is a software application that runs on a com-puter to analyze data recorded with the instrument. The SF1001 can load mea-surement data recorded with the instrument. However, note that it may lose the ability to load files if they are opened with another application or overwritten, caus-ing the format to change.The SF1001 provides the following capabilities:
9.3 SF1001 Power Logger Viewer (Optional)
Displaying a time-series graph (2-axis display)Select parameters and display a time-series graph.
Displaying a ledger-style listSelect parameters and display a time-series data.
Harmonic display(when harmonic data was saved)Displays a harmonic list and harmonic graphfor the specified time.
Waveform display (when waveform data was saved)Displays waveforms.
ReferenceThe PW9020 Safety Voltage Sensor generates an internal voltage that is equivalent to the measure-ment voltage by means of switching operation. Due to the effects of switching operation, a frequency component that is not actually contained may be superposed onto the waveform data.

9.3 SF1001 Power Logger Viewer (Optional)154
Displaying settingsYou can load settings data contained in measure-ment data and review the setting conditions that were used at the time of measurement.
Printing reportsYou can print user-specified measurement data as reports.
Converting measurement data into CSV-format filesYou can convert a user-specified range of mea-surement data into a CSV-format file.You can also load harmonic data that was saved in the binary format into a spreadsheet application by converting it to the CSV format.

9.4 Checking Recording and Measurement Data with Excel®155
Chapter 9 A
nalyzing Data on a C
omputer
9
Since recording and measurement data is stored in CSV-format files, it can be loaded into Excel®.Waveform data use a binary format and cannot be loaded into Excel®. Review this data with the SF1001 Power Logger Viewer (option).
9.4 Checking Recording and Measurement Data with Excel®
Opening recording and measurement data
1 Copy data saved on the SD memory card or in the instrument’s internal memory to a computer.See: "9.1 Copying Data to a Computer (SD)" (p.148)See: "9.2 Copying Data to a Computer (USB)" (p.150)
2 Double-click on the recording and measurement data file that you cop-ied to the computer.
3 The recording and measurement data file will open, allowing you to review the data.
When the automatic file name is selected: MMDDXXXX.CSV
Double Click

9.4 Checking Recording and Measurement Data with Excel®156
When you open measurement data in Excel® and overwrite the original file by sav-ing it as a CSV-format file, the file format will change. When you open a measure-ment (CSV-format) file, save it as an Excel® file (.xls or .xlsx).
Saving Data as an Excel® File
1 Click [file]-[Save As] on the menu bar.
2 Specify the save destination.The file can be saved anywhere you wish.
3 Select [Microsoft Office Excel Workbook] under [Save as type].
4 Change the filename as necessary and click [Save].
Click
Click

9.4 Checking Recording and Measurement Data with Excel®157
Chapter 9 A
nalyzing Data on a C
omputer
9
An example of data from a measurement file is shown below:
Example of Data from a Measurement File
Measurement information (p.159) Measurement data (p.164)
Instrument information (p.158)
Recording start time
Measurement data header (p.160)

9.4 Checking Recording and Measurement Data with Excel®158
Instrument information
Measurement File Contents
Parameter Parameter name Format Description
HIOKI PW3365 (VerX.XX)
Instrument informa-tion(Version number)
S/N.123456789 PW3365’s serial num-ber
FOLDER Folder nameAutomatic: YYMMDDXXUser-specified: ABCDE (5 characters)
Folder name(For data in internal memory, the filename is shown.)
WIRING Wiring
1P2W/1P2Wx2/1P2Wx3/ 1P3W/1P3W1U/1P3W+I/ 1P3W1U+I/3P3W2M/ 3P3W2M+I/3P3W3M/3P4W/I/Ix2/Ix3
Wiring settingsI: Current only
OPERATION PF/Q/S calculation selection RMS/FND
Power factor PF / reac-tive power Q / apparent power S calculation selectionRMS: RMS calculationFND: Fundamental wave calculation
FREQUENCY Frequency 50Hz/60Hz Frequency setting
THDTHD (Total harmonic distortion)Calculation selection
THD-F/ THD-R
Calculation selection at the total harmonic dis-tortion"Appendix 5 Terminol-ogy" (p.A11)
INTERVAL Save interval time
1sec/2sec/5sec/10sec/15sec/30sec/1min/2min/ 5min/10min/15min/ 20min/30min/60min
Save interval time
U RANGE Voltage range 400V Voltage range settingFixed at 400V
I RANGE Current range5A/10A/50A/100A/500A(when the 9661 sensor is selected)
Current range settingVaries with clamp sen-sor type.If there are multiple cir-cuits, the current range for each is included.

9.4 Checking Recording and Measurement Data with Excel®159
Chapter 9 A
nalyzing Data on a C
omputer
9
Measurement information
SENSOR Clamp sensor
9660(100A)/9661(500A)/9694(5A)/9669(1000A)/9695-02(50A)/ 9695-03(100A)/ CT9667(500A)/ CT9667(5000A)/ 9657-10(10A)/9675(10A)
Clamp sensor settingIf there are multiple cir-cuits, the clamp sensor for each is included.
VT(PT) VT (PT) ratio
User-specified: 0000.01 to 9999.99Selected: 1/60/100/200/300/ 600/700/1000/2000/2500/5000
VT (PT) ratio setting
CT CT ratio
User-specified: 0000.01 to 9999.99Selected: 1/40/60/80/120/ 160/200/240/300/400/600/800/1200
CT ratio settingIf there are multiple cir-cuits, the ratio for each is included.
ENERGY COST
Energy unit cost 0.00000 to 99999.9 Energy unit cost setting (/kWh)
Energy cost currency User-specified: ABC (3 characters)
Energy cost currency setting
Parameter Parameter name Format Description
Date Output time and date YYYY-MM-DD hh:mm:ss Output time and date
Etime Elapsed time hhhh:mm:ss Elapsed time from start of recording
StatusMeasure-ment Infor-mation
HGFEDCBA(A to H: 0 or 1)
A : U1 (voltage CH1) peak exceededB : U2 (voltage CH2) peak exceededC : U3 (voltage CH3) peak exceededD : I1 (current CH1) peak exceededE : I2 (current CH2) peak exceededF : I3 (current CH3) peak exceededG : Frequency errorH : Power outage during interval timeExample:If data includes I1 (current CH1) data in excess of peak: 00001000
Parameter Parameter name Format Description
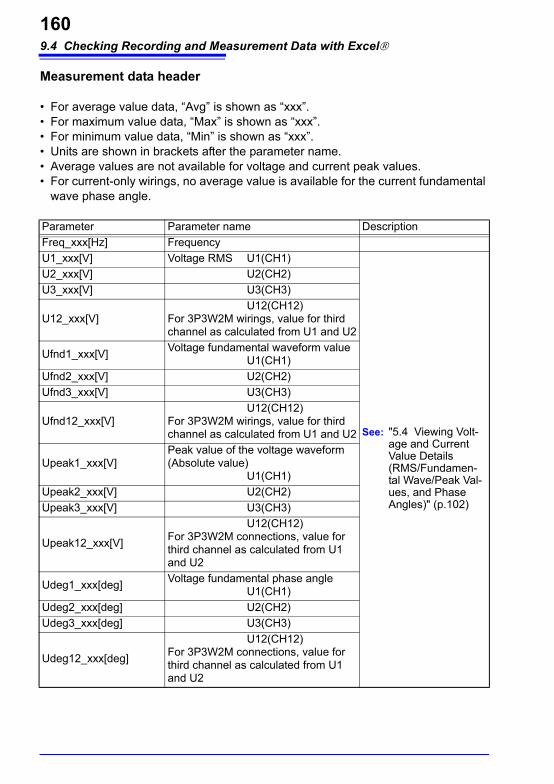
9.4 Checking Recording and Measurement Data with Excel®160
Measurement data header
• For average value data, “Avg” is shown as “xxx”.• For maximum value data, “Max” is shown as “xxx”.• For minimum value data, “Min” is shown as “xxx”.• Units are shown in brackets after the parameter name.• Average values are not available for voltage and current peak values.• For current-only wirings, no average value is available for the current fundamental
wave phase angle.
Parameter Parameter name DescriptionFreq_xxx[Hz] FrequencyU1_xxx[V] Voltage RMS U1(CH1)
See: "5.4 Viewing Volt-age and Current Value Details (RMS/Fundamen-tal Wave/Peak Val-ues, and Phase Angles)" (p.102)
U2_xxx[V] U2(CH2)U3_xxx[V] U3(CH3)
U12_xxx[V]U12(CH12)
For 3P3W2M wirings, value for third channel as calculated from U1 and U2
Ufnd1_xxx[V] Voltage fundamental waveform value U1(CH1)
Ufnd2_xxx[V] U2(CH2)Ufnd3_xxx[V] U3(CH3)
Ufnd12_xxx[V]U12(CH12)
For 3P3W2M wirings, value for third channel as calculated from U1 and U2
Upeak1_xxx[V]Peak value of the voltage waveform (Absolute value)
U1(CH1)Upeak2_xxx[V] U2(CH2)Upeak3_xxx[V] U3(CH3)
Upeak12_xxx[V]
U12(CH12)For 3P3W2M connections, value for third channel as calculated from U1 and U2
Udeg1_xxx[deg] Voltage fundamental phase angle U1(CH1)
Udeg2_xxx[deg] U2(CH2) Udeg3_xxx[deg] U3(CH3)
Udeg12_xxx[deg]
U12(CH12)For 3P3W2M connections, value for third channel as calculated from U1 and U2

9.4 Checking Recording and Measurement Data with Excel®161
Chapter 9 A
nalyzing Data on a C
omputer
9
I1_xxx[A] Current RMS I1(CH1)
See: "5.4 Viewing Volt-age and Current Value Details (RMS/Fundamen-tal Wave/Peak Val-ues, and Phase Angles)" (p.102)
I2_xxx[A] I2(CH2)I3_xxx[A] I3(CH3)
I12_xxx[A]I12(CH12)
For 3P3W2M wirings, value for third channel as calculated from I1 and I2
Ifnd1_xxx[A] Current fundamental wave value I1(CH1)
Ifnd2_xxx[A] I2(CH2)Ifnd3_xxx[A] I3(CH3)
Ifnd12_xxx[A]I12(CH12)
For 3P3W2M wirings, value for third channel as calculated from I1 and I2
Ipeak1_xxx[A]Peak value of the current waveform (Absolute value)
I1(CH1)Ipeak2_xxx[A] I2(CH2)Ipeak3_xxx[A] I3(CH3)
Ipeak12_xxx[A]
I12(CH12)For 3P3W2M connections, value for third channel as calculated from I1 and I2
Ideg1_xxx[deg] Current fundamental phase angle I1(CH1)
Ideg2_xxx[deg] I2(CH2) Ideg3_xxx[deg] I3(CH3)
Ideg12_xxx[deg]
I12(CH12)For 3P3W2M connections, value for third channel as calculated from I1 and I2
P1_xxx[W] Active power P1(CH1) P2_xxx[W] P2(CH2) P3_xxx[W] P3(CH3) P_xxx[W] P(total)S1_xxx[VA] Apparent power S1(CH1)S2_xxx[VA] S2(CH2)S3_xxx[VA] S3(CH3)S_xxx[VA] S(total)Q1_xxx[var] Reactive power Q1(CH1)Q2_xxx[var] Q2(CH2)Q3_xxx[var] Q3(CH3)Q_xxx[var] Q(total)
Parameter Parameter name Description

9.4 Checking Recording and Measurement Data with Excel®162
PF1_xxx Power factor PF1(CH1)
See: "PF/Q/S calcula-tion [PF/Q/S CALC]" (p.75)
See: "Appendix 5 Termi-nology" (p.A11)
PF2_xxx PF2(CH2)PF3_xxx PF3(CH3)PF_xxx PF(total)
DPF1_xxx Displacement power factor DPF1(CH1)
DPF2_xxx DPF2(CH2)DPF3_xxx DPF3(CH3)DPF_xxx DPF(total)WP+[Wh] Active energy (Consumption)
Active energy from start of recording (Consump-tion)
WP+1[Wh] to WP+3[Wh]
Active energy (Consumption), first cir-cuit to third circuitActive energy (Consumption) for each of three 1P2W circuits
WP-[Wh] Active energy (Regeneration)Active energy from start of recording (Regenera-tion)WP-1[Wh] to WP-3[Wh]
Active energy (Regeneration), first cir-cuit to third circuitActive energy (Regeneration) for each of three 1P2W circuits
WQLAG[varh] Reactive energy (Lag)Reactive energy from start of recording (Lag)WQLAG1[varh] to
WQLAG3[varh]
Reactive energy (Lag), first circuit to third circuitReactive energy (Lag) for each of three 1P2W circuits
WQLEAD[varh] Reactive energy (Lead)
Reactive energy from start of recording (Lead)WQLEAD1[varh] to
WQLEAD3[varh]
Reactive energy (Lead), first circuit to third circuitReactive energy (Lead) for each of three 1P2W circuits
WP+dem[Wh] Active power demand quantity (Con-sumption)
Active energy (Con-sumption) for each inter-val timeWP+dem1[Wh] to
WP+dem3[Wh]
Active power demand quantity (Con-sumption), first circuit to third circuit Active power demand quantity (Con-sumption) for each of three 1P2W cir-cuits
WP+[Wh] Active energy (Consumption)Active energy from start of recording (Consump-tion)
WP+1[Wh] to WP+3[Wh]
Active energy (Consumption), first cir-cuit to third circuitActive energy (Consumption) for each of three 1P2W circuits
Parameter Parameter name Description

9.4 Checking Recording and Measurement Data with Excel®163
Chapter 9 A
nalyzing Data on a C
omputer
9
WP-dem[Wh] Active power demand quantity (Regeneration)
Active energy (Regener-ation) for each interval timeWP-dem1[Wh] to
WP-dem3[Wh]
Active power demand quantity (Regeneration), first circuit to third cir-cuit Active power demand quantity (Regeneration) for each of three 1P2W circuits
WQLAGdem[varh] Reactive power demand quantity (Lag)
Reactive energy (Lag) for each interval time
WQLAGdem1[varh] to WQLAGdem3[varh]
Reactive power demand quantity (Lag), first circuit to third circuit Reactive power demand quantity (Lag) for each of three 1P2W circuits
WQLEADdem[varh] Reactive power demand quantity (Lead)
Reactive energy (Lead) for each interval timeWQLEADdem1[varh] to
WQLEADdem3[varh]
Reactive power demand quantity (Lead), first circuit to third circuitActive power demand quantity for each of three 1P2W circuits
Pdem+[W] Active power demand value (Con-sumption)
Average value of active power (Consumption) for each interval time Pdem+1[W] to
Pdem+3[W]
Active power demand value (Con-sumption), first circuit to third circuit Active power demand value (Con-sumption) for each of three 1P2W cir-cuits
Pdem-[W] Active power demand value (Regen-eration)
Average value of active power (Regeneration) for each time intervalPdem-1[W] to
Pdem-3[W]
Active power demand value (Regen-eration), first circuit to third circuitActive power demand value (Regen-eration) for each of three 1P2W cir-cuits
QdemLAG[var] Reactive power demand value (Lag)Average value of reac-tive power (Lag) for each time interval
QdemLAG1[var] to QdemLAG3[var]
Reactive power demand value (Lag), first circuit to third circuitReactive power demand value (Lag) for each of three 1P2W circuits
QdemLEAD[var] Reactive power demand value (Lead)Average value of reac-tive power (Lead) for each time interval
QdemLEAD1[var] to QdemLEAD3[var]
Reactive power demand value (Lead), first circuit to third circuitReactive power demand value (Lead) for each of three 1P2W circuits
Parameter Parameter name Description
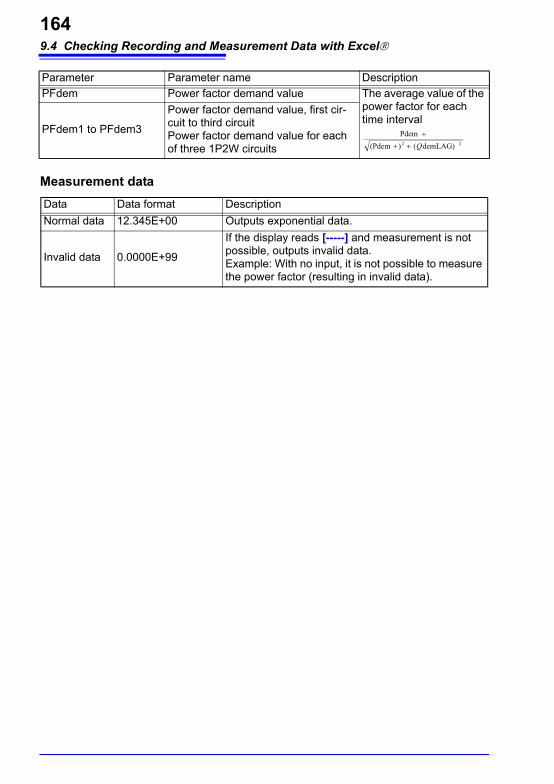
9.4 Checking Recording and Measurement Data with Excel®164
Measurement data
PFdem Power factor demand value The average value of the power factor for each time interval
PFdem1 to PFdem3
Power factor demand value, first cir-cuit to third circuit Power factor demand value for each of three 1P2W circuits
Data Data format DescriptionNormal data 12.345E+00 Outputs exponential data.
Invalid data 0.0000E+99
If the display reads [-----] and measurement is not possible, outputs invalid data.Example: With no input, it is not possible to measure the power factor (resulting in invalid data).
Parameter Parameter name Description
22 demLAG)()(PdemPdem
Q++
+

9.4 Checking Recording and Measurement Data with Excel®165
Chapter 9 A
nalyzing Data on a C
omputer
9
Measured values are displayed exponentially so that the instrument can accom-modate values of varying lengths. To make it easier to view data in Excel®, expo-nential data can be converted into numerical data.
Converting Measured Value Exponential Data
1 Select the column labels you wish to convert into numerical data and right-click with the mouse.
2 Select [Format Cells].
3 On the [Format Cells] dialog box, click the [Number] tab.
4 Select [Number] and click [OK].
5 Select [Number] and change the number of decimal places as necessary.
Click
ExampleThe figure shows column D, E, and F are selected (Microsoft Office Excel® 2010)
Click

9.5 Using the PW3360/PW3365 Excel automatic graphing software166
By installing the PW3360/PW3365 Excel automatic graphing software, you can automatically create graphs from recording and measurement data in Excel®.
Installing the software
9.5 Using the PW3360/PW3365 Excel auto-matic graphing software
1 Download the PW3360/PW3365 Excel automatic graphing software from the Hioki website.
2 Install the software on your computer.For more information about how to install and use the software, see [MANU-AL.pdf], which is included in the archive file.
Launch Excel® and automatically create a graph.
1 Click
2 Click

167C
hapter 10 Using C
omm
unications (USB
/LAN
)
10
The PW3365 ships standard with both a USB interface and a LAN interface, allow-ing it to be connected to a computer and to send and receive data.
The PW3360/PW3365 configuration and data downloading software, which is freeware, allows you to do the following remotely from a computer:• Save settings files on an SD memory card or in the instrument’s internal memory• Load settings files from an SD memory card or the instrument’s internal memory• Change instrument settings• Start and stop recording• Download setting files and recording files to a computer
When connected via a LAN, the instrument can be operated remotely from an Internet browser. (p.182)
Using Communications (USB/LAN) Chapter 10
USB or LAN interface
Remote operation
Download recording files and setting files
Remote operation via an Internet browser (LAN only)

10.1 Preparing for USB Communications168
To use USB communications (p.175), you must first install a USB driver.
10.1 Preparing for USB Communications
1 Download the USB driver (for PW3360/PW3365) from the Hioki website.
2 Install the driver on the computer.For more information about how to install the driver, see [README.pdf], which is included in the archive file.
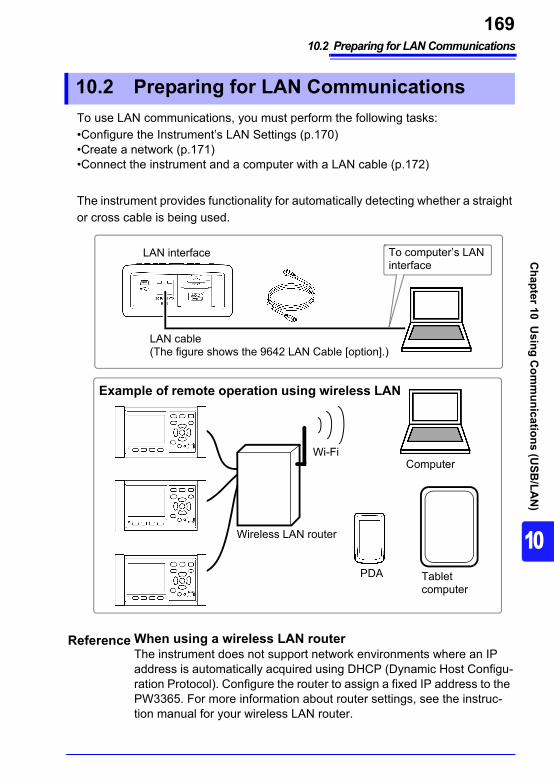
10.2 Preparing for LAN Communications169
Chapter 10 U
sing Com
munications (U
SB/LA
N)
10
To use LAN communications, you must perform the following tasks:•Configure the Instrument’s LAN Settings (p.170)•Create a network (p.171)•Connect the instrument and a computer with a LAN cable (p.172)
The instrument provides functionality for automatically detecting whether a straight or cross cable is being used.
10.2 Preparing for LAN Communications
Reference When using a wireless LAN routerThe instrument does not support network environments where an IP address is automatically acquired using DHCP (Dynamic Host Configu-ration Protocol). Configure the router to assign a fixed IP address to the PW3365. For more information about router settings, see the instruc-tion manual for your wireless LAN router.
LAN interface To computer’s LAN interface
LAN cable(The figure shows the 9642 LAN Cable [option].)
Wireless LAN router
Computer
PDA Tablet computer
Wi-Fi
Example of remote operation using wireless LAN

10.2 Preparing for LAN Communications170
Configure the Instruments LAN Settings
Reference • Make these settings before connecting to a network. Changing set-tings while connected can duplicate IP addresses of other network devices, and incorrect address information may otherwise be pre-sented to the network.
• The instrument does not support DHCP (automatic IP address assignment) on a network.
1Press the key to display the [SET7/7, LAN] screen.
2 Configure the settings as desired.
ReferenceThe MAC address is a hardware-specific address and cannot be changed.
3 Turn on the instrument.
IP Address
Identifies each device connected on a network.Each network device must be set to a unique address.The instrument supports IP version 4, with IP addresses indicated as four decimal octets, e.g., "192.168.0.1".
Subnet Mask
This setting is used to distinguish the address of the net-work from the addresses of individual network devices.The normal value for this setting is the four decimal octets "255.255.255.0".
Default Gateway
When the computer and instrument are on different but overlapping networks (subnets), this IP address specifies the device to serve as the gateway between the networks.If the computer and instrument are connected one-to-one, no gateway is used, and the instrument's default setting "0.0.0.0" can be kept as is.

10.2 Preparing for LAN Communications171
Chapter 10 U
sing Com
munications (U
SB/LA
N)
10
Network environment configuration
IMPORTANT
After configuring the LAN settings, be sure to cycle the instrument’s power. Failure to do so will prevent the settings from taking effect, and you will be unable to use LAN communications functionality.
Example 1. Connecting the instrument to an existing network
To connect to an existing network, the network system administrator (IT department) has to assign settings beforehand.Some network device settings must not be duplicated.Obtain the administrator's assignments for the following items, and write them down.
Example 2. Connecting multiple instruments to a single computer using a hub
When building a local network with no outside connection, the following private IP ad-dresses are recommended.
Configure the network using addresses 192.168.1.0 to 192.168.1.24IP Address : Computer : 192.168.1.1
: PW3365 : assign to each instrument in order 192.168.1.2, 192.168.1.3, 192.168.1.4, ...
Subnet Mask : 255.255.255.0Default Gateway: Computer : ___.___.___.___
: PW3365 : 0.0.0.0
Example 3. Connecting one instrument to a single computer using the 9642 LAN Cable
The 9642 LAN Cable can be used with its supplied connection adapter to connect one instrument to one computer, in which case the IP address is freely settable. Use the recommended private IP addresses.
IP Address : Computer : 192.168.1.1: PW3365 : 192.168.1.2 (Set to a different IP address than the
computer.)Subnet Mask : 255.255.255.0Default Gateway: Computer : ___.___.___.___
: PW3365 : 0.0.0.0
IP Address___.___.___.___Subnet Mask___.___.___.___Default Gateway___.___.___.___

10.2 Preparing for LAN Communications172
Connect the instrument and computer with a LAN cable.The Ethernet interface jack is on the right side.
Connecting the Instrument and Computer with a LAN Cable
To avoid damaging the LAN cable, grasp the connector, not the cable, when unplugging the cable.
LINK LED RX/TX LEDThe RX/TX LED blinks when sending and receiving data, and the LINK LED lights when linked to the destination network device.

10.2 Preparing for LAN Communications173
Chapter 10 U
sing Com
munications (U
SB/LA
N)
10
Preparation items (provide either of the following)
1 Connect the LAN cable to the instrument’s LAN interface.
2 Connect the LAN cable to the hub’s 100Base-TX connector.
When connecting the instrument to an existing network (when connecting the instrument to a hub)
Model 9642 LAN Cable (optional)
A 100Base-TX straight cable (up to 100 m in length, commercially available)If using a 10Base network, a 10Base-T cable can be used.
1
2 Hub

10.2 Preparing for LAN Communications174
Preparation items (provide either of the following)
1 Connect the LAN cable to the instrument’s LAN interface.
2 Connect the LAN cable to the computer’s 100Base-TX connector.
Reference Since the instrument provides functionality for automatically detecting whether a straight or cross cable is being used, a straight cable may also be used. If you are unable to establish communications with the computer, try a cross conversion cable (Model 9642 accessory).
When connecting the instrument directly to a computer(when connecting the instrument to a computer)
Model 9642 LAN Cable (optional)
A 100Base-TX straight or cross cable (up to 100 m in length)
2
1
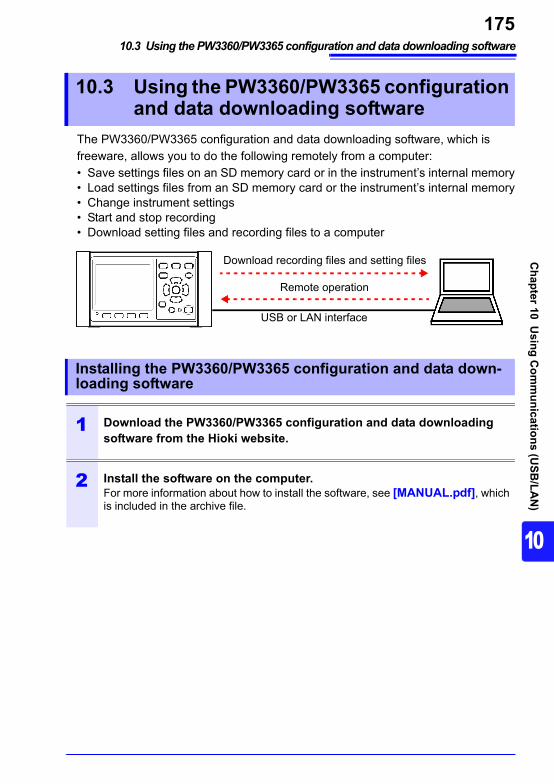
10.3 Using the PW3360/PW3365 configuration and data downloading software175
Chapter 10 U
sing Com
munications (U
SB/LA
N)
10
The PW3360/PW3365 configuration and data downloading software, which is freeware, allows you to do the following remotely from a computer:• Save settings files on an SD memory card or in the instrument’s internal memory• Load settings files from an SD memory card or the instrument’s internal memory• Change instrument settings• Start and stop recording• Download setting files and recording files to a computer
10.3 Using the PW3360/PW3365 configuration and data downloading software
Installing the PW3360/PW3365 configuration and data down-loading software
1 Download the PW3360/PW3365 configuration and data downloading software from the Hioki website.
2 Install the software on the computer.For more information about how to install the software, see [MANUAL.pdf], which is included in the archive file.
USB or LAN interface
Remote operation
Download recording files and setting files

10.3 Using the PW3360/PW3365 configuration and data downloading software176
Using USB Communications
• To avoid equipment failure, do not disconnect the USB cable while communications are in progress.
• Use a common ground for both the instrument and the computer. Use of different ground circuits will result in a potential difference between the instrument’s ground and the computer’s ground. If the USB cable is connected while such a potential difference exists, it may result in equipment malfunction or failure.
1 Turn off the instrument.
2 Connect the instrument and computer with the included USB cable.
3 Turn on the instrument.
4 Launch the PW3360/PW3365 configuration and data downloading soft-ware.
USB cable
1 Click
2 Click

10.3 Using the PW3360/PW3365 configuration and data downloading software177
Chapter 10 U
sing Com
munications (U
SB/LA
N)
10
5 Select the [USB Connect] checkbox and verify that “HIOKI USB Device (COMxx)” is shown in the dialog box.USB communications will be enabled.
For more information about how to use the software, refer to the instruction manual included in the downloaded compressed file.
Click

10.3 Using the PW3360/PW3365 configuration and data downloading software178
*: A ferrite core (segmented core) from Seiwa Electric Mfg. Co., Ltd., is shown in the figure.Model number: E04SR301334
Reference The effects of electromagnetic interference such as noise from an external source may cause communications errors when using a USB connection. If you encounter such errors, attach a commercially avail-able ferrite clamp to the USB cable as shown in the figure below. The effectiveness of the clamp can be increased as follows:• Place the clamp as close to the computer-side connector as possible.• Loop the cable through the clamp several times.
Ferrite core*
Position as close to the computer as possible.
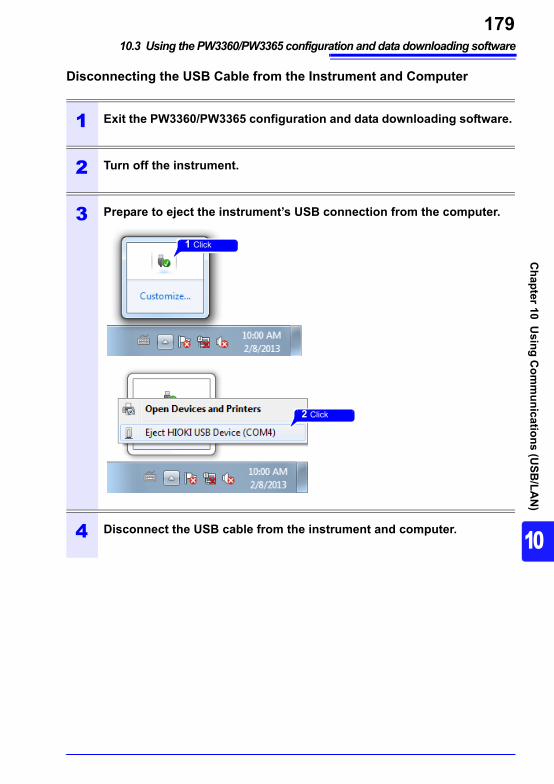
10.3 Using the PW3360/PW3365 configuration and data downloading software179
Chapter 10 U
sing Com
munications (U
SB/LA
N)
10
Disconnecting the USB Cable from the Instrument and Computer
1 Exit the PW3360/PW3365 configuration and data downloading software.
2 Turn off the instrument.
3 Prepare to eject the instrument’s USB connection from the computer.
4 Disconnect the USB cable from the instrument and computer.
1 Click
2 Click

10.3 Using the PW3360/PW3365 configuration and data downloading software180
Using LAN Communications
1 Turn off the instrument.
2 Connect the instrument and computer with a LAN cable.
See: "Connecting the Instrument and Computer with a LAN Cable" (p.172)
3 Turn on the instrument.
4 Launch the PW3360/PW3365 configuration and data downloading soft-ware.
LAN cable
1 Click
2 Click

10.3 Using the PW3360/PW3365 configuration and data downloading software181
Chapter 10 U
sing Com
munications (U
SB/LA
N)
10
Disconnect the LAN from the computer.5 Select the [IP Address] checkbox and choose the model. LAN communications will be enabled.
For more information about how to use the software, refer to the instruction manual included in the downloaded compressed file.
1 Exit the PW3360/PW3365 configuration and data downloading software.
2 Turn off the instrument.
3 Disconnect the LAN cable from the instrument.
1 Click
2 Set
3 Click

10.4 Remote Control of the Instrument by Internet Browser (LAN Communications Only)182
The instrument includes a standard HTTP server function that supports remote control by an internet browser on a computer. The instrument's display screen and control panel keys are emulated in the browser. Operating procedures are the same as on the instrument.
10.4 Remote Control of the Instrument by Inter-net Browser (LAN Communications Only)
Reference • It is recommended to use either Microsoft Internet Explorer version 8 or later.
• Set the browser security level to “Medium” or “Medium-high,” or enable Active Scripting settings.
• Unintended operations may occur if remote control is attempted from multiple computers simultaneously. Use one computer at a time for remote control.
• Remote control can be performed even if the instrument's key lock is active.
Preparing for Remote Operation
1 Launch Internet Explorer.
2 In the address bar, enter “http://” followed by the IP address with which you configured the instrument.For example, enter the address as shown below if the instrument’s IP address is [192.168.1.31]:

10.4 Remote Control of the Instrument by Internet Browser (LAN Communications Only)183
Chapter 10 U
sing Com
munications (U
SB/LA
N)
10
If the HTTP screen is not displayed• Check Internet Explorer’s settings.
• Check the LAN settings.
3 If the main page is displayed as shown below, you have successfully connected to the instrument:
1 On the Internet Explorer settings, click [Tools]-[Internet Options].
2 On the [Advanced] tab, enable [Use HTTP1.1] and disable [Use HTTP1.1 through proxy connections].
3 Under [LAN settings] on the [Connections] tab, disable the [Proxy server] setting.
1 Check the instrument’s LAN settings and the computer’s IP address.See: "Configure the Instruments LAN Settings" (p.170)
2 Verify that the LINK LED on the LAN interface is on and that the Web mark is being shown on the instrument’s screen.See: "Connecting the Instrument and Computer with a LAN Cable" (p.172)
IMPORTANT
After configuring the LAN settings, be sure to cycle the instrument’s power. Failure to do so will prevent the settings from taking effect, and you will be unable to use LAN communications functionality.

10.4 Remote Control of the Instrument by Internet Browser (LAN Communications Only)184
Operating the Instrument Remotely
1 Click [Remote Control Screen].The remote operation page will be displayed.
2 If a password has been set, the following page will be displayed.
Enter the password and click the [SET] button.The screen and control panel being displayed on the instrument will be shown in the browser.(If no password has been set, or if the password has been set to “0000” (the digit ze-ro), this page will not be displayed. The default password is “0000.”)
Click
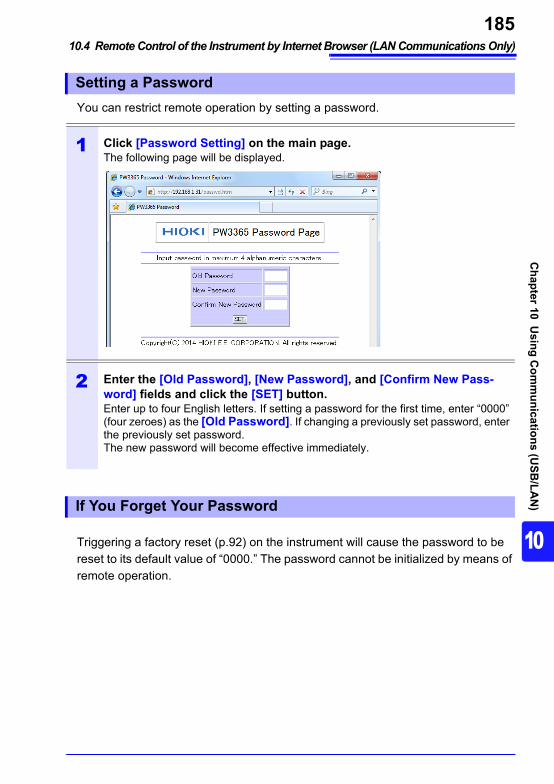
10.4 Remote Control of the Instrument by Internet Browser (LAN Communications Only)185
Chapter 10 U
sing Com
munications (U
SB/LA
N)
10
You can restrict remote operation by setting a password.
Triggering a factory reset (p.92) on the instrument will cause the password to be reset to its default value of “0000.” The password cannot be initialized by means of remote operation.
Setting a Password
1 Click [Password Setting] on the main page. The following page will be displayed.
2 Enter the [Old Password], [New Password], and [Confirm New Pass-word] fields and click the [SET] button.Enter up to four English letters. If setting a password for the first time, enter “0000” (four zeroes) as the [Old Password]. If changing a previously set password, enter the previously set password.The new password will become effective immediately.
If You Forget Your Password

10.4 Remote Control of the Instrument by Internet Browser (LAN Communications Only)186

11.1 General Specifications187
Chapter 11 Specifications
11
Specifications Chapter 11
11.1 General SpecificationsOperating environment Indoors, Pollution degree 2, altitude up to 2,000 m (6562-ft.)
Operating temperature and humidity
0°C to 50°C (32°F to 122°F), 80% RH or less (non-condensation) When operating on battery power, 0°C to 40°C (32°F to 104°F), when charging the battery, 10°C to 40°C (50°F to 104°F)
Storage temperature and humidity
-10°C to 60°C (14°F to 140°F), 80% RH or less (non-condensation)However, the battery’s storage temperature range is -10°C to 30°C (14°F to 86°F).
Power supply
• Z1008 AC Adapter (12 V 1.25 A) Rated supply voltage 100 V AC to 240 V AC (Voltage fluctuations of ±10% from the rated supply voltage are taken into account.) Rated power supply frequency 50 Hz/60 Hz Anticipated transient overvoltage 2500 V
• Model 9459 Battery Pack (Ni-MH 7.2 V DC 2700 mAh)
Charge function Charges the battery regardless of whether the instrument is on or off.Charge time: Max. 6 hr. 10 min. (Reference value at 23°C)
Maximum rated power
• When the Z1008 AC Adapter is used: 45 VA (including AC adapter), 15 VA (PW3365 instrument only)
• When the 9459 Battery Pack is used: 4 VA
Continuous oper-ation time (when using the 9459)
Approx. 5 hr. (Continuous use, backlight off, when using four PW9020 Safety Voltage Sensor)
Backup battery life
Clock and settings (Lithium battery), Approx. 10 years at 23°C
Dimensions
Without PW9002: Approx. 180 mm W × 100 mm H × 48 mm D (Approx. 7.09” W × 3.94” H × 1.89” D) (excluding protrusions)With PW9002: Approx. 180 mm W x 100 mm H x 67.2 mm D (Approx. 7.09” W × 3.94” H × 2.65” D) (excluding protrusions)
Mass Without PW9002: Approx. 540 g (19.0 oz.)With PW9002: Approx. 820 g (28.9 oz.)
Product warranty period 3 years
Applicable standards
Safety EN61010EMC EN61326 Class A, EN61000-3-2, EN61000-3-3
Accessories See: "Accessories" (p.2)
Options See: "Options" (p.3)

11.2 Basic Specifications188
11.2 Basic SpecificationsInput specificationsNumber of channels Voltage: 3 channels, Current: 3 channels
Measurement target
Single-phase 2-wire (1P2W, 1P2W × 2 circuits,1P2W × 3 circuits)Single-phase 3-wire (1P3W, 1P3W1U)Three-phase 3-wire (3P3W2M, 3P3W3M [Y wiring only])Three-phase 4-wire (3P4W)Current only
Measurement target frequency 50 Hz/60 Hz
Input methods Voltage: Insulated Model PW9020 Safety Voltage SensorCurrent: Insulated clamp sensors
Maximum rated voltage between terminals
Voltage input section: 1.7 V AC, 2.4 V peakCurrent input section: 1.7 V AC, 2.4 V peak
Maximum rated voltage to earth
Voltage input section: Depends on Model PW9020(See "PW9020 Safety Voltage Sensor" (p.220)”Maximum rated voltage to earth”)Current input section: Depends on clamp sensor in use.
Measurement specificationsMeasurement method Digital sampling, zero-cross synchronized calculation method
Sampling
10.24 kHz (50 Hz: 10 cycles; 60 Hz: 12 cycles; 2,048 points)Simultaneous sampling of voltage and current; inter-channel multiplexing at 61.44 kHzThird channel during 3P3W2M measurement is calculated using vector computation.
Calculation processing
50 Hz: Continuous, gapless measurement at 10 cycles60 Hz: Continuous, gapless measurement at 12 cycles
A/D converter resolution 16 bit
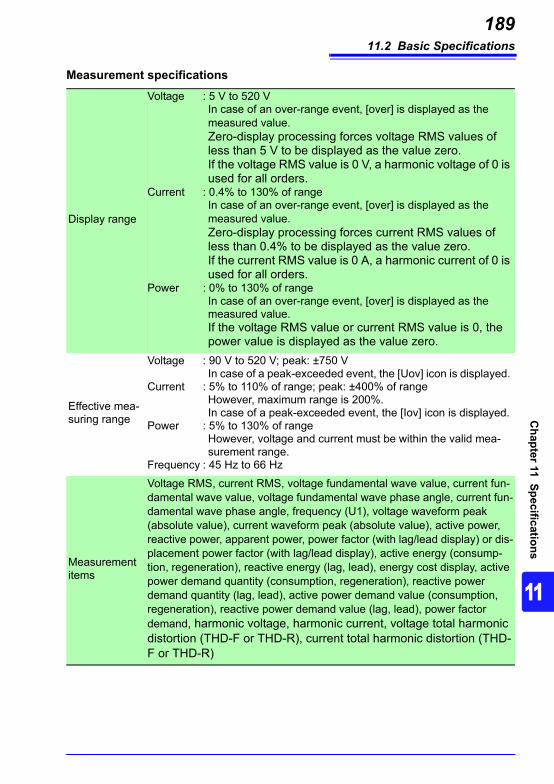
11.2 Basic Specifications189
Chapter 11 Specifications
11
Display range
Voltage : 5 V to 520 V In case of an over-range event, [over] is displayed as the measured value. Zero-display processing forces voltage RMS values of less than 5 V to be displayed as the value zero. If the voltage RMS value is 0 V, a harmonic voltage of 0 is used for all orders.
Current : 0.4% to 130% of range In case of an over-range event, [over] is displayed as the measured value. Zero-display processing forces current RMS values of less than 0.4% to be displayed as the value zero. If the current RMS value is 0 A, a harmonic current of 0 is used for all orders.
Power : 0% to 130% of range In case of an over-range event, [over] is displayed as the measured value. If the voltage RMS value or current RMS value is 0, the power value is displayed as the value zero.
Effective mea-suring range
Voltage : 90 V to 520 V; peak: ±750 V In case of a peak-exceeded event, the [Uov] icon is displayed.
Current : 5% to 110% of range; peak: ±400% of range However, maximum range is 200%. In case of a peak-exceeded event, the [Iov] icon is displayed.
Power : 5% to 130% of range However, voltage and current must be within the valid mea-surement range.
Frequency : 45 Hz to 66 Hz
Measurement items
Voltage RMS, current RMS, voltage fundamental wave value, current fun-damental wave value, voltage fundamental wave phase angle, current fun-damental wave phase angle, frequency (U1), voltage waveform peak (absolute value), current waveform peak (absolute value), active power, reactive power, apparent power, power factor (with lag/lead display) or dis-placement power factor (with lag/lead display), active energy (consump-tion, regeneration), reactive energy (lag, lead), energy cost display, active power demand quantity (consumption, regeneration), reactive power demand quantity (lag, lead), active power demand value (consumption, regeneration), reactive power demand value (lag, lead), power factor demand, harmonic voltage, harmonic current, voltage total harmonic distortion (THD-F or THD-R), current total harmonic distortion (THD-F or THD-R)
Measurement specifications

11.2 Basic Specifications190
Display range, effective measurement range, effective peak range chart (representative example: Model 9661 Clamp on Sensor)
Item RangeDisplay range
Effective measurement range
Display range
Effective peak
Lower limit Lower limit Upper limit Upper limit Range
Voltage 400 V single range
5.0 V 90.0 V 520.0 V 520.0 V ±750 V peak
Current(Model 9661)
5 A range 0.0200 A 0.2500 A 5.5000 A 6.5000 A ±20 A peak10 A range 0.040 A 0.500 A 11.000 A 13.000 A ±40 A peak50 A range 0.200 A 2.500 A 55.000 A 65.000 A ±200 A peak100 A range 0.40 A 5.00 A 110.00 A 130.00 A ±400 A peak500 A range 2.00 A 25.00 A 550.00 A 650.00 A ±1000 A peak
Display specifications
Display update rate
Approx. 0.5 s (excluding during SD memory card or internal memory access and LAN and USB communications) However, approx. 1.0 s for energy-related data.
Display 320 x 240 dots, 3.5" TFT color LCD
Language Japanese/ English/ Chinese (simple)/ German/ Italian/ French/ Spanish/ Turkish
BacklightLED backlightAUTO OFF (2 minutes)/ONThe POWER LED flashes during auto-off operation.

11.2 Basic Specifications191
Chapter 11 Specifications
11
Conditions of guaranteed accuracyConditions of guaranteed accuracy
Warm-up time of at least 30 minutes, sine wave input, frequency 50 Hz/60 Hz, conductor-to-ground voltage of 400 V or less
Temperature and humidity for guaranteed accuracy
23°C ± 5°C (73°F ± 9°F), 80% RH or less(applies to all specifications unless otherwise noted)
Display range of guaranteed accuracy
Effective measuring range
Guaranteed accuracy period
1 year
Other conditionsClock function Auto-calendar, leap-year correcting, 24-hour clock
Real-time clock accuracy
Within ±0.3 s per a day (power on, within operating temperature and humidity range)
Temperature characteristic Within ±0.1% f.s./°C (other than at 23°C ± 5°C)
Effect of exter-nal magnetic field interfer-ence
Within ±1.5% f.s. (in a magnetic field of 400 A/m AC, 50 Hz/60 Hz)
Effects of a radiated, radio-frequency, electromag-netic field
Voltage and active power within ±5% f.s. at 10 V/m
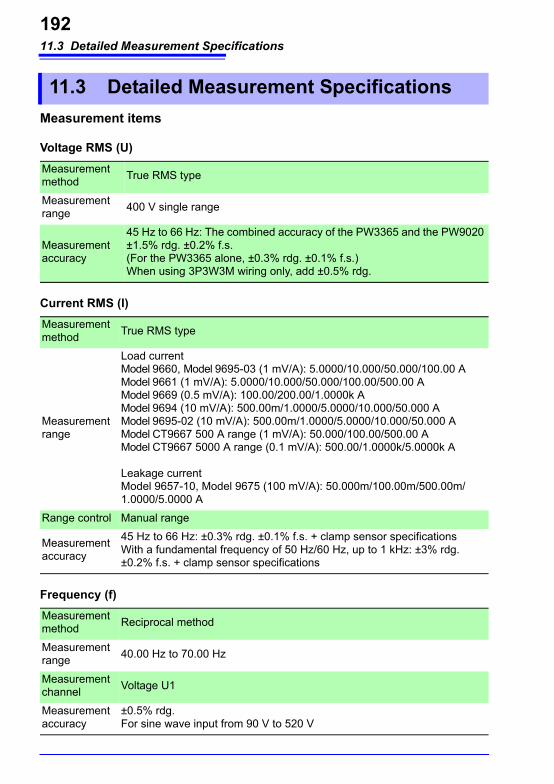
11.3 Detailed Measurement Specifications192
Measurement items
11.3 Detailed Measurement Specifications
Voltage RMS (U)Measurement method True RMS type
Measurement range 400 V single range
Measurement accuracy
45 Hz to 66 Hz: The combined accuracy of the PW3365 and the PW9020 ±1.5% rdg. ±0.2% f.s. (For the PW3365 alone, ±0.3% rdg. ±0.1% f.s.)When using 3P3W3M wiring only, add ±0.5% rdg.
Current RMS (I)Measurement method True RMS type
Measurement range
Load currentModel 9660, Model 9695-03 (1 mV/A): 5.0000/10.000/50.000/100.00 AModel 9661 (1 mV/A): 5.0000/10.000/50.000/100.00/500.00 AModel 9669 (0.5 mV/A): 100.00/200.00/1.0000k AModel 9694 (10 mV/A): 500.00m/1.0000/5.0000/10.000/50.000 AModel 9695-02 (10 mV/A): 500.00m/1.0000/5.0000/10.000/50.000 AModel CT9667 500 A range (1 mV/A): 50.000/100.00/500.00 AModel CT9667 5000 A range (0.1 mV/A): 500.00/1.0000k/5.0000k A
Leakage currentModel 9657-10, Model 9675 (100 mV/A): 50.000m/100.00m/500.00m/1.0000/5.0000 A
Range control Manual range
Measurement accuracy
45 Hz to 66 Hz: ±0.3% rdg. ±0.1% f.s. + clamp sensor specificationsWith a fundamental frequency of 50 Hz/60 Hz, up to 1 kHz: ±3% rdg. ±0.2% f.s. + clamp sensor specifications
Frequency (f)Measurement method Reciprocal method
Measurement range 40.00 Hz to 70.00 Hz
Measurement channel Voltage U1
Measurement accuracy
±0.5% rdg.For sine wave input from 90 V to 520 V

11.3 Detailed Measurement Specifications193
Chapter 11 Specifications
11
Voltage waveform peak (Upeak), Current waveform peak (Ipeak)Measurement method
Peak value (absolute value) for each calculation interval (10 cycles at 50 Hz or 12 cycles at 60 Hz)
Measurement accuracy Accuracy not defined.
Active power (P)
Measurement method
Calculated using voltage and current waveform sampling data.See: Calculation Formulas:"Active power" (p.208)
Measurement range
Combination of voltage × current rangeSee: "11.6 Range Configuration and Accuracy by Clamp Sensor" (p.217)
Measurement accuracy
45 Hz to 66 Hz: The combined accuracy of the PW3365, PW9020, and clamp sensors ±2.0% rdg. ±0.3% f.s. + clamp sensor specifications.(power factor=1)[For the PW3365 alone, ±0.6% rdg. ±0.2% f.s.(power factor=1)]
Phase effects
The combined phase accuracy of the PW3365 and PW9020 is equivalent to ±1.3°.(The phase accuracy for the PW3365 alone is equivalent to ±0.3°.)(In both cases, 50 Hz/60 Hz and f.s. input are assumed.)
Polarity indication
Consumption: UnsignedRegeneration: Negative
Reactive power (Q, PF/Q/S calculation selection: RMS calculations)
Measurement method
Calculated from apparent power and active power.See: Calculation Formulas:"Reactive power" (p.209)
Measurement range
Combination of voltage range × current rangeSee: "11.6 Range Configuration and Accuracy by Clamp Sensor" (p.217)
Measurement accuracy ±1 dgt. relative to calculations from measured values
Lag/Lead display
Uses the sign of reactive power Q (fundamental wave reactive power).Positive : LagNegative : Lead
Output data
For SD memory card and internal memory output data, the polarity indi-cates lag/lead.Lag : PositiveLead : Negative

11.3 Detailed Measurement Specifications194
Reactive power (Q, PF/Q/S calculation selection: fundamental calculations)This reactive power Q is defined as the fundamental wave reactive power.
Measurement method
Calculated from fundamental wave voltage and current.See: Calculation formulas:"Reactive power" (p.209)
Measurement range
Combination of voltage range × current rangeSee: "11.6 Range Configuration and Accuracy by Clamp Sensor" (p.217)
Measurement accuracy
With a fundamental wave frequency of 45 Hz to 66 Hz: The combined accuracy of the PW3365, PW9020, and clamp sensors2.0% rdg. 0.3% f.s. + clamp sensor specifications. (reactive factor=1)[For the PW3365 alone ±0.6% rdg.±0.2% f.s. (reactive factor=1)]
Phase effects
The combined phase accuracy of the PW3365 and PW9020 is equivalent to ±1.3°.(The phase accuracy for the PW3365 alone is equivalent to ±0.3°.)(In both cases, 50 Hz/60 Hz and f.s. input are assumed.)
Lag/Lead display
Positive : LagNegative : Lead
Output data
For SD memory card and internal memory output data, the polarity indi-cates lag/lead.Lag : PositiveLead : Negative
Apparent power (S, PF/Q/S calculation selection: RMS calculations)
Measurement method
Calculated from the voltage RMS and current RMS values.See: Calculation formulas:"Apparent power" (p.210)
Measurement range
Combination of voltage × current rangeSee: "11.6 Range Configuration and Accuracy by Clamp Sensor" (p.217)
Measurement accuracy ±1 dgt. relative to calculations from measured values.
Apparent power (S, PF/Q/S calculation selection: fundamental calculations)This apparent power S is defined as the fundamental wave apparent power.
Measurement method
Calculated from the fundamental wave active power and the fundamental wave reactive power. See: Calculation formulas:"Apparent power" (p.210)
Measurement range
Combination of voltage × current rangeSee: "11.6 Range Configuration and Accuracy by Clamp Sensor" (p.217)
Measurement accuracy ±1 dgt. relative to calculations from measured values.
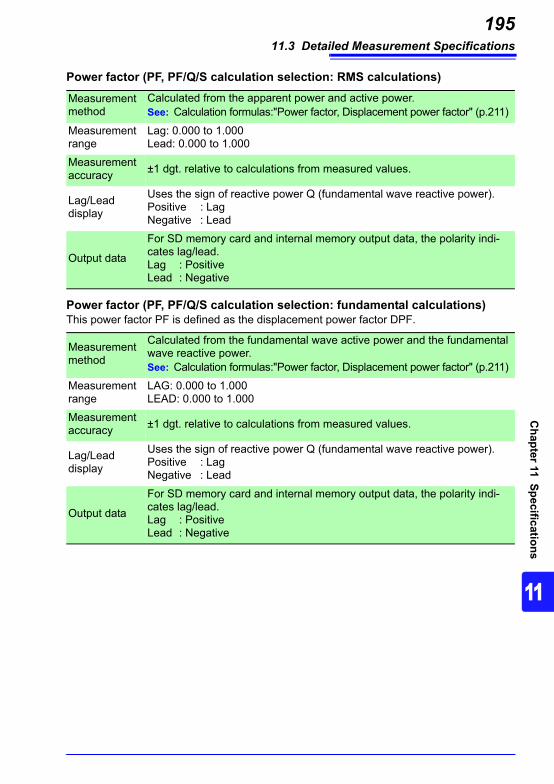
11.3 Detailed Measurement Specifications195
Chapter 11 Specifications
11
Power factor (PF, PF/Q/S calculation selection: RMS calculations)
Measurement method
Calculated from the apparent power and active power. See: Calculation formulas:"Power factor, Displacement power factor" (p.211)
Measurement range
Lag: 0.000 to 1.000Lead: 0.000 to 1.000
Measurement accuracy ±1 dgt. relative to calculations from measured values.
Lag/Lead display
Uses the sign of reactive power Q (fundamental wave reactive power).Positive : LagNegative : Lead
Output data
For SD memory card and internal memory output data, the polarity indi-cates lag/lead.Lag : PositiveLead : Negative
Power factor (PF, PF/Q/S calculation selection: fundamental calculations)This power factor PF is defined as the displacement power factor DPF.
Measurement method
Calculated from the fundamental wave active power and the fundamental wave reactive power.See: Calculation formulas:"Power factor, Displacement power factor" (p.211)
Measurement range
LAG: 0.000 to 1.000LEAD: 0.000 to 1.000
Measurement accuracy ±1 dgt. relative to calculations from measured values.
Lag/Lead display
Uses the sign of reactive power Q (fundamental wave reactive power).Positive : LagNegative : Lead
Output data
For SD memory card and internal memory output data, the polarity indi-cates lag/lead.Lag : PositiveLead : Negative

11.3 Detailed Measurement Specifications196
Active energy (WP), Reactive energy (WQ)
Measurement method
Active power values are integrated separately for consumption and regen-eration from the start of recording. Reactive power values are integrated separately for lag and lead from the start of recording.See: Calculation formulas:"Electric energy, Energy cost" (p.213)
Measurement range
• Active energy Consumption WP+ : 0.00000 mWh to 99999.9 GWh Regeneration WP- : -0.00000 mWh to -99999.9 GWh
• Reactive energy Lag WQ_LAG : 0.00000 mvarh to 99999.9 Gvarh Lead WQ_LEAD : -0.00000 mvarh to -99999.9 Gvarh
Measurement accuracy Active power and reactive power measurement accuracy ±1 dgt.
Integration time accuracy ±10ppm±1 sec.
Energy cost (E_cost)
Measurement method
The active energy (consumption) WP+ is multiplied by the unit cost (per kWh).See: Calculation formulas:"Electric energy, Energy cost" (p.213)
Measurement accuracy ±1 dgt. relative to calculations from measured values.
Active power demand quantity (WPdem), Reactive power demand quantity (WQdem) (Data is output during recording but is not displayed by the instrument.)
Measurement method
Active power consumption and regeneration obtained during each interval time are integrated separately.Reactive power lag and lead obtained during each interval time are inte-grated separately.See: Calculation formulas:"Demand quantity (output data only; not dis-
played)" (p.214)
Measurement items
• Active power demand quantity Consumption WPdem + Regeneration WPdem -
• Reactive power demand quantity Lag WQdem_LAG Lead WQdem_LEAD
Measurement accuracy Active power and reactive power measurement accuracy ±1 dgt.
Integration time accuracy ±10ppm ±1 sec.

11.3 Detailed Measurement Specifications197
Chapter 11 Specifications
11
Active power demand Value (Pdem), Reactive power demand quantity (Qdem)
Measurement method
Separate average values are calculated for active power consumption and regeneration during the interval time.Separate average values are calculated for reactive power lag and lead during the interval time. See: Calculation formulas:"Demand value" (p.215)
Measurement items
• Active power demand value Consumption Pdem + Regeneration Pdem -
• Reactive power demand value Lag Qdem_LAG Lead Qdem_LEAD
Measurement accuracy Active power and reactive power measurement accuracy ±1 dgt.
Power factor demand value (PFdem)
Measurement method
Calculated from the active power demand value Pdem and the reactive power demand value Qdem.See: Calculation formulas:"Demand value" (p.215)
Measurement accuracy ±1 dgt. relative to calculations from measured values.
Harmonics
Standard Complies with IEC 61000-4-7:2002, except without intermediate har-monics.
Window width 50 Hz: 10 cycles (with interpolation)60 Hz: 12 cycles (with interpolation)
Number of orders ana-lyzed
Up to 13th
Analysis parameters
Harmonics level: Harmonic level for each order for voltage, currentWhen using 3P3W2M wiring, the U12 and I12 values calculated for the third channel are not displayed.Harmonics content percentage: Harmonic content percentage for each order for voltage, currentSee: "Harmonic voltage, and current" (p.215)Total harmonic distortion: voltage and current (THD-F or THD-R)See: "Total harmonic distortion" (p.216)
Measurement range
Level: Same as the effective measuring rangeContent percentage, total harmonic distortion: 0.00% to 500.00%

11.3 Detailed Measurement Specifications198
Measure-ment accu-racy
• Harmonics levelVoltagePW3365 alone: ±5% rdg.±0.2% f.s.Combination accuracy with PW3365: ±30% rdg.±3% f.s. Input of each order is limited to 5% of the fundamental wave; however, THD-F is limited to 10%.CurrentAdd the sensor accuracy to ±5% rdg.±0.2%f.s.
• Total harmonic distortion rate No accuracy defined.
Harmonics

11.4 Functional Specifications199
Chapter 11 Specifications
11
11.4 Functional SpecificationsScreen display
Measurement
List (voltage, current, frequency, active/apparent/reactive power, power factor, integral energy, elapsed time)Voltage and current details (RMS value, fundamental wave value, wave-form peak, phase angle)Power (active/reactive/apparent power and power factor by channel and as total)Energy (active energy, reactive energy, start time, planned stop time, elapsed time, energy cost)Demand (active power demand value, reactive power demand value, power factor demand value)Waveforms (display of all channels by voltage and current with user-selectable zoom factor)Enlarged views (selection of four parameters for enlarged views)Trend (Selection of one measurement parameter for a time-series display of maximum, minimum, and average values)Harmonics (voltage and current levels, content percentage graph, and list)
Wiring Wiring diagram, Wiring check (wiring confirmation)
Setting Various settings
File SD memory card and internal memory operations
Quick SetProvides information about procedures associated with measurement set-tings, wiring types, wiring check (wiring confirmation), recording settings, and recording initiation.

11.4 Functional Specifications200
Measurement screen
List
Voltage RMS value U, current RMS value I, frequency f, total active power P, total reactive power Q and apparent power S, power factor PF or dis-placement power factor DPF, active energy (consumption) WP+, elapsed time TIMEWhen using 1P2W wiring, the instrument can be switched between two and three circuits.
U/I
Voltage RMS value U, voltage fundamental wave value Ufnd, voltage waveform peak Upeak, voltage fundamental wave phase angle Udeg, cur-rent RMS value I, current fundamental wave value Ifnd, current waveform peak IPeak, current fundamental wave phase angle Ideg When using 3P3W3M wiring, the line-to-line voltage RMS value is dis-played as U, and the conductor-to-ground voltage (phase voltage) funda-mental wave value, waveform peak, and fundamental wave phase angle are displayed as Ufnd, Upeak, and Udeg.
Power Per-channel and total active power P, apparent power S, reactive power Q, power factor PF or displacement power factor DPF
Integ.
Active energy (consumption WP+, regeneration WP-), reactive energy (lag WQ+, lead WQ-), recording start time, recording stop time, elapsed time, energy costWhen using 1P2W wiring, the instrument can be switched between two and three circuits.
Demand
Can be switched to active power demand value (consumption Pdem+, regeneration Pdem-), reactive power demand value (lag QdemLAG, lead QdemLEAD), or power factor demand value (PFdem).When the active demand value (consumption Pdem+) is selected, the maximum active demand value MAX_DEM since the start of recording and the time and date at which it occurred is displayed (but not saved).
Harmonic Graph (voltage and current levels, content percentage)List (voltage and current levels, content percentage)
Waveform
Displays voltage and current waveforms, voltage and current RMS values, and frequency. The vertical axis zoom factor can be set.When using 3P3W3M wiring, the conductor-to-ground (phase voltage) waveform is displayed.
Zoom Enlarged view of 4 user-selected parameters
Trend
Select and display one measurement parameter, except demand and harmonic (other than THD) parameters.Displays maximum, average, and minimum values and allows cursor mea-surement.

11.4 Functional Specifications201
Chapter 11 Specifications
11
Maximum/minimum/average value processing methods
Measurement parameter
Average value Maximum value Minimum value
Blank: Arithmetic mean Blank: Simple max. value
Blank: Simple min. value
Voltage RMS value U
Current RMS value I
Frequency fVoltage wave-form peak Upeak
No average valueCurrent wave-form peak Ipeak
Active power P Simple maximum and minimum with polarity
Apparent power S
Reactive power Q Signed simple average
Lag (positive data polarity)/Lead (nega-tive data polarity); simple maximum and minimum
Power factor PF Calculated from Pavg and Savg.
Maximum and minimum absolute valueSigned data based on Lag (positive)/Lead (negative)
Displacement power factor DPF Calculated from
P(1)avg and S(1)avg.
Maximum and minimum absolute valueSigned data based on Lag (positive)/Lead (negative)
Harmonic level
Harmonic content per-centage
Nth harmonic average value / fundamental wave average value × 100%
Total harmonic distortion rate
Calculated from Nth harmonic average value
Wiring diagram screenWiring diagram screen
Displays a leak wiring diagram and measured values for single-phase/2-wire (1P2W), single-phase/3-wire (1P3W, 1P3W1U), 3-phase/3-wire (3P3W2M, 3P3W3M), and 3-phase/4-wire (3P4W) connections.
Wiring check screen
Displays measured values (voltage and current RMS values, voltage and current phase angles, active power, and displacement power factor), vec-tor diagrams, and wiring confirmation results.
Settings Allows the wiring type, clamp sensor, and range to be changed.

11.4 Functional Specifications202
Wiring confir-mation (Wiring Check) content
Voltage input, current input, voltage phase, current phase (3-phase only), phase difference, and power factor (CHECK mark displayed if the power factor is 0.5 or less)Displays information about reviewing items for the wiring confirmation result.
Wiring diagram screen
Setting screen
Wiring
1P2W/1P2W×2/1P2W×3/ 1P3W/1P3W+I/1P3W1U/1P3W1U+I/ 3P3W2M/3P3W2M+I/3P3W3M/3P4W/ Current only (I)/Current only (I×2)/Current only (I×3)
Frequency50Hz/60HzIf there is voltage input and the frequency setting is wrong, displays an error and changes the frequency setting.
Clamp sensorLoad current: 9660/9661/9669/9694/9695-02/9695-03/ CT9667(500A)/CT9667(5000A)/Leakage current: 9657-10/9675
Current range
Load current9660, 9695-03 (1 mV/A): 5.0000/10.000/50.000/100.00 A9661 (1 mV/A): 5.0000/10.000/50.000/100.00/500.00 A9669 (0.5 mV/A): 100.00/200.00/1.0000k A9694 (10 mV/A): 500.00m/1.0000/5.0000/10.000/50.000 A9695-02 (10 mV/A): 500.00m/1.0000/5.0000/10.000/50.000 ACT9667 500A range (1 mV/A): 50.000/100.00/500.00 ACT9667 5000A range (0.1 mV/A): 500.00/1.0000k/5.0000k ALeakage current9657-10,9675 (100 mV/A): 50.000m/100.00m/500.00m/1.0000/5.0000 A
CT ratio User-specified: 0.01 to 9999.99Selected: 1/40/60/80/120/160/200/240/300/400/600/800/1200
Voltage range 400 V fixed
VT (PT) ratio User-specified: 0.01 to 9999.99Selected: 1/60/100/200/300/600/700/1000/2000/2500/5000)
PF/Q/S calculation selection
RMS calculation / fundamental wave calculation
Energy cost UnitCost: 0.00000 to 99999.9/kWhCURRENCY: 3 user-specified alphanumeric characters
Remaining save time
Calculated and displayed based on the amount of space remaining on the SD memory card or in the internal memory, the save interval, and the save items. Also updated during time-series measurement.
Save destination SD memory card / internal memory (capacity: approx. 320KB)
Save interval time 1/2/5/10/15/30 sec./1/2/5/10/15/20/30/60 min.

11.4 Functional Specifications203
Chapter 11 Specifications
11
Save items AVG only (no Harmonic)/ ALL data (no Harmonic) / AVG only (w/Harmonic)/ ALL data (w/Harmonic)
Screen copyON/OFF (Saves the displayed screen as a BMP at a fixed interval.)The minimum interval time for saving screen copies is 5 min.If the setting is less than 5 min., screen copies will be saved every 5 min.
Waveform save
ON/OFF (Saves waveform data for each time interval in a binary format.)The shortest time interval for saving waveform data is 1 min.When set to a value less than 1 min., waveform data will be saved every minute.
Folder/ file name AUTO / MANUAL (5 characters)
Recording start method
INTERVAL / MANUAL / TIME (YYYY-MM-DD hh:mm) / REPEATDuring repeat recording, integration is performed for the specified time period only, and the data is saved.
Recording stop method
MANUAL / TIME (YYYY-MM-DD hh:mm)/ TIMER (0000:00:00) The maximum recording and measurement time is up to one year.The timer can be set to any value from 1 sec. to 1,000 hr.
Quick Set at power-on
ON/OFFIf ON, confirms whether to launch the Quick Set when the instrument is turned on.
Instrument Information Displays the serial number and the software and FPGA versions.
Clock Sets the date and time (using the Western calendar and 24-hour time).
Backlight
AUTO OFF (2 minutes)/ONAUTO OFF automatically turns off the backlight two minutes after the last key operation. After AUTO OFF operation, the backlight turns back on when any key is operated (including when the key lock is engaged).
Screen color Screen color can be selected (color 1 / color 2 / color 3).
Beep sound ON/OFF
Language Japanese/ English/ Chinese/ German/ Italian/ French/ Spanish/ Turkish
Phase name R S T/A B C/L1 L2 L3/U V W
System resetA system reset causes the instrument settings to be reset to their default values. However, the time, language, frequency, IP address, subnet mask, and default gateway are not reset.
LAN setting
IP address: 3 characters.3 characters.3 characters.3 characters (***.***.***.***)Subnet mask: 3 characters.3 characters.3 characters.3 characters (***.***.***.***)Default gateway: 3 characters.3 characters.3 characters.3 characters (***.***.***.***)MAC address: Written at time of shipment from factory.
Setting screen

11.4 Functional Specifications204
File screenSD memory card Mass storage, loading settings, deleting folders/files, formatting, upgrades
Internal memory
Copying data from internal memory to the SD memory card, loading set-tings, deleting files, formatting
Quick Set screensDescription Page/item Quick Set contentQuick Set confirma-tion
Confirmation of whether to initialize related measurement and recording set-tings
Basic settings
Wirings 1P2W / 1P3W / 3P3W2M / 3P3W3M / 3P4W* (selection)
Frequency
No display(The frequency setting is not reset when the Quick Set is started.)Display an error if the frequency is wrong and change the fre-quency.
VT ratio No display (fixed to 1)
Clamp sensor9660(100A)/9661(500A)*/9669(1000A)/ 9694(5A)/9695-02(50A)/9695-03(100A)/ CT9667(500A)/CT9667(5000A)
CT ratio No display (fixed to 1)PF/Q/S calcu-lation selection No display (RMS calculation)
THD calcula-tion No display (THD-F)
Save destina-tion
SD memory card (disabled)Save to internal memory if no SD memory card has been inserted.
Clock setting Clock setting
Wirings
Wirings
Connect the PW9020 sensors and clamp sensors to the instrument.The proper way to clamp the PW9020 is shown graphically.Make voltage wirings.Check voltage input, phase, and frequency values.If the frequency is wrong, display a window and ask the user whether to change the frequency setting.Make current wirings.Set the current range.
Wiring checkCheck the current wiring.(Current input, current phase, phase difference CH1/CH2/CH3, phase factor (DPF))

11.4 Functional Specifications205
Chapter 11 Specifications
11
* Default value
Recording settings
Save interval 1/2/5/10/15/30 sec., 1/2/5*/10/15/20/30/60 min.Display the available save time.
Save items
• AVG only (no Harmonic)*/ ALL data (no Harmonic) / AVG only (w/Harmonic)/ ALL data (w/Harmonic)
• No screen saving (no display)• No waveform saving (no display)
Recording start method
INTERVAL* / MANUAL / TIME / REPEATRepeat setting: Repeat time range fixed from 00:00 to 24:00 (no display) and folder segmentation fixed to off (no dis-play)
Recording stop method MANUAL* / TIME / TIMER
Folder/file name AUTO* / MANUAL
Recording start
Recording start confirmation
Display the remaining save time and check start of recording.
Card insertion Insert an SD memory card (skip information if already inserted).
Standby Report standby status.
Quick Set screensDescription Page/item Quick Set content

11.4 Functional Specifications206
External interface specificationsSD memory card interface
Slot SD standard compliant x 1
Compatible card
SD memory card/ SDHC memory card (Use only HIOKI-approved SD memory card)
Format SD memory card format
Supported memory capacity
SD memory card: up to 2GB/ SDHC memory card: up to 32GB
Saved data Settings data, measurement data, screen data, and waveform data
LAN interface
Connector RJ-45 connector x 1
Electrical spec-ifications IEEE802.3 compliant
Transmission method 10BASE-T/100BASE-TX
Protocol TCP/IP
FunctionsHTTP server functionCapture of settings and measurement data and data downloading with a communications application
USB interface
Connector Mini-B receptacle
Method USB Ver.2.0 (full speed, high speed)Mass storage class, virtual COM (CDC)
Connection destination Computer
Supported operating sys-tems
WindowsXP/ WindowsVista (32bit)/ Windows7 (32/64bit) / Window8 (32/64bit) / Window10 (32/64bit)With latest service packs applied
Functions
When connected to a computer, the SD memory card and internal memory are recognized as removable disks.Capture of settings and measurement data and downloading of measure-ment data using a communications application

11.4 Functional Specifications207
Chapter 11 Specifications
11
Other functionality
Display holdHolds displayed values but not the clock.Measurement continues internally, and readings are applied to maximum, minimum, and average values after the hold is canceled.
Key lock function
Disables all key operation, except the power switch. Turned ON and OFF by pressing and holding the ESC key for at least 3 seconds.
Power supply display AC adapter/battery
Remaining battery display
Displays the remaining battery life (in four stages).
Warning displays
• Over-range: Displays over-range (over). Calculation results are used as-is internally.
• Peak over: Displays a warning. (“Uov”, or “Iov” is displayed)
• Frequency error: When the measurement frequency differs from the set frequency (50 Hz/60 Hz), displays an error message and changes the frequency setting.
Self-check function
Checks operation when the instrument is powered on and displays a mes-sage.

11.5 Calculation Formulas208
* Subscript c: measurement channel; M: number of sample points; s: sample point number
* Subscript c: measurement channel; M: number of sample points; s: sample point number
11.5 Calculation Formulas
Voltage and current RMS values
Wiring setting
Item
Single-phase2 wire
Single-phase3 wire
Three-phase3 wire
Three-phase4 wire
1P2W 1P3W 1P3W1U 3P3W2M 3P3W3M 3P4W
Voltage U [Vrms]
U1U1U2
U1
U1U2U12
(U12s=U1s-U2s)
U1 (U1s=u1s-u2s)U2 (U2s=u2s-u3s)U3 (U3s=u3s-u1s)
U1U2U3
Uc=
• For 3P3W2M connections, it is assumed that U1s - U2s - U12s = 0.• For 3P3W3M connections, the conductor-to-ground voltage (phase volt-
age) u is measured and converted to the line-to-line voltage by means of a calculation.
CurrentI [Arms]
I1I1I2
I1I2I12
(I12s= -I1s-I2s)
I1I2I3
I1I2I3
Ic=
• For 3P3W2M, it is assumed that I1s + I2s + I12s = 0.
Active power
Wiring setting
Item
Single-phase2 wire
Single-phase3 wire
Three-phase3 wire
Three-phase4 wire
1P2W 1P3W 1P3W1U 3P3W2M 3P3W3M 3P4W
Active powerP [W]
P1 P1P2
P1
P2=P1P2
P1P2P3Pc=
P=P1+P2 P=P1+P2+P3
• The active power P polarity symbols indicate the direction of current flow as either consumption (+P) or regeneration (-P).
1M----- Ucs( )2
S 0=
M 1–
∑
1M----- Ics( )2
S 0=
M 1–
∑
1M----- U1s– I2s×( )
s 0=
M 1–
∑1M----- Ucs Ics×( )
s 0=
M 1–
∑

11.5 Calculation Formulas209
Chapter 11 Specifications
11
* Subscript c: measurement channel, (1): Harmonic calculation fundamental wave (1st or-der), r: resistance after FFT; i: reactance after FFT
Reactive power
Wiring setting
Item
Single-phase2 wire
Single-phase3 wire
Three-phase3 wire
Three-phase4 wire
1P2W 1P3W 1P3W1U 3P3W2M 3P3W3M 3P4W
Reactive power Q [var]
Q1Q1Q2
Q1Q2Q3
PF/Q/S (RMS calculation)Qc=si Q=si
• When S < |P| due to the effects of measurement error, unbalance, or other factors, S = |P| and Q = 0.
• The component si indicates lag and lead. The sign of reactive power Q (funda-mental wave reactive power) is used. Positive sign: Lag [Display indicates LAG, and output data is positive.] Negative sign: Lead [Display indicates LEAD, and output data is negative.]
Q1Q1Q2
Q1Q2
=U1(1)r×I2(1)i-U1(1)i×I2(1)r
Q1Q2
Q1Q2Q3
PF/Q/S (fundamental wave calculation)
Qc=-Uc(1)r×Ic(1)i+Uc(1)i×Ic(1)r
Q = Q1+Q2 Q = Q1+Q2+Q3
• This reactive power Q is defined as the fundamental wave reactive power. • Positive sign: Lag [Display indicates LAG, and output data is positive.]
Negative sign: Lead [Display indicates LEAD, and output data is negative.]
Sc2 Pc
2–S2 P2–

11.5 Calculation Formulas210
* Subscript c: measurement channel, (1): Harmonic calculation fundamental wave (1st or-der)
Apparent power
Wiring setting
Item
Single-phase2 wire
Single-phase3 wire
Three-phase3 wire
Three-phase4 wire
1P2W 1P3W 1P3W1U 3P3W2M 3P3W3M 3P4W
Apparent power S [VA]
S1S1S2
S1S2= U1×I2
S1S2S3
S1= u1×I1S2= u2×I2S3= u3×I3
S1S2S3
PF/Q/S (RMS calculation)
Sc=Uc×Ic
S=S1+S2S= S=
S=S1+S2+S3
• The phase voltage is used to calculate S1, S2, and S3 for 3P3W3M connec-tions. The line-to-line voltage is used to calculate total S.
S1S1S2
S1S2S3
PF/Q/S (funda-mental wave calculation)
Sc= S=
• This reactive power S is defined as the fundamental wave reactive power.
33
------- S1 S2 S3+ +( ) 33
------- U1I1 U2I2 U3I3+ +( )
Pc 1( )2 Qc 1( )
2+
P 1( )2 Q 1( )
2+

11.5 Calculation Formulas211
Chapter 11 Specifications
11
* Subscript c: measurement channel, (1): Harmonic calculation fundamental wave (1st or-der)
Power factor, Displacement power factor
Wiring setting
Item
Single-phase2 wire
Single-phase3 wire
Three-phase3 wire
Three-phase4 wire
1P2W 1P3W 1P3W1U 3P3W2M 3P3W3M 3P4W
Power factor PF
PF/Q/S(RMS calculation)
PF1PF1PF2
PF1PF2PF3
PFc=si PF= si
• The component si indicates lag and lead. The sign of reactive power Q (fundamental wave reactive power) is used. Positive sign: Lag [Display indicates LAG, and output data is pos-itive.] Negative sign: Lead [Display indicates LEAD, and output data is negative.]
• When S < |P| due to the effects of measurement error, unbalance, or other factors, S = |P| and PF = 1.
• When S = 0, PF = over.
Displacement power factorDPF
PF/Q/S(fundamental wave calculation)
DPF1DPF1DPF2
DPF1DPF2DPF3
DPFc= si DPF= si
• The component si indicates lag and lead. The sign of reactive power Q (fundamental wave reactive power) is used. Positive sign: Lag [Display indicates LAG, and output data is pos-itive.] Negative sign: Lead [Display indicates LEAD, and output data is negative.]
• When Sc(1) = 0, DPF = over.
PcSc----- P
S---
Pc 1( )Sc 1( )------------
P 1( )S 1( )----------
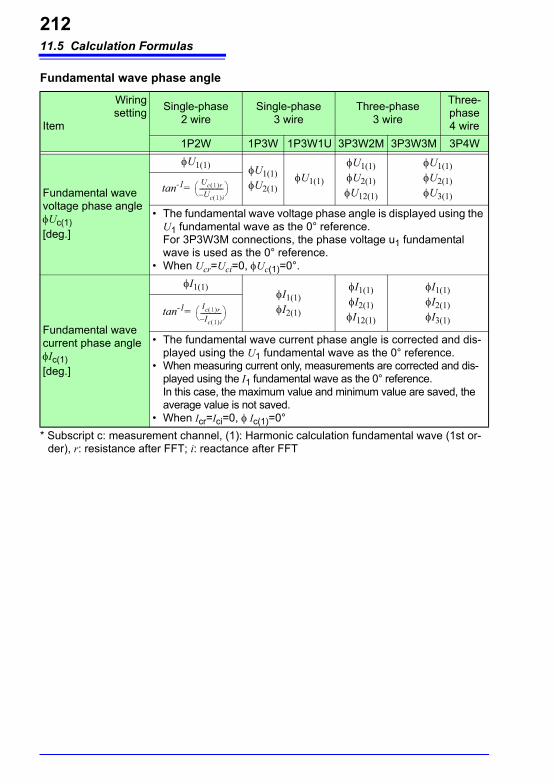
11.5 Calculation Formulas212
* Subscript c: measurement channel, (1): Harmonic calculation fundamental wave (1st or-der), r: resistance after FFT; i: reactance after FFT
Fundamental wave phase angle
Wiring setting
Item
Single-phase2 wire
Single-phase3 wire
Three-phase3 wire
Three-phase4 wire
1P2W 1P3W 1P3W1U 3P3W2M 3P3W3M 3P4W
Fundamental wave voltage phase angleφUc(1) [deg.]
φU1(1) φU1(1)φU2(1)
φU1(1)
φU1(1)φU2(1)φU12(1)
φU1(1)φU2(1)φU3(1)
tan-1=
• The fundamental wave voltage phase angle is displayed using the U1 fundamental wave as the 0° reference. For 3P3W3M connections, the phase voltage u1 fundamental wave is used as the 0° reference.
• When Ucr=Uci=0, φUc(1)=0°.
Fundamental wave current phase angleφIc(1) [deg.]
φI1(1)φI1(1)φI2(1)
φI1(1)φI2(1)φI12(1)
φI1(1)φI2(1)φI3(1)
tan-1=
• The fundamental wave current phase angle is corrected and dis-played using the U1 fundamental wave as the 0° reference.
• When measuring current only, measurements are corrected and dis-played using the I1 fundamental wave as the 0° reference. In this case, the maximum value and minimum value are saved, the average value is not saved.
• When Icr=Ici=0, φ Ic(1)=0°
Uc 1( )rUc 1( ) i–
-----------------⎝ ⎠⎛ ⎞
Ic 1( )rIc 1( ) i–
---------------⎝ ⎠⎛ ⎞
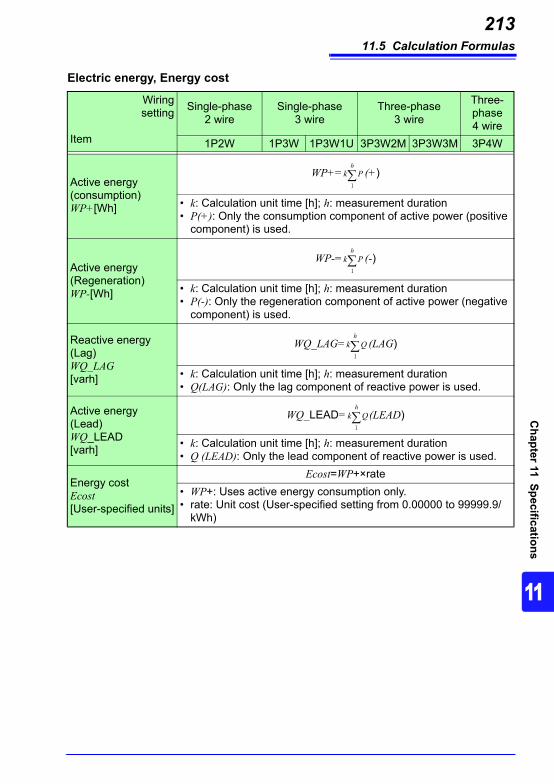
11.5 Calculation Formulas213
Chapter 11 Specifications
11
Electric energy, Energy cost
Wiring setting
Item
Single-phase2 wire
Single-phase3 wire
Three-phase3 wire
Three-phase4 wire
1P2W 1P3W 1P3W1U 3P3W2M 3P3W3M 3P4W
Active energy(consumption)WP+[Wh]
WP+= (+)
• k: Calculation unit time [h]; h: measurement duration• P(+): Only the consumption component of active power (positive
component) is used.
Active energy(Regeneration)WP-[Wh]
WP-= (-)
• k: Calculation unit time [h]; h: measurement duration• P(-): Only the regeneration component of active power (negative
component) is used.
Reactive energy(Lag)WQ_LAG[varh]
WQ_LAG= (LAG)
• k: Calculation unit time [h]; h: measurement duration• Q(LAG): Only the lag component of reactive power is used.
Active energy(Lead)WQ_LEAD[varh]
WQ_LEAD= (LEAD)
• k: Calculation unit time [h]; h: measurement duration• Q (LEAD): Only the lead component of reactive power is used.
Energy costEcost[User-specified units]
Ecost=WP+×rate• WP+: Uses active energy consumption only.• rate: Unit cost (User-specified setting from 0.00000 to 99999.9/
kWh)
k P1
h
∑
k P1
h
∑
k Q1
h
∑
k Q1
h
∑

11.5 Calculation Formulas214
Demand quantity (output data only; not displayed)
Wiring setting
Item
Single-phase2 wire
Single-phase3 wire
Three-phase3 wire
Three-phase4 wire
1P2W 1P3W 1P3W1U 3P3W2M 3P3W3M 3P4W
Active power demand quantity(consumption)WP+dem[Wh]
WP+dem = (+)
• k: Calculation unit time [h]; h: interval duration• P(+): Only the consumption component of active power
(positive component) is used.
Active power demand quantity(Regeneration)WP-dem [Wh]
WP-dem = (-)
• k: Calculation unit time [h]; h: interval duration• P(-): Only the regeneration component of active power
(negative component) is used.Reactive power demand quantity(Lag)WQLAGdem[varh]
WQLAGdem = (LAG)
• k: Calculation unit time [h]; h: interval duration• Q(LAG): Only the lag component of reactive power is used.
Reactive power demand quantity (Lead)WQLEADdem[varh]
WQLEADdem = (LEAD)
• k: Calculation unit time [h]; h: interval duration• Q(LEAD): Only the lead component of reactive power is used.
k P1
h
∑
k P1
h
∑
k Q1
h
∑
k Q1
h
∑

11.5 Calculation Formulas215
Chapter 11 Specifications
11
* Subscript c: measurement channel, k: order being analyzed; r: resistance after FFT; i: reactance after FFT
Demand value
Wiring setting
Item
Single-phase2 wire
Single-phase3 wire
Three-phase3 wire
Three-phase4 wire
1P2W 1P3W 1P3W1U 3P3W2M 3P3W3M 3P4W
Active power demand value(consumption)Pdem+[W]
Pdem+ = (+)
• h: Interval duration• P(+): Only the consumption component of active power
(positive component) is used.
Active power demand value(regeneration)Pdem-[W]
Pdem- = (-)
• h: Interval duration• P(-): Only the regeneration component of active power
(negative component) is used.
Reactive power demand value(Lag)Qdem_LAG[var]
Qdem_LAG = (LAG)
• h: Interval duration• Q(LAG): Only the lag component of reactive power is used.
Reactive power demand value(Lead)Qdem_LEAD [var]
Qdem_LEAD = (LEAD)
• h: Interval duration• Q(LEAD): Only the lead component of reactive power is used.
Power factor demand valuePFdem[ ]
PFdem =
Harmonic voltage, and currentWiring setting
Item
Single-phase2 wire
Single-phase3 wire
Three-phase3 wire
Three-phase4 wire
1P2W 1P3W 1P3W1U 3P3W2M 3P3W3M 3P4W
VoltageUck[Vrms]
U1k U1kU2k
U1kU1kU2k
U1kU2kU3k
Uck=
• When using 3P3W3M wiring, the phase voltage is used.• Harmonic voltage content percentage (%): Uck=Uck/Uc1×100 (%)
CurrentIck[Arms]
I1k I1kI2k
I1kI2kI3k
Ick=
• Harmonic current content percentage (%): Ick=Ick/Ic1×100(%)
1h--- P
1
h
∑
1h--- P
1
h
∑
1h--- Q
1
h
∑
1h--- Q
1
h
∑
(Pdem+)2 + (Qdem_LAG)2Pdem+
Uckr2 Ucki
2+
Ickr2 Icki
2+

11.5 Calculation Formulas216
* Subscript c: measurement channel, k: order being analyzed
Total harmonic distortion Wiring setting
Item
Single-phase2 wire
Single-phase3 wire
Three-phase3 wire
Three-phase4 wire
1P2W 1P3W 1P3W1U 3P3W2M 3P3W3M 3P4W
Total harmonic dis-tortion-FTHD-F_Uc[%]
THD-F_U1
THD-F_U1THD-F_U2
THD-F_U1THD-F_U1THD-F_U2
THD-F_U1THD-F_U2THD-F_U3
• When using 3P3W3M wiring, the phase voltage is used.
Total harmonic dis-tortion-FTHD-F_Ic[%]
THD-F_I1
THD-F_I1THD-F_I2
THD-F_I1THD-F_I2THD-F_I3
Total harmonic dis-tortion-RTHD-R_Uc[%]
THD-R_U1
THD-R_U1THD-R_U2
THD-R_U1THD-R_U1THD-R_U2
THD-R_U1THD-R_U2THD-R_U3
• When using 3P3W3M wiring, the phase voltage is used.
Total harmonic dis-tortion-RTHD-R_Ic[%]
THD-R_I1
THD-R_I1THD-R_I2
THD-R_I1THD-R_I2THD-R_I3
Uck( )2
k 2=
13
∑UC1
------------------------------- 100× (%)
Ick( )2
k 2=
13
∑IC1
----------------------------- 100× (%)
Uck( )2
k 2=
13
∑
Uck( )2
k 1=
13
∑------------------------------- 100× (%)
Ick( )2
k 2=
13
∑
Ick( )2
k 1=
13
∑----------------------------- 100× (%)
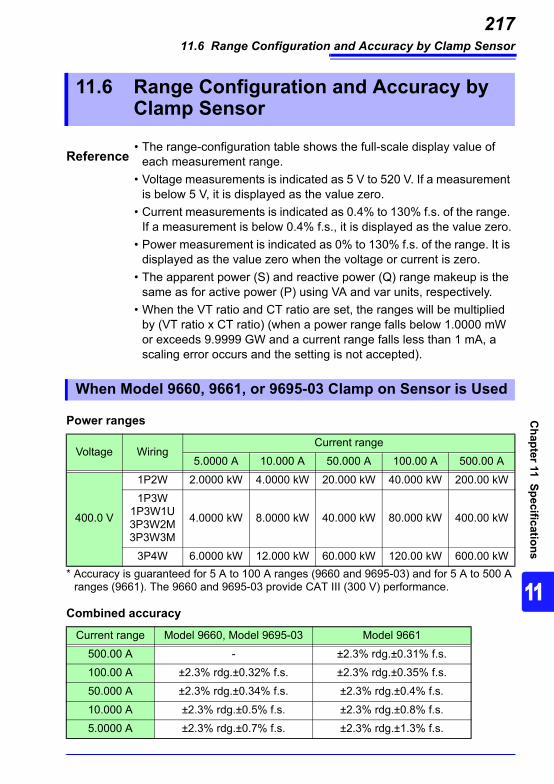
11.6 Range Configuration and Accuracy by Clamp Sensor217
Chapter 11 Specifications
11
* Accuracy is guaranteed for 5 A to 100 A ranges (9660 and 9695-03) and for 5 A to 500 Aranges (9661). The 9660 and 9695-03 provide CAT III (300 V) performance.
11.6 Range Configuration and Accuracy by Clamp Sensor
Reference• The range-configuration table shows the full-scale display value of
each measurement range.• Voltage measurements is indicated as 5 V to 520 V. If a measurement
is below 5 V, it is displayed as the value zero.• Current measurements is indicated as 0.4% to 130% f.s. of the range.
If a measurement is below 0.4% f.s., it is displayed as the value zero.• Power measurement is indicated as 0% to 130% f.s. of the range. It is
displayed as the value zero when the voltage or current is zero.• The apparent power (S) and reactive power (Q) range makeup is the
same as for active power (P) using VA and var units, respectively.• When the VT ratio and CT ratio are set, the ranges will be multiplied
by (VT ratio x CT ratio) (when a power range falls below 1.0000 mW or exceeds 9.9999 GW and a current range falls less than 1 mA, a scaling error occurs and the setting is not accepted).
When Model 9660, 9661, or 9695-03 Clamp on Sensor is Used
Power ranges
Voltage WiringCurrent range
5.0000 A 10.000 A 50.000 A 100.00 A 500.00 A
400.0 V
1P2W 2.0000 kW 4.0000 kW 20.000 kW 40.000 kW 200.00 kW
1P3W1P3W1U3P3W2M3P3W3M
4.0000 kW 8.0000 kW 40.000 kW 80.000 kW 400.00 kW
3P4W 6.0000 kW 12.000 kW 60.000 kW 120.00 kW 600.00 kW
Combined accuracy
Current range Model 9660, Model 9695-03 Model 9661
500.00 A - ±2.3% rdg.±0.31% f.s.
100.00 A ±2.3% rdg.±0.32% f.s. ±2.3% rdg.±0.35% f.s.
50.000 A ±2.3% rdg.±0.34% f.s. ±2.3% rdg.±0.4% f.s.
10.000 A ±2.3% rdg.±0.5% f.s. ±2.3% rdg.±0.8% f.s.
5.0000 A ±2.3% rdg.±0.7% f.s. ±2.3% rdg.±1.3% f.s.

11.6 Range Configuration and Accuracy by Clamp Sensor218
* Accuracy is guaranteed for 500 mA to 5 A ranges (9694) and for 500 mA to 50 A ranges (Model 9695-02). Both the 9694 and 9695-02 provide CAT III (300 V) performance.
When Model 9669 Clamp on Sensor is Used
Power ranges
Voltage WiringCurrent range
100.00 A 200.00 A 1.0000 kA
400.0 V
1P2W 40.000 kW 80.000 kW 400.00 kW
1P3W1P3W1U3P3W2M3P3W3M
80.000 kW 160.00 kW 800.00 kW
3P4W 120.00 kW 240.00 kW 1.2000 MW
Combined accuracy
Current range Model 9669
1.0000 kA ±3% rdg.±0.31% f.s.
200.00 A ±3% rdg.±0.35% f.s.
100.00 A ±3% rdg.±0.4% f.s.
When Model 9694 or 9695-02 Clamp on Sensor is Used
Power ranges
Voltage WiringCurrent range
500.00 mA 1.0000 A 5.0000 A 10.000 A 50.000 A
400.0 V
1P2W 200.00 W 400.00 W 2.0000 kW 4.0000 kW 20.000 kW
1P3W1P3W1U3P3W2M3P3W3M
400.00 W 800.00 W 4.0000 kW 8.0000 kW 40.000 kW
3P4W 600.00 W 1.2000 kW 6.0000 kW 12.000 kW 60.000 kW
Combined accuracy
Current range Model 9694 Model 9695-02
50.000 A - ±2.3% rdg.±0.32% f.s.
10.000 A - ±2.3% rdg.±0.4% f.s.
5.0000 A ±2.3% rdg.±0.32% f.s. ±2.3% rdg.±0.5% f.s.
1.0000 A ±2.3% rdg.±0.4% f.s. ±2.3% rdg.±1.3% f.s.
500.00 mA ±2.3% rdg.±0.5% f.s. ±2.3% rdg.±2.3% f.s.

11.6 Range Configuration and Accuracy by Clamp Sensor219
Chapter 11 Specifications
11
When Model CT9667 Flexible Clamp on Sensor is Used
Power ranges
Voltage WiringCurrent range (when 5 kA is selected)
500.00 A 1.0000 kA 5.0000 kA
400.0 V
1P2W 200.00 kW 400.00 kW 2.0000 MW
1P3W1P3W1U3P3W2M3P3W3M
400.00 kW 800.00 kW 4.0000 MW
3P4W 600.00 kW 1.2000 MW 6.0000 MW
Voltage WiringCurrent range (500 A is selected)
50.000 A 100.00 A 500.00 A
400.0 V
1P2W 20.000 kW 40.000 kW 200.00 kW
1P3W1P3W1U3P3W2M3P3W3M
40.000 kW 80.000 kW 400.00 kW
3P4W 60.000 kW 120.00 kW 600.00 kW
Combined accuracy
Current range Model CT96675 kA range
Model CT9667500 A range
5.0000 kA ±4% rdg.±0.6% f.s. -
1.0000 kA ±4% rdg.±1.8% f.s. -
500.00 A ±4% rdg.±3.3% f.s. ±4% rdg.±0.6% f.s.
100.00 A - ±4% rdg.±1.8% f.s.
50.000 A - ±4% rdg.±3.3% f.s.

11.7 PW9020 Safety Voltage Sensor220
11.7 PW9020 Safety Voltage SensorGeneral SpecificationsOperating environment Indoors, Pollution degree 2, altitude up to 2,000 m (6562-ft.)
Operating temperature and humidity
0°C to 50°C (32°F to 122°F), 80% RH or less (non-condensation)
Storage temperature and humidity
-10°C to 60°C (14°F to 140°F), 80% RH or less (non-condensation)
Dielectric strength
7.06 kV AC rms (sensing current: 1 mA)(50 Hz/60 Hz,60 sec.)Between clip aperture and output terminal
Power supply Power is supplied from the PW3365.
Dimensions
Clip: Approx. 33 mm W × 61.5 mm H × 97mm D / Approx. 1.30” W × 2.42” H × 3.82” D (excluding protrusions)Relay box: Approx. 34 mm W × 21 mm H × 131.5mm D / Approx. 1.34” W × 0.83” H ×5.18” D (excluding protrusions)
Mass Approx. 220 g (Approx. 7.8 oz.)
Cord length Total length: Approx. 3 m/ Approx. 118.11”(including relay box; not including clip)Between clip and relay box: Approx. 1.5 m/ Approx. 59.06”
Product war-ranty period 3 years
Applicable standards
Safety EN61010EMC EN61326 Class A
Other specificationsRated primary voltage 400 V AC
Output voltage 800 mV/400 V
Maximum rated volt-age to earth
600 V Measurement Categories III (anticipated transient overvoltage 6000 V)300 V Measurement Categories IV (anticipated transient overvoltage 6000 V)
Valid measurement range
As per PW3365See: The PW3365 specifications:"Effective measuring range"
(p.189)
Voltage detection method Coupling capacitance cancellation method
Measurement targets Metal parts, Insulated wires (IV, CV equivalent) but not shielded wires

11.7 PW9020 Safety Voltage Sensor221
Chapter 11 Specifications
11
Measurable conduc-tor diameter
Outer (finished) diameter: φ6 mm to 30 mm(IV wire: 8 mm2 to 325 mm2, CV wire: 2 mm2 to 250 mm2)When measuring a conductor with a diameter of 15 mm or less, the center of the conductor must be aligned with the r mark on the lower case (see the following figure).
Accuracy warranty for tempera-ture and humidity ranges
23°C ± 5°C (73 ± 9°F), 80%RH or less
Accuracy warranty period 1 year
RMS accuracy
45 Hz to 66 Hz: Combination accuracy with PW3365: ±1.5% rdg. ±0.2% f.s.(For the PW9020 alone, ±1.2% rdg.±0.1% f.s.)f.s. at 400 V, At a fundamental frequency of 50 Hz/60 Hz and an input voltage of 20 V or less780 Hz or less: For the PW9020 alone, ±25% rdg.±2.7% f.s.
Phase accuracy
Combination accuracy with PW3365: ±1.3° equivalent(For the PW9020 alone, ±1.0° equivalent)50 Hz/60 Hz, f.s. input
Effects of temperature
Defined in combination with PW3365See: The PW3365 specifications: "Temperature characteristic"
(p.191)
Effects of humidity
Add below to combination accuracy with PW3365 (voltage, power, phase):Accuracy within ±1% f.s., phase within ±1°During measurement of insulated wire at a humidity of 70% RH to 80% RH
Effects of adjacent wires (con-ductors)
Add below to combination accuracy with PW3365 (voltage, power):Within ±1% f.s.With adjacent wires (conductors) with a potential difference of 400 V in contact with the clip (see the following figure)
Other specifications

11.7 PW9020 Safety Voltage Sensor222
Figure Effects of Adjacent Wires (Conductors)
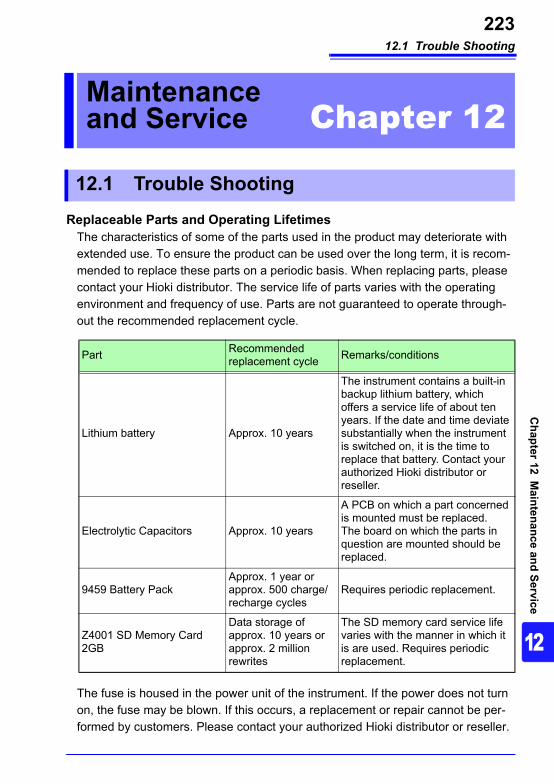
12.1 Trouble Shooting223
Chapter 12 M
aintenance and Service
12
Replaceable Parts and Operating LifetimesThe characteristics of some of the parts used in the product may deteriorate with extended use. To ensure the product can be used over the long term, it is recom-mended to replace these parts on a periodic basis. When replacing parts, please contact your Hioki distributor. The service life of parts varies with the operating environment and frequency of use. Parts are not guaranteed to operate through-out the recommended replacement cycle.
The fuse is housed in the power unit of the instrument. If the power does not turn on, the fuse may be blown. If this occurs, a replacement or repair cannot be per-formed by customers. Please contact your authorized Hioki distributor or reseller.
Maintenance and Service Chapter 12
12.1 Trouble Shooting
Part Recommended replacement cycle Remarks/conditions
Lithium battery Approx. 10 years
The instrument contains a built-in backup lithium battery, which offers a service life of about ten years. If the date and time deviate substantially when the instrument is switched on, it is the time to replace that battery. Contact your authorized Hioki distributor or reseller.
Electrolytic Capacitors Approx. 10 years
A PCB on which a part concerned is mounted must be replaced.The board on which the parts in question are mounted should be replaced.
9459 Battery PackApprox. 1 year or approx. 500 charge/recharge cycles
Requires periodic replacement.
Z4001 SD Memory Card 2GB
Data storage of approx. 10 years or approx. 2 million rewrites
The SD memory card service life varies with the manner in which it is are used. Requires periodic replacement.

12.1 Trouble Shooting224
If damage is suspectedIf damage is suspected, check the "Before Having the Instrument Repaired" (p.225) section before contacting your authorized Hioki distributor or reseller.
Calibrations
The calibration frequency varies depending on the status of the instrument or installation environment. We recommend that the calibration frequency is deter-mined in accordance with the status of the instrument or installation environment and that you request that calibration be performed periodically.
Precautions when transporting the instrument• When sending the instrument for repair, remove the battery pack and SD memory
card carefully to prevent damage in transit. Include cushioning material so the instrument cannot move within the package.
• Include a description of existing damage. We do not take any responsibility for damage incurred during shipping.See: See also "Transport precautions" (p.3).
StorageTo avoid problems with battery pack operation, remove the battery pack from the instrument if it is to be stored for a long time.
IMPORTANT
Periodic calibration is necessary in order to ensure that the instrument provides correct measurement results of the specified accuracy.

12.1 Trouble Shooting225
Chapter 12 M
aintenance and Service
12
Before returning for repair
Before Having the Instrument Repaired
Symptom Check Item, or Cause Remedy and Reference
The display does not appear when you turn the power on.
If powering the instrument with the AC adapter• Are the power cord and AC
adapter properly connected?
Verify that the power cord or AC adapter is connected properly.See: "2.5 Connecting the AC
Adapter" (p.41)
If powering the instrument with the battery• Has the PW9002 Battery Set
(9459 Battery Pack) been properly installed?
• Has the battery pack been charged?
Verify that the battery pack has been charged and installed.See: " Installing (replacing) the Bat-
tery Pack" (p.32)See:
Keys do not work. Has the key lock been acti-vated? Press and hold the key for at
least 3 seconds to cancel the key lock.
Voltage or current measured values are not being dis-played.
• Are the voltage sensors or clamp sensors connected improperly?
• Are the input channels and display channels incorrect?
• Has an appropriate current range been selected?
Check the wirings and wiring settings.See: "3.4 Connecting the Current
Sensors to the Instrument" (p.53) to "3.9 Verifying Correct Wiring (Wiring Check)" (p.65)
Measured values do not stabilize.
• Is the frequency of the mea-surement target being mea-sured 50 Hz or 60 Hz? The instrument does not sup-port 400 Hz frequency lines.
The instrument can only be used with 50 Hz/60 Hz lines. Lines operating at 400 Hz cannot be measured.
• If the wiring setting is 1P2W/1P3W/3P3W2M/3P3W3M/3P4W, is voltage input being supplied? The instrument may not be able to perform stable mea-surement without voltage input.
If not measuring voltage, select the current-only wiring and set the fre-quency setting to the measurement line frequency (50 Hz/60 Hz).See: "4.2 Changing Measurement
Settings" (p.72)

12.1 Trouble Shooting226
If the cause of the issue remains unclear, reset the system. Doing so will initialize settings to their factory defaults.
See: "4.5 Initializing the Instrument (System Reset)" (p.92)
Unable to charge the 9459 Battery Pack (the Charge LED does not light up).
• Verify that the ambient tem-perature is within the range of 10°C to 40°C.
The instrument’s battery can be charged within the ambient tempera-ture range of 10°C to 40°C.See: "Installing (replacing) the Bat-
tery Pack" (p.32)
• Has the instrument been stored for an extended period of time with the bat-tery pack installed?
The battery pack may have degraded, signaling that it needs to be replaced. Please purchase a new battery pack. Contact your Hioki dis-tributor for more information. If the instrument will not be used for one month or longer, remove the battery pack and store at -20°C to 30°C.See: "Installing (replacing) the Bat-
tery Pack" (p.32)
The battery pack can only be used for a short period of time.
• The batter pack’s capacity may have deteriorated due to degradation.
Symptom Check Item, or Cause Remedy and Reference

12.2 Cleaning227
Chapter 12 M
aintenance and Service
12
Instrument and Voltage Sensor• To clean the instrument and sensor, wipe it gently with a soft cloth moistened with
water or mild detergent.
• Wipe the LCD gently with a soft, dry cloth.
Clamp Sensor
Error displays other than system errors can be cleared by pressing any key.
System error
12.2 Cleaning
IMPORTANT
Never use solvents such as benzene, alcohol, acetone, ether, ketones, thinners or gasoline, as they can deform and discolor the case.
ReferenceMeasurements are degraded by dirt on the mating surfaces of the clamp-on sensor, so keep the surfaces clean by gently wiping with a soft cloth.
12.3 Error Indication
Error display Cause Solution/more information
*** SYSTEM ERROR ***The internal programming of the PW3365 is corrupted and the instrument must be repaired.
A program failure has occurred.
The instrument needs to be repaired.Contact your authorized Hioki distributor or reseller.
*** SYSTEM ERROR ***The SDRAM of the PW3365 is corrupted and the instrument must be repaired.
A memory failure has occurred.
*** SYSTEM ERROR ***The adjustment values of the PW3365 are corrupted and the instrument must be repaired.
An adjustment value failure has occurred.
*** SYSTEM ERROR ***The display memory of the PW3365 is corrupted and the instrument must be repaired.
A display memory failure has occurred.
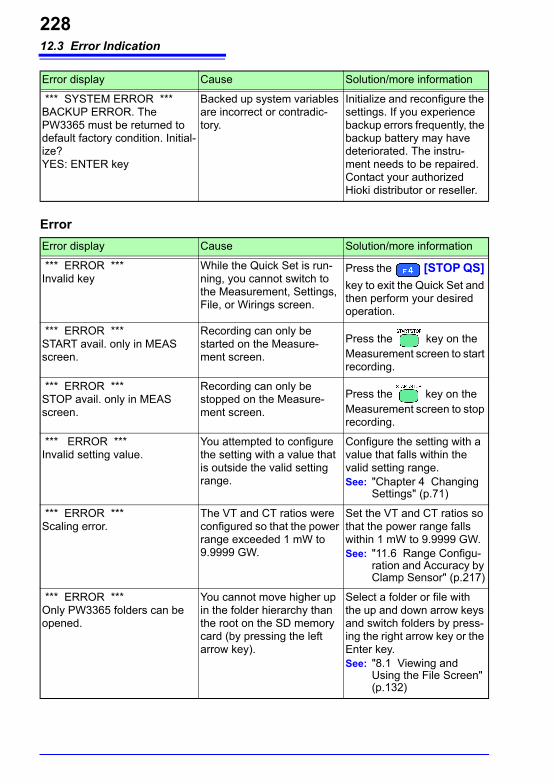
12.3 Error Indication228
Error
*** SYSTEM ERROR ***BACKUP ERROR. The PW3365 must be returned to default factory condition. Initial-ize?YES: ENTER key
Backed up system variables are incorrect or contradic-tory.
Initialize and reconfigure the settings. If you experience backup errors frequently, the backup battery may have deteriorated. The instru-ment needs to be repaired.Contact your authorized Hioki distributor or reseller.
Error display Cause Solution/more information
*** ERROR *** Invalid key
While the Quick Set is run-ning, you cannot switch to the Measurement, Settings, File, or Wirings screen.
Press the [STOP QS] key to exit the Quick Set and then perform your desired operation.
*** ERROR *** START avail. only in MEAS screen.
Recording can only be started on the Measure-ment screen.
Press the key on the Measurement screen to start recording.
*** ERROR *** STOP avail. only in MEAS screen.
Recording can only be stopped on the Measure-ment screen.
Press the key on the Measurement screen to stop recording.
*** ERROR *** Invalid setting value.
You attempted to configure the setting with a value that is outside the valid setting range.
Configure the setting with a value that falls within the valid setting range.See: "Chapter 4 Changing
Settings" (p.71)
*** ERROR *** Scaling error.
The VT and CT ratios were configured so that the power range exceeded 1 mW to 9.9999 GW.
Set the VT and CT ratios so that the power range falls within 1 mW to 9.9999 GW.See: "11.6 Range Configu-
ration and Accuracy by Clamp Sensor" (p.217)
*** ERROR *** Only PW3365 folders can be opened.
You cannot move higher up in the folder hierarchy than the root on the SD memory card (by pressing the left arrow key).
Select a folder or file with the up and down arrow keys and switch folders by press-ing the right arrow key or the Enter key.See: "8.1 Viewing and
Using the File Screen" (p.132)
Error display Cause Solution/more information

12.3 Error Indication229
Chapter 12 M
aintenance and Service
12
Operation error
File error
Error display Cause Solution/more information
*** OPERATION ERROR ***This folder cannot be deleted.
You attempted to delete the [PW3365] basic folder.
The [PW3365] basic folder cannot be deleted. If you wish to delete it, you must do so on a computer.
*** OPERATION ERROR ***Cannot modify settings whilein STANDBY.
You attempted to change a setting that cannot be changed while the instru-ment is in the recording standby state.
If you need to change the setting, cancel the record-ing standby state with the
key on the Measure-ment screen.
*** OPERATION ERROR ***Cannot modify settings whilerecording is in progress.
You attempted to change a setting that cannot be changed during recording and measurement.
If you need to change the setting, stop the recording
measurement with the key on the Measurement screen.
Error display Cause Solution/more information
*** FILE ERROR ***Save failed.
The instrument was unable to save data due to a prob-lem with the SD memory card.
Format the SD memory card.See: "8.8 Formatting the
SD Memory Card or Internal Memory" (p.145)
The instrument was unable to save data due to a prob-lem with its internal memory.
Format the internal memory.See: "8.8 Formatting the
SD Memory Card or Internal Memory" (p.145)
*** FILE ERROR ***Load failed.
The instrument was unable to load settings data due to a problem with the settings file.
Create a new settings file and load it.
See: "8.4 Saving Settings Files" (p.140)
*** FILE ERROR ***File or folder could not be deleted.
The SD memory card is in the locked (write-protected) state, or the file or folder attribute is set to “read-only.”
If the SD memory card is locked, unlock it.
If the file or folder attribute is set to “read-only,” change the attribute using a com-puter.

12.3 Error Indication230
SD card error
*** FILE ERROR ***The file with the same name exists.
The instrument was unable to copy data from its internal memory to the SD memory card because data with the same filename already existed on the SD memory card.
Delete the data with the same filename from the SD memory card or change the filename using a computer.
*** FILE ERROR ***Formatting failed.
An SD memory card error occurred, or the card was ejected, during formatting.
Reinsert the SD memory card and format it again. If unable to format the card, the card may be damaged and should be replaced.
An internal memory error occurred.
The instrument needs to be repaired.Contact your authorized Hioki distributor or reseller.
*** FILE ERROR ***No settings file.Select a settings file.
The instrument was unable to load the settings because the selected file is not a set-tings file.
Select a settings file (exten-sion of .SET).
*** FILE ERROR ***Maximum files reached. Addi-tional files cannot be created.
The maximum number of files and folders that can be created was exceeded.
Switch SD memory cards. Alternately, make a backup of the SD memory card using a computer, delete unnecessary data on the card, and format it.See: "8.6 Copying Internal
Memory Files to the SD Memory Card" (p.143) "8.7 Deleting Folders and Files" (p.144)
Error display Cause Solution/more information
*** SD CARD ERROR ***SD Card not found.Insert an SD Card.
Data cannot be saved to the SD memory card because no SD memory card has been inserted into the instru-ment.
Insert an SD memory card.See: "2.4 Inserting (Remov-
ing) an SD Memory Card" (p.38)
*** SD CARD ERROR ***SD Card is not formatted forthis device.
The SD memory card has not been formatted with the dedicated SD format.
Format the card with the instrument.See: "8.8 Formatting the
SD Memory Card or Internal Memory" (p.145)
Error display Cause Solution/more information

12.3 Error Indication231
Chapter 12 M
aintenance and Service
12
*** SD CARD ERROR ***SD Card not compatible.
An unsupported card such as an SDXC memory card was inserted into the instru-ment.
Use the instrument’s optional SD memory card.
*** SD CARD ERROR ***SD Card locked.Unlock the SD Card.
The SD memory card is in the locked (write-protected) state.
Unlock the SD memory card.See: "Inserting the SD mem-
ory card" (p.40)
*** SD CARD ERROR ***Data has been backed up to internal memory.
Data will be saved to the instrument’s internal mem-ory if no SD memory card has been inserted or the SD memory card is full while performing recording and measurement with the save destination set to “SD card.”
Insert an SD memory card or switch cards.
*** SD CARD ERROR ***SD Card is full.Delete files or reformat.
Data cannot be saved to the SD memory card because the card is full.
Switch SD memory cards. Alternately, make a backup of the SD memory card using a computer, delete unnecessary data on the card, and format it.See: "8.6 Copying Internal
Memory Files to the SD Memory Card" (p.143) "8.7 Deleting Folders and Files" (p.144) "8.8 Formatting the SD Memory Card or Internal Memory" (p.145)
Error display Cause Solution/more information

12.3 Error Indication232
Internal memory error
*** SD CARD ERROR ***Error while attempting to access the SD Card.
You attempted to access a corrupt file or a corrupt SD memory card. Alternately, the card was removed while it was being accessed.
• Back up any data on the SD memory card on a computer before format-ting the card.
See: "8.8 Formatting the SD Memory Card or Internal Memory" (p.145)
• If the error persists after formatting the SD mem-ory card, replace it with a new card.
• Do not remove the card while it is mounted by
the device (while the red indicator is lit up).
*** SD CARD ERROR ***This is a read-only file.
The SD memory card is in the locked (write-protected) state, or the file or folder attribute is set to “read-only.”
If the SD memory card is locked, unlock it.If the file or folder attribute is set to “read-only,” change the attribute using a com-puter.
Error display Cause Solution/more information
*** MEMORY ERROR ***Internal memory is full.Delete files.
The instrument’s internal memory is full.
If performing recording and measurement, stop the instrument, back up the internal memory using a computer, and delete files from the internal memory or format it.See: "9.2 Copying Data to a
Computer (USB)" (p.150) "8.7 Deleting Folders and Files" (p.144)
*** MEMORY ERROR ***Internal memory is corrupted.Please reformat.
The instrument’s internal memory is corrupt.
Format the internal memory. See: "8.8 Formatting the
SD Memory Card or Internal Memory" (p.145)
Error display Cause Solution/more information

12.4 Disposing of the Instrument233
Chapter 12 M
aintenance and Service
12
When disposing of this instrument, remove the lithium battery and dispose of bat-tery and instrument in accordance with local regulations.
Lithium Battery RemovalPreparation items
12.4 Disposing of the Instrument
• Battery may explode if mistreated. Do not short-circuit, recharge, disassemble or dispose of in fire.
• To avoid electric shock, turn off the power switch and discon-nect the cords and cables before removing the lithium battery.
• Keep batteries away from children to prevent accidental swal-lowing.
1 Turn off the power switch.
2 If any cords are connected, for example voltage sensors, clamp sen-sors, or the AC adapter, disconnect them. If the PW9002 Battery Set (9459 Battery Pack) is installed, remove it.
See: "Installing (replacing) the Battery Pack" (p.32)
3 Pressing with your fingers on the corners of the two protectors on the left and right sides of the instrument, remove them.
Phillips screwdriver Tweezers
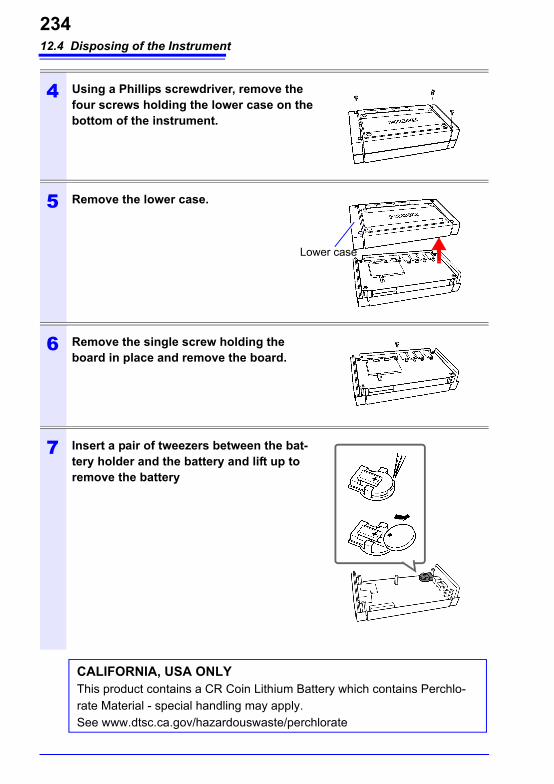
12.4 Disposing of the Instrument234
4 Using a Phillips screwdriver, remove the four screws holding the lower case on the bottom of the instrument.
5 Remove the lower case.
6 Remove the single screw holding the board in place and remove the board.
7 Insert a pair of tweezers between the bat-tery holder and the battery and lift up to remove the battery
Lower case
CALIFORNIA, USA ONLYThis product contains a CR Coin Lithium Battery which contains Perchlo-rate Material - special handling may apply.See www.dtsc.ca.gov/hazardouswaste/perchlorate

Appendix 1 Voltage Sensor Measurement PrinciplesA1
付録
Appendix
Internally, the PW9020 Voltage Sensor incorporates electrode (metal plate). When the PW9020 is clamped onto a measure-ment target, capacitive coupling of the mea-surement target and the sensor electrode causes the minuscule current I to flow.
(1)ω: Angular speed of measurement target [rad/s]C: Capacitance between the measurement target
and the sensor electrode [F]V: Voltage between the measurement target and the sensor electrode (AC) [V]
Based on equation (1), I will be 0 when V = 0 (when the measurement target and the sensor electrode are at the same potential). By detecting the minuscule current I and controlling the voltage of the sensor electrode so that I reaches 0, the PW9020 gener-ates the same voltage internally as exists on the measurement target. By equalizing the generated voltage and the measured voltage and then measur-ing the internally generated voltage, it is possible to make measurements without contacting metal parts.
The instrument samples each channel at 10.24 kHz. The three voltage channels and three current channels are switched at 61.44 kHz with a multi-plexer (MUX), and two A/D converters (ADC) (one for voltage and another for current) sample the channels. Since U1 and I1, U2 and I2, and U3 and I3 are sampled simultaneously, there is no phase difference between voltage and current readings for the same channel. Sampling between channels for voltage (U1, U2, and U3) and current (I1, I2, and I3) is shifted. The phase differences that result from this sampling shift are corrected internally, and the phase angle is displayed. However, since waveforms are not cor-rected for sampling shift, the waveforms for U1, U2, and U3 as well as I1, I2, and I3 will differ slightly if the same input is supplied to all three channels.
Appendix
Appendix 1 Voltage Sensor Measurement Principles
Appendix 2 How the Instrument Samples Data
Measurement target
Voltage generation circuit
Sensor electrode
V1
V2
I
V2 is controlled so that I = 0.V2 is measured since V1= V2 when I = 0.
C
CVI ω=
Voltage
Current
MUX1
MUX2
U1U2U3
I1I2I3
ADC1
ADC2
Voltage
Current
Channels are switched at 61.44 kHz.

Appendix 3 Three-phase 3-wire MeasurementA2
An artificial circuit of a three-phase 3-wire line
: The vectors of line-to-line voltage : The vectors of phase to neutral voltage
: The vectors of line (phase) current
3-phase/3-wire/3-wattmeter measurement (3P3W3M)In 3-wattmeter measurement, three phase voltages ( ) and three line
(phase) currents ( ) are measured.Since a 3-phase/3-wire line does not have a neutral point, the actual phase volt-age cannot be measured. The conductor-to-ground voltage (phase voltage from the virtual neutral point) is measured using the load-side grounding wire or a grounded metal part on the load side as the virtual neutral point.The 3-phase active power P is calculated as the sum of all the phase active power values.
P = + + (1)
Appendix 3 Three-phase 3-wire Measurement
Three-phase 3-wire Power-supply side
Three-phase 3-wire Load side
I1
1
UU u1
Neutral point
u3 u2
U
I3
I2
23
u1u3 u2
Load-side grounding wire
U1, U2, U3u1, u2, u3
I1, I2, I3
u1, u2, u3
I1, I2, I3
u1 I1 u2 I2 u3 I3

Appendix 3 Three-phase 3-wire MeasurementA3
付録
Appendix
3-phase/3-wire/2-wattmeter measurement (3P3W2M)
In 2-wattmeter measurement, two line-to-line voltages ( ) and three line
(phase) currents ( ) are measured. The 3-phase active power P can be derived from two voltage and current values, as shown below:
P = + ( = - , = - )
= ( - ) + ( - )
= + (- - ) +
(because + + =0 due to precondition of a closed circuit)
= + + (2)
Since equations (1) and (2) agree, it is possible to prove that 2-wattmeter mea-surement can be used to measure the power of a 3-phase, 3-wire line. Since the only special conditions are that the target be a closed circuit without leakage cur-rent, it is possible to calculate 3-phase power without regard to the balance or unbalance state of the electric circuit.Additionally, since the sum of the voltage and current vectors always equals 0
under these conditions, the instrument internally calculates the third voltage ( )
and current ( ) values as follows:
= -
= - -
Since the values calculated internally are also applied to the 3-phase total reactive power Q, apparent power S, and power factor PF values, these values can also be calculated accurately in the event of an unbalanced state (PF/Q/S calcula-tion selection: when using RMS calculation).See: "PF/Q/S calculation [PF/Q/S CALC]" (p.75)
However, because the three phases are calculated from two power values in 2-wattmeter measurement, it is not possible to check the power balance for individ-ual phases. If you wish to check the power balance for individual phases, use 3-wattmeter (3P3W3M) measurement.
U1, U2
I1, I3
U1 I1 U2I3 U1 u1 u2 U2 u3 u2
u1 u2 I1 u3 u2 I3
u1 I1 u2 I1 I3 u3 I3
I1 I2 I3
u1 I1 u2 I2 u3 I3
U3
I2
U3 U1 U2
I2 I1 I3
U3, I2
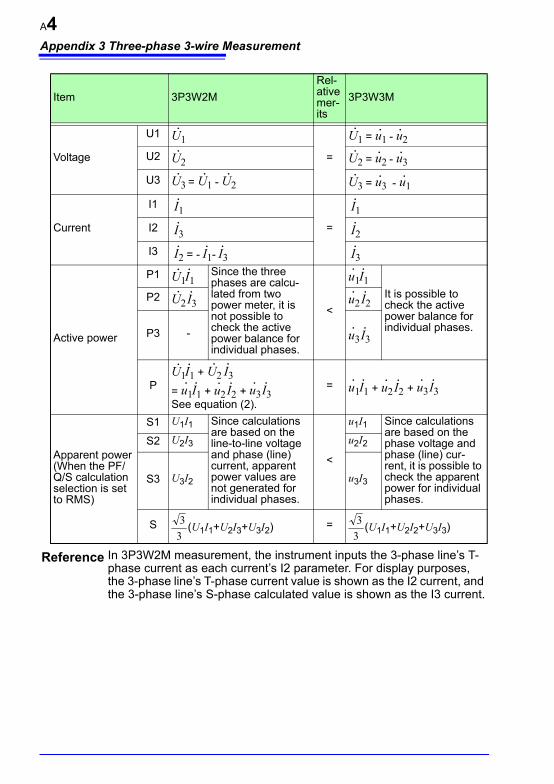
Appendix 3 Three-phase 3-wire MeasurementA4
Item 3P3W2MRel-ative mer-its
3P3W3M
Voltage
U1
=
= -
U2 = -
U3 = - = -
Current
I1
=I2
I3 = - -
Active power
P1 Since the three phases are calcu-lated from two power meter, it is not possible to check the active power balance for individual phases.
<It is possible to check the active power balance for individual phases.
P2
P3 -
P +
= + + See equation (2).
= + +
Apparent power(When the PF/Q/S calculation selection is set to RMS)
S1 U1I1 Since calculations are based on the line-to-line voltage and phase (line) current, apparent power values are not generated for individual phases.
<
u1I1 Since calculations are based on the phase voltage and phase (line) cur-rent, it is possible to check the apparent power for individual phases.
S2 U2I3 u2I2
S3 U3I2 u3I3
S (U1I1+U2I3+U3I2) = (U1I1+U2I2+U3I3)
Reference In 3P3W2M measurement, the instrument inputs the 3-phase line’s T-phase current as each current’s I2 parameter. For display purposes, the 3-phase line’s T-phase current value is shown as the I2 current, and the 3-phase line’s S-phase calculated value is shown as the I3 current.
U1 U1 u1 u2
U2 U2 u2 u3
U3 U1 U2 U3 u3 u1
I1 I1
I3 I2
I2 I1 I3 I3
U1 I1 u1 I1
U2 I3 u2 I2
u3 I3
U1 I1 U2 I3u1 I1 u2 I2 u3 I3 u1 I1 u2 I2 u3 I3
33
33

Appendix 3 Three-phase 3-wire MeasurementA5
付録
Appendix
Power measurement (3P3W3M) wiringWhen performing 3-wattmeter (3P3W3M) measurement with an older power meter (PW3360, 3169, etc.), it is typical to use a wiring method that does not use the N terminal.
Three-wattmeter measurement with an PW3360
With the PW3365, failure to connect a PW9020 Voltage Sensor to the N terminal may prevent the instrument’s internal reference potential from stabilizing, making accurate measurement impossible. When performing three-wattmeter measure-ment with the PW3365, be sure to connect a PW9020 Voltage Sensor to the N ter-minal and clamp it to the load-side grounding wire or grounded metal part on the load side. (The power of each channel is measured while using the voltage to which the N terminal’s voltage sensor is connected as a virtual neutral point.)
Three-wattmeter measurement with the PW3365
Pow
er source side
Load sideClamp sensorsLR9438-53
Voltage cords
R
S
T
Clamp sensor arrows point to the load side.
Do not connect
CH1: RedCH2: YellowCH3: Blue
Clamp sensorsPW9020 Safety Voltage Sensors
R
S
T
Clamp sensor arrows point to the load side.
Wiring_diagram_3P3W3M.BMP
CH1: RedCH2: YellowCH3: Blue
Power
source side
Load side

Appendix 3 Three-phase 3-wire MeasurementA6
Precautions when performing measurement using Δ wiringThe PW9020 Safety Voltage Sensor generates an internal voltage that is the same as the conductor-to-ground voltage, and the PW3365 measures the line voltage based on that generated voltage. When one terminal is grounded while using the Δ wiring method, performing 3-power measurement (3P3W3M) causes the vector diagram on the [WIR, CHK] screen to appear as follows:
When one terminal is grounded while using the Δ wiring method, the wiring check will result in a fail judgment even if the instrument is connected as shown on the [WIR, DIAG] screen for [3P3W3M] (3-power measurement). In this case, active power, reactive power, and apparent power will be the same result as [3P3W2M] (two-watt-meter measurement). You will be able to measure the total power for the three phases, but you will not be able to check the power balance for individual phases.Since the instrument assumes that [3P3W3M] (3-power measurement) will be per-formed using the Y wiring method, when performing measurement using the Δ wir-ing method, select [3P3W2M] (two-wattmeter measurement). [3P3W2M] (two-wattmeter measurement) supports both the Y and Δ wiring methods.
R
S2
U1U2=0 V
U3
APP2-2.bmp
Udeg3 will be 60°, causing a voltage phase failure since it falls outside the judg-ment reference (120° ±10°).
Udeg3=60°Judgment reference(120°±10)
U2 will become 0 V, causing a voltage input fail.(Depending on the installation environment, it may not become 0 V.)
U2=0 V
Clamp sensorsPW9020 Safety Voltage Sensors
CH1: RedCH2: YellowCH3: Blue
Load
sid
e
UN=0 V
T

Appendix 3 Three-phase 3-wire MeasurementA7
付録
Appendix
Differences in 3-phase/3-wire/3-wattmeter measurement (3P3W3M) calcu-lations between the PW3360, PW3365, and the 3169-20/21
This section describes differences in how the PW3660 Clamp on Power Logger PW3365 Clamp on Power Logger, and the 3169-20/21 Clamp on Power HiTester perform calculations during 3-phase/3-wire/3-wattmeter (3P3W3M) measurement. As indicated in the following table, the apparent power and power factor values generated by the 3169-20/21 for each channel are not available for each phase because the instrument uses line-to-line voltages to calculate apparent power and power factor for each channel. By contrast, since the PW3660 and PW3365 uses phase voltages, the apparent power and power factor values for each channel are available for each phase. Consequently, it is possible to check balance for individ-ual phases.
Item
Model PW3360 and PW3365 (3P3W3M) When the PF/Q/S calcula-tion selection is set to RMS
Relative merits
Model 3169-20/21(3P3W3M)The reactive power meter method is not used.
Voltage
U1 = - = = -
U2 = - = -
U3 = - = -
Current
I1 =
I2
I3
Active power
P1 =
P2
P3
P P1+P2+P3 P1+P2+P3
Apparent power
S1 u1I1 Since calculations are based on the phase voltage and phase (line) cur-rent, it is possible to check the apparent power for each of the three phases.
> U1I1 Since calculations are based on the line-to-line voltage and line (phase) current, apparent power values are not generated for individual phases.
S2 u2I2 U2I2
S3u3I3 U3I3
S(U1I1+U2I2+U3I3)
=(U1I1+U2I2+U3I3)
U1 u1 u2 U1 u1 u2
U2 u2 u3 U2 u2 u3
U3 u3 u1 U3 u3 u1
I1 I1
I2 I2
I3 I3
u1 I1 u1 I1
u2 I2 u2 I2
u3 I3 u3 I3
33
33

Appendix 3 Three-phase 3-wire MeasurementA8
Power factorsi: Indicates lag/lead.
PF1 si Since calculations
are based on the phase voltage and phase (line) cur-rent, it is possible to check the power factor for individual phases.
>si Since calculations
are based on the line-to-line voltage and phase (line) current, power fac-tor values are not generated for indi-vidual phases.
PF2 si si
PF3 si si
PF si = si
Item
Model PW3360 and PW3365 (3P3W3M) When the PF/Q/S calcula-tion selection is set to RMS
Relative merits
Model 3169-20/21(3P3W3M)The reactive power meter method is not used.
11IuP1
11IUP1
22IuP2
22IUP2
33IuP3
33IUP3
SP
SP

Appendix 4 Method for Calculating Active Power AccuracyA9
付録
Appendix
The accuracy of active power calculations can be calculated as follows, taking into account the phase accuracy:
Example measurement conditions
Accuracy
See: "11.3 Detailed Measurement Specifications" (p.192), "11.6 Range Configuration and Accuracy by Clamp Sensor" (p.217), Model 9661 Instruction manual “Specifications” phase accuracy
Power factor accuracy based on phase accuracyPhase accuracy (in combination with clamp sensor) =Instrument phase accuracy (±1.3°)+Model 9661 phase accuracy (±0.5°)=±1.8°
Phase differenceθ = cos-1(power factor)= cos-10.9= 25.84°
Power factor error range based on phase accuracy = cos (25.84°±1.8°)= Min. 0.8859 to max. 0.9133
Power factor accuracy based on phase accuracy (minimum)
= %= -1.57%, Use the worst value as the power factor accuracy.
Power factor accuracy based on phase accuracy (maximum)
= %= +1.48%
Power factor accuracy based on phase accuracy: ±1.57% rdg.
Appendix 4 Method for Calculating Active Power Accuracy
Wiring 3-phase/3-wire/2-wattmeter measurement (3P3W2M)Clamp sensor Model 9661
Current range100 A (power range: 80 kW)See: "11.6 Range Configuration and Accuracy by
Clamp Sensor" (p.217)Measured values Active power of 30 kW, power factor lag 0.9
Clamp sensor combined accuracy (Model 9661 sensor, 100 A range) ±2.3% rdg.±0.35% f.s.
Instrument phase accuracy(PW3365+PW9020) ±1.3°
Model 9661 phase accuracy ±0.5°
0.8859 0.9–0.9
-------------------------------- 100×
0.9133 0.9–0.9
-------------------------------- 100×

Appendix 4 Method for Calculating Active Power AccuracyA10
Active power accuracyActive power accuracy = Clamp sensor combined accuracy
+ power factor accuracy based on phase accuracy= ±2.3% rdg.±0.35% f.s.±1.57% rdg.= ±3.87% rdg.±0.35% f.s.
Accuracy relative to measured values (kW)= ±{30 kW (active power) × 3.87% rdg. + 80 kW (range) × 0.35% f.s.}= ±1.441 kW
Accuracy relative to measured values (% rdg.) = ±1.441 kW/30kW= ±4.8% rdg.

Appendix 5 TerminologyA11
付録
Appendix
Appendix 5 Terminology
Active power Power that is consumed doing work. Active power demand value
The average active power used during a set period of interval time (usually 30 minutes).
Apparent power
Power obtained by combining the active power and reactive power vectors. As its name suggests, apparent power expresses the “visible" power and comprises the product of the voltage and current RMS values.
Binary data All data other than text (character) data. Use binary data when ana-lyzing data with the SF1001 Power Logger Viewer application.
IEC61000-4-7An international standard governing measurement of harmonic cur-rent and harmonic voltage in power supply systems as well as har-monic current emitted by equipment. The standard specifies the performance of a standard instrument.
Harmonics
A phenomenon caused by distortions in the voltage and current waveforms that affect many devices with power supplies using semiconductor control devices. In the analysis of non-sine waves, the term refers to one RMS value among the components with har-monic frequencies.
Harmonic content percentage
The ratio of the K-th order size to the size of the fundamental wave, expressed as a percentage using the following equation:K-th order wave / fundamental wave × 100 [%]
By observing this value, it is possible to ascertain the harmonic component content for individual orders. This metric provides a use-ful way to track the harmonic content percentage when monitoring a specific order.
LAN
LAN is the abbreviation of Local Area Network. The LAN was devel-oped as a network for transferring data through a PC within a local area, such as an office, factory, or school.This device comes equipped with the LAN adapter Ethernet 10/100Base-T.Use a twisted-pair cable to connect this device to the hub (central computer) of your LAN. The maximum length of the cable connecting the terminal and the hub is 100 m. Communica-tions using TCP/IP as the LAN interface protocol are supported.

Appendix 5 TerminologyA12
Power factor (PF/DPF)
Power factor is the ratio of effective power to apparent power. The larger the absolute value of the power factor, the greater the propor-tion of effective power, which provides the power that is consumed, and the greater the efficiency. The maximum absolute value is 1. Conversely, the smaller the absolute value of the power factor, the greater the proportion of reactive power, which is not consumed, and the lower the efficiency. The minimum absolute value is 0.A positive value (LAG) indicates that the current phase is lagging the voltage. Inductive loads (such as motors) are characterized by lagging phase. A negative value (LEAD) indicates that the current phase is leading the voltage. Capacitive loads (such as capacitors) are characterized by leading phase.This is the same measurement method used by reactive power meters installed at commercial-scale utility customers' facilities.Displacement power factor, or DPF, is typically used by the electric power system, although power factor, or PF, is sometimes used to measure equipment in order to evaluate efficiency.When a lagging phase caused by a large inductive load such as a motor results in a low displacement power factor, there are correc-tive measures that can be taken to improve the power factor, for example by adding a phase advance capacitor to the power system. Displacement power factor (DPF) measurements can be taken under such circumstances to verify the improvement made by the phase advance capacitor.
Power factor demand value
The power factor calculated using the active power demand value (consumption) and the reactive power demand value (lag) for the set interval time (usually 30 minutes).
PFdem=
Reactive power
Power that does not perform actual work, resulting in power con-sumption as it travels between the load and the power supply. Reactive power is calculated by multiplying the active power by the sine of the phase difference (sin θ). It arises from inductive loads (deriving from inductance) and capacitive loads (deriving from capacitance), with reactive power derived from inductive loads known as lag reactive power and reactive power derived from capacitive loads known as lead reactive power.
Reactive power demand value
The average reactive power used during a set period of save inter-val time (usually 30 minutes).
RMS value The square root of the squares of 1,024 sampling points in a 200 ms interval.
SD memory card A type of flash memory card.
Text data A file containing only data expressed using characters and charac-ter codes.
(Pdem+)2+(Qdem_LAG)2Pdem+

Appendix 5 TerminologyA13
付録
Appendix
Total harmonic distortion factor
THD-F: The ratio of the size of the total harmonic component to the size of the fundamental wave, expressed as a percentage using the following equation:
THD-F =
(for the PW3365, calculated to the 13th order)This value can be monitored to assess waveform distortion for each item, providing a yardstick that indicates the extent to which the total harmonic component is distorting the fundamental waveform. As a general rule, the total distortion factor for a high-voltage system should be 5% or less; it may be higher at the terminal point of the system. THD-R:The ratio of the size of the total harmonic component to the size of RMS values, expressed as a percentage using the following equa-tion:
THD-R =
(for the PW3365, calculated to the 13th order)THD-F is typically used.
USB
An interface that allows data to be sent to and received from a host controller (usually a computer) to which a device is connected with a USB cable. Consequently, functions are unable to communicate directly.
∑(from 2nd order)2
Fundamental waveformx 100 [%]
∑(from 2nd order)2
RMS values x 100 [%]

Appendix 5 TerminologyA14

IndexIndex 1
Index
Number3169-20/21 ...............................................A 7
AAC adapter ............................................41Active energy ..............................101, 105Active power ..........................65, 101, 104Active power value ................................65Amount of space used ........................132Apparent power ............ 75, 101, 104, A 11Average .................................................79
BBacklight ................................................89Battery .....................................25, 32, 207Beep sound ...........................................89B-type grounding wire ...........................62
CCard reader .........................................148Carrying case ..........................................4CHARGE ...............................................34Clamp Sensor .......................................11Clamp sensor ............................30, 43, 73Clips ......................................................28Clock .....................................................36Consumption .......................................105CT .........................................................73CURRENCY ..........................................77Currency ................................................76Current ..................................................24Current phase .......................................69Current range ......................51, 52, 63, 73Current sensor input terminals ........20, 55
DDefault .............................................93, 94Default gateway ..................................170Default settings .....................................36Demand .........................................79, 106Demand quantity .................................163demand value ......................................163Displacement power factor ......65, 75, 101
Display color ......................................... 90DPF .................................65, 75, 101, A 12
EEnergy ........................................ 101, 105Energy cost ........................................... 76Enlarge ............................................... 111Error indication .................................... 227Exceeds the peak ................................. 24Excel ................................... 147, 155, 166Exponential ......................................... 165
FFactory defaults .................................... 93Factory reset ................................... 36, 93Factory settings .................................... 94File ................................................ 81, 131Folder ............................................ 81, 131Format .......................................... 38, 145Frequency ..................................... 72, 101Fundamental wave ....................... 75, 102Fundamental wave apparent power ..... 75Fundamental wave reactive power ....... 75
HHARDCOPY ....................................... 139Harmonic content percentage ............. A 11Harmonic graph .................................. 107Harmonic list ....................................... 108Harmonics ...................................197, A 11Help ...................................................... 71HOLD .................................................... 97How much recording time remains ....... 24HTTP server ................................. 24, 182
II only ..................................................... 49Inspection ............................................. 37INTERNAL ............................................ 78Internal memory ...................... 24, 78, 131Internet browser .................................. 182Internet explorer .................................. 182INTERVAL .................................... 83, 120
Index

IndexIndex 2
Interval time .................................. 83, 120IP address ........................................... 170
KKey lock .......................................... 18, 24
LLAG ......................................................... A 12Lag .......................................................... A 12LAN ............................................... 24, 167LAN cable ........................................... 169Language ........................................ 35, 90Lead ........................................................ A 12Leakage current .............................. 50, 62Line current .............................................. A 2Line voltage .......................................... 48Line-to-line voltage ................................. A 2
MMAC address ................................ 20, 170Making connection ................................ 43Mass storage ...................................... 151Maximum .............................................. 79Measurement ........................................ 97Measurement categories ........................ 8Measurement file ................................ 157Measurement guide ................................ 2Measurement is not possible 24, 115, 164Minimum ............................................... 79
OOver-range .................................... 24, 115
PPassword ............................................ 184Peak ............................................ 102, 189PF .......................... 65, 75, 101, 104, A 12Phase advance capacitor ............ 70, A 12Phase advancer .................................... 69Phase angle of the fundamental wave 102Phase difference ................................... 69Phase name .......................................... 90Phase to neutral voltage ........................ A 2Phase voltage ....................................... 48Power .......................................... 101, 104Power factor ........... 65, 75, 101, 104, A 12Power factor demand value ....... 164, A 12Power logger viewer ........................... 153
Power outage ......................................125POWER switch ......................................42PT ....................................................43, 74
QQuick set .......................................91, 127
RReactive power ............ 75, 101, 104, A 12REC START ........................................118REC STOP ..........................................121Recording ............................................117Recording and measurement ..............117Recording start ..............................83, 117Recording stop ....................................117Regeneration .......................................105Removable disk ...........................149, 151REPEAT ..............................................124RMS ......................................75, 101, 102
SSampling ...................................................A 1Save destination ....................................78Save interval .........................................78Save item ..............................................79Save items ............................................79Save to... ...............................................78Screen color ..........................................90Screen Copy .........................................18Screen copy ..........................80, 131, 139SD CARD ..............................................78SD memory card .......24, 38, 78, 131, 147Self-test .................................................42Serial number ..................................20, 91SET.LOAD ..................132, 133, 141, 142Settings .................................................71Settings data .......................................131Settings files ................................140, 141Spiral tube ...................................2, 28, 55Stop recording ...............................87, 121Storage time ..........................................78Subnet mask .......................................170System ..................................................89System reset .........................................92
TTHD .................................... 107, 108, A 13Total harmonic distortion ...77, 107, 108, A

IndexIndex 3
Index
13Transporting ....................................3, 224Trend ...................................................113
UUnit cost ................................................76USB ...............................................24, 167USB Drive ...................................132, 151USB driver ...........................................168
VVersion ..................................................91Virtual neutral point .................48, A 2, A 5Voltage ................................................101Voltage phase .......................................68Voltage range ........................................74Voltage sensor ............................2, 28, 43Voltage sensor input terminals ........20, 53Voltage transformer ...............................74VT ....................................................43, 74
WWaveform ..............................................80Waveforms ..........................................109Wire current ...........................................48Wireless LAN ......................................169Wiring ....................................................72Wiring check ..........................................65Wiring diagram ......................................45

IndexIndex 4

保証書
HIOKI E.E. CORPORATION


