pvg a sset managementpvgassetmanagement.com/pdf/equity_income_marketing_deck.pdfpvg asset management...
TRANSCRIPT

P V G A S S E T M A N A G E M E N T
L O S S AV E R S E I N V E S T I N G
W W W . P V G A S S E T M A N A G E M E N T . C O M
LOSS AVERSE EQUITY INCOME
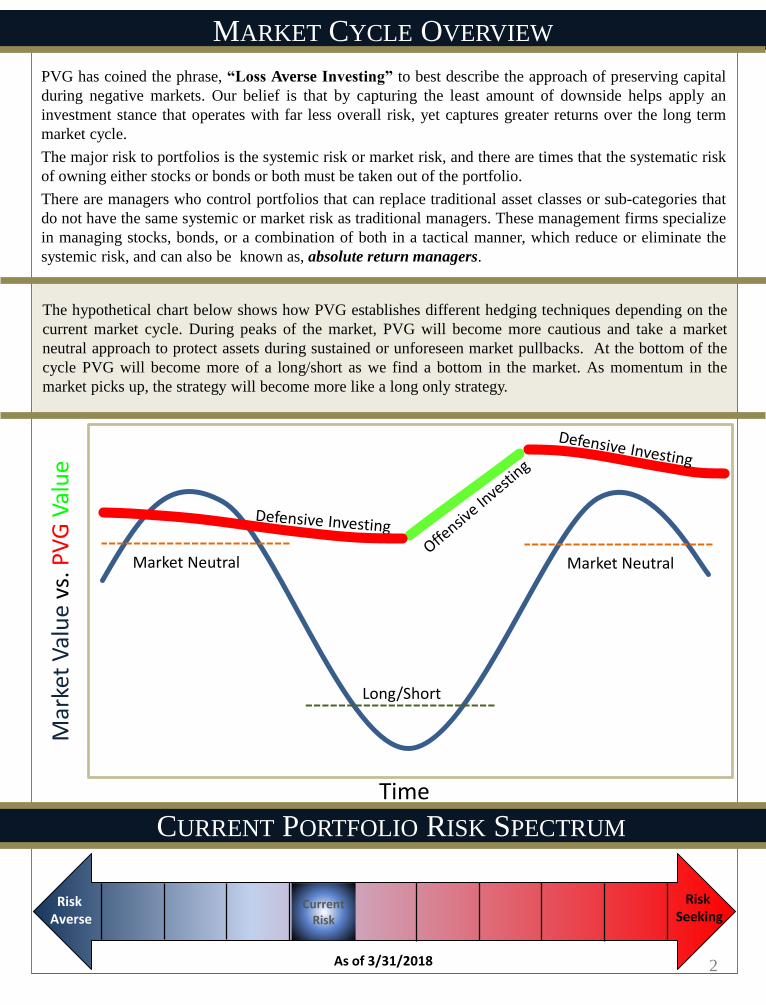
The hypothetical chart below shows how PVG establishes different hedging techniques depending on the
current market cycle. During peaks of the market, PVG will become more cautious and take a market
neutral approach to protect assets during sustained or unforeseen market pullbacks. At the bottom of the
cycle PVG will become more of a long/short as we find a bottom in the market. As momentum in the
market picks up, the strategy will become more like a long only strategy.
PVG has coined the phrase, “Loss Averse Investing” to best describe the approach of preserving capital
during negative markets. Our belief is that by capturing the least amount of downside helps apply an
investment stance that operates with far less overall risk, yet captures greater returns over the long term
market cycle.
The major risk to portfolios is the systemic risk or market risk, and there are times that the systematic risk
of owning either stocks or bonds or both must be taken out of the portfolio.
There are managers who control portfolios that can replace traditional asset classes or sub-categories that
do not have the same systemic or market risk as traditional managers. These management firms specialize
in managing stocks, bonds, or a combination of both in a tactical manner, which reduce or eliminate the
systemic risk, and can also be known as, absolute return managers.
MARKET CYCLE OVERVIEW
2
CURRENT PORTFOLIO RISK SPECTRUM
Risk Averse
Risk Seeking
As of 3/31/2018
Current Risk
Market Neutral Market Neutral
Mar
ket
Val
ue
vs. P
VG
Val
ue
Time
Long/Short

Traditional asset class models are typically set up between stocks and bonds. A
moderate investor may use a 60/40 blend - 60% stocks and 40% bonds.
MODERN PORTFOLIO THEORY
This theory suggests that it’s possible to create an optimal portfolio along the efficient
frontier which will offer the maximum expected return for a given level of risk.
Traditional strategies have implemented a partial stock and bond strategy in applying
this theory.
LOSS AVERSE EQUITY INCOME
This strategy could offer a substitute for the traditional Bond or Stability of Principal
asset classes, as well as a substitute for an Income Focused Stock Portfolio. This
strategy carries an income mandate of a 4%-6% Dividend Yield, and an emphasis on
Capital Preservation and Risk Management. This strategy has the flexibility to
allocate between stocks, cash and inverse ETF’s.
3
WHERE DOES LOSS AVERSE INVESTING FIT?
Why Allocate to PVG?➢ All asset classes may fall during bear markets
➢ Stocks and Bonds are at all time highs and both may have systemic risk
➢ Investors need to be able to manage risk against the asset class inwhich they invest in by hedging, i.e. inverse ETFs or cash
➢ To be invested in the financial markets and preserve wealth withouttraditional market fluctuations
Stocks
Bonds
PVG
PVG – ALTERNATIVE 33% STOCKS/33% BONDS/33% PVG
Stocks
Bonds
MODERN PORTFOLIO THEORY 60% STOCKS/40% BONDS
Alternate Sample PVG Allocation

INVESTMENT OBJECTIVE
This strategy seeks high current
income, an attractive total return, as
well as protection from turbulent
financial markets. By combining
security selection and risk management,
PVG strives to generate an annual
distributable income of 4% to 6%, in
addition to capital appreciation over
time.
The Equity Income Strategy is suitable
for income oriented investors, who also
seek appreciation, but are
uncomfortable with substantial stock or
bond market risks.
STATISTICS
S&P 500BARCLAY AGG
BOND
BETA 0.24 0.99
R2 0.16 0.17
UPSIDE CAPTURE 29.83 99.84
DOWNSIDE CAPTURE 13.40 75.96
MAX DRAWDOWN
(QUARTERLY)-11.11%
MAX RUN UP
(QUARTERLY)13.44%
ANNUAL RETURNS (NET OF FEES)
MARCH 31 20181 YEAR 3 YEAR 5 YEAR 10 YEAR INCEPTION
EQUITY INCOME -5.65% -2.23% -2.66% 3.07% 4.68%
BARCLAY
AGGREGATE
BOND INDEX
1.25% 1.28% 1.87% 3.66% 4.54%
S&P 500 TR 14.00% 10.66% 13.23% 9.44% 8.50%
DIVIDEND YIELD: 5.6%
PERFORMANCE
4
75K
100K
125K
150K
175K
200K
225K
250K
275K
300K
325K
350K
375K
400K
Nov '01 Nov '02 Nov '03 Nov '04 Nov '05 Nov '06 Nov '07 Nov '08 Nov '09 Nov '10 Nov '11 Nov '12 Nov '13 Nov '14 Nov '15 Nov '16 Nov '17
Equity Income - Growth of $100,000
EQUITY INCOME Barclay Bond Index S&P 500
0.9%
10.2%
24.0%
4.0%
9.8%
1.1%
-4.0%-6.1%
6.7%
-5.1%
5.2% 5.9%6.5% 7.8%
4.2%
-2.0%
5.9%
0.6%
2.8%
3.7%
-37.0%
26.5%
15.1%
2.1%
16.0%
32.4%
13.7%
1.4%
12.0%
21.8%
-40%
-20%
0%
20%
40%
2008 2009 2010 2011 2012 2013 2014 2015 2016 2017
Equity Income Barclay Bond Index S&P 500 Index

QTR 1 QTR 2 QTR 3 QTR 4 ANNUAL BARCLAY
BOND
INDEX
S&P 500GROSS NET GROSS NET GROSS NET GROSS NET GROSS NET
2018 -1.96 -2.31 -1.96 -2.31 -1.54 -0.76
2017 -1.47 -1.80 -0.66 -1.00 -1.61 -1.96 -0.13 -0.49 -3.82 -5.14 3.73 21.83
2016 1.93 1.59 3.91 3.55 4.12 3.78 -1.92 -2.25 8.17 6.71 2.79 11.96
2015 -0.34 -0.65 -1.84 -2.16 -5.26 -5.55 2.62 2.29 -4.90 -6.09 0.58 1.38
2014 1.47 1.22 0.65 0.35 -2.22 -2.52 -2.77 -3.08 -2.91 -4.03 5.88 13.70
2013 3.33 3.06 -2.27 -2.51 0.16 -0.07 0.91 0.68 2.05 1.08 -2.02 32.44
2012 3.73 3.37 2.28 1.92 3.80 3.43 1.05 0.74 11.30 9.76 4.22 16.00
2011 -0.22 -0.51 2.24 1.89 -4.09 -4.44 7.35 6.98 5.04 3.97 7.84 2.11
2010 0.45 0.29 11.61 11.41 9.41 9.29 1.74 1.54 24.41 23.99 6.54 15.06
2009 -4.65 -4.86 13.67 13.44 6.91 6.66 -4.07 -4.30 11.16 10.17 5.93 26.46
2008 4.51 4.26 3.36 3.12 -10.91 -11.11 5.77 5.52 1.79 0.85 5.24 -37.00
2007 1.44 1.19 -3.01 -3.26 2.76 2.52 -2.58 -2.81 -1.50 -2.47 6.97 5.49
2006 0.39 -0.63 0.25 -0.01 3.56 3.28 0.85 0.60 4.29 3.24 4.33 15.79
2005 -0.32 -0.54 3.04 2.80 3.24 3.00 0.33 0.10 6.39 5.36 2.43 4.91
2004 4.56 4.28 -5.41 -5.67 3.30 3.09 0.88 0.65 3.07 2.35 4.34 10.88
2003 9.98 9.71 5.30 5.03 2.05 1.82 5.39 5.18 24.55 21.74 4.10 28.68
2002 4.25 3.98 -0.55 -0.80 -0.09 -0.35 6.79 6.55 10.62 9.38 10.26 -22.10
2001 3.33 3.04 3.33 3.04 8.43 -11.89
EQUITY INCOME COMPOSITE RETURNS
5*Performance disclosures for the Equity Income strategy can be found on page 8.

PORTFOLIO HOLDINGS
AS OF QUARTER END – MARCH 31, 2018*
Portfolio Allocation Weight
ProShares UltraShort S&P 500 (sds) 8.5
PROSHARES TRUST ETF ULTRASHORT 20+
(tbt) 1.5
Short S&P500 ProShares (sh) 7.0
Total Hedge 18.5
Cash 1.35%
LOSS AVERSE EQUITY INCOME HOLDINGS
6
Common Stock Holdings Income Stock Holdings
Positions %
MEDLEY CAPITAL CORP (mcc) 4
ARES CAPITAL CORP (arcc) 4
ALPS ALERIAN MLP ETF (amlp) 4
Whitestone Reit (wsr) 3.8
SELECT INCOME REIT (sir) 2.5
Sr. Housing Properties Trust (snh) 2.5
BP PLC SPONS ADR (bp) 2
Independence Realty Trust, Inc. (irt) 2
New Senior Investment Group Inc. (snr) 1.5
CENTURYLINK INC (ctl) 1.5
Apollo Investment Corp (ainv) 1.5
Global Medical REIT, Inc. (gmre) 1.3
Uniti Group Inc. (unit) 1
Oaktree Specialty Lending Corp. (ocsl) 1
HCP Inc. (hcp) 1
CBL & ASSOC PROPERTIES REIT INC (cbl) 0.7
Prospect Capital Corp. (psec) 0.7
Two Harbors Investment Corp (two) 0.7
Triplepoint Venture Growth Corp (tpvg) 0.6
Solar Capital Ltd. (slrc) 0.5
Ladder Capital Corp. (ladr) 0.5
CYS INVESTMENTS INC (cys) 0.5
Arlington Asset Investment (ai) 0.5
LEXINGTON REALTY TRUST REIT (lxp) 0.5
Solar Senior Capital Ltd. (suns) 0.5
Granite Point Mortgage Trust (gpmt) 0.1
Position %
IShares S&P 100 ETF (oef) 3.0
PEPSICO INC (pep) 2.5
CAMPBELL SOUP COMPANY (cpb) 2
CVS Health Corp (cvs) 2
AT&T, Inc.(t) 2
The Walt Disney Company (dis) 2
iPath Bloomberg Coffee SubTR (jo) 2
Merck & Company Inc. (mrk) 2
Procter & Gamble Co. (pg) 2
Telefonica, S.A. (tef) 1.5
ROCHE HOLDINGS LTD ADR (rhhby) 1.5
Walgreens Boots Alliance Inc. (wba) 1.5
Olin Corp. (oln) 1.5
KINDER MORGAN INC DEL (kmi) 1.5
CITIGROUP INC COM (c) 1.5
AMC Entertainment Holdings Inc (amc) 1.25
Intel Corp (intc) 1
Eli Lilly (lly) 1
HOME DEPOT INC (hd) 1
TIME WARNER INC (twx) 1
GLAXOSMITHKLINE PLC-ADR (gsk) 0.8
OWENS & MINOR INC NEW (omi) 0.7
HESS CORPORATION (hes) 0.5
WELLS FARGO COMPANY (wfc) 0.5
J M SMUCKER CO (sjm) 0.5
TARGET CORP (tgt) 0.5
NUCOR CORP (nue) 0.5
Exxon Mobil Corporation (xom) 0.5
ANADARKO PETROLEUM CORP (apc) 0.5
LOWES COMPANIES INC (low) 0.5
UNITED PARCEL SERVICE INC (ups) 0.5
Office Depot Inc (odp) 0.5
COCA-COLA COMPANY (ko) 0.5
Verizon Communications (vz) 0.5
Marvell Tech Group (mrvl) 0.5
MACY'S INC (m) 0.5
17.00
39.00
1.5042.50
Portfolio Allocation
Common Stocks
Income Stocks
Cash
Hedge
*Portfolio Holdings may not reflect the current holdings of the Equity Income strategy.

PROACTIVE AND REACTIVE HEDGING TECHNIQUES
7
Proactive – Hedging Portfolios
Inverse ETF’s
• Broad Market ETF’s Only
• Portfolios are never net short
Reactive – Stop Losses
Placed on Individual Securities (When hedge is not in place)
Stop Loss Value
• Tighter stop on more mature valuations
• Looser stop on undervalued securities
Goal
Risk Reduction not Maximum Returns
• Designed to prevent portfolio losses of 10% or more
Fundamental Analysis
Multifactor Macro Indicators
Market Cycle Analysis
Valuation Analysis
Technical Indicators
Sentiment Indicators
Trend Analysis
Chart Analysis
Goal
Overall portfolio beta and risk
reduction
FACTORS THAT DRIVE PVG HEDGING
PVG reduces undiversifiable market volatility and risk by hedging portfolios with inverse market index
securities, stop losses and cash positions. Hedging tactics are utilized to reduce overall volatility of the
portfolio, and may also result in minimizing losses that may occur in an unfavorable cyclical or secular
market.
PVG utilizes both fundamental analysis and technical indicators to drive the hedging of the strategy. The
main focus is derived from the valuation analysis of our universe of stocks as well as the trend and chart
analysis in the overall market. Our goal is to reduce the risk of the overall portfolio when the analysis and
indicators give us a signal.

6898 S. University Blvd. | Centennial, CO 80122 | 800-777-0818
Investing with an
Capital Preservationemphasis on
P V G A S S E T M A N A G E M E N T
L O S S AV E R S E I N V E S T I N G
WWW.PVGASSETMANAGEMENT.COM
Are Not FDIC Insured Are Not Bank Guaranteed May Lose Value
Investment Products:
Performance results are presented in U.S. dollars and are net-of-actual-management fees and trading expenses of the composite and reflect the reinvestment of dividends
and capital gains. Actual fees may vary based on, among other factors, account size and custodial relationship. *Annual returns are compounded over the specified
period. The current dividend yield is calculated gross of fees as of quarter end date and is the expected forward yield. No current or prospective client should assume
future performance of any specific investment strategy will be profitable or equal to past performance levels. All investment strategies have the potential for profit or
loss. Changes in investment strategies, contributions or withdrawals may cause the performance results of your portfolio to differ materially from the reported composite
performance. Different types of investments involve varying degrees of risk, and there can be no assurance that any specific investment will either be suitable or
profitable for a client's investment portfolio. PVG’s Portfolio Risk Spectrum is based off a number of factors including portfolio structure, holdings, weighting and risk
measures. It is not meant to define the client’s risk profile or appetite when investing with PVG. The Portfolio Risk Spectrum may change from the current position at any
time depending on the factors stated for measurement. Historical performance results for market indices generally do not reflect the deduction of transaction and/or
custodial charges or the deduction of an investment-management fee, the incurrence of which would have the effect of decreasing historical performance results.
Economic factors, market conditions, and investment strategies will affect the performance of any portfolio and there are no assurances that it will match or outperform
any particular benchmark. Portfolios in the composite utilize levered index products. Leveraged ETFs are considered risky. The use of leverage strategies by a fund
increases the risk to the fund and magnifies gains or losses on the investment. You could incur significant losses even if the long-term performance of the underlying
index showed a gain. Most leveraged ETFs “reset” daily. Due to the effect of compounding, their performance over longer periods of time can differ significantly from
the performance of their underlying index or benchmark during the same period of time. Exchange traded funds (ETFs) are offered by prospectus only. Investors should
consider a fund’s investment objective, risks, charges, and expenses carefully before investing. The prospectus, which contains this and other important information, is
available from your Financial Advisor and should be read carefully before investing. The investment return and principal value of an investment will fluctuate, so that an
investor’s shares, when redeemed, may be worth more or less than their original cost. ETFs trade like stocks and may trade for less than their net asset value. The
S&P500 Total Return Index is the total return version of the S&P 500 Index which includes the effects of reinvested dividends. The S&P 500 Index is a capitalization-
weighted index of 500 stocks designed to measure performance of the broad domestic economy through changes in the aggregate market value of 500 stocks representing
all major industries. The U.S. Aggregate Bond Index is a broad-based benchmark that measures the investment grade, U.S. dollar-denominated, fixed-rate taxable bond
market, including Treasuries, government-related and corporate securities, MBS (agency fixed-rate and hybrid ARM passthroughs), ABS, and CMBS. The U.S.
Aggregate rolls up into other Barclay’s flagship indices, such as the multi-currency Global Aggregate Index and the U.S. Universal Index, which includes high yield and
emerging markets debt. The U.S. Aggregate Index was created in 1986, with index history backfilled to January 1, 1976.The investment strategy and types of securities
held by the comparison indices may be substantially different from the investment strategy and the types of securities held by the PVG Equity Income strategy. PVG Asset
Management (“PVG”) is a registered investment advisor with the United States Securities Exchange Commission (the “SEC”). SEC registration does not constitute an
endorsement of the firm by the Commission nor does it indicate that the advisor has attained a particular level of skill or ability. Inception for the Equity Income strategy
is 10/1/2010; prior performance represents the Income portion of the Balanced Strategy Composite, which PVG believes was managed with the same investment goals.
Composite performance represents the results of the PVG management team, which has changed over time due to retirements and new staff. Additional information is
available upon request.