pvaas faculty presentation
TRANSCRIPT

Kane Area School District

Kane Area School District
Pennsylvania Added Assessment System
(PVAAS)
GOALS FOR TODAY…
1.What?
2.How?
3.Why?

Kane Area School District
-PVAAS – PA Value-Added Assessment System
-Value-added analysis is a statistical method used to measure the influence of a district and school on the progress of individual students.
-The method uses previous test score data to plot a “growth pattern” for students.
-Value-added data can also be used to project future academic performance. Projections help teachers identify students who are at risk or need to be challenged.
Source: PA Dept of Education
You
said?

Kane Area School District
Does grade level curriculum allow for students starting behind to catch up with others?
Did the instructional strategies meet the needs of the students?
Did all students have an opportunity to make progress from where they started the year?
Howcould PVAAS be
used?
Source: PA Dept of Education
Kane Area School District
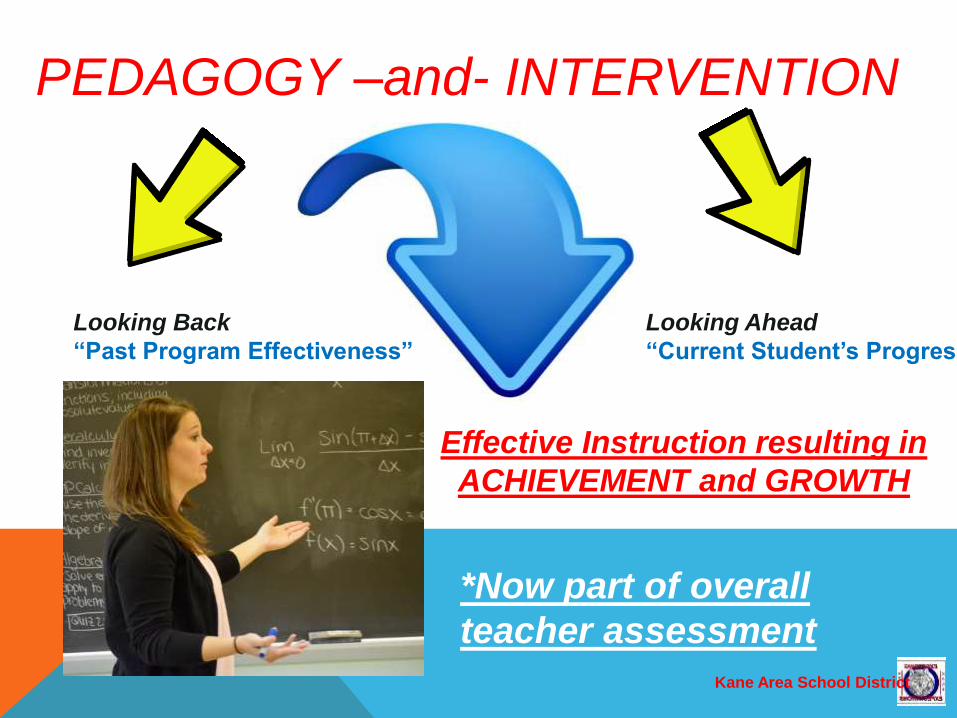
PEDAGOGY –and- INTERVENTION
Looking Back
“Past Program Effectiveness”
Looking Ahead
“Current Student’s Progress
Effective Instruction resulting in
ACHIEVEMENT and GROWTH
*Now part of overall
teacher assessment

Kane Area School District
ACHIEVEMENT & GROWTH
ACHIEVEMENT DATA GROWTH DATA
Measures student
performance
At a single point in time
Measures student’s progress
across time and across and
across grade levels
P
V
A
A
S

Kane Area School District
ACHIEVEMENT & GROWTHCompares student’s
performance to a
standard
Compares student’s
performance to their prior
academic
history/performance.
Significant relationship
between demographics and
growth of student progress.
ACHIEVEMENT DATA
GROWTH DATA
P
V
A
A
SBOTH
Critical to ensuring future
academic success of the
students
ACHIEVEMENT & GROWTH
NO
NO
Remember

Kane Area School District
*Hence……..All students from all backgrounds
can learn--(Demonstrate Growth)
PVAAS does not compare the percentages of
students at various PSSA perfomance levels to
measure growth.

Kane Area School District
HIGHER
ACHIEVING
Students should not
lose ground
academically.
MIDDLE
ACHIEVING
LOWER
ACHIEVING
So……what is a
reasonable goal?

Kane Area School District
Is it good to
maintain the
achievement/
growth level?
IS GOOD-----GOOD
ENOUGH?

Kane Area School District
PVAASPotential
Positives
-System benefits
middle level learners.
-System benefits
higher level learners.
-System benefits
lower achieving
learners.
Potential
Negatives
-System does not
benefit the students
right below
proficiency.
PVAAS
Positives outweigh the negatives. We need to
address the “bubble kids”

Kane Area School District
GOAL- EXCEEDING
EXPECTATIONS!
GOAL- EXCEEDING
EXPECTATIONS!
PVAAS PERFORMANCE DIAGNOSTIC GROWTH
DESCRIPTORS
-Interpretation…What do the “colors” tell us?
1. Green- Met standards for academic growth.
2. Blue- Exceeded Standards for academic growth.
3. Red- Did not meet expectations of standards for
academic growth.

Kane Area School District
HOW CAN WE USE PVAAS TO VIEW GROWTH
PATTERNS IN THE KANE AREA SCHOOL DISTRICT?
Across subjects Across Grades Across Different
Groups
-Determine the necessary strategies for the school.
-Determine where resources are most-needed and
distributed.
-To determine what needs improvement???
1.Is the curriculum aligned?
2.Is pedagogy what it should be?
3.Are there specific student problems?
4.Is there a lack of resources?
How often do you reflect on your pedagogy?

Kane Area School District
SPECIFIC INDICATORS OF PVAAS
-If nothing changes with instructional delivery
and curriculum- kids are at a disadvantage…they will not grow.
-We need to
look at the
predictors-
where kids are
projected to
score.
What is the best
approach?

Kane Area School District
START WITH: School Performance Diagnostic Report
-Gives the most information for Instructional Implications.
Looking at the report:
-The green line is most significant- on the green line means
they did not lose ground.
-Above the green line is exceeding expectations.
-Below the green line is losing ground.
Remember—PVAAS has reports that look forward and
backward.
Trends?

Kane Area School District
Yes, there are trends- patterns:
-THERE ARE SIX DIFFERENT PATTERNS:
1- Shed Pattern- A lot of growth with BELOW BASIC students,
but ADVANCED students are below the green line. Indicates
interventions working but need for more rigor.
2- Reverse Shed Pattern- Below Basic kids losing ground and
advanced kids increasing.
3- Tent Pattern- BELOW BASIC kids drop and ADVANCED is
below green line. Middle kids showing growth.
Why? We tend to teach to the middle. Differentiation needed.
4- V Pattern- A lot of interventions- a lot of enrichment- But not
focusing on the core.
5- Opportunity Gap Pattern- Everyone growing but one group-
could happen at any level- still tells where focus is needed.
6- Desirable Pattern- Where Below Basic is making most gain-
and everyone is moving up at every level.

What’s
Next?
Use the data:It is part of good teaching practices.
-Understanding our data
-Knowing Instructional Practices to put in place.
-Have conversations within the data teams,
helping each other to help our kids grow.
At KASD:
Data Teams- Include support personnel
Data Talks With Students
---From Teachers
---From Principals
We need to get students and parents to have that A Ha
Moment!
Kids need to hear:
-We have the data.
-It can help…
-We will work together for success!
-Data Chats- Specific talk about data and school-home
partnerships.
-How about a new look for parent-teacher conferences?
Kane Area School District

Mindset
Also:
Change the traditional
teacher-student
mindsetConversation about data, not about student
failing….
No longer “I failed the test”
or “You failed the test”
-How can we do better to support
you?
What is going on?
What does the data say?
Kane Area School District
-How can we create data conversations without intimidation?
-The data pinpoints the standards to work on.
-What does it take to get to the next level?
Collaborative
Data Continuous
Environment

What we know is------------------It is about EVERY SINGLE CHILD that walks through that classroom door.
Every student needs:
Focused
Intentional
Instruction
By the individual
teacher and the data
team.
Kane Area School District
*Keep in mind- data
teaming is not about
scores.
Collaborative
Data
Environment
It is about cause
and effect.
Next
Presentation:
Data
Teaming.

So…
Simply
Put
Kane Area School District
PVAAS will:-Monitor growth of student
-Help identify trends between grade levels, buildings, and cohort of groups.
-Point out trouble areas before it is too late
-Predict future performance
Even Simpler?
PVAAS will:Help us identify where problems are or will be

What’s
next?
Kane Area School District
With building adminsHyperlink:
PVAAS
Hyperlink:OnHand Schools

Kane Area School District
3-2-1
3 Things you learned
2 Interesting facts
1 Question I still have
P
V
A
A
S