pv training module - ortho clinical...
TRANSCRIPT

Part No. J04498Cat No. 680 0325
Performance Verifiers: Training Module

Export authorized under general license GTDA (General Technical Data Available)
IMPORTANT
The information contained herein is based on the experience and knowledge relating to the subject matter gained by Ortho-Clinical Diagnostics, Inc. prior to publication.
No patent license is granted by the information.
Ortho-Clinical Diagnostics, Inc. reserves the right to change this information without notice, and makes no warranty, express or implied, with respect to the information. The company shall not be liable for any loss or damage, including consequential or special damages resulting from the use of this information, even if loss or damage is caused by its negligence or other fault.
VITROS is a trademark of Ortho-Clinical Diagnostics, Inc.
Ortho-Clinical Diagnostics, Inc., 1997 - 2007. All rights reserved.

Revision History
Revision Date Description
2007-06-25 Added all MicroTip Drugs of Abuse Testing (DAT) Assays.
2006-03-31 Added all MicroTip and MicroSlide Assays and Performance Verifiers that have become available since last release.
8/99 Company name changed to Ortho-Clinical Diagnostics, Inc., a Johnson & Johnson Company.
Part No. J04498 Performance Verifiers2007-06-25 VITROS Chemistry Systems iii
List of Revised PagesEach page in your guide should be at the date listed below:
Revision Date Chapter Page
2007-06-25 All Chapters All
2006-03-31 All chapters All
8/99 All chapters All
Performance Verifiers Part No. J04498iv VITROS Chemistry Systems 2007-06-25

About This Training Manual
Purpose
The purpose of this module is to provide information on how VITROS Performance Verifiers can be used to monitor performance of VITROS Chemistry Systems.
For setting up Quality Control files on your VITROS Chemistry System, refer to the Quality Control section of the VITROS 350/250, 250/250AT, 950/950AT Operator’s Guide or the V-DOCs for the 5,1 FS Chemistry System.
Audience
This module is intended for use by customers of Ortho-Clinical Diagnostics using VITROS 350/250/250AT, 950/950AT and 5,1 FS Chemistry Systems.
How This Module Is Organized
This module describes Performance Verifiers, how the range of means and within-lab standard deviations are established, and how Performance Verifiers can be used with VITROS Chemistry Systems.
Additional Training Modules
Statistical Tools of Quality Control
Part No. 7B6006
CAT No. 184 9017
Additional training modules are available on orthoclinical.com. For ordering information, please contact your Ortho-Clinical Diagnostics Laboratory Specialist.
Part No. J04498 Performance Verifiers2007-06-25 VITROS Chemistry Systems v

About This Training Manual
Performance Verifiers Part No. J04498vi VITROS Chemistry Systems 2007-06-25
Contents
Purpose . . . . . . . . . . . . . . . . . . . . . . . . . . . . . . . . . . . . . . . . . . . . . . . . . .v
Audience. . . . . . . . . . . . . . . . . . . . . . . . . . . . . . . . . . . . . . . . . . . . . . . . .v
How This Module Is Organized . . . . . . . . . . . . . . . . . . . . . . . . . . . . . . .v
Additional Training Modules . . . . . . . . . . . . . . . . . . . . . . . . . . . . . . . . .v
Introduction . . . . . . . . . . . . . . . . . . . . . . . . . . . . . . . . . . . . . . . . . . . . . . . .1
Objectives . . . . . . . . . . . . . . . . . . . . . . . . . . . . . . . . . . . . . . . . . . . . . . . . . .2
Definitions . . . . . . . . . . . . . . . . . . . . . . . . . . . . . . . . . . . . . . . . . . . . . . . . .3
What are Performance Verifiers? . . . . . . . . . . . . . . . . . . . . . . . . . . . . . . . .7
How the Range of Means (ROM) is Established . . . . . . . . . . . . . . . . . . . .8
How the Range of Means (ROM) is Used . . . . . . . . . . . . . . . . . . . . . . . . .8
How the Within-lab Standard Deviation (Within-lab SD) is Established . . . . . . . . . . . . . . . . . . . . . . . . . . . . . . . . . . . . . . . . . . . . . . . . .9
How the Within-lab Standard Deviation is Used . . . . . . . . . . . . . . . . . . . .9
Using Performance Verifiers . . . . . . . . . . . . . . . . . . . . . . . . . . . . . . . . . .11
Verifying a New Calibration. . . . . . . . . . . . . . . . . . . . . . . . . . . . . . . . . . .12
Establishing Baseline Means for Performance Verifiers . . . . . . . . . . . . .14
Part No. J04498 Performance Verifiers2007-06-25 VITROS Chemistry Systems vii

Contents
Monitoring System Performance on a Periodic (Monthly) Basis . . . . . . 16
Verifying a Previous Calibration When System Performance May Have Changed . . . . . . . . . . . . . . . . . . . . . . . . . . . . . . . . . . . . . . . . . . . . . . . . . . 18
Verifying a Previous Calibration When No Valid Baseline Mean for Performance Verifiers Has Been Established . . . . . . . . . . . . . . . . . . . . . 20
Appendix 1: Performance Verifier Assay Sheets. . . . . . . . . . . . . . . . . . . 23
Appendix 2: Delta Tables . . . . . . . . . . . . . . . . . . . . . . . . . . . . . . . . . . . . . 25
Appendix 3: Quality Control Worksheets. . . . . . . . . . . . . . . . . . . . . . . . . 37
Exercises . . . . . . . . . . . . . . . . . . . . . . . . . . . . . . . . . . . . . . . . . . . . . . . . . 41
Answer Key . . . . . . . . . . . . . . . . . . . . . . . . . . . . . . . . . . . . . . . . . . . . . . . 51
Performance Verifiers Part No. J04498viii VITROS Chemistry Systems 2007-06-25

Introduction
The purpose of this module is to provide you with recommendations for
using Performance Verifiers to monitor the performance of the VITROS Chemistry System in your laboratory. These recommendations do not, however, exclude alternative approaches to monitoring your system’s performance.Prerequisites for this module are:
• Ability to calculate a mean and standard deviation.
• Ability to define and apply the 12S, 22S, and 13S quality control multi-rules.
If you have not fulfilled these prerequisites, you must complete the following module:
— Statistical Tools of Quality Control Module.
Part No. J04498 Performance Verifiers2007-06-25 VITROS Chemistry Systems 1
Introduction
ObjectivesUpon completion of this module, you will be able to:
• Explain what Performance Verifiers are and how to use them.
• Describe how to establish a mean for each level of Performance Verifier.
• Explain the information found on the assay sheets which accompany the Performance Verifiers.
• Understand Range of Means and Within-lab standard deviation.
• Perform daily quality control using Performance Verifiers.
• Perform calibration verification on a new slide/reagent lot using Performance Verifiers.
• Use Performance Verifiers to monitor your system’s performance periodically.
• Verify pre-existing calibration when there are no valid baseline means available for Performance Verifiers.
This module will take approximately two hours to complete. You will need the following items:
• Pencil
• Calculator
This module contains practice exercises to help you apply the concepts learned. The answer key for the practice exercises is provided.
Performance Verifiers Part No. J044982 VITROS Chemistry Systems 2007-06-25

Definitions
Generation (Gen) is a term used to describe those slide lots that can use
the same Supplementary Assigned Values (SAVs) for calibration. Slide lots from the same generation have the same Range of Means on the assay sheet. The Gen number for each lot of slides is found on the packaging as well as on the side and top labels of individual slide cartridges.Performance Verifier Range of Means (ROM) is a term used to describe the lowest and highest mean values your VITROS Chemistry System should produce for your slide lot. These ranges are specific for a particular Gen of slides. These ranges define the acceptable mean values for any generation of slides. On the assay sheet for Performance Verifiers, each Gen of a particular analyte is listed with its corresponding ROM.
A Baseline SD is the value the VITROS Chemistry System QC software uses in combination with the mean to calculate the 12s, 22s and 13s control rule limits that should be used for your daily quality control decisions.
The Baseline SD that is used to calculate control limits in the VITROS Chemistry System software may be a fixed criteria, such as the within-lab SD from the Performance Verifier assay sheets. This is a calculated SD determined from the laboratory’s experience with the VITROS Chemistry Systems, or your laboratory’s medically useful limits.
The Within-lab SDs on the Performance Verifiers assay sheets were established using monthly within-lab SD for VITROS Chemistry System users participating in a commercial quality control service. These values are
Part No. J04498 Performance Verifiers2007-06-25 VITROS Chemistry Systems 3

Definitions
representative of the performance of properly operating VITROS Chemistry Systems. These values are representative of the performance of properly operating VITROS Chemistry Systems in multiple laboratories using multiple Performance Verifier lots. Additionally, each SD was compared to USA and European proficiency testing goals and adjusted accordingly.
The published within-lab SD includes the variability associated with performing replicate measurements within a day and measurements from one day to the next. The day-to-day variability includes the small variation introduced by different slide cartridges, different vials of control material, multiple calibration events, environmental influences, and preventive maintenance events. These values do not include the variability due to using different slide lot numbers.
A within-lab SD can be calculated from your daily quality control results and compared to the Performance Verifier assay sheets within-lab SD. A calculated laboratory SD larger than the Performance Verifier assay sheets within-lab SD indicates that system troubleshooting may be necessary. If the calculated SD is much smaller than the Performance Verifier assay sheets within-lab SD, you may not have included all of the expected sources of variability or valid QC results may have been excluded from the calculation. If you use this calculated SD as your baseline SD, valid data points may be rejected and troubleshooting may be performed more frequently than needed.
Calibration Verification is a means of assessing whether a calibration is acceptable by using results from each level of Performance Verifiers. At a minimum, these results should be within the ROM for that control.
A Preliminary Baseline Mean is the average of two values run sequentially (two replicates from one cup) immediately after the system is calibrated. This should be done using a fresh vial of PV. This mean is used to verify this calibration. This value should be used as the baseline mean in the VITROS Chemistry System QC software until a more robust estimate of the mean is available (refer to your analyzer Operator’s Guide or VDocs for the 5,1 FS).
If you are not using PVs as your daily QC materials, then record the preliminary baseline mean as a Calibration Verification Mean for use in troubleshooting and verification of a pre-existing calibration.
A Baseline Mean is the average of QC results observed over 20–30 days, and this mean should replace the preliminary baseline mean in VITROS Chemistry System software. It is a better estimate of the true mean than the 2-point preliminary baseline mean (refer to your analyzer Operator’s Guide or VDocs for the 5,1 FS).
Performance Verifiers Part No. J044984 VITROS Chemistry Systems 2007-06-25

Definitions
A Current Mean is the mean value you should use to periodically evaluate the VITROS Chemistry System after you have established a baseline mean and when there is no evidence that anything has happened to alter your system’s performance. The Current Mean will typically be your calculated monthly mean (refer to your analyzer Operator’s Guide or VDocs for the 5,1 FS).
A Current SD is the standard deviation calculated along with your monthly Current Mean (refer to your analyzer Operator’s Guide or VDocs for the 5,1 FS).
A Delta is the absolute difference between any two means. If the Delta is greater than the values in the Delta Tables in Appendix 2, then the two means are different. Depending on your laboratory’s policy and the magnitude of the difference, troubleshooting may be necessary if this is the case.
The values in the Delta tables for n = 2 should also be used as guidelines for acceptable replication of Performance Verifiers in any evaluation.
The delta values in the tables were calculated using standard statistical techniques for the comparison of two means. We used the Performance Verifier assay sheet SD as the basis for this comparison. For small sample sizes (n=2), the calculated deltas assure that the probability of concluding that the means are not different when they truly are, is small. For sample sizes of 20 or more, the calculated deltas assure that the likelihood of saying that the means are different when they are truly not, is small. These choices give laboratory personnel a good balance between the risk of making a certain type of error and the effect that increasing sample size has on the quality of the estimate of the difference between the two means.
Part No. J04498 Performance Verifiers2007-06-25 VITROS Chemistry Systems 5

Definitions
Performance Verifiers Part No. J044986 VITROS Chemistry Systems 2007-06-25
What are Performance Verifiers?
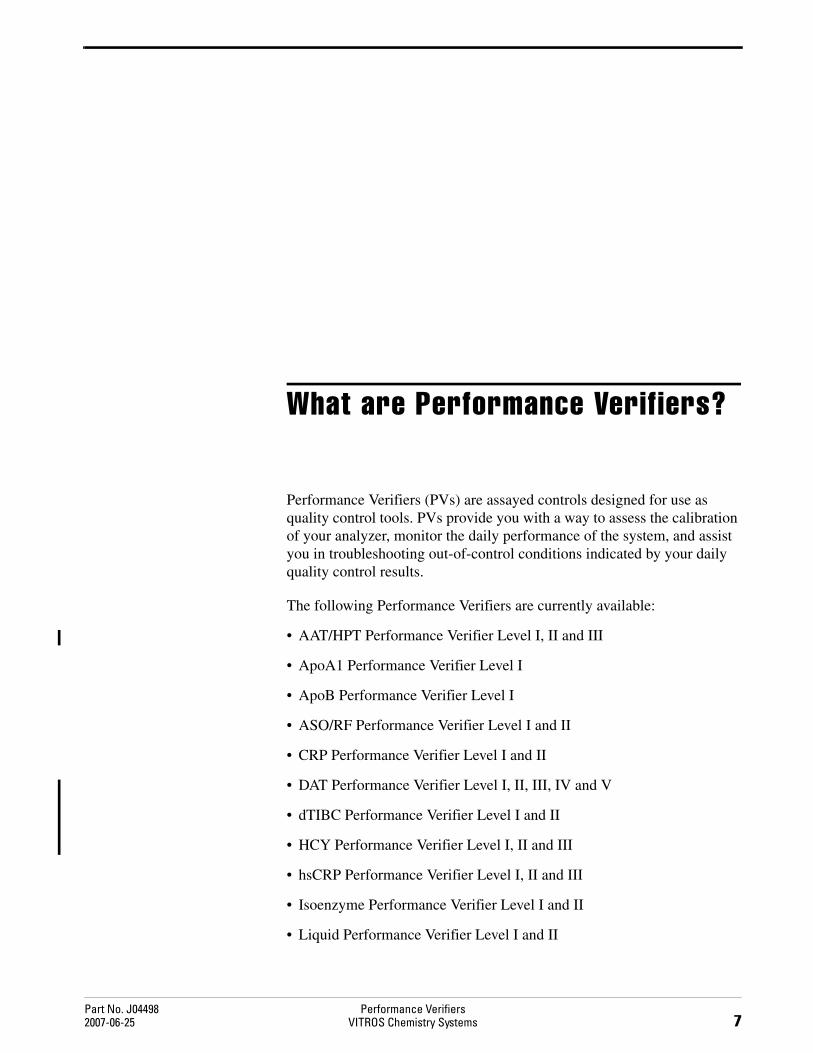
Performance Verifiers (PVs) are assayed controls designed for use as
quality control tools. PVs provide you with a way to assess the calibration of your analyzer, monitor the daily performance of the system, and assist you in troubleshooting out-of-control conditions indicated by your daily quality control results.The following Performance Verifiers are currently available:
• AAT/HPT Performance Verifier Level I, II and III
• ApoA1 Performance Verifier Level I
• ApoB Performance Verifier Level I
• ASO/RF Performance Verifier Level I and II
• CRP Performance Verifier Level I and II
• DAT Performance Verifier Level I, II, III, IV and V
• dTIBC Performance Verifier Level I and II
• HCY Performance Verifier Level I, II and III
• hsCRP Performance Verifier Level I, II and III
• Isoenzyme Performance Verifier Level I and II
• Liquid Performance Verifier Level I and II
Part No. J04498 Performance Verifiers2007-06-25 VITROS Chemistry Systems 7
What are Performance Verifiers?
• mALB Performance Verifier Level I and II
• PALB Performance Verifier Level I and II
• Performance Verifier Level I and II
• Protein Performance Verifier Level I, II and III
• TDM Performance Verifier Level I, II and III
• UPRO Performance Verifier Level I and II
• %A1c Performance Verifier Level I and II
The assay sheet which accompanies these fluids includes the following information for each analyte:
• A generation (Gen-) specific range of means (ROM).
• A recommended within-lab standard deviation (SD).
Appendix 1 shows an example of an assay sheet.
How the Range of Means (ROM) is EstablishedThe width of the ROM (highest mean value minus the lowest mean value) is a fixed parameter. The ROM reflects the performance of properly operating VITROS Chemistry Systems as monitored with Performance Verifiers. The ROM width for each analyte was compared to USA and European proficiency testing goals and adjusted as appropriate. The numerical values that define the ROM for each slide generation are established by collecting data from internal testing performed on multiple analyzers and among different slide lot numbers within the slide generation.
How the Range of Means (ROM) is UsedWhen evaluating the performance of a VITROS Chemistry System using Performance Verifiers, the mean based on two or more replicate measurements of these fluids must be within the ROM to be acceptable.
Since Performance Verifiers are manufactured fluids, they do not have the same physical and chemical characteristics or “matrix” as fresh patient specimens. These differences may cause the results on different slide lots to vary. The term “matrix effects” is commonly used to describe this phenomenon. Matrix effects result in wider ROM than would otherwise be observed.
Performance Verifiers Part No. J044988 VITROS Chemistry Systems 2007-06-25
What are Performance Verifiers?
• The mean of two or more measurements can fall anywhere in the ROM (not necessarily in the center) for that particular slide Gen.
• For calibration verification, the mean of 2 or more replicate measurements of Performance Verifiers (called a Preliminary Baseline Mean) should fall within the ROM listed on the assay sheet.
• When using Performance Verifiers for routinely monitoring a properly operating system, all calculated means should be within the ROM. Each estimate of the mean should be statistically the same as all other estimates of the mean. The assessment of any two means will be discussed later on in this module.
• It is not expected that all individual daily QC values will fall within the ROM even if the system is showing acceptable performance. However, the mean of a distribution of daily QC values for properly operating systems should always fall within the ROM.
How the Within-lab Standard Deviation (Within-lab SD) is Established
The published within-lab SD on the Performance Verifier assay sheets was established using monthly within-lab SD for VITROS Chemistry System users participating in a commercial quality control service. These values are representative of the performance of properly operating VITROS Chemistry Systems in multiple laboratories using multiple Performance Verifier lots. Additionally, each SD was compared to USA and European proficiency testing goals and adjusted as appropriate.
The published within-lab SD on the Performance Verifier assay sheets normally does not change from one lot of Performance Verifiers to another. However, it may be adjusted if the analyte concentration changes significantly. This should not occur very often.
How the Within-lab Standard Deviation is UsedThe baseline SD that is used to calculate control limits in the VITROS Chemistry System software may be a fixed criteria, such as the within-lab SD from the Performance Verifier assay sheets, a calculated SD determined from the laboratory’s experience with the VITROS Chemistry Systems, or your laboratory’s medically useful limits.
We recommend that you use the within-lab SD from the PV assay sheets for your baseline SD and your daily quality control decisions.
Part No. J04498 Performance Verifiers2007-06-25 VITROS Chemistry Systems 9
What are Performance Verifiers?
Some laboratories also calculate the actual SD for the VITROS Chemistry System.
– A calculated laboratory SD larger than the PV assay sheet within-lab SD indicates that system troubleshooting may be necessary.
– If the calculated SD is much smaller than the PV assay sheet within-lab SD, you may not have included all of the expected sources of variability or valid QC results may have been excluded from the calculation. If you use this calculated SD as your baseline, you may be rejecting valid data points and be troubleshooting more frequently than needed.
Performance Verifiers Part No. J0449810 VITROS Chemistry Systems 2007-06-25

Using Performance Verifiers
Performance Verifiers (PVs) can be used:
• To verify calibration.
• As daily quality control materials.
• As tools for troubleshooting.
The flowcharts described below illustrate how to use Performance Verifiers to address circumstances.
Flowchart 1: Verifying a new calibration.
Flowchart 2: Establishing Baseline Means for PVs (Using PVs as daily QC materials).
Flowchart 3: Monitoring System performance on a periodic (monthly) basis.
Flowchart 4: Verifying a previous calibration when system performance may have changed.
Flowchart 5: Verifying a previous calibration when no valid Baseline Means for Performance Verifiers have been established.
Part No. J04498 Performance Verifiers2007-06-25 VITROS Chemistry Systems 11

Using Performance Verifiers
Those laboratories not using PVs as daily QC materials do not need to use flowchart 2. However, it is assumed that these laboratories will have PVs on hand to assist in troubleshooting and calibration verification.
IMPORTANT: To verify a previous calibration when using Performance Verifiers as daily QC, you should always being with Flowchart 3.
Some abbreviated language has been used to keep the flowcharts short and simple. Refer to the Definitions section of this module to find explanations for the some terms you will find in the flowcharts that follow.
Verifying a New CalibrationWhenever the means of two or more measurements of Performance Verifiers, made after a new calibration, are within the ROM, these results reflect the distribution of acceptable calibrations for VITROS Chemistry Systems. The mean for a given combination of analyzer, slide lot, and Performance Verifier lot is not expected to fall in the middle of the ROM for that particular generation of slides.
For verifying calibration immediately following a new calibration, follow these steps (see Flowchart 1):
1. After calibration, measure in duplicate the PV fluid (from the same cup) from freshly reconstituted vials of PV Level I and PV Level II (also PV Level III, if applicable).
2. Calculate the mean for two replicates of each PV fluid. These are the preliminary baseline means.
3. If the preliminary baseline mean values of all Performance Verifiers fall within the range of means, calibration is verified.
Note: In addition, you may prefer to evaluate the performance of the newly calibrated slide lot by comparing it with a previous slide lot or another method. Compare the results of 5 – 10 patient samples run on the current and new slide lots with your laboratory’s analyte-specific evaluation criteria.
4. Input these preliminary baseline means in the analyzer software or record these mean values in your QC system. Appendix 3 contains a Calibration Verification worksheet that can be used to record these values and document your other QC records.
Performance Verifiers Part No. J0449812 VITROS Chemistry Systems 2007-06-25

Using Performance Verifiers
Flowchart 1. Verifying a New Calibration Using Performance Verifiers (PVs)
1 Refer to Definitions. Use the tablethat corresponds to the appropriatePerformance Verifier product.
2 Some accreditation agencies andstate regulations may requireadditional protocols. Comply asrequired.
3 See Appendix 3.
Are these means within the published
Range of Means?
Calibration isverified2.
NeNe
e ser or
Possible reasons to calibrate:• w slide lot• w lot of immuno-wash or
electrolyte reference fluids• Extensiv vice perf med• Result of troubleshooting• Required by regulations
No
Yes
Investigate(see Calibration Protocol
Checklist below)
Calibration Protocol Checklist:• Are materials fresh (slide, calibrators,
fluids, and controls)?• Confirm insert sheet directions for
reconstitution were followed.• Are calibrator responses similar to
previous responses?• Call Technical Support
For each PV calculate themean of these 2 values.
Do you use PVsas your daily
QC materials?
Input these means as yourPreliminary Baseline Means in
the VITROS System softwareor record in your QC system3.
Yes
Record these means in yourQC system3
Calibration Verification means.Noas your
Calibrate Slide/Fluid Lot.
Run fresh vials of PVsin duplicate.
Part No. J04498 Performance Verifiers2007-06-25 VITROS Chemistry Systems 13

Using Performance Verifiers
Establishing Baseline Means for Performance VerifiersIf you intend to use Performance Verifiers as your daily quality control materials, you need to establish a baseline mean. This is necessary because the baseline mean established using additional data points is a better estimate of the true mean than the 2-point preliminary baseline mean. The more data collected to calculate the baseline mean, the more confidence you will have that your calculated mean approaches the true mean.
• To calculate a baseline mean you must run Performance Verifiers for a minimum of 20 days. This length of time will help ensure that multiple vials of Performance Verifiers and multiple slide cartridges are included in this estimate. During this period, you must change the slide cartridges and control fluid vials at least twice.
• We recommend that you establish the baseline mean for a new lot of Performance Verifiers while still using your current lot of Performance Verifiers to make daily QC decisions.
• If you need to use a new lot of Performance Verifiers for daily QC decisions while establishing the baseline mean, use the preliminary baseline mean established during calibration verification and the Within-lab SD as the criteria for making your QC decisions. Also use the 13S rule (only react to the F3 QC flags from the VITROS Chemistry System software) during this period.
• The baseline mean should not differ from the preliminary baseline mean by more than the Delta for n = 2 from Appendix 2. Appendix 3 contains a Baseline Mean Evaluation worksheet to record these values.
See Flowchart 2 for an outline of this process.
Performance Verifiers Part No. J0449814 VITROS Chemistry Systems 2007-06-25

Using Performance Verifiers
Flowchart 2. Establishing Baseline Means for Performance Verifiers
No
1 If possible, evaluate new QC material alongside existing QC material whiledetermining a baseline mean for the new QC material.
2 Lab should use Within-lab standard deviation (SD) from assay sheet. Refer to "WhatAre Performance Verifiers?" for further information.
3
Refer to Definitions. Use the table that corresponds to the appropriate PerformanceVerifier product.
4 Source of QC procedures can be the "Statistical Tools of Quality Control: Trainining
.
If necessary, use your Preliminary Baseline Meansand the PV Within-lab SDs for making QC
decisions.1 Apply 13S rule only until the BaselineMeans are established.2
Collect quality control data on each PVover a 20–30 day period.
For each PV calculate the Baseline Mean3.
Use these Baseline Means and yourlaboratory specific QC procedures
to make future QC decisions.4
Are the differencesbetween Preliminary
Baseline Means and BaselineMeans ≤ the delta3 (for n=2)
in Appendix 2?
Yes
No
Investigation required:
• Contact Technical Support
Are these means within the published
Range of Means?
Yes
Module or your own QC procedures.
Part No. J04498 Performance Verifiers2007-06-25 VITROS Chemistry Systems 15
Using Performance Verifiers
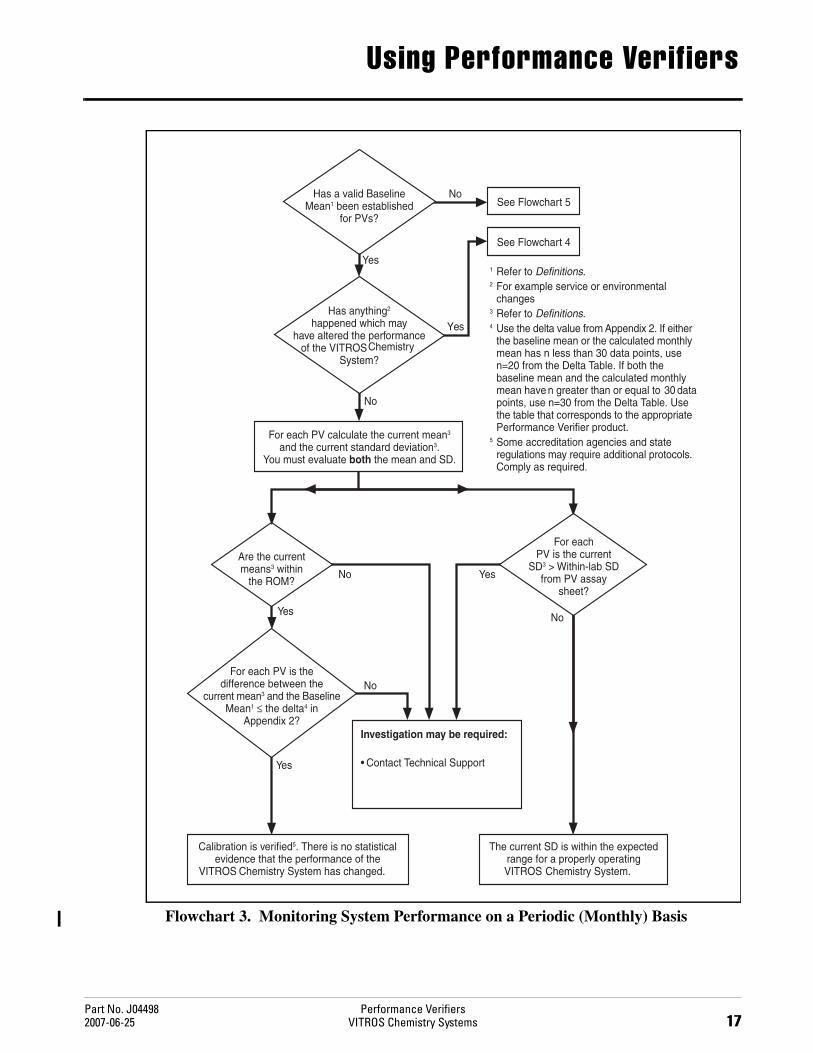
Monitoring System Performance on a Periodic (Monthly) BasisIf you use Performance Verifiers as your daily control materials the results can be used to assess the performance of the VITROS Chemistry System on a periodic basis. This assessment might be done to detect drift or to verify a previous calibration.
• We recommend that this assessment be done on a monthly basis.
• Evaluate both the current (monthly) means and the calculated SDs. The monthly means are evaluated both for being within the ROM and whether or not the current mean is statistically the same as the baseline mean. The calculated standard deviations are evaluated for being larger than the PV assay sheet Within-lab SD.
• In order to evaluate whether the current mean is statistically different from the baseline mean, you need to calculate the difference (delta) between the current mean and the baseline mean. This difference is evaluated using the Delta table in Appendix 2.
• The number of data points (n) included in this monthly assessment should match the number used to calculate the baseline mean (20-30). If the two (n)s are not the same, use the following guideline:
– If either the baseline mean or the current mean has n < 30 datapoints, use n = 20 from the Delta table in Appendix 2.
– If both the baseline mean and the current mean have n ≥ 30 datapoints, use n = 30 from the Delta table in Appendix 2.
Use the steps outlined in Flowchart 3 to assess the performance of a VITROS Chemistry System on a periodic basis. In order to use this flowchart, you must use PVs as your daily control materials. Appendix 3 contains a worksheet that can be used to document the periodic monitoring of system performance.
This procedure determines whether or not there is a statistically significant difference between your current mean and the baseline mean. A statistically significant difference may not be clinically significant. When you have a statistically significant difference, an investigation may be required, depending on your laboratory’s action limit for monthly mean variation.
Performance Verifiers Part No. J0449816 VITROS Chemistry Systems 2007-06-25
Using Performance Verifiers
Flowchart 3. Monitoring System Performance on a Periodic (Monthly) Basis
1 Refer to Definitions.2 For example service or environmental
changes3 Refer to Definitions.4 Use the delta value from Appendix 2. If either
the baseline mean or the calculated monthlymean has n less than 30 data points, usen=20 from the Delta Table. If both thebaseline mean and the calculated monthlymean have n greater than or equal to 30 datapoints, use n=30 from the Delta Table. Usethe table that corresponds to the appropriatePerformance Verifier product.
5 Some accreditation agencies and stateregulations may require additional protocols.Comply as required.
No
Investigation may be required:
• Contact Technical Support
Are the currentmeans3 within
the ROM?No
For each PV is thedifference between the
current mean3 and the BaselineMean1 ≤ the delta4 in
Appendix 2?
No
Yes
Yes
For each PV calculate the current mean3
and the current standard deviation3.You must evaluate both the mean and SD.
Has anything2
happened which mayhave altered the performance
of the VITROS ChemistrySystem?
Yes
See Flowchart 4
Has a valid BaselineMean1 been established
for PVs?
No
Yes
See Flowchart 5
For eachPV is the current
SD3 > Within-lab SDfrom PV assay
sheet?
No
Calibration is verified5. There is no statisticalevidence that the performance of the
VITROS Chemistry System has changed.
Yes
The current SD is within the expectedrange for a properly operatingVITROS Chemistry System.
Part No. J04498 Performance Verifiers2007-06-25 VITROS Chemistry Systems 17

Using Performance Verifiers
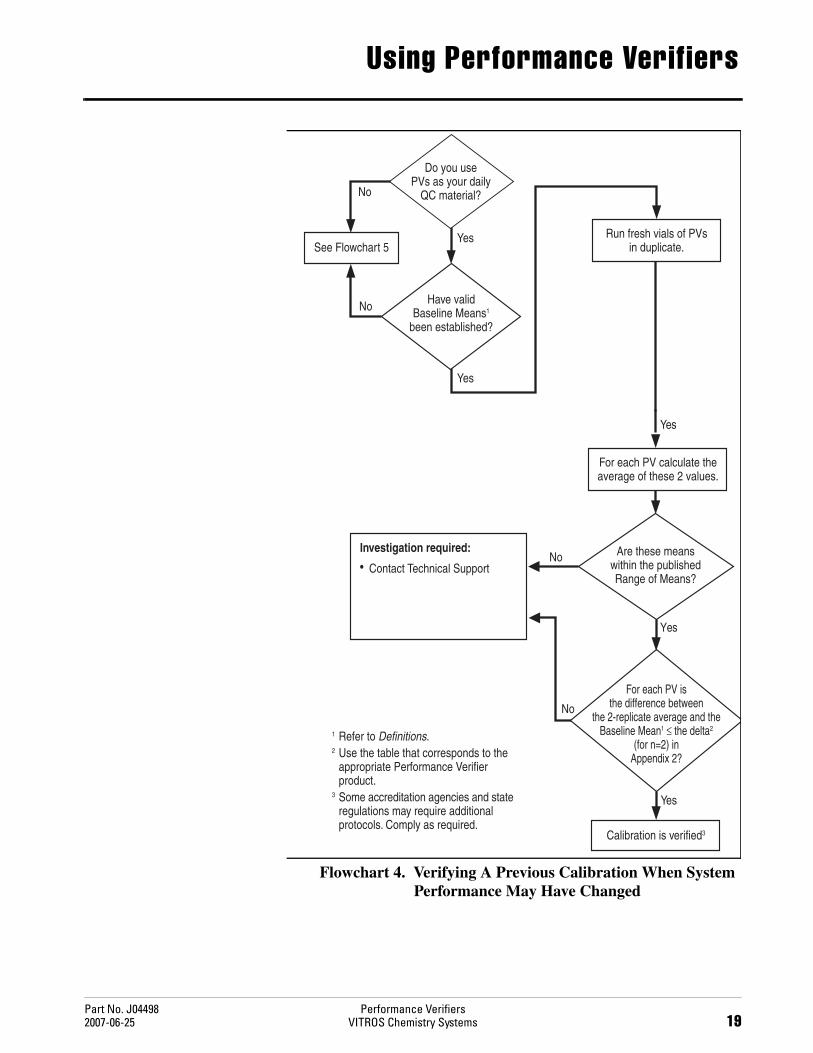
Verifying a Previous Calibration When System Performance May Have Changed
Performance Verifiers should also be used to verify an existing calibration when the performance of the VITROS Chemistry System may have changed. The following situations may alter the performance of the VITROS Chemistry System to the extent that you should use Flowchart 4 to verify calibration:
• Major maintenance
• Environmental changes
If you suspect that system performance has changed, use the mean results of duplicate measurements of fresh vials of Performance Verifiers to assess the current performance of the system. The calibration is still acceptable if the mean of two or more measurements of fresh vials of Performance Verifiers is within the ROM and these results are comparable to the baseline means.
Performance Verifiers Part No. J0449818 VITROS Chemistry Systems 2007-06-25
Using Performance Verifiers
Flowchart 4. Verifying A Previous Calibration When System Performance May Have Changed
1 Refer to Definitions.2 Use the table that corresponds to the
appropriate Performance Verifierproduct.
3 Some accreditation agencies and stateregulations may require additionalprotocols. Comply as required.
No
Yes
For each PV isthe difference between
the 2-replicate average and theBaseline Mean1 ≤ the delta2
(for n=2) inAppendix 2?
No
Yes
Calibration is verified3
Have validBaseline Means1
been established?
Yes
Do you usePVs as your daily
QC material?
Run fresh vials of PVsin duplicate.
Are these meanswithin the publishedRange of Means?
No
For each PV calculate theaverage of these 2 values.
Yes
Yes
Investigation required:
• Contact Technical Support
No
Yes
See Flowchart 5
Part No. J04498 Performance Verifiers2007-06-25 VITROS Chemistry Systems 19
Using Performance Verifiers
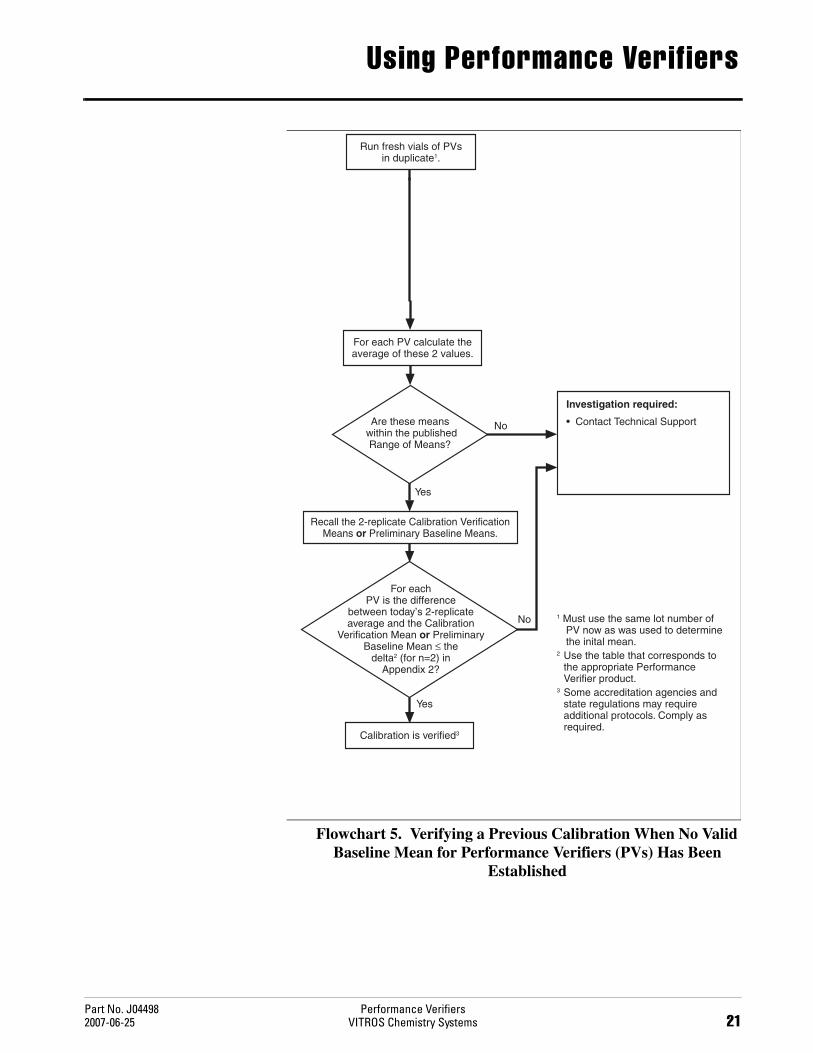
Verifying a Previous Calibration When No Valid Baseline Mean for Performance Verifiers Has Been Established
If you have not established a valid baseline mean for Performance Verifiers, and you need to verify a previous calibration, follow the steps outlined in Flowchart 5. There are several reasons for not having a valid baseline mean established. The two most common reasons are:
• You do not use Performance Verifiers as your daily QC material.
• There has not been enough time to establish the baseline mean (less than 20-30 days).
If you are verifying a previous calibration or you would like to assess the performance of the VITROS Chemistry System on a periodic basis and do not use PVs as a daily control you need to calculate the difference (delta) between your calibration verification mean (established at initial calibration) and today’s 2-replicate mean on fresh vials of PVs. This difference is evaluated using the Delta table in Appendix 2.
If you are using PVs as your daily control and you need to verify a previous calibration but have not yet established a baseline mean, follow the steps outlined in Flowchart 5. You need to calculate the difference (delta) between your preliminary baseline mean (established at initial calibration) and today’s 2-replicate mean on fresh vials of PVs. This difference is evaluated using the Delta table in Appendix 2.
Performance Verifiers Part No. J0449820 VITROS Chemistry Systems 2007-06-25
Using Performance Verifiers
Flowchart 5. Verifying a Previous Calibration When No Valid Baseline Mean for Performance Verifiers (PVs) Has Been
Established
1 Must use the same lot number ofPV now as was used to determinethe inital mean.
2 Use the table that corresponds tothe appropriate PerformanceVerifier product.
3 Some accreditation agencies andstate regulations may requireadditional protocols. Comply asrequired.
No
Yes
For eachPV is the difference
between today’s 2-replicateaverage and the Calibration
Verification Mean or PreliminaryBaseline Mean ≤ the
delta2 (for n=2) inAppendix 2?
Yes
Recall the 2-replicate Calibration VerificationMeans or Preliminary Baseline Means.
No
Calibration is verified3
YesRun fresh vials of PVsin duplicate1.
Are these means within the published
Range of Means?
For each PV calculate theaverage of these 2 values.
Investigation required:
• Contact Technical Support
Part No. J04498 Performance Verifiers2007-06-25 VITROS Chemistry Systems 21

Using Performance Verifiers
Performance Verifiers Part No. J0449822 VITROS Chemistry Systems 2007-06-25

Appendix 1: Performance Verifier Assay Sheets
This Appendix contains a sample of the Performance Verifier assay sheets.
Part No. J04498 Performance Verifiers2007-06-25 VITROS Chemistry System 23

Appendix 1: Performance Verifier Assay Sheets
Performance Verifiers Part No. J0449824 VITROS Chemistry System 2007-06-25
����
����
VITROS is a trademark of Ortho-Clinical Diagnostics, Inc. www.orthoclinical.com 1 (9)
VITROS Performance Verifier II
2006-03-06
2006-05-31
2006-02-20
823 1474
GEN
AcP
ALB
ALKP
ALT
AMYL
AST
Bc
Bu
1828303132313233343527293133343536372021222324251314171819202122232425262728171819202122
5.46 - 7.603.74 - 4.743.74 - 4.743.76 - 4.763.80 - 4.80387 - 631388 - 632400 - 644399 - 643440 - 684169 - 205161 - 197168 - 204168 - 204167 - 203170 - 206168 - 204168 - 204281 - 365290 - 374300 - 384291 - 375314 - 398298 - 382169 - 235172 - 238
3.65 - 4.654.29 - 5.294.24 - 5.244.31 - 5.314.10 - 5.104.12 - 5.124.01 - 5.014.16 - 5.164.11 - 5.114.09 - 5.094.22 - 5.223.99 - 4.997.00 - 8.707.59 - 9.297.27 - 8.977.47 - 9.177.45 - 9.157.45 - 9.15
0.4700.1100.1100.1100.11016.016.016.016.016.05.05.05.05.05.05.05.05.0
10.510.510.510.510.510.55.05.0
0.2500.2500.2500.2500.2500.2500.2500.2500.2500.2500.2500.2500.3000.3000.3000.3000.3000.300
U/Lg/dL
U/L
U/L
U/L
U/L
mg/dL
mg/dL
5.46 - 7.6037.4 - 47.437.4 - 47.437.6 - 47.638.0 - 48.0387 - 631388 - 632400 - 644399 - 643440 - 684169 - 205161 - 197168 - 204168 - 204167 - 203170 - 206168 - 204168 - 204281 - 365290 - 374300 - 384291 - 375314 - 398298 - 382169 - 235172 - 238
62.4 - 79.573.4 - 90.572.5 - 89.673.7 - 90.870.1 - 87.270.5 - 87.668.6 - 85.771.1 - 88.270.3 - 87.469.9 - 87.072.2 - 89.368.2 - 85.3
119.7 - 148.8129.8 - 158.9124.3 - 153.4127.7 - 156.8127.4 - 156.5127.4 - 156.5
0.4701.101.101.101.1016.016.016.016.016.05.05.05.05.05.05.05.05.0
10.510.510.510.510.510.55.05.0
4.284.284.284.284.284.284.284.284.284.284.284.285.135.135.135.135.135.13
U/Lg/L
U/L
U/L
U/L
U/L
µmol/L
µmol/L
P5833

Appendix 2: Delta Tables
The Delta Tables in this Appendix are used to evaluate system drift or
performance shifts. Data in the tables were developed using the within-lab SD found on the Performance Verifier assay sheets.Table 1. VITROS Performance Verifiers I and II
Chemistry PV Level
Conventional Units SI Units
UnitsDelta n=2
Delta n=20
Delta n=30 Units
Delta n=2
Delta n=20
Delta n=30
AcP 1 U/L 0.33 0.19 0.15 U/L 0.33 0.19 0.15
AcP 2 U/L 0.92 0.52 0.42 U/L 0.92 0.52 0.42
ALB 1 g/dL 0.18 0.10 0.08 g/L 1.8 1.0 0.8
ALB 2 g/dL 0.22 0.12 0.10 g/L 2.2 1.2 1.0
ALKP 1 U/L 6.8 3.8 3.1 U/L 6.8 3.8 3.1
ALKP 2 U/L 31.4 17.6 14.4 U/L 31.4 17.6 14.4
ALT 1 U/L 5.3 3.0 2.4 U/L 5.3 3.0 2.4
ALT 2 U/L 9.8 5.5 4.5 U/L 9.8 5.5 4.5
AMYL 1 U/L 8.2 4.6 3.8 U/L 8.2 4.6 3.8
AMYL 2 U/L 20.5 11.5 9.4 U/L 20.5 11.5 9.4
AST 1 U/L 2.9 1.7 1.3 U/L 2.9 1.7 1.3
AST 2 U/L 9.8 5.5 4.5 U/L 9.8 5.5 4.5
Bc 1 mg/dL 0.20 0.11 0.09 µmol/L 3.4 1.9 1.5
Bc 2 mg/dL 0.49 0.28 0.22 µmol/L 8.4 4.7 3.8
Part No. J04498 Performance Verifiers2007-06-25 VITROS Chemistry Systems 25

Appendix 2: Delta Tables
Bu 1 mg/dL 0.12 0.07 0.05 µmol/L 2.0 1.1 0.9
Bu 2 mg/dL 0.59 0.33 0.27 µmol/L 10.1 5.6 4.6
BUN 1 mg/dL 1.2 0.7 0.5 mmol/L 0.4 0.2 0.2
BUN 2 mg/dL 2.7 1.5 1.3 mmol/L 1.0 0.5 0.4
Ca 1 mg/dL 0.43 0.24 0.20 mmol/L 0.11 0.06 0.05
Ca 2 mg/dL 0.51 0.29 0.23 mmol/L 0.13 0.07 0.06
CHE 1 U/mL 0.24 0.13 0.11 U/L 240 130 110
CHE 2 U/mL 0.33 0.19 0.15 U/L 330 190 150
CHOL 1 mg/dL 8.5 4.8 3.9 mmol/L 0.22 0.12 0.10
CHOL 2 mg/dL 11.7 6.6 5.4 mmol/L 0.30 0.17 0.14
CK 1 U/L 28.8 16.2 13.2 U/L 28.8 16.2 13.2
CK 2 U/L 81.7 45.9 37.5 U/L 81.7 45.9 37.5
Cl- 1 mmol/L 2.2 1.2 1.0 mmol/L 2.2 1.2 1.0
Cl- 2 mmol/L 2.7 1.5 1.3 mmol/L 2.7 1.5 0.3
CREA 1 mg/dL 0.16 0.09 0.07 µmol/L 13.9 7.8 6.4
CREA 2 mg/dL 0.27 0.15 0.13 µmol/L 24.3 13.6 11.1
DGXN 1 ng/mL 0.24 0.13 0.11 nmol/L 0.30 0.17 0.14
DGXN 2 ng/mL 0.33 0.19 0.15 nmol/L 0.43 0.24 0.20
dHDLC 1 mg/dL 3.06 1.72 1.40 mmol/L 0.079 0.044 0.036
dHDLC 2 mg/dL 4.61 2.59 2.11 mmol/L 0.119 0.067 0.055
dLDL 1 mg/dL 6.27 3.52 2.88 mmol/L 0.163 0.091 0.075
dLDL 2 mg/dL 10.98 6.16 5.03 mmol/L 0.284 0.160 0.130
ECO2 1 mmol/L 2.5 1.4 1.2 mmol/L 2.5 1.4 1.2
ECO2 2 mmol/L 2.0 1.1 0.9 mmol/L 2.0 1.1 0.9
Fe 1 µg/dL 8.5 4.8 3.9 µmol/L 1.52 0.85 0.70
Fe 2 µg/dL 16.4 9.2 7.5 µmol/L 2.94 1.65 1.35
GGT 1 U/L 3.4 1.9 1.6 U/L 3.4 1.9 1.6
GGT 2 U/L 17.3 9.7 7.9 U/L 17.3 9.7 7.9
GLU 1 mg/dL 4.1 2.3 1.9 mmol/L 0.23 0.13 0.10
GLU 2 mg/dL 9.3 5.2 4.2 mmol/L 0.51 0.29 0.24
HDLC 1 mg/dL 3.9 2.2 1.8 mmol/L 0.10 0.06 0.05
HDLC 2 mg/dL 8.5 4.8 3.9 mmol/L 0.22 0.12 0.10
K+ 1 mmol/L 0.20 0.11 0.09 mmol/L 0.20 0.11 0.09
K+ 2 mmol/L 0.31 0.18 0.14 mmol/L 0.31 0.18 0.14
LAC 1 mmol/L 0.15 0.09 0.07 mmol/L 0.15 0.09 0.07
LAC 2 mmol/L 0.41 0.23 0.19 mmol/L 0.41 0.23 0.19
Table 1. VITROS Performance Verifiers I and II (Continued)
Chemistry PV Level
Conventional Units SI Units
UnitsDelta n=2
Delta n=20
Delta n=30 Units
Delta n=2
Delta n=20
Delta n=30
Performance Verifiers Part No. J0449826 VITROS Chemistry Systems 2007-06-25

Appendix 2: Delta Tables
LDH 1 U/L 31.4 17.6 14.4 U/L 31.4 17.6 14.4
LDH 2 U/L 61.4 34.5 28.1 U/L 61.4 34.5 28.1
Li 1 mmol/L 0.12 0.07 0.05 mmol/L 0.12 0.07 0.05
Li 2 mmol/L 0.16 0.09 0.07 mmol/L 0.16 0.09 0.07
LIPA 1 U/L 14.9 8.4 6.8 U/L 14.9 8.4 6.8
LIPA 2 U/L 27.8 15.6 12.8 U/L 27.8 15.6 12.8
Mg 1 mg/dL 0.14 0.08 0.06 mmol/L 0.06 0.03 0.03
Mg 2 mg/dL 0.20 0.11 0.09 mmol/L 0.08 0.05 0.04
Na+ 1 mmol/L 2.7 1.5 1.3 mmol/L 2.7 1.5 1.3
Na+ 2 mmol/L 2.7 1.5 1.3 mmol/L 2.7 1.5 1.3
PHOS 1 mg/dL 0.27 0.15 0.13 mmol/L 0.09 0.05 0.04
PHOS 2 mg/dL 0.45 0.25 0.21 mmol/L 0.15 0.08 0.07
PHYT 1 µg/mL 2.0 1.1 0.98 µmol/L 7.9 4.4 3.6
PHYT 2 µg/mL 2.9 1.7 1.36 µmol/L 11.6 6.5 5.4
TBIL 1 mg/dL 0.16 0.09 0.07 µmol/L 2.7 1.5 1.2
TBIL 2 mg/dL 0.90 0.51 0.41 µmol/L 15.4 8.7 7.1
THEO 1 µg/mL 1.3 0.8 0.6 µmol/L 7.4 4.2 3.4
THEO 2 µg/mL 1.7 1.0 0.8 µmol/L 9.6 5.4 4.4
TIBC 1 µg/dL 43.1 24.2 19.8 µmol/L 7.7 4.3 3.5
TIBC 2 µg/dL 54.5 30.6 25.0 µmol/L 9.8 5.5 4.5
TP 1 g/dL 0.29 0.17 0.13 g/L 2.9 1.7 1.3
TP 2 g/dL 0.33 0.19 0.15 g/L 3.3 1.9 1.5
TRIG 1 mg/dL 5.9 3.3 2.7 mmol/L 0.07 0.04 0.03
TRIG 2 mg/dL 12.3 6.9 5.7 mmol/L 0.14 0.08 0.06
URIC 1 mg/dL 0.18 0.10 0.08 µmol/L 10.5 5.9 4.8
URIC 2 mg/dL 0.43 0.24 0.20 µmol/L 25.6 14.4 11.8
Table 1. VITROS Performance Verifiers I and II (Continued)
Chemistry PV Level
Conventional Units SI Units
UnitsDelta n=2
Delta n=20
Delta n=30 Units
Delta n=2
Delta n=20
Delta n=30
Part No. J04498 Performance Verifiers2007-06-25 VITROS Chemistry Systems 27

Appendix 2: Delta Tables
Table 2. VITROS Liquid Performance Verifiers I and II
Chemistry PV Level
Conventional Units SI Units
UnitsDelta n=2
Delta n=20
Delta n=30 Units
Delta n=2
Delta n=20
Delta n=30
ALC 1 mg/dL 19.6 11.0 9.0 mmol/L 4.26 2.39 1.95
ALC 2 mg/dL 26.1 14.6 12.0 mmol/L 5.7 3.2 2.6
AMON 1 µmol/L 6.2 3.5 2.9 µmol/L 6.2 3.5 2.9
AMON 2 µmol/L 9.0 5.0 4.1 µmol/L 9.0 5.0 4.1
GLU (CSF) 1 mg/dL 2.7 1.5 1.3 mmol/L 0.15 0.09 0.07
GLU (CSF) 2 mg/dL 5.9 3.3 2.7 mmol/L 0.33 0.18 0.15
K+ (ur) 1 mmol/L 0.57 0.32 0.26 mmol/L 0.57 0.32 0.26
K+ (ur) 2 mmol/L 3.18 1.78 1.46 mmol/L 3.18 1.78 1.46
Na+ (ur) 1 mmol/L 2.0 1.1 0.9 mmol/L 2.0 1.1 0.9
Na+ (ur) 2 mmol/L 3.7 2.1 1.7 mmol/L 3.7 2.1 1.7
PROT (CSF) 1 mg/dL 9.2 5.2 4.2 mg/L 92 52 42
PROT (CSF) 2 mg/dL 22.7 12.8 10.4 mg/L 227 128 104
SALI 1 mg/dL 0.9 0.5 0.4 mmol/L 0.07 0.04 0.03
SALI 2 mg/dL 2.2 1.2 1.0 mmol/L 0.16 0.09 0.07
Table 3. VITROS Isoenzyme Performance Verifiers I and II
Chemistry PV Level
Conventional Units SI Units
UnitsDelta n=2
Delta n=20
Delta n=30 Units
Delta n=2
Delta n=20
Delta n=30
CKMB 1 U/L 4.3 2.4 2.0 U/L 4.3 2.4 2.0
CKMB 2 U/L 10.0 5.6 4.6 U/L 10.0 5.6 4.6
CK 1 U/L 29.0 16.3 13.3 U/L 29.0 16.3 13.3
CK 2 U/L 36.3 20.4 16.6 U/L 36.3 20.4 16.6
Performance Verifiers Part No. J0449828 VITROS Chemistry Systems 2007-06-25
Appendix 2: Delta Tables
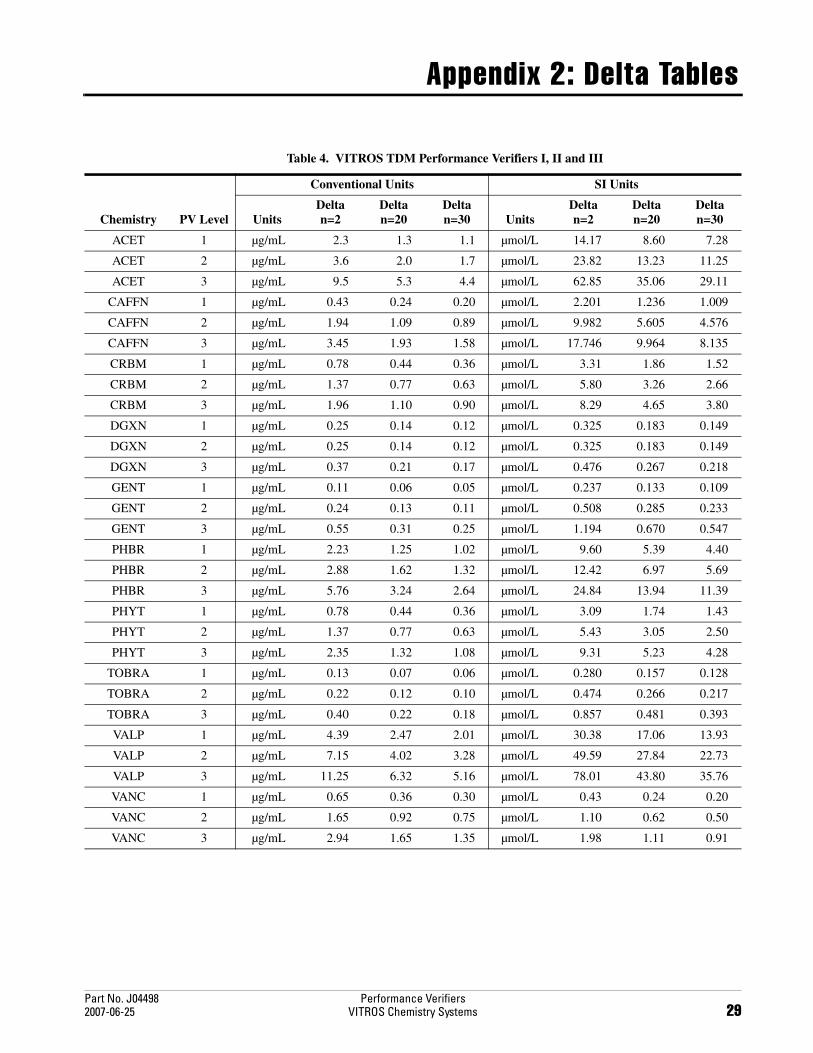
Table 4. VITROS TDM Performance Verifiers I, II and III
Chemistry PV Level
Conventional Units SI Units
UnitsDelta n=2
Delta n=20
Delta n=30 Units
Delta n=2
Delta n=20
Delta n=30
ACET 1 µg/mL 2.3 1.3 1.1 µmol/L 14.17 8.60 7.28
ACET 2 µg/mL 3.6 2.0 1.7 µmol/L 23.82 13.23 11.25
ACET 3 µg/mL 9.5 5.3 4.4 µmol/L 62.85 35.06 29.11
CAFFN 1 µg/mL 0.43 0.24 0.20 µmol/L 2.201 1.236 1.009
CAFFN 2 µg/mL 1.94 1.09 0.89 µmol/L 9.982 5.605 4.576
CAFFN 3 µg/mL 3.45 1.93 1.58 µmol/L 17.746 9.964 8.135
CRBM 1 µg/mL 0.78 0.44 0.36 µmol/L 3.31 1.86 1.52
CRBM 2 µg/mL 1.37 0.77 0.63 µmol/L 5.80 3.26 2.66
CRBM 3 µg/mL 1.96 1.10 0.90 µmol/L 8.29 4.65 3.80
DGXN 1 µg/mL 0.25 0.14 0.12 µmol/L 0.325 0.183 0.149
DGXN 2 µg/mL 0.25 0.14 0.12 µmol/L 0.325 0.183 0.149
DGXN 3 µg/mL 0.37 0.21 0.17 µmol/L 0.476 0.267 0.218
GENT 1 µg/mL 0.11 0.06 0.05 µmol/L 0.237 0.133 0.109
GENT 2 µg/mL 0.24 0.13 0.11 µmol/L 0.508 0.285 0.233
GENT 3 µg/mL 0.55 0.31 0.25 µmol/L 1.194 0.670 0.547
PHBR 1 µg/mL 2.23 1.25 1.02 µmol/L 9.60 5.39 4.40
PHBR 2 µg/mL 2.88 1.62 1.32 µmol/L 12.42 6.97 5.69
PHBR 3 µg/mL 5.76 3.24 2.64 µmol/L 24.84 13.94 11.39
PHYT 1 µg/mL 0.78 0.44 0.36 µmol/L 3.09 1.74 1.43
PHYT 2 µg/mL 1.37 0.77 0.63 µmol/L 5.43 3.05 2.50
PHYT 3 µg/mL 2.35 1.32 1.08 µmol/L 9.31 5.23 4.28
TOBRA 1 µg/mL 0.13 0.07 0.06 µmol/L 0.280 0.157 0.128
TOBRA 2 µg/mL 0.22 0.12 0.10 µmol/L 0.474 0.266 0.217
TOBRA 3 µg/mL 0.40 0.22 0.18 µmol/L 0.857 0.481 0.393
VALP 1 µg/mL 4.39 2.47 2.01 µmol/L 30.38 17.06 13.93
VALP 2 µg/mL 7.15 4.02 3.28 µmol/L 49.59 27.84 22.73
VALP 3 µg/mL 11.25 6.32 5.16 µmol/L 78.01 43.80 35.76
VANC 1 µg/mL 0.65 0.36 0.30 µmol/L 0.43 0.24 0.20
VANC 2 µg/mL 1.65 0.92 0.75 µmol/L 1.10 0.62 0.50
VANC 3 µg/mL 2.94 1.65 1.35 µmol/L 1.98 1.11 0.91
Part No. J04498 Performance Verifiers2007-06-25 VITROS Chemistry Systems 29

Appendix 2: Delta Tables
Table 5. VITROS CRP Performance Verifiers I and II
Chemistry PV Level
Conventional Units SI Units
UnitsDelta n=2
Delta n=20
Delta n=30 Units
Delta n=2
Delta n=20
Delta n=30
CRP 1 mg/dL 0.38 0.21 0.17 mg/L 3.8 2.1 1.7
CRP 2 mg/dL 0.66 0.37 0.30 mg/L 6.6 3.7 3.0
Table 6. VITROS UPRO Performance Verifiers I and II
Chemistry PV Level
Conventional Units SI Units
UnitsDelta n=2
Delta n=20
Delta n=30 Units
Delta n=2
Delta n=20
Delta n=30
UPRO 1 mg/dL 6.3 3.5 2.9 g/L 0.06 0.04 0.03
UPRO 2 mg/dL 15.3 8.6 7.0 g/L 0.15 0.09 0.07
Table 7. VITROS AAT/HPT Performance Verifiers I, II and III
Chemistry PV Level
Conventional Units SI Units
UnitsDelta n=2
Delta n=20
Delta n=30 Units
Delta n=2
Delta n=20
Delta n=30
AAT 1 mg/dL 2.55 1.43 1.17 g/L 0.0255 0.0143 0.0117
AAT 2 mg/dL 4.70 2.64 2.16 g/L 0.047 0.0264 0.0216
AAT 3 mg/dL 12.54 7.04 5.75 g/L 0.1254 0.0704 0.0575
HPT 1 mg/dL 2.74 1.54 1.26 g/L 0.0274 0.0154 0.0126
HPT 2 mg/dL 4.9 2.75 2.25 g/L 0.049 0.0275 0.0225
HPT 3 mg/dL 9.6 5.39 4.4 g/L 0.096 0.0539 0.044
Table 8. VITROS dTIBC Performance Verifiers I and II
Table 9. VITROS HCY Performance Verifiers I, II, and III
Conventional Units SI Units
Chemistry PV Level UnitsDelta n=2
Deltan=20
Delta n=30 Units
Delta n=2
Delta n=20
Delta n=30
dTIBC 1 ug/dL 18.03 10.12 8.27 umol/L 3.23 1.81 1.48
dTIBC 2 ug/dL 22.34 12.55 10.24 umol/L 4.00 2.25 1.83
Conventional Units SI Units
Chemistry PV Level UnitsDelta n=2
Deltan=20
Delta n=30 Units
Delta n=2
Delta n=20
Delta n=30
HCY 1 umol/L 0.63 0.35 0.29 umol/L 0.63 0.35 0.29
HCY 2 umol/L 0.82 0.46 0.38 umol/L 0.82 0.46 0.38
HCY 3 umol/L 1.45 0.81 0.66 umol/L 1.45 0.81 0.66
Performance Verifiers Part No. J0449830 VITROS Chemistry Systems 2007-06-25

Appendix 2: Delta Tables
Table 10. VITROS ApoA1 Performance Verifier I
Table 11. VITROS ApoB Performance Verifier I
Table 12. VITROS ASO/RF Performance Verifiers I and II
Table 13. VITROS hsCRP Performance Verifiers I, II and III
Table 14. VITROS mALB Performance Verifiers I and II
Chemistry PV Level
Conventional Units SI Units
UnitsDelta n=2
Delta n=20
Delta n=30 Units
Delta n=2
Delta n=20
Delta n=30
ApoA1 1 mg/dL 6.41 3.60 2.94 g/L 0.065 0.036 0.030
Chemistry PV Level
Conventional Units SI Units
UnitsDelta n=2
Delta n=20
Delta n=30 Units
Delta n=2
Delta n=20
Delta n=30
ApoB 1 mg/dL 6.27 3.52 2.88 g/L 0.063 0.035 0.029
Chemistry PV Level
Conventional Units SI Units
UnitsDelta n=2
Delta n=20
Delta n=30 Units
Delta n=2
Delta n=20
Delta n=30
ASO 1 IU/mL 10.58 5.94 4.85 IU/mL 10.58 5.94 4.85
ASO 2 IU/mL 15.88 8.91 7.28 IU/mL 15.88 8.91 7.28
RF 1 IU/mL 2.43 1.36 1.11 IU/mL 2.43 1.36 1.11
RF 2 IU/mL 2.74 1.54 1.26 IU/mL 2.74 1.54 1.26
Chemistry PV Level
Conventional Units SI Units
UnitsDelta n=2
Delta n=20
Delta n=30 Units
Delta n=2
Delta n=20
Delta n=30
hsCRP 1 mg/dL 0.11 0.06 0.05 mg/L 0.106 0.059 0.049
hsCRP 2 mg/dL 0.14 0.08 0.07 mg/L 0.143 0.080 0.066
hsCRP 3 mg/dL 0.43 0.24 0.20 mg/L 0.431 0.242 0.198
Chemistry PV Level
Conventional Units SI Units
UnitsDelta n=2
Delta n=20
Delta n=30 Units
Delta n=2
Delta n=20
Delta n=30
mALB 1 mg/dL 0.60 0.34 0.27 mg/L 6.00 3.37 2.75
mALB 2 mg/dL 0.66 0.37 0.30 mg/L 6.62 3.72 3.04
Part No. J04498 Performance Verifiers2007-06-25 VITROS Chemistry Systems 31

Appendix 2: Delta Tables
Table 15. VITROS PALB Performance Verifier I and II
Table 16. VITROS Protein Performance Verifiers I, II and III
Chemistry PV Level
Conventional Units SI Units
UnitsDelta n=2
Delta n=20
Delta n=30 Units
Delta n=2
Delta n=20
Delta n=30
PALB 1 mg/dL 0.64 0.36 0.30 mg/L 6.45 3.62 2.96
PALB 2 mg/dL 1.87 1.05 0.86 mg/L 18.68 10.49 8.56
Chemistry PV Level
Conventional Units SI Units
UnitsDelta n=2
Delta n=20
Delta n=30 Units
Delta n=2
Delta n=20
Delta n=30
C3 1 mg/dL 2.94 1.65 1.35 mg/L 29.4 16.5 13.5
C3 2 mg/dL 6.27 3.52 2.88 mg/L 62.7 35.2 28.8
C3 3 mg/dL 16.46 9.24 7.55 mg/L 164.6 92.4 75.5
C4 1 mg/dL 0.61 0.34 0.28 mg/L 6.1 3.4 2.8
C4 2 mg/dL 1.00 0.56 0.46 mg/L 10.0 5.6 4.6
C4 3 mg/dL 1.78 1.00 0.82 mg/L 17.8 10.0 8.2
IgA 1 mg/dL 7.45 4.18 3.41 g/L 0.074 0.042 0.034
IgA 2 mg/dL 10.78 6.05 4.94 g/L 0.108 0.061 0.049
IgA 3 mg/dL 19.60 11.00 8.99 g/L 0.196 0.110 0.090
IgG 1 mg/dL 29.99 16.84 13.75 g/L 0.300 0.168 0.137
IgG 2 mg/dL 54.68 30.70 25.07 g/L 0.547 0.307 0.251
IgG 3 mg/dL 112.11 62.95 51.40 g/L 1.121 0.629 0.514
IgM 1 mg/dL 3.92 2.20 1.80 g/L 0.039 0.022 0.018
IgM 2 mg/dL 5.29 2.97 2.43 g/L 0.053 0.030 0.024
IgM 3 mg/dL 7.84 4.40 3.59 g/L 0.078 0.044 0.036
TRFRN 1 mg/dL 8.43 4.73 3.86 g/L 0.084 0.047 0.039
TRFRN 2 mg/dL 15.48 8.69 7.10 g/L 0.155 0.087 0.071
TRFRN 3 mg/dL 35.48 19.92 16.26 g/L 0.355 0.199 0.163
Performance Verifiers Part No. J0449832 VITROS Chemistry Systems 2007-06-25

Appendix 2: Delta Tables
Table 17. VITROS %A1c Performance Verifiers I and II
Chemistry PV Level
Conventional Units SI Units
UnitsDelta n=2
Delta n=20
Delta n=30 Units
Delta n=2
Delta n=20
Delta n=30
%A1c (IFCC) 1 % 0.51 0.29 0.23 % 0.51 0.29 0.23
%A1c (IFCC) 2 % 0.80 0.45 0.37 % 0.80 0.45 0.37
%A1c (NGSP) 1 % 0.65 0.36 0.30 % 0.65 0.36 0.30
%A1c (NGSP) 2 % 0.90 0.51 0.41 % 0.90 0.51 0.41
Hb 1 g/dL 0.67 0.37 0.31 g/L 6.7 3.7 3.1
Hb 2 g/dL 0.67 0.37 0.31 g/L 6.7 3.7 3.1
HbA1c 1 g/dL 0.07 0.04 0.03 g/L 0.74 0.42 0.34
HbA1c 2 g/dL 0.12 0.07 0.06 g/L 1.23 0.69 0.57
Part No. J04498 Performance Verifiers2007-06-25 VITROS Chemistry Systems 33

Appendix 2: Delta Tables
Table 18. VITROS DAT Performance Verifiers I, II, III, IV, and V
Chemistry PV Level
Conventional Units SI Units
UnitsDelta n=2
Delta n=20
Delta n=30 Units
Delta n=2
Delta n=20
Delta n=30
AMPH 1 ng/mL 35.28 19.81 16.17 ug/L 35.28 19.81 16.17
AMPH 2 ng/mL 38.02 21.35 17.43 ug/L 38.02 21.35 17.43
AMPH 3 ng/mL 37.44 21.02 17.16 ug/L 37.44 21.02 17.16
AMPH 4 ng/mL 91.73 51.5 42.05 ug/L 91.73 51.5 42.05
AMPH 5 ng/mL 37.44 21.02 17.16 ug/L 37.44 21.02 17.16
BARB 1 ng/mL 11.31 6.35 5.18 ug/L 11.31 6.35 5.18
BARB 2 ng/mL 12.62 7.09 5.79 ug/L 12.62 7.09 5.79
BARB 3 ng/mL 11.88 6.67 5.45 ug/L 11.88 6.67 5.45
BARB 4 ng/mL 16.09 9.03 7.38 ug/L 16.09 9.03 7.38
BARB 5 ng/mL 26.09 14.65 11.96 ug/L 26.09 14.65 11.96
BENZ 1 ng/mL 29.26 16.43 13.42 ug/L 29.26 16.43 13.42
BENZ 2 ng/mL 39.81 22.35 18.25 ug/L 39.81 22.35 18.25
BENZ 3 ng/mL 33.5 18.81 15.36 ug/L 33.5 18.81 15.36
BENZ 4 ng/mL 48.86 27.43 22.4 ug/L 48.86 27.43 22.4
BENZ 5 ng/mL 108.04 60.66 49.53 ug/L 108.04 60.66 49.53
COCM 1 ng/mL 11.37 6.38 5.21 ug/L 11.37 6.38 5.21
COCM 2 ng/mL 15.68 8.8 7.19 ug/L 15.68 8.8 7.19
COCM 3 ng/mL 16.66 9.35 7.64 ug/L 16.66 9.35 7.64
COCM 4 ng/mL 28.81 16.18 13.21 ug/L 28.81 16.18 13.21
COCM 5 ng/mL 57.23 32.13 26.24 ug/L 57.23 32.13 26.24
METD 1 ng/mL 13.33 7.48 6.11 ug/L 13.33 7.48 6.11
METD 2 ng/mL 10.58 5.94 4.85 ug/L 10.58 5.94 4.85
METD 3 ng/mL 9.02 5.06 4.13 ug/L 9.02 5.06 4.13
METD 4 ng/mL 11.17 6.27 5.12 ug/L 11.17 6.27 5.12
METD 5 ng/mL 45.67 25.64 20.94 ug/L 45.67 25.64 20.94
OP 1 ng/mL 18.62 10.45 8.54 ug/L 18.62 10.45 8.54
OP 2 ng/mL 19.6 11 8.99 ug/L 19.6 11 8.99
OP 3 ng/mL 77.22 43.36 35.4 ug/L 77.22 43.36 35.4
OP 4 ng/mL 160.13 89.91 73.41 ug/L 160.13 89.91 73.41
OP 5 ng/mL 220.5 123.8 101.08 ug/L 220.5 123.8 101.08
PCP 1 ng/mL 2.2 1.23 1.01 ug/L 2.2 1.23 1.01
PCP 2 ng/mL 2.57 1.44 1.18 ug/L 2.57 1.44 1.18
PCP 3 ng/mL 4.29 2.41 1.97 ug/L 4.29 2.41 1.97
THC 1 ng/mL 1.88 1.06 0.86 ug/L 1.88 1.06 0.86
THC 2 ng/mL 1.71 0.96 0.78 ug/L 1.71 0.96 0.78
Performance Verifiers Part No. J0449834 VITROS Chemistry Systems 2007-06-25

Appendix 2: Delta Tables
THC 3 ng/mL 2.14 1.2 0.98 ug/L 2.14 1.2 0.98
THC 4 ng/mL 2.39 1.34 1.1 ug/L 2.39 1.34 1.1
Chemistry PV Level
Conventional Units SI Units
UnitsDelta n=2
Delta n=20
Delta n=30 Units
Delta n=2
Delta n=20
Delta n=30
Part No. J04498 Performance Verifiers2007-06-25 VITROS Chemistry Systems 35

Appendix 2: Delta Tables
Performance Verifiers Part No. J0449836 VITROS Chemistry Systems 2007-06-25
Appendix 3: Quality Control Worksheets
This Appendix contains the following Quality Control worksheets:
• Calibration Verification
• Baseline Mean Evaluation
• Periodic Monitoring of System Performance
Part No. J04498 Performance Verifiers2007-06-25 VITROS Chemistry Systems 37
Appendix 3: Quality Control Worksheets
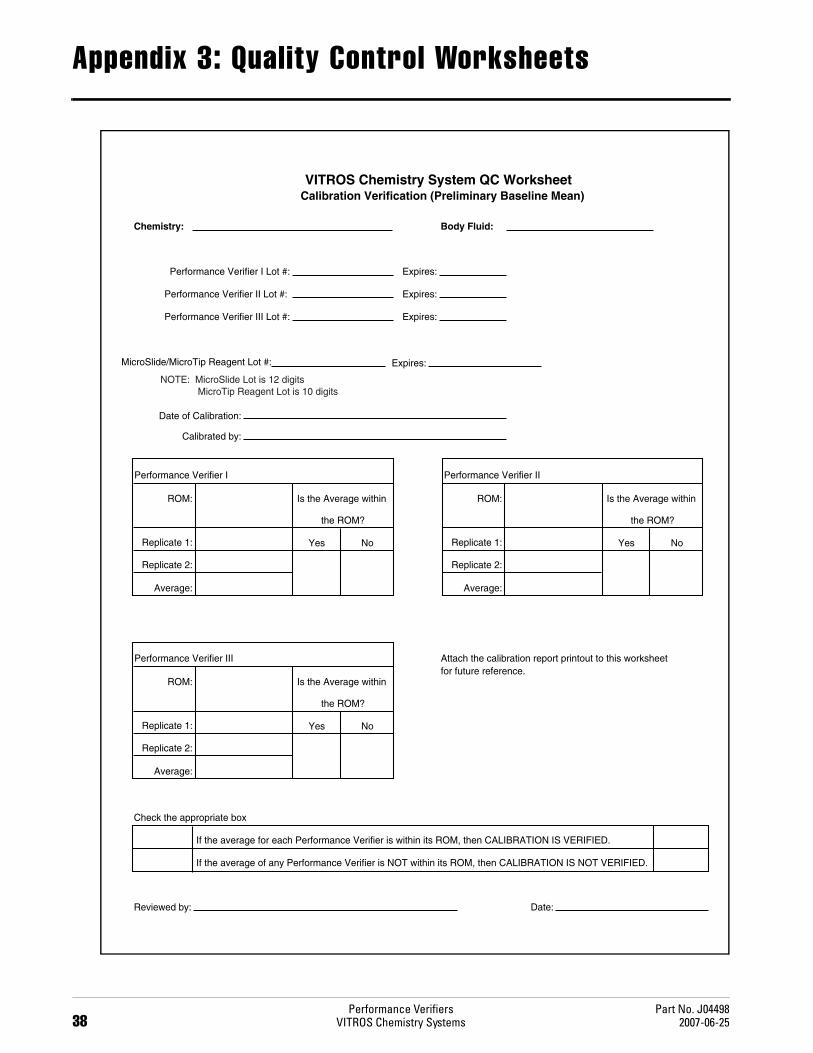
VITROS Chemistry System QC WorksheetCalibration Verification (Preliminary Baseline Mean)
Chemistry: Body Fluid:
Performance Verifier I Lot #: Expires:
Performance Verifier II Lot #: Expires:
Performance Verifier III Lot #: Expires:
MicroSlide/MicroTip Reagent Lot #: Expires:
Date of Calibration:
Calibrated by:
Performance Verifier I
ROM: Is the Average within
the ROM?
Replicate 1: Yes No
Replicate 2:
Average:
Attach the calibration report printout to this worksheetfor future reference.
Check the appropriate box
If the average for each Performance Verifier is within its ROM, then CALIBRATION IS VERIFIED.
If the average of any Performance Verifier is NOT within its ROM, then CALIBRATION IS NOT VERIFIED.
Reviewed by: Date:
Performance Verifier III
ROM: Is the Average within
the ROM?
Replicate 1: Yes No
Replicate 2:
Average:
Performance Verifier II
ROM: Is the Average within
the ROM?
Replicate 1: Yes No
Replicate 2:
Average:
NOTE: MicroSlide Lot is 12 digits MicroTip Reagent Lot is 10 digits
Performance Verifiers Part No. J0449838 VITROS Chemistry Systems 2007-06-25

Appendix 3: Quality Control Worksheets
VITROS Chemistry System QC WorksheetBaseline Mean Evaluation
*Use the Calculated Delta for n=2 to verify that the differences between the Preliminary Baseline Means and the Baseline Means are not significant. The Calculated Delta is equal to the absolute value of the difference betweenthe current mean and the baseline mean.
** The Preliminary Baseline Mean is recorded in the Calibration Verification Worksheet
Chemistry: Body Fluid:
MicroSlide/MicroTip Reagent Lot #: Expires:
NOTE: MicroSlide Lot is 12 digits. MicroTip Reagent Lot is 10 digits.
Date of Calibration:
Check the appropriate box
If the answers to all questions were YES, then the Baseline means are acceptable.
If the answer to any question was NO, then an investigation is required.
Performance Verifier I, Lot #
Is the Baseline Mean
within the ROM?
PreliminaryBaselineMean**
Is the difference between the Baseline Meanand the Preliminary Baseline meanless than or equal to the Calculated Delta*?
Yes No Yes No
Performance Verifier II, Lot #
ROM:
PreliminaryBaselineMean**
Is the difference between the Baseline Meanand the Preliminary Baseline meanless than or equal to the Calculated Delta*?
Delta Value*:
BaselineMean:
Yes No
N=:
Yes No
Performance Verifier III, Lot #
PreliminaryBaselineMean**
Is the difference between the Baseline Meanand the Preliminary Baseline meanless than or equal to the Calculated Delta*?
Yes No Yes No
ROM:
Delta Value*:
BaselineMean:
N=:
ROM:
Delta Value*:
BaselineMean:
N=:
Is the Baseline Mean
within the ROM?
Is the Baseline Mean
within the ROM?
Delta Value
Delta Value
Delta Value
Part No. J04498 Performance Verifiers2007-06-25 VITROS Chemistry Systems 39
Reviewed by: Date:

Appendix 3: Quality Control Worksheets
VIT
RO
S C
hem
istr
y S
yste
m Q
C W
ork
shee
tF
or
Per
iod
ic M
on
ito
rin
g o
f S
yste
m P
erfo
rman
ce
Ch
emis
try:
Bo
dy
Flu
id:
Per
form
ance
Ver
ifier
Lot
#:
Exp
ires:
Mic
roS
lide/
Mic
roT
ipR
eage
nt L
ot #
E
xpire
s
Del
ta V
alue
**,
n =
2:
Bas
elin
e M
ean:
Bas
elin
e S
D**
*:
Cor
rect
ive
Act
ion*
***
Dat
e of
Initi
al C
alib
ratio
n:D
elta
Val
ue**
, n =
30:
RO
M:
Is th
e Is
Del
ta*
< o
rIs
Cur
rent
Rep
ortin
g P
erio
dC
urre
nt M
ean
equa
l to
Del
taC
urre
ntIn
the
RO
M ?
Cal
cula
ted
Val
ue**
?C
urre
nt
Bas
elin
e S
D ?
Beg
inE
ndM
ean
nY
esN
oD
elta
*Y
es
No
SD
Yes
No
* T
he C
alcu
late
d D
elta
is e
qual
to th
e ab
solu
te v
alue
of t
he d
iffer
ence
bet
wee
n th
e cu
rren
t mea
n an
d th
e ba
selin
e m
ean.
|cu
rren
t mea
n -
base
line
mea
n|**
Use
the
tabl
es in
App
endi
x 2
of th
e P
erfo
rman
ce V
erifi
er T
rain
ing
Mod
ule
for
the
Del
ta V
alue
s on
the
appr
opria
te P
V fl
uids
.**
* U
se th
e W
ithin
-Lab
SD
s fr
om th
e P
erfo
rman
ce V
erifi
er a
ssay
she
ets
as B
asel
ine
SD
s.
Rev
iew
ed b
y:D
ate:
****
If a
ny o
f the
que
stio
ns h
ave
a ch
eck
mar
k in
sha
ded
colu
mns
, co
rrec
tive
actio
n m
ay b
e re
quire
d.
SD
> th
e
Del
ta V
alue
**,
n =
20
NO
TE
: M
icro
Slid
e Lo
t is
12 d
igits
. M
icro
Tip
Rea
gent
Lot
is 1
0 di
gits
.
Performance Verifiers Part No. J0449840 VITROS Chemistry Systems 2007-06-25

Exercises
1. What are Performance Verifier Fluids? What are the three ways they
can be used?2. What information is provided on the Performance Verifier (PV) assay sheets?
Part No. J04498 Performance Verifiers2007-06-25 VITROS Chemistry Systems 41
Exercises
3. Explain what is meant by the term Range of Means (ROM).
4. What information is provided by the Within-lab standard deviation on the PV assay sheets?
5. Explain the difference between a Preliminary Baseline mean and a Baseline mean.
Performance Verifiers Part No. J0449842 VITROS Chemistry Systems 2007-06-25

Exercises
6. Describe how to use Performance Verifiers to monitor performance of the VITROS Chemistry System.
7. What are Delta tables and how are they used?
8. Describe how you would assess the performance of the VITROS Chemistry System if you do not intend to use Performance Verifiers as daily quality control materials.
Part No. J04498 Performance Verifiers2007-06-25 VITROS Chemistry Systems 43
Exercises
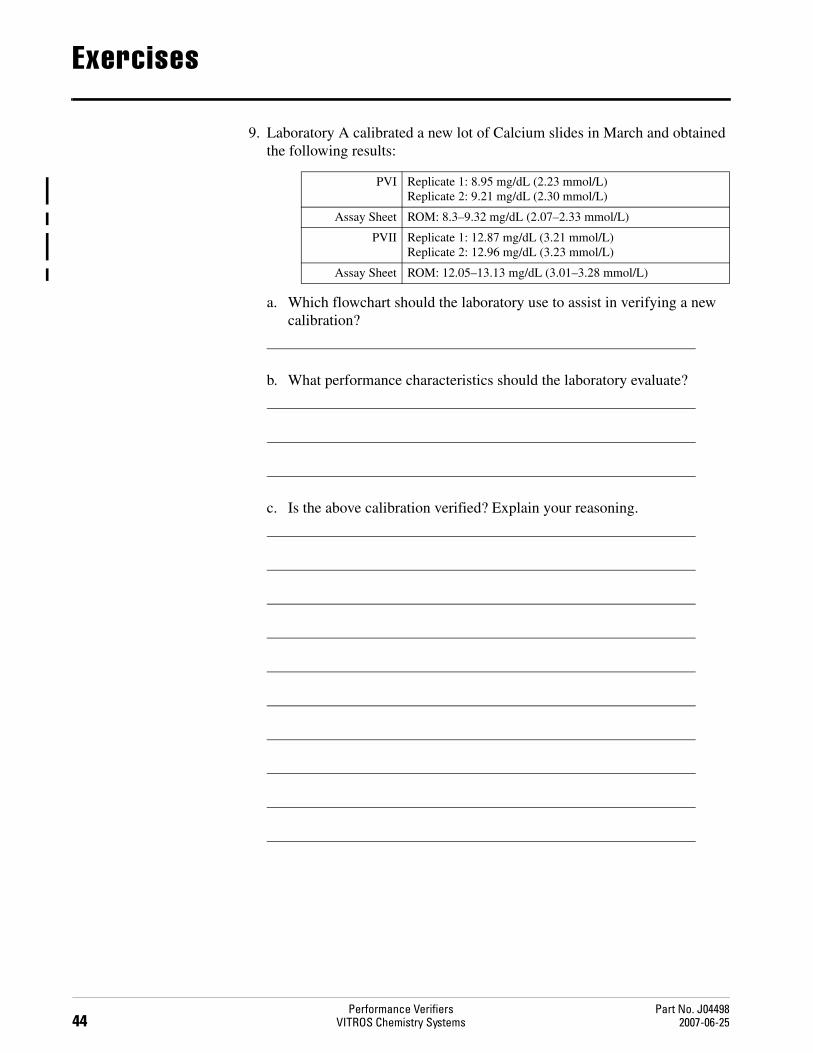
9. Laboratory A calibrated a new lot of Calcium slides in March and obtained the following results:
a. Which flowchart should the laboratory use to assist in verifying a new calibration?
b. What performance characteristics should the laboratory evaluate?
c. Is the above calibration verified? Explain your reasoning.
PVI Replicate 1: 8.95 mg/dL (2.23 mmol/L) Replicate 2: 9.21 mg/dL (2.30 mmol/L)
Assay Sheet ROM: 8.3–9.32 mg/dL (2.07–2.33 mmol/L)
PVII Replicate 1: 12.87 mg/dL (3.21 mmol/L) Replicate 2: 12.96 mg/dL (3.23 mmol/L)
Assay Sheet ROM: 12.05–13.13 mg/dL (3.01–3.28 mmol/L)
Performance Verifiers Part No. J0449844 VITROS Chemistry Systems 2007-06-25

Exercises
10. Laboratory B is assessing the performance of the VITROS Chemistry System on a monthly basis.
a. Which flowchart should be used to assist in this process?
b. What performance characteristics should this laboratory evaluate?
c. Laboratory B obtained the following quality control data for Glucose:
Has the performance of the VITROS Chemistry System changed during the current month (March)? Explain your reasoning.
Baseline QC Data (January) QC Data (March)
n Mean SD Units n Mean SD Units
PV I 20 80.0 2.1 mg/dL 31 84.3 1.8 mg/dL
4.43 0.12 mmol/L 4.67 0.10 mmol/L
PV II 30 280.3 4.7 mg/dL 31 281.4 4.0 mg/dL
15.54 0.26 mmol/L 15.60 0.22 mmol/L
Range of Means on PV Assay Sheet
PV I 74.3–85.1 mg/dL
4.12–4.72 mmol/L
PV II 269.8–295.7 mg/dL
14.98–16.41 mmol/L
Part No. J04498 Performance Verifiers2007-06-25 VITROS Chemistry Systems 45
Exercises
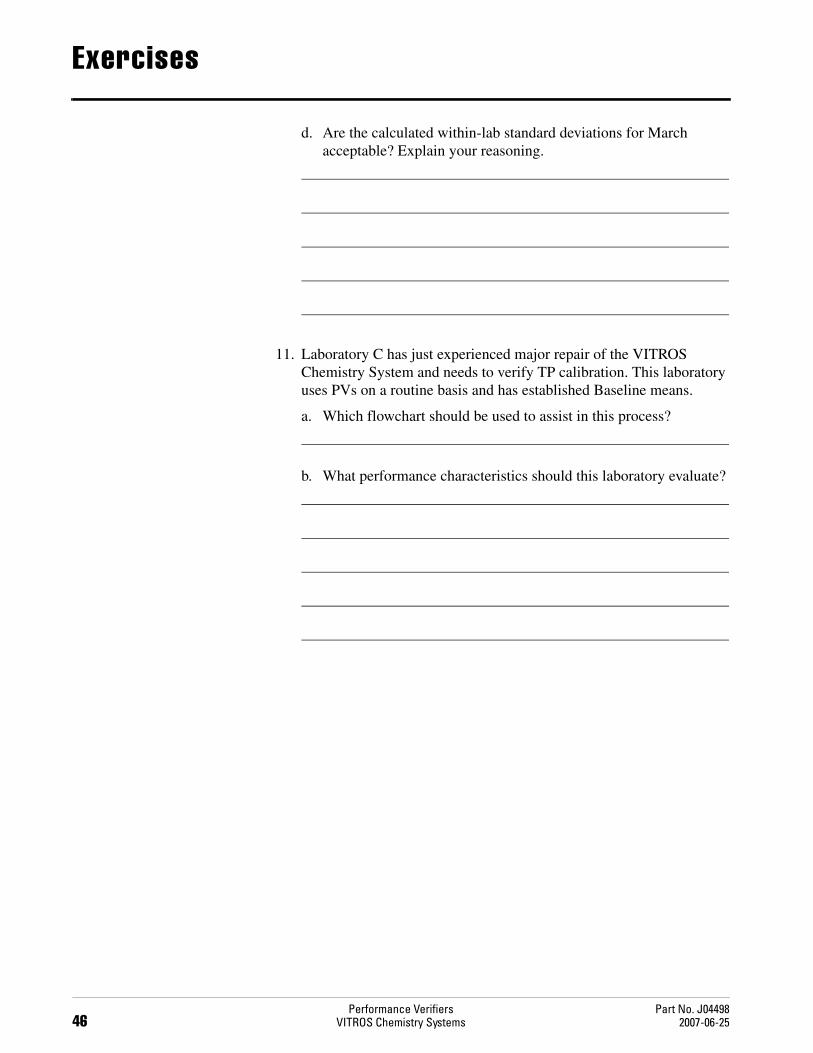
d. Are the calculated within-lab standard deviations for March acceptable? Explain your reasoning.
11. Laboratory C has just experienced major repair of the VITROS Chemistry System and needs to verify TP calibration. This laboratory uses PVs on a routine basis and has established Baseline means.
a. Which flowchart should be used to assist in this process?
b. What performance characteristics should this laboratory evaluate?
Performance Verifiers Part No. J0449846 VITROS Chemistry Systems 2007-06-25

Exercises
c. Laboratory C obtained the following quality control data for TP:
Is the existing calibration for TP still valid? Has the performance of the VITROS Chemistry System changed as a result of the repair? Explain your reasoning.
Results on a fresh PV vial of PV (Today)
Replicate # Result
PV I 1 4.56 g/dL (45.6 g/L)
2 4.48 g/dL (44.8 g/L)
PV II 1 6.20 g/dL (62.0 g/L)
2 6.30 g/dL (63.0 g/L)
Baseline Means
PV I 4.15 g/dL (41.5 g/L) n = 20
PV II 6.41 g/dL (64.1 g/L) n = 31
Range of Means on PV Assay Sheet
PV I 3.89–4.79 g/dL (38.9–47.9 g/L)
PVII 6.10–7.10 g/dL (61.0–71.0 g/L)
Part No. J04498 Performance Verifiers2007-06-25 VITROS Chemistry Systems 47

Exercises
12. Laboratory D is concerned that the extremely warm conditions in the lab may be affecting the performance of ALKP. The laboratory does not use PVs on a routine basis but has available a supply of the same lot number of PV fluids used to verify the initial calibration.
a. Which flowchart should be used to assist in this process?
b. What performance characteristics should this laboratory evaluate?
c. Laboratory D obtained the following quality control data for ALKP:
Has the performance of the VITROS Chemistry System changed during the current month (March)? Explain your reasoning.
Results on a fresh PV vial of PV (Today)
Replicate # Result Units
PV I 1 99 U/L
2 94 U/L
PV II 1 393 U/L
2 380 U/L
Range of Means on PV Assay Sheet
PV I 67.3–106.3 U/L
PVII 356.8–559.1 U/L
Calibration Verification Means
PV I 92.5 U/L
PVII 375.5 U/L
Performance Verifiers Part No. J0449848 VITROS Chemistry Systems 2007-06-25

Exercises
Is calibration verified for ALKP?
13. Laboratory E is evaluating monthly QC data for ECO2. This lot of slides was put into use at the beginning of the month and the data are being evaluated to establish a Baseline mean:
a. Which flowchart should be used to assist in this process?
b. What performance characteristics should this laboratory evaluate?
Part No. J04498 Performance Verifiers2007-06-25 VITROS Chemistry Systems 49
Exercises
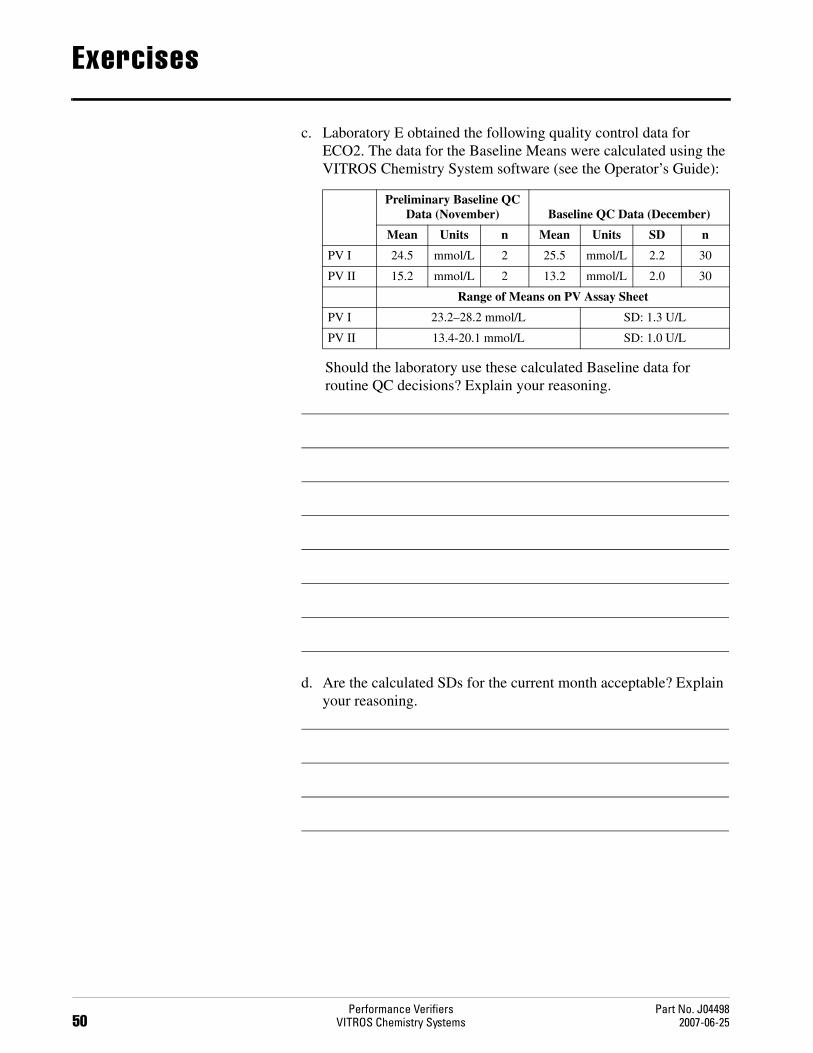
c. Laboratory E obtained the following quality control data for ECO2. The data for the Baseline Means were calculated using the VITROS Chemistry System software (see the Operator’s Guide):
Should the laboratory use these calculated Baseline data for routine QC decisions? Explain your reasoning.
d. Are the calculated SDs for the current month acceptable? Explain your reasoning.
Preliminary Baseline QC Data (November) Baseline QC Data (December)
Mean Units n Mean Units SD n
PV I 24.5 mmol/L 2 25.5 mmol/L 2.2 30
PV II 15.2 mmol/L 2 13.2 mmol/L 2.0 30
Range of Means on PV Assay Sheet
PV I 23.2–28.2 mmol/L SD: 1.3 U/L
PV II 13.4-20.1 mmol/L SD: 1.0 U/L
Performance Verifiers Part No. J0449850 VITROS Chemistry Systems 2007-06-25

Answer Key
1. What are Performance Verifier Fluids? What are the three ways they
can be used?Performance Verifiers are assayed controls which can be used as follows: To verify calibration of VITROS Chemistry Systems. As daily quality control materials. As tools for troubleshooting VITROS Chemistry Systems.
2. What information is provided on the Performance Verifier (PV) assay sheets?
Generation-specific range of means. Recommended within-laboratory standard deviation.
3. Explain what is meant by the term Range of Means (ROM).
Performance Verifier ROM is a term used to describe the lowest and highest mean values your VITROS Chemistry System should produce for your slide lot. These ranges are specific for a particular generation of slides.
Part No. J04498 Performance Verifiers2007-06-25 VITROS Chemistry Systems 51

Answer Key
4. What information is provided by the Within-lab standard deviation on the PV assay sheets?
Performance Verifier assay sheet Within-lab SD is the recommended value for the Baseline SD in the VITROS Chemistry System quality control software. The PV assay sheet Within-lab SD includes the variability associated with replicate PV measurements within a day and from one day to the next. It does not include the variability associated with using different slide lot numbers or multiple calibration events.
5. Explain the difference between a Preliminary Baseline mean and a Baseline mean.
A Preliminary Baseline mean is the average of two values for Performance Verifiers run sequentially (two replicates from one cup) immediately after the system is calibrated. This mean is used to verify calibration and is replaced by the Baseline mean when more QC data are available. The Baseline mean is the average of PV results obtained over a 20–30 day period. It is a better estimate of the true mean than the Preliminary Baseline mean.
6. Describe how to use Performance Verifiers to monitor performance of the VITROS Chemistry System.
You should use the Baseline mean, the recommended Within-lab SD on the PV assay sheet, and your laboratory-specific QC procedures to make routine QC decisions on the VITROS Chemistry System (source of QC procedures can be Statistical Tools of Quality Control: Training Module or your own QC procedures).
You should also assess the performance of your VITROS Chemistry System on a periodic (monthly) basis. This assessment requires evaluation of both the current (monthly) mean and calculated (monthly) within-lab SD (Flowchart 3).
The monthly mean is evaluated for being within the PV assay sheet ROM and whether or not it is statistically different from the baseline mean. The calculated within-lab standard deviation is evaluated for being larger than the PV assay sheet Within-lab SD.
Performance Verifiers Part No. J0449852 VITROS Chemistry Systems 2007-06-25

Answer Key
7. What are Delta tables and how are they used?
A Delta is the absolute difference between any two means. If the difference (delta) between two means is greater than the values in the delta tables in Appendix 2, these two means are statistically not the same.
8. Describe how you would assess the performance of the VITROS Chemistry System if you do not intend to use Performance Verifiers as daily quality control materials.
You should maintain a supply of Performance Verifiers for verifying calibration and for use as tools in troubleshooting. To verify a new calibration follow the guidelines outlined in Flowchart 1 and record the Calibration Verification Means for future use. For verification of an existing calibration or for troubleshooting follow the guidelines outlined in Flowchart 5.
If you use other manufacturer’s materials for your daily quality control, you also need to establish a Baseline mean for these controls. This Baseline mean, the recommended Within-lab SD on the PV assay sheet, and your laboratory-specific QC procedures should be used to make routine QC decisions on the VITROS Chemistry System.
You should also assess the performance of your VITROS Chemistry System on a periodic (monthly) basis. This assessment requires evaluation of both the current (monthly) mean and calculated (monthly) within-lab SD.
9. Laboratory A calibrated a new lot of Calcium slides in March and obtained the following results:
a. Which flowchart should the laboratory use to assist in verifying a new calibration?
Flowchart 1
b. What performance characteristics should the laboratory evaluate?
The laboratory should evaluate the average of the two replicates for each PV fluid to determine if they fall within the range of means. These averages are also used to establish Preliminary Baseline means.
PV I Replicate 1: 8.95 mg/dL (2.23 mmol/L) Replicate 2: 9.21 mg/dL (2.30 mmol/L)
Assay Sheet ROM: 8.3–9.32 mg/dL (2.07–2.33 mmol/L)
PV II Replicate 1: 12.87 mg/dL (3.21 mmol/L) Replicate 2: 12.21 mg/dL (3.23 mmol/L)
Assay Sheet ROM: 12.05–13.13 mg/dL (3.01–3.28 mmol/L)
Part No. J04498 Performance Verifiers2007-06-25 VITROS Chemistry Systems 53

Answer Key
c. Is the above calibration verified? Explain your reasoning.
YES; this calibration is verified. The reasoning is as follows:
The mean of the 2 replicates of PV I is 9.08 mg/dL (2.27 mmol/L) . The mean of the 2 replicates of PV II is 12.54 mg/dL (3.22 mmol/L). Both values fall within the range of means, therefore, the calibration is verified.
10. Laboratory B is assessing the performance of the VITROS Chemistry System on a monthly basis.
a. Which flowchart should be used to assist in this process?
Flowchart 3
b. What performance characteristics should this laboratory evaluate?
The laboratory should evaluate both the calculated current (monthly) means and the calculated within-lab standard deviations. The monthly means are evaluated for being within the ROM and whether or not the current monthly mean is statistically the same as the Baseline mean. The calculated within-lab standard deviations are evaluated for being larger than the PV assay sheet Within-lab SD. Each level of Performance Verifiers should be evaluated.
c. Laboratory B obtained the following quality control data for Glucose:
Baseline QC Data (January) QC Data (March)
n Mean SD Units n Mean SD Units
PV I 20 80.0 2.1 mg/dL 31 84.3 1.8 mg/dL
4.43 0.12 mmol/L 4.67 0.10 mmol/L
PV II 30 280.3 4.7 mg/dL 31 281.4 4.0 mg/dL
15.54 0.26 mmol/L 15.60 0.22 mmol/L
Range of Means on PV Assay Sheet
PV I 74.3–85.1 mg/dL
4.12–4.72 mmol/L
PV II 269.8–295.7 mg/dL
14.98–16.41 mmol/L
Performance Verifiers Part No. J0449854 VITROS Chemistry Systems 2007-06-25

Answer Key
Has the performance of the VITROS Chemistry System changed during the current month (March)? Explain your reasoning.
YES; the performance of the VITROS Chemistry System has changed. The reasoning is as follows: Both PV I and PV II must be evaluated. Use the worksheet from Appendix 3 to record the data.
PV I: Is the Current Mean within the ROM? YES; 84.3 mg/dL (4.67 mmol/L) is within the PV I ROM 74.3–85.1 mg/dL (4.12–4.72 mmol/L).
Is the calculated delta* less than or equal to the delta value**?
NO; 4.3 mg/dL (0.24 mmol/L) > 2.3 mg/dL (0.13 mmol/L).
The calculated delta* is greater than the delta value ** from the Delta table; there is a statistically significant difference between the current monthly mean and the Baseline mean for PV I. An investigation may be required.
PV II: Is the Current Mean within the ROM?
YES; 281.4 mg/dL (15.60 mmol/L) is within the PV II ROM 269.8–295.7 mg/dL (14.98 - 16.41 mmol/L).
Is the calculated delta* less than or equal to the delta value**? YES; 1.1 mg/dL (0.06 mmol/L) < 4.2 mg/dL (0.24 mmol/L).
The calculated delta is less than the delta value from the Delta Table; there is no statistically significant difference between the current monthly mean and the Baseline mean for PV II.
NOTE: Although the performance of PV II is acceptable, an investigation may be required. Each PV must meet all of the evaluation criteria. The current mean for PV I is within the ROM.
Calculated delta* for PV1 = | current monthly mean – Baseline mean |
= (84.3 – 80.0) = 4.3 mg/dL
= (4.67 – 4.43) = 0.24 mmol/L
Note: PV I Baseline mean (n = 20); PV I: Current Mean (n = 31); therefore use the delta value** for n = 20 from the Delta table (Appendix 2)
Delta Value**, n = 20: = 2.3 mg/dL: (0.13 mmol/L) (Appendix 2)
Calculated delta* for PV II = | current monthly mean – Baseline mean |
= (281.4 - 280.3) = 1.1 mg/dL
= (15.60- 15.54) = 0.06 mmol/L
Note: PV II Baseline mean (n = 30); PV II Current Mean (n = 31); therefore use the delta value** for n = 30 from the Delta table (Appendix 2).
Delta Value** = = 4.2 mg/dL (0.24 mmol/L)
Part No. J04498 Performance Verifiers2007-06-25 VITROS Chemistry Systems 55

Answer Key
However, there is a statistically significant difference between the current PV I mean and the Baseline mean.
d. Are the calculated within-lab standard deviations for March acceptable? Explain your reasoning.
YES; the calculated within-lab standard deviations for March are within the expected ranges. The reasoning is as follows: The Baseline standard deviations were established using the recommended PV assay sheet Within-lab standard deviations. PV I: Calculated within-lab SD 1.8 mg/dL (0.10 mmol/L) < Baseline SD 2.1 mg/dL (0.12 mmol/L). PV II: Calculated within-lab SD 4.0 mg/dL (0.22 mmol/L) < Baseline SD 4.7 mg/dL (0.26 mmol/L).
11. Laboratory C has just experienced major repair of the VITROS Chemistry System and needs to verify TP calibration. This laboratory uses PVs on a routine basis and has established Baseline means.
a. Which flowchart should be used to assist in this process?
Flowchart 4. The laboratory is verifying calibration following an occurrence that may have altered system performance. Since the laboratory routinely uses PVs, valid Baseline means for PVs have been established. The laboratory should evaluate whether PV results obtained after the event are statistically the same as the established Baseline means.
b. What performance characteristics should this laboratory evaluate?
The laboratory should evaluate the average of the two replicates for each PV. The average of the two replicates for each PV fluid is evaluated for falling within the range of means and whether today’s two-replicate averages (performed on fresh vial of PV fluids) and the Baseline Means are statistically the same.
Performance Verifiers Part No. J0449856 VITROS Chemistry Systems 2007-06-25
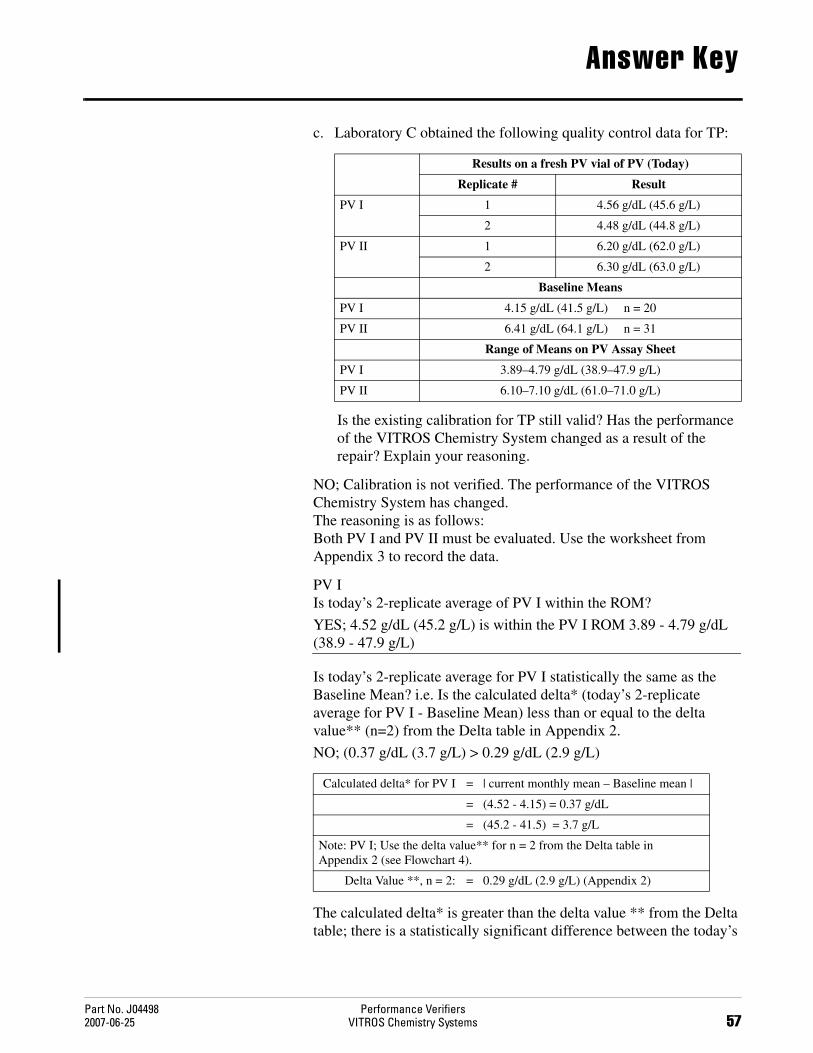
Answer Key
c. Laboratory C obtained the following quality control data for TP:
Is the existing calibration for TP still valid? Has the performance of the VITROS Chemistry System changed as a result of the repair? Explain your reasoning.
NO; Calibration is not verified. The performance of the VITROS Chemistry System has changed. The reasoning is as follows: Both PV I and PV II must be evaluated. Use the worksheet from Appendix 3 to record the data.
PV I Is today’s 2-replicate average of PV I within the ROM?
YES; 4.52 g/dL (45.2 g/L) is within the PV I ROM 3.89 - 4.79 g/dL (38.9 - 47.9 g/L)
Is today’s 2-replicate average for PV I statistically the same as the Baseline Mean? i.e. Is the calculated delta* (today’s 2-replicate average for PV I - Baseline Mean) less than or equal to the delta value** (n=2) from the Delta table in Appendix 2.
NO; (0.37 g/dL (3.7 g/L) > 0.29 g/dL (2.9 g/L)
The calculated delta* is greater than the delta value ** from the Delta table; there is a statistically significant difference between the today’s
Results on a fresh PV vial of PV (Today)
Replicate # Result
PV I 1 4.56 g/dL (45.6 g/L)
2 4.48 g/dL (44.8 g/L)
PV II 1 6.20 g/dL (62.0 g/L)
2 6.30 g/dL (63.0 g/L)
Baseline Means
PV I 4.15 g/dL (41.5 g/L) n = 20
PV II 6.41 g/dL (64.1 g/L) n = 31
Range of Means on PV Assay Sheet
PV I 3.89–4.79 g/dL (38.9–47.9 g/L)
PV II 6.10–7.10 g/dL (61.0–71.0 g/L)
Calculated delta* for PV I = | current monthly mean – Baseline mean |
= (4.52 - 4.15) = 0.37 g/dL
= (45.2 - 41.5) = 3.7 g/L
Note: PV I; Use the delta value** for n = 2 from the Delta table in Appendix 2 (see Flowchart 4).
Delta Value **, n = 2: = 0.29 g/dL (2.9 g/L) (Appendix 2)
Part No. J04498 Performance Verifiers2007-06-25 VITROS Chemistry Systems 57

Answer Key
2-replicate average for PV I and the Baseline mean for PV I. Calibration is not verified. Investigation is required. The most likely solution would be to re-calibrate TP.
PV II
Is today’s 2-replicate average of PV II within the ROM?
YES; 6.25 g/dL (62.5 g/L) is within the PV II ROM 6.10 - 7.10 g/dL (61.0 - 71.0 g/L)
Is today’s 2-replicate average for PV II statistically the same as the Baseline Mean? i.e. is the calculated delta* (today’s 2-replicate average for PV II - Baseline Mean) less than or equal to the delta value** (n=2) from the Delta table in Appendix 2).
YES; 0.16 g/dL (1.6 g/L) < 0.33 g/dL (3.3 g/L)
The calculated delta* is less than the delta value ** from the Delta table; there is no statistically significant difference between the today’s 2-replicate average for PV II and the Baseline mean for PV II. NOTE: Calibration is not verified even though the performance of PV II is acceptable. Although today’s 2-replicate average for PV I is within the ROM, there is a statistically significant difference between this average and the Baseline mean.
12. Laboratory D is concerned that the extremely warm conditions in the lab may be affecting the performance of ALKP. The laboratory does not use PVs on a routine basis but has available a supply of the same lot number of PV fluids used to verify the initial calibration.
a. Which flowchart should be used to assist in this process?
Flowchart 5. The laboratory is verifying calibration following an occurrence that may have altered system performance. Since the laboratory does not routinely run PVs, no valid Baseline mean for PVs has been established. The laboratory needs to evaluate whether today’s 2-replicate averages on PVs are statistically the same as the established Calibration Verification Means.
Calculated delta* for PV II = | today’s 2-replicate average - Baseline mean |
= (6.25 - 6.41) = 0.16 g/dL
= (62.5 - 64.1) = 1.6 g/L
Note: PV II Use the delta value** for n = 2 from the Delta table (Appendix 2) see Flowchart 4.
Delta Value**, n = 2: = 0.33 g/dL (3.3 g/L) (Appendix 2)
Performance Verifiers Part No. J0449858 VITROS Chemistry Systems 2007-06-25

Answer Key
b. What performance characteristics should this laboratory evaluate?
In addition, the average of the two replicates for each PV fluid is evaluated for falling within the range of means and whether today’s two-replicate average and the Calibration Verification Mean are statistically the same.
c. Laboratory D obtained the following quality control data for ALKP:
Has the performance of the VITROS Chemistry System changed during the current month (March)? Explain your reasoning.
Is calibration verified for ALKP?
YES; There is no statistical evidence that the performance of the VITROS Chemistry System has changed. Calibration is verified. The reasoning is as follows:
Both PV I and PV II must again be evaluated. Use the worksheet from Appendix 3 to record the data.
Is today’s 2-replicate average of PV I within the ROM?
YES; 96.5 U/L is within the PV I ROM (67.3 - 106.3 U/L)
Results on a fresh PV vial of PV (Today)
Replicate # Result Units
PV I 1 99 U/L
2 94 U/L
PV II 1 393 U/L
2 380 U/L
Range of Means on PV Assay Sheet
PV I 67.3–106.3 U/L
PV II 356.8–559.1 U/L
Calibration Verification Means
PV I 92.5 U/L
PV II 375.5 U/L
Part No. J04498 Performance Verifiers2007-06-25 VITROS Chemistry Systems 59
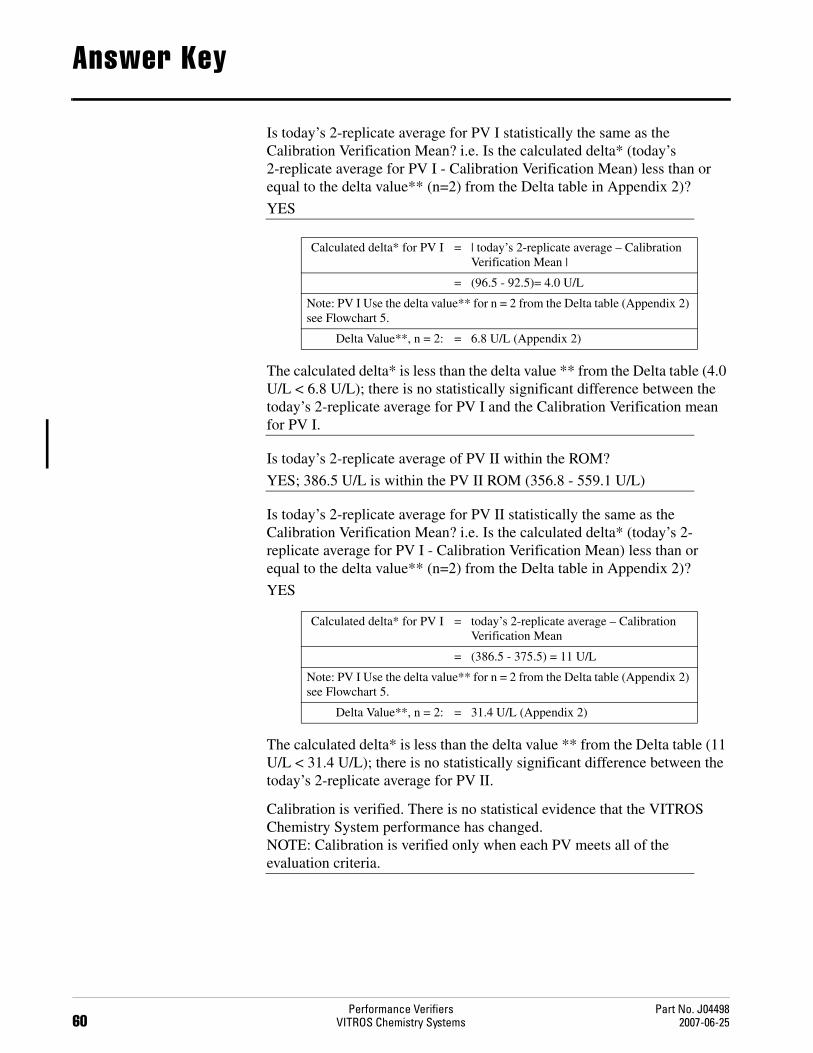
Answer Key
Is today’s 2-replicate average for PV I statistically the same as the Calibration Verification Mean? i.e. Is the calculated delta* (today’s 2-replicate average for PV I - Calibration Verification Mean) less than or equal to the delta value** (n=2) from the Delta table in Appendix 2)?
YES
The calculated delta* is less than the delta value ** from the Delta table (4.0 U/L < 6.8 U/L); there is no statistically significant difference between the today’s 2-replicate average for PV I and the Calibration Verification mean for PV I.
Is today’s 2-replicate average of PV II within the ROM?
YES; 386.5 U/L is within the PV II ROM (356.8 - 559.1 U/L)
Is today’s 2-replicate average for PV II statistically the same as the Calibration Verification Mean? i.e. Is the calculated delta* (today’s 2-replicate average for PV I - Calibration Verification Mean) less than or equal to the delta value** (n=2) from the Delta table in Appendix 2)?
YES
The calculated delta* is less than the delta value ** from the Delta table (11 U/L < 31.4 U/L); there is no statistically significant difference between the today’s 2-replicate average for PV II.
Calibration is verified. There is no statistical evidence that the VITROS Chemistry System performance has changed. NOTE: Calibration is verified only when each PV meets all of the evaluation criteria.
Calculated delta* for PV I = | today’s 2-replicate average – Calibration Verification Mean |
= (96.5 - 92.5)= 4.0 U/L
Note: PV I Use the delta value** for n = 2 from the Delta table (Appendix 2) see Flowchart 5.
Delta Value**, n = 2: = 6.8 U/L (Appendix 2)
Calculated delta* for PV I = today’s 2-replicate average – Calibration Verification Mean
= (386.5 - 375.5) = 11 U/L
Note: PV I Use the delta value** for n = 2 from the Delta table (Appendix 2) see Flowchart 5.
Delta Value**, n = 2: = 31.4 U/L (Appendix 2)
Performance Verifiers Part No. J0449860 VITROS Chemistry Systems 2007-06-25

Answer Key
13. Laboratory E is evaluating monthly QC data for ECO2. This lot of slides was put into use at the beginning of the month and the data are being evaluated to establish a Baseline mean:
a. Which flowchart should be used to assist in this process?
Flowchart 2.
b. What performance characteristics should this laboratory evaluate?
The laboratory should evaluate both the calculated current (monthly) means and the calculated SDs. The monthly means are evaluated for being within the ROM and whether or not the current monthly means are statistically the same as the Preliminary Baseline means. The calculated standard deviations are evaluated for being larger than the PV assay sheet Within-lab SD. Each level of Performance Verifiers should be evaluated.
c. Laboratory E obtained the following quality control data for ECO2. The data for the Baseline Means were calculated using the VITROS Chemistry System software (see the Operator’s Guide):
Should the laboratory use these calculated Baseline data for routine QC decisions? Explain your reasoning.
NO; These Baseline data are not acceptable for routine use. Investigation Required.
The reasoning is as follows: Both PV I and PV II must be evaluated. Use the worksheet from Appendix 3 (Baseline Mean Evaluation) to record the data. PV I
Is the Baseline mean within the ROM?
YES; 25.5 mmol/L is within the PV I ROM (23.2 - 28.2 mmol/L).
Preliminary Baseline QC Data (November) Baseline QC Data (December)
Mean Units n Mean Units SD n
PV I 24.5 mmol/L 2 25.5 mmol/L 2.2 30
PV II 15.2 mmol/L 2 13.2 mmol/L 2.0 30
Range of Means on PV Assay Sheet
PV I 23.2–28.2 mmol/L SD: 1.3 U/L
PV II 13.4-20.1 mmol/L SD: 1.0 U/L
Part No. J04498 Performance Verifiers2007-06-25 VITROS Chemistry Systems 61

Answer Key
Is the calculated delta* less than or equal to the delta value**?
YES; (1.0 mmol/L < 2.5 mmol/L).
The calculated delta* is less than the delta value ** from the Delta table; (1.0 mmol/L < 2.5 mmol/L) there is no statistically significant difference between the current monthly mean and the baseline mean for PV I.
PV II: Is the Baseline Mean within the ROM?
NO; 13.2 mmol/L is outside the PV II ROM (13.4 - 20.1 mmol/L)
Is the calculated delta* less than or equal to the delta value**?
YES; calculated delta (2.0 mmol/L) = delta value (2.0 mmol/L).
The calculated delta* is equal to the delta value ** from the Delta table; there is no statistically significant difference between the Preliminary Baseline mean and the Baseline mean for PV II. NOTE: The laboratory should not, however, use these Baseline data for routine QC decisions. Although the performance of PV I is acceptable and there is no statistically significant difference between the PV II Baseline mean and Preliminary Baseline mean, the PV II Baseline mean is outside the ROM. Calibration is verified only when each PV meets all of the evaluation criteria. Investigation is required. Following successful troubleshooting of the System, the laboratory would need to establish a new Baseline mean from 20 -30 days of additional QC data.
d. Are the calculated SDs for the current month acceptable? Explain your reasoning.
NO; The reasoning is as follows:
The Baseline SDs were established using the recommended PV assay sheets SDs.
Calculated delta* for PV I = | Baseline mean – Preliminary Baseline mean |
= (25.5 - 24.5)= 1.0 mmol/L
Note: Use the delta value** for n = 2 from the Delta table (Appendix 2).
Delta Value**, n = 2: = 2.5 mmol/L (Appendix 2)
Calculated delta* for PV II = | Baseline mean – Preliminary Baseline mean |
= (13.2 - 15.2) = 2.0 mmol/L
Note: Use the delta value** for n = 2 from the Delta table (Appendix 2).
Delta Value**, n = 2: = 2.0 mmol/L
Performance Verifiers Part No. J0449862 VITROS Chemistry Systems 2007-06-25

Answer Key
PV I: the Current SD 2.2 mmol/L > Baseline SD 1.3 mmol/L. PV II: the Current SD 2.0 mmol/L > Baseline SD 1.0 mmol/L.
There may be a link between the higher SD and the bias or drift seen in PV II. The investigation should focus on determining this link.
Part No. J04498 Performance Verifiers2007-06-25 VITROS Chemistry Systems 63

Answer Key
Performance Verifiers Part No. J0449864 VITROS Chemistry Systems 2007-06-25


Ortho-Clinical Diagnostics, Inc.100 Indigo Creek DriveRochester, New York 14626-5101