pv power plant lcoe - csp today | new energy update 2010 – 25th anniversary 3 residential...
TRANSCRIPT

PV Power Plant LCOE Matt Campbell
Director, Utility Power Plant Products
December 1, 2010

2
Safe Harbor Statement This presentation contains forward-looking statements within the meaning of the Private Securities
Litigation Reform Act of 1995. Forward-looking statements are statements that do not represent historical
facts and may be based on underlying assumptions. The company uses words and phrases such as
"expects," “believes,” “plans,” “anticipates,” "continue," "growing," "will," to identify forward-looking
statements in this presentation, including forward-looking statements regarding: (a) our plans and
expectations regarding our cost reduction roadmap, (b) cell manufacturing ramp plan, (c) financial
forecasts, (d) Levelized Cost of Energy (LCOE) reduction, (e) future solar and traditional electricity rates,
and (f) future percentage allocation of SunPower solar panels within our systems business. Such forward-
looking statements are based on information available to the company as of the date of this release and
involve a number of risks and uncertainties, some beyond the company's control, that could cause actual
results to differ materially from those anticipated by these forward-looking statements, including risks and
uncertainties such as: (i) the company's ability to obtain and maintain an adequate supply of raw materials
and components, as well as the price it pays for such; (ii) general business and economic conditions,
including seasonality of the industry; (iii) growth trends in the solar power industry; (iv) the continuation of
governmental and related economic incentives promoting the use of solar power; (v) the improved
availability of third-party financing arrangements for the company's customers; (vi) construction difficulties
or potential delays, including permitting and transmission access and upgrades; (vii) the company's ability
to ramp new production lines and realize expected manufacturing efficiencies; (viii) manufacturing
difficulties that could arise; (ix) the success of the company's ongoing research and development efforts to
compete with other companies and competing technologies; and (x) other risks described in the
company's Annual Report on Form 10-K for the year ended January 3rd, 2010, and other filings with the
Securities and Exchange Commission. These forward-looking statements should not be relied upon as
representing the company's views as of any subsequent date, and the company is under no obligation to,
and expressly disclaims any responsibility to, update or alter its forward-looking statements, whether as a
result of new information, future events or otherwise.
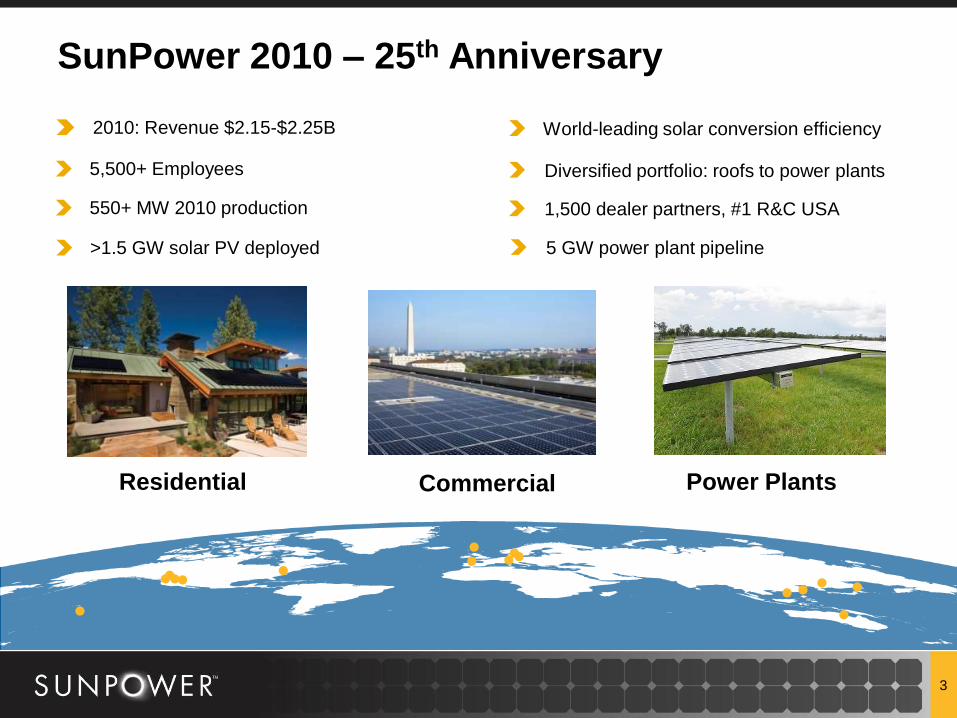
SunPower 2010 – 25th Anniversary
3
Commercial Power Plants Residential
2010: Revenue $2.15-$2.25B
5,500+ Employees
World-leading solar conversion efficiency
1,500 dealer partners, #1 R&C USA
Diversified portfolio: roofs to power plants
550+ MW 2010 production
>1.5 GW solar PV deployed 5 GW power plant pipeline

4
PV Technology Vertical Integration
4
Operation Solar module Systems
Integration EPC
Your Full-Service Utility-Scale PV Technology Partner
Solar cell
Module materials
Manufacturing
Systems
engineering Trackers
Roof mounting
Module reliability
Performance
modeling
Plant
optimization Automated
design software SCADA
Commercial
monitoring
Advanced grid
integration
Long-term
system reliability
SunPower R&D
5 5
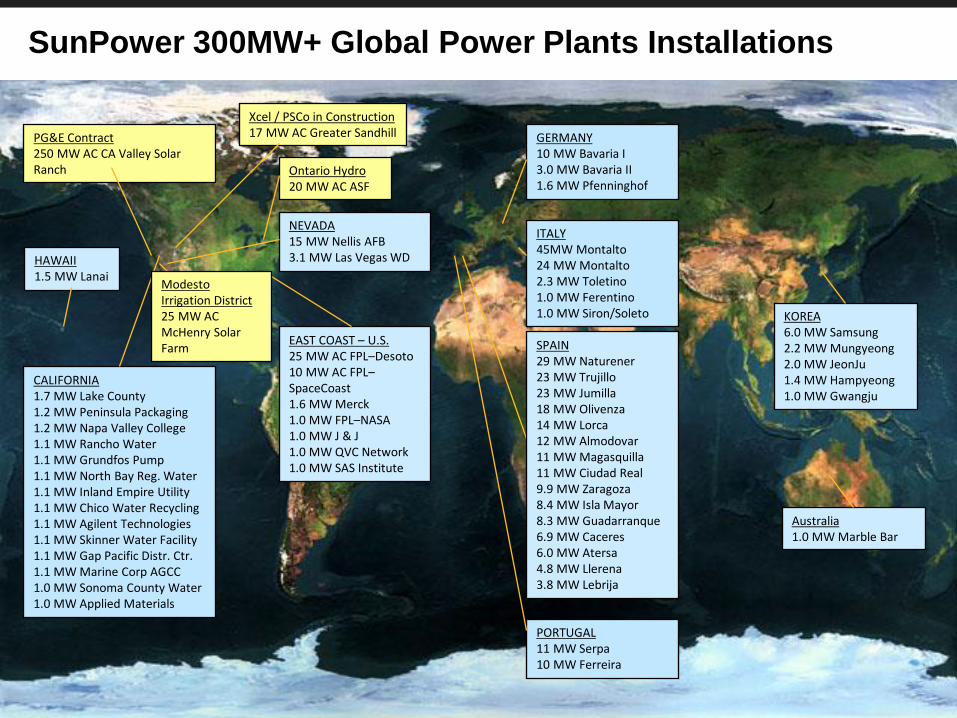
PORTUGAL 11 MW Serpa 10 MW Ferreira
GERMANY 10 MW Bavaria I 3.0 MW Bavaria II 1.6 MW Pfenninghof
KOREA 6.0 MW Samsung 2.2 MW Mungyeong 2.0 MW JeonJu 1.4 MW Hampyeong 1.0 MW Gwangju
HAWAII 1.5 MW Lanai
CALIFORNIA 1.7 MW Lake County 1.2 MW Peninsula Packaging 1.2 MW Napa Valley College 1.1 MW Rancho Water 1.1 MW Grundfos Pump 1.1 MW North Bay Reg. Water 1.1 MW Inland Empire Utility 1.1 MW Chico Water Recycling 1.1 MW Agilent Technologies 1.1 MW Skinner Water Facility 1.1 MW Gap Pacific Distr. Ctr. 1.1 MW Marine Corp AGCC 1.0 MW Sonoma County Water 1.0 MW Applied Materials
NEVADA 15 MW Nellis AFB 3.1 MW Las Vegas WD
SunPower 300MW+ Global Power Plants Installations
SPAIN 29 MW Naturener 23 MW Trujillo 23 MW Jumilla 18 MW Olivenza 14 MW Lorca 12 MW Almodovar 11 MW Magasquilla 11 MW Ciudad Real 9.9 MW Zaragoza 8.4 MW Isla Mayor 8.3 MW Guadarranque 6.9 MW Caceres 6.0 MW Atersa 4.8 MW Llerena 3.8 MW Lebrija
PG&E Contract 250 MW AC CA Valley Solar Ranch
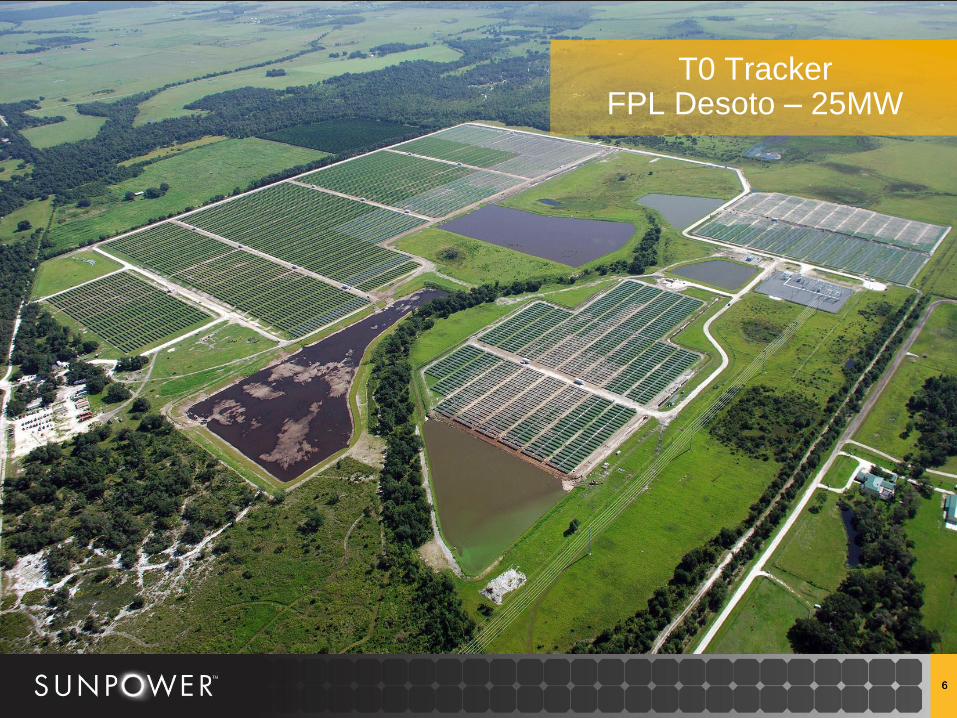
EAST COAST – U.S. 25 MW AC FPL–Desoto 10 MW AC FPL–SpaceCoast 1.6 MW Merck 1.0 MW FPL–NASA 1.0 MW J & J 1.0 MW QVC Network 1.0 MW SAS Institute
ITALY 45MW Montalto 24 MW Montalto 2.3 MW Toletino 1.0 MW Ferentino 1.0 MW Siron/Soleto
Xcel / PSCo in Construction 17 MW AC Greater Sandhill
Australia 1.0 MW Marble Bar
Modesto Irrigation District 25 MW AC McHenry Solar Farm
Ontario Hydro 20 MW AC ASF
6 6
T0 Tracker FPL Desoto – 25MW

Levelized Cost of Energy (LCOE)
The LCOE equation is one analytical tool that can be used to compare the cost of energy from alternative technologies when different scales
of operation, investment or operating time periods exist
7

Why Costs Must be Levelized
Low carbon energy sources such as solar, wind, nuclear, and hydro share the properties of higher up-front capital costs and lower annual operating costs
8
$-
$2,000,000
$4,000,000
$6,000,000
$8,000,000
$10,000,000
$12,000,000
$14,000,000
$16,000,000
$18,000,000
$20,000,000
2011 2016 2021 2026 2031 2036 2041 2046
Simplified Annual Cash Costs for a 10MW PV Power Plant

Why Costs Must be Levelized
Fossil fuel based energy sources have lower capital costs and higher annual costs which are highly sensitive to fuel inflation
9
Simplified Annual Cash Costs for a 10MW Fossil Fuel Plant
$-
$1,000,000
$2,000,000
$3,000,000
$4,000,000
$5,000,000
$6,000,000
$7,000,000
$8,000,000
$9,000,000
$10,000,000
2011 2016 2021 2026 2031 2036 2041 2046
4% Inflation
2% Inflation

Using LCOE to Evaluate Solar Power Plant Technologies
10
Silicon PV
Thin Film PV
CPV Dish Sterling CSP Parabolic Trough CSP
CLFR CSP Heliostat / Tower CSP

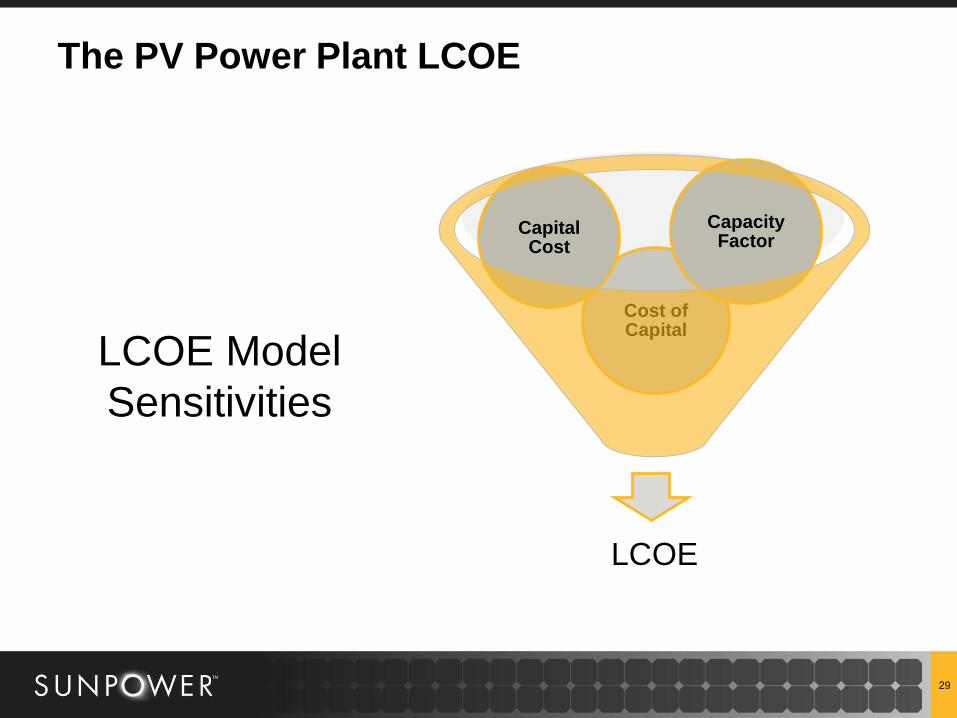
The PV Power Plant LCOE
LCOE
Cost of Capital
Capital Cost
Capacity Factor
Capital cost, capacity factor, and cost of capital equally affect the levelized cost of energy (LCOE)
11

Detailing the LCOE
12
Initial investment Area related costs
Grid interconnection costs
Project related costs
Is the present value of the
benefit over the financed
life of the project asset.
Annual Costs Annual system operating and
maintenance costs ( inverter
maintenance, panel cleaning,
monitoring..)
Depreciation Tax/
other Public Benefit System Residual Value Present value of the end of life
asset value is deducted from
the total life cycle cost in the
LCOE calculation.
System energy production
First year energy generating
(kWh/kwp) then degrading
output over the system life
based on an annual
performance degradation rate
n = the system’s financing term
(which will determine the
duration of cash flows)
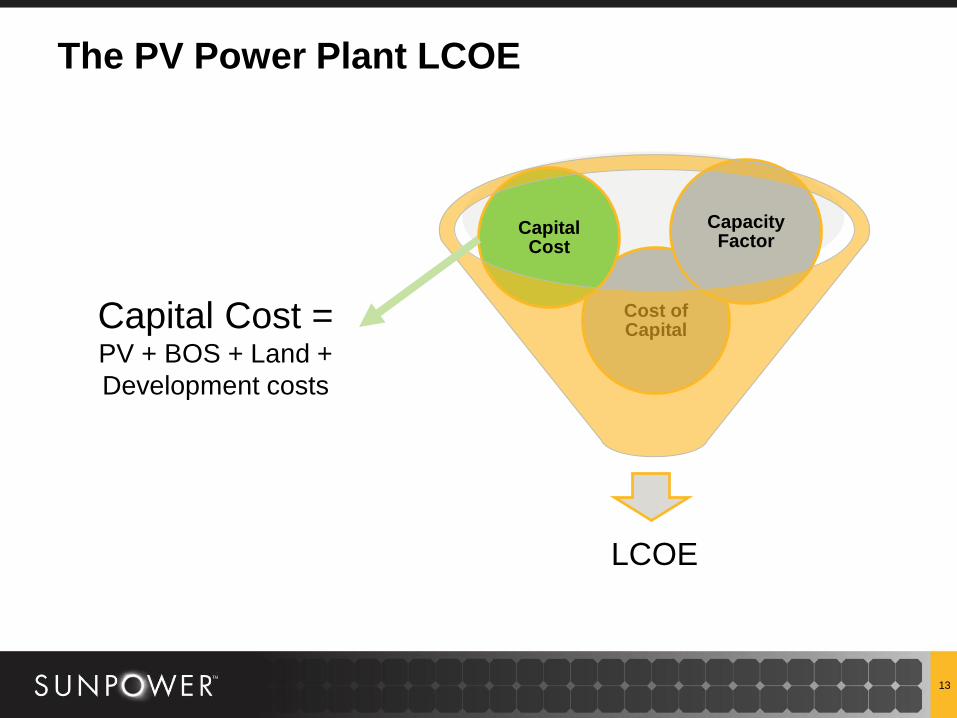
The PV Power Plant LCOE
LCOE
Cost of Capital
Capital Cost
Capacity Factor
13
Capital Cost = PV + BOS + Land +
Development costs

Capital Cost Levers for PV Power Plants
Panel cost
– Increase manufacturing scale
– Improve conversion efficiency
– Reduce material consumption
– Simplify manufacturing processes
BOS cost
– Reduce materials through design
– Reduce materials through panel efficiency
– Reduce labor through design
– Reduce labor through panel efficiency
– Reduce skill required for construction
– Optimize supply chain
– Accelerate construction timelines
14
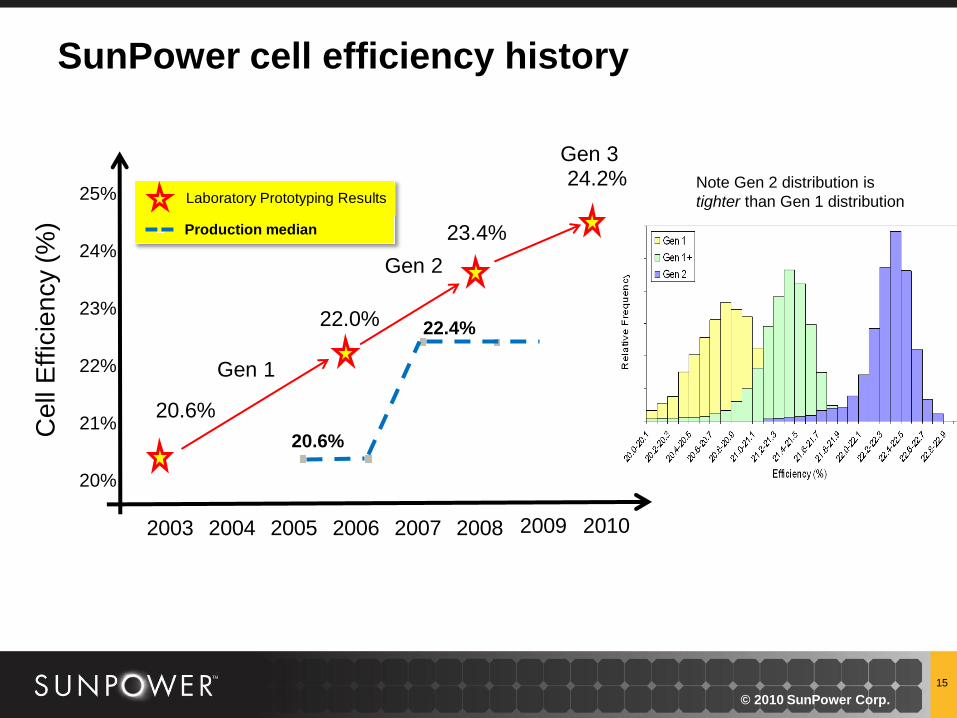
SunPower cell efficiency history
2005 2006 2007 2008
Cell
Eff
icie
ncy (
%)
2004 2003
20%
21%
22%
23%
24%
25%
20.6%
22.0%
23.4%
20.6%
22.4%
Laboratory Prototyping Results
Production median
2009 2010
24.2%
Gen 1
Gen 2
Gen 3
15
© 2010 SunPower Corp.
Note Gen 2 distribution is
tighter than Gen 1 distribution
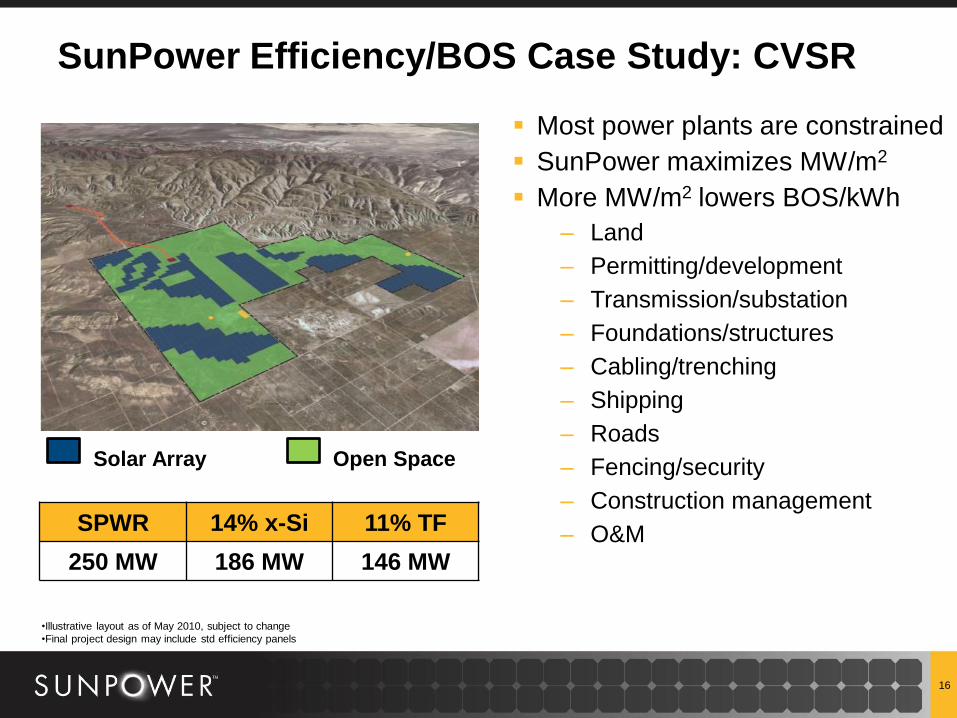
SunPower Efficiency/BOS Case Study: CVSR
Most power plants are constrained
SunPower maximizes MW/m2
More MW/m2 lowers BOS/kWh
– Land
– Permitting/development
– Transmission/substation
– Foundations/structures
– Cabling/trenching
– Shipping
– Roads
– Fencing/security
– Construction management
– O&M
16
SPWR 14% x-Si 11% TF
250 MW 186 MW 146 MW
Solar Array Open Space
•Illustrative layout as of May 2010, subject to change
•Final project design may include std efficiency panels

17
1.4GW - Fab 3: Production Begins Q4 2010

Oasis Evolution: Standard systems, lower cost, more features
2007
12 MW Nellis
18
2010
19 MW Xcel
2011
25+ MW
Feature T20 Gen 1 T20 Gen 2 Oasis 2011
Panel 225 W 400 W 425 W
Capacity per tracker 2.5 kWp 3.6 kWp 17.0 kWp
Pre-fabricated structure Yes Yes Yes
Advanced inverter functionality Yes Yes
Pre-fabricated electrical Yes
Turn-key AC power block Yes

Oasis Power Blocks Drive Standardization, Enable Whole System Component Sales
Oasis blocks rotate to fit land boundaries
19
1 MW Power Block = SKU
Tracker blocks = standard units
- Configure to fit land boundary
- Smallest block = 300 kWdc
Inverter/power electronics standard blocks
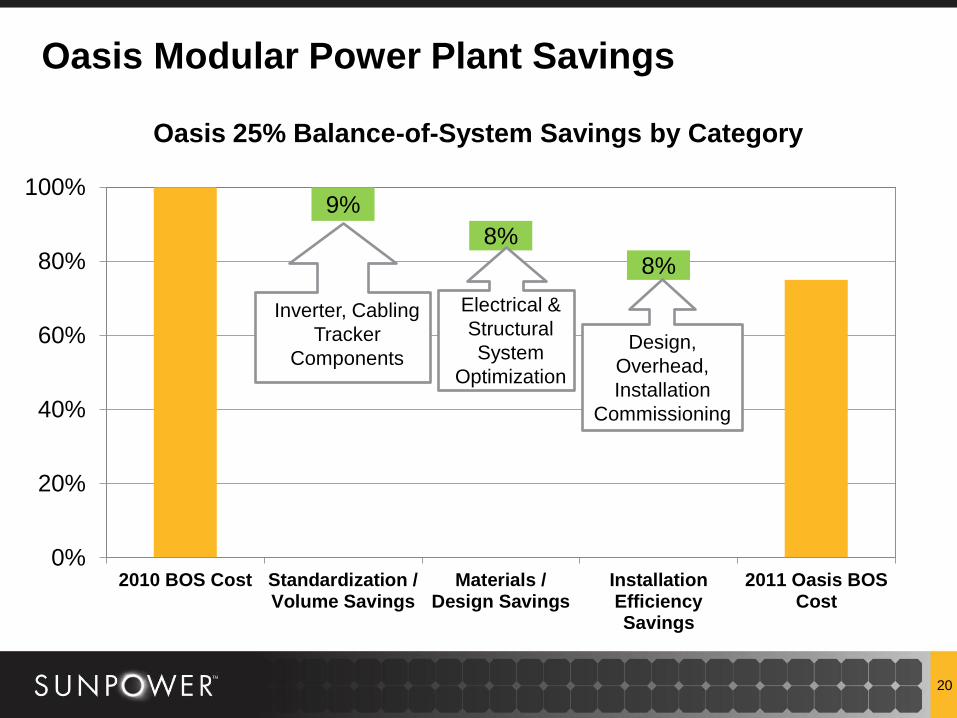
9%
8%
8%
0%
20%
40%
60%
80%
100%
2010 BOS Cost Standardization /Volume Savings
Materials /Design Savings
InstallationEfficiencySavings
2011 Oasis BOSCost
Inverter, Cabling
Tracker
Components
Oasis Modular Power Plant Savings
20
Oasis 25% Balance-of-System Savings by Category
Electrical &
Structural
System
Optimization
Design,
Overhead,
Installation
Commissioning

The PV Power Plant LCOE
LCOE
Cost of Capital
Capital Cost
Capacity Factor
21
Capacity Factor =
Net Actual Generation
Period Hours x
Net Maximum Capacity
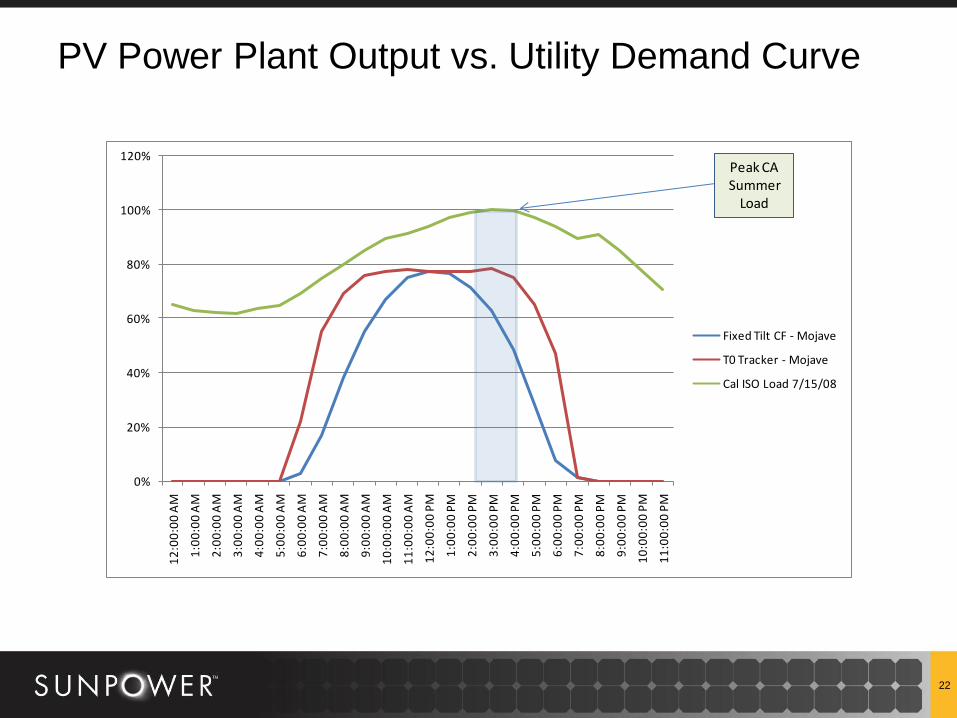
PV Power Plant Output vs. Utility Demand Curve
22
0%
20%
40%
60%
80%
100%
120%
12
:00
:00
AM
1:0
0:0
0 A
M
2:0
0:0
0 A
M
3:0
0:0
0 A
M
4:0
0:0
0 A
M
5:0
0:0
0 A
M
6:0
0:0
0 A
M
7:0
0:0
0 A
M
8:0
0:0
0 A
M
9:0
0:0
0 A
M
10
:00
:00
AM
11
:00
:00
AM
12
:00
:00
PM
1:0
0:0
0 P
M
2:0
0:0
0 P
M
3:0
0:0
0 P
M
4:0
0:0
0 P
M
5:0
0:0
0 P
M
6:0
0:0
0 P
M
7:0
0:0
0 P
M
8:0
0:0
0 P
M
9:0
0:0
0 P
M
10
:00
:00
PM
11
:00
:00
PM
Fixed Tilt CF - Mojave
T0 Tracker - Mojave
Cal ISO Load 7/15/08
Peak CA Summer
Load

23
Energy Performance & Capacity Factor
Independent tests show that SunPower panels deliver the highest capacity factors at sites around the world
Dept. of Energy
(DOE) ASU*
Independent Sites
SunPower Sites
CREST
University of
Cypress / Stuttgart
5% higher than HIT
9% higher than Poly-Si
7% higher than Poly-Si
7% Higher than CdTe

Capacity Factor over Time – Impact of Degradation
Simplified, illustrative annual PV power plant capacity factor over time: fixed vs. tracking at 2 degradation rates
24
15.00%
17.00%
19.00%
21.00%
23.00%
25.00%
27.00%
29.00%
31.00%
33.00%
1 6 11 16 21 26 31 36
Tracker @ 0.5% Degradation
Fixed @ 0.8% Degradation
25%
40%
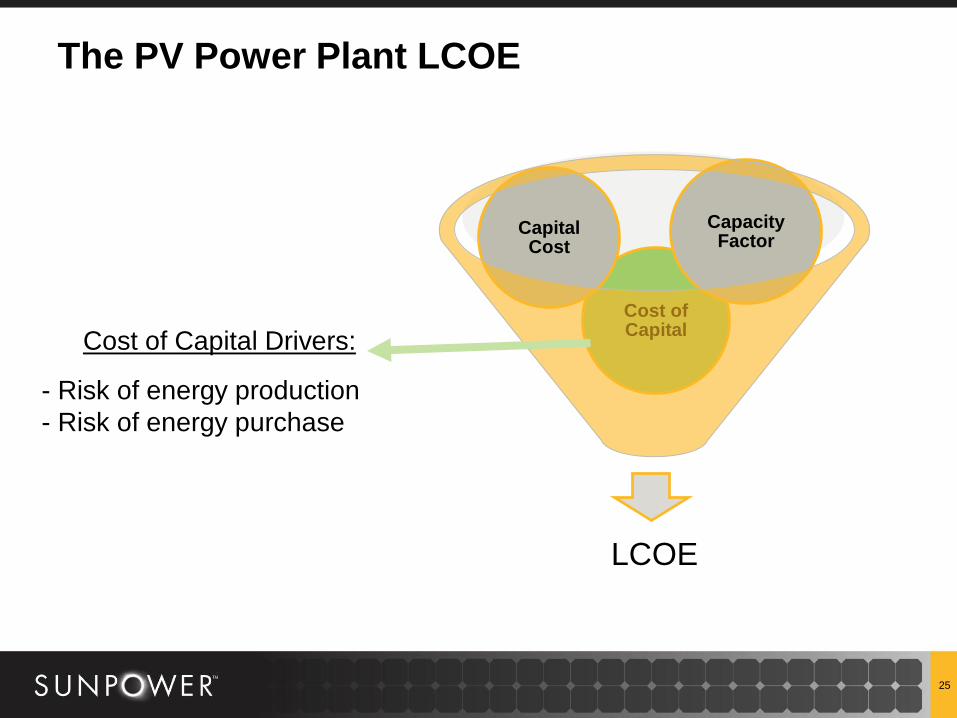
The PV Power Plant LCOE
LCOE
Cost of Capital
Capital Cost
Capacity Factor
25
Cost of Capital Drivers:
- Risk of energy production
- Risk of energy purchase
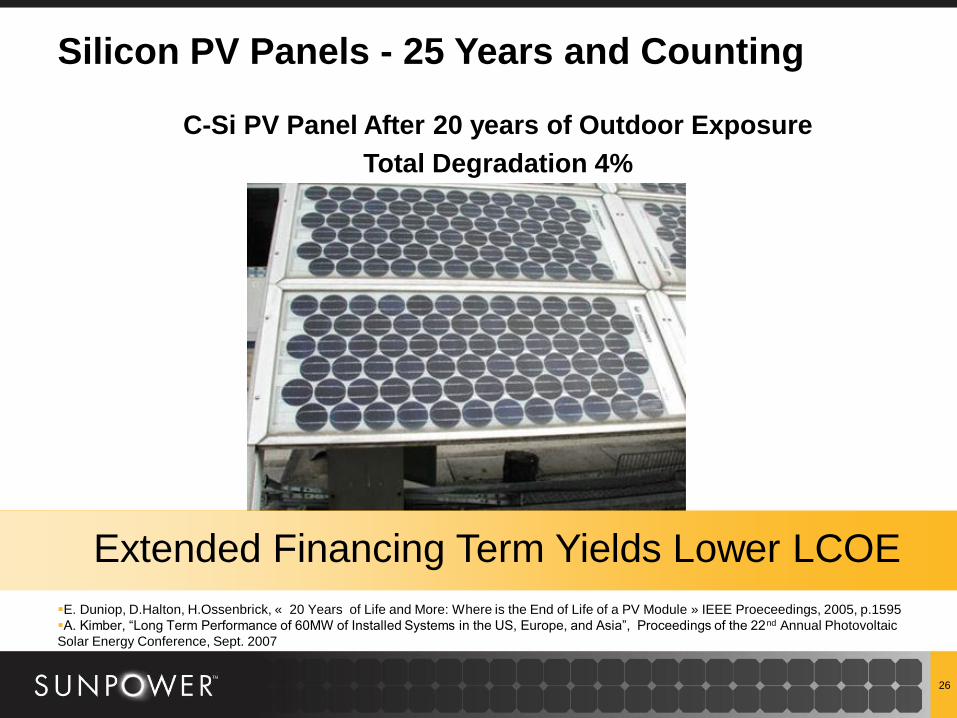
Silicon PV Panels - 25 Years and Counting
C-Si PV Panel After 20 years of Outdoor Exposure
Total Degradation 4%
E. Duniop, D.Halton, H.Ossenbrick, « 20 Years of Life and More: Where is the End of Life of a PV Module » IEEE Proeceedings, 2005, p.1595
A. Kimber, “Long Term Performance of 60MW of Installed Systems in the US, Europe, and Asia”, Proceedings of the 22nd Annual Photovoltaic
Solar Energy Conference, Sept. 2007
26
Extended Financing Term Yields Lower LCOE
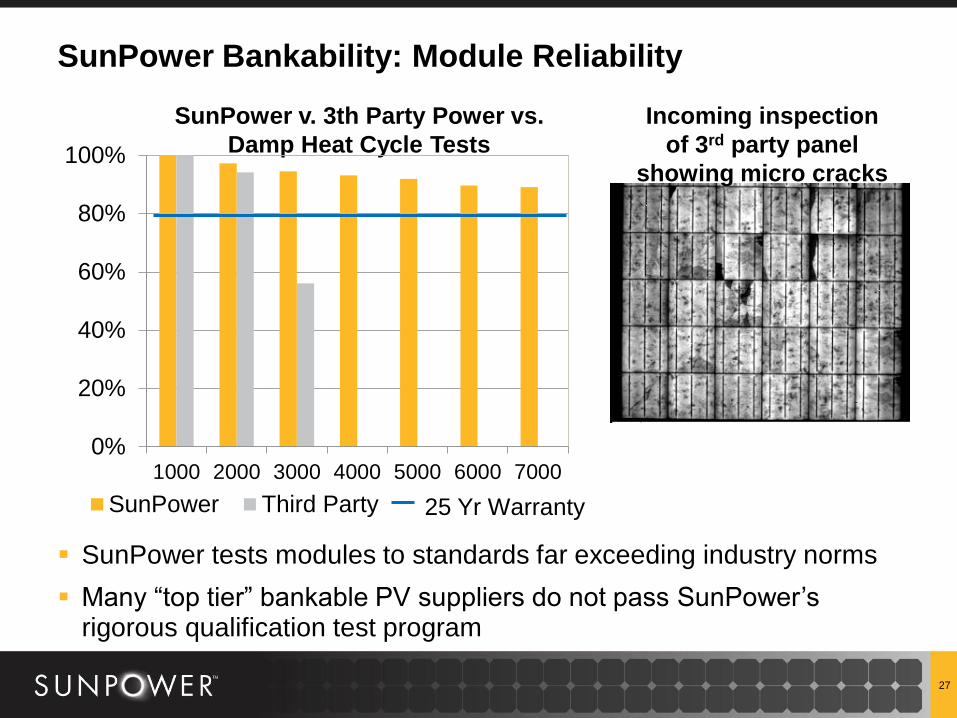
SunPower Bankability: Module Reliability
27
Incoming inspection
of 3rd party panel
showing micro cracks
SunPower v. 3th Party Power vs.
Damp Heat Cycle Tests
SunPower tests modules to standards far exceeding industry norms
Many “top tier” bankable PV suppliers do not pass SunPower’s rigorous qualification test program
0%
20%
40%
60%
80%
100%
1000 2000 3000 4000 5000 6000 7000
SunPower Third Party 25 Yr Warranty

SunPower Bankability: Reliable System Energy Delivery
28
SunPower has delivered >1 TWh solar energy: consistently exceeding performance predictions
SunPower received the first investment grade rating for a PV Power Plant bond
Focus on bankability yields lower cost of money, 100bps = ~$0.30/Wp of ASP
2005 2006 2007 2008 2009
Expected Energy Production Actual Energy Production
Actual vs. Expected Annual Production: 106.2% SPWR Operations Center
The PV Power Plant LCOE
LCOE
Cost of Capital
Capital Cost
Capacity Factor
29
LCOE Model
Sensitivities
30
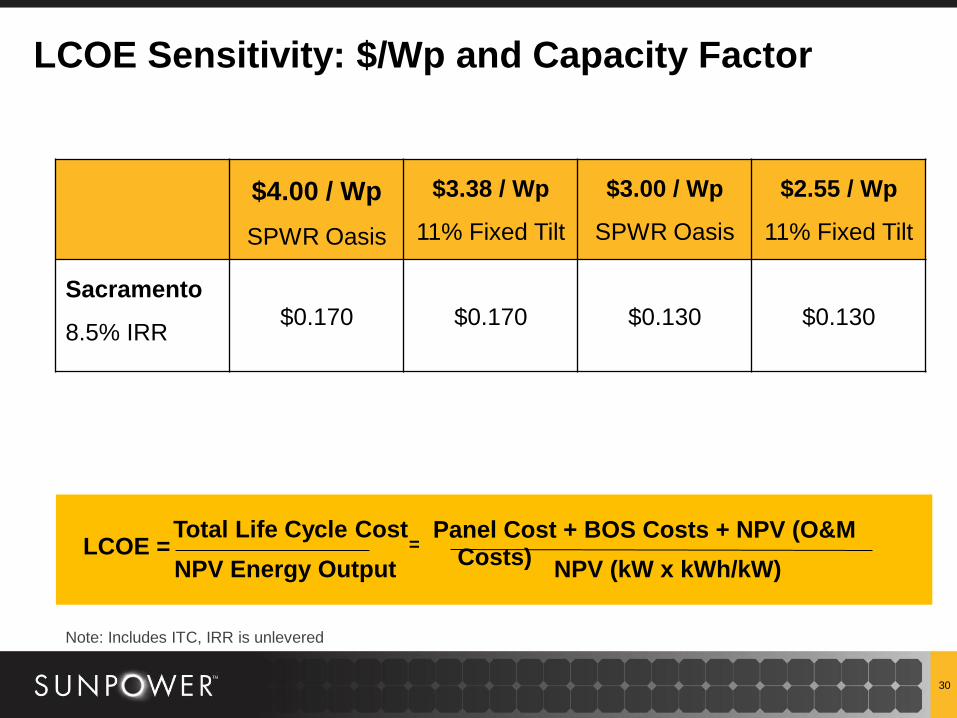
Total Life Cycle Cost
NPV Energy Output LCOE =
Panel Cost + BOS Costs + NPV (O&M Costs)
NPV (kW x kWh/kW) =
LCOE Sensitivity: $/Wp and Capacity Factor
$4.00 / Wp
SPWR Oasis
$3.38 / Wp
11% Fixed Tilt
$3.00 / Wp
SPWR Oasis
$2.55 / Wp
11% Fixed Tilt
Sacramento
8.5% IRR
$0.170
$0.170
$0.130
$0.130
Note: Includes ITC, IRR is unlevered

31
Total Life Cycle Cost
NPV Energy Output LCOE =
Panel Cost + BOS Costs + NPV (O&M Costs)
NPV (kW x kWh/kW) =
LCOE Sensitivity: Location and Cost of Capital
$4.00 / Wp
SPWR Oasis
$3.38 / Wp
11% Fixed Tilt
$3.00 / Wp
SPWR Oasis
$2.55 / Wp
11% Fixed Tilt
Sacramento
8.5% IRR
$0.170
$0.170
$0.130
$0.130
Mojave
7.5% IRR
$0.128
$0.131
$0.097
$0.100
Note: Includes ITC, IRR is unlevered

SunPower LCOE Advantages ― 100GWh Plant*
Note: Illustrative 100 GWh / year power plant, Phoenix, AZ
SunPower LCOE Advantages
SunPower 11% TF Fixed
GWh/yr 100 100
MW 37 46
Acres 191 351
Inverters 74 92
SunPower delivers the same GWh using far fewer acres and less BOS leading to
lower O&M costs
SunPower Thin Film
32
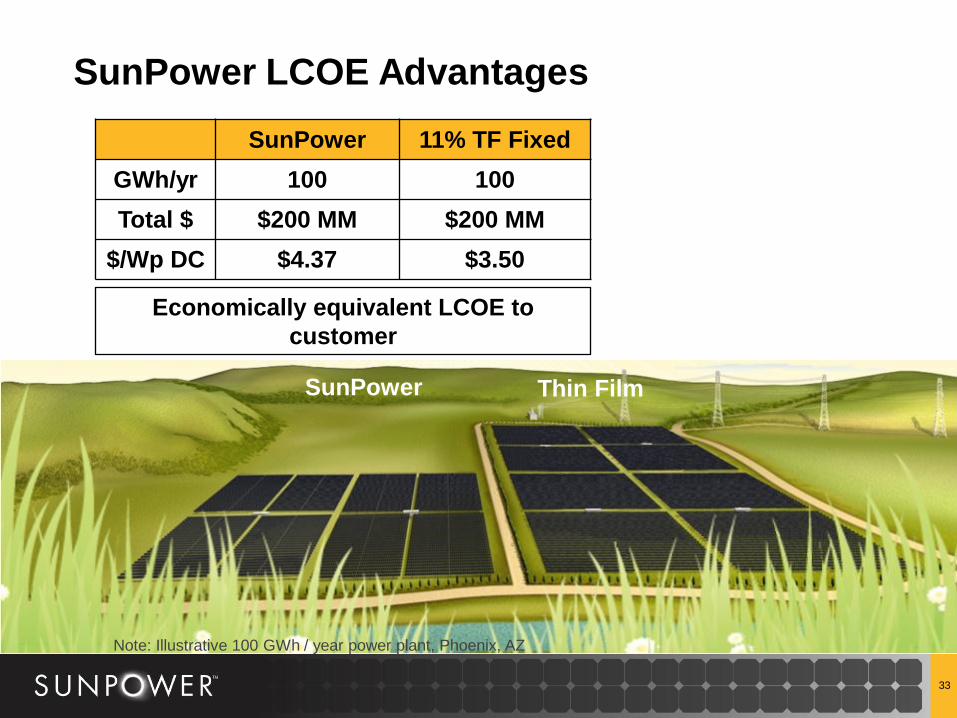
SunPower LCOE Advantages ― 100GWh Plant* SunPower LCOE Advantages
SunPower 11% TF Fixed
GWh/yr 100 100
Total $ $200 MM $200 MM
$/Wp DC $4.37 $3.50
SunPower Thin Film
Economically equivalent LCOE to
customer
33
Note: Illustrative 100 GWh / year power plant, Phoenix, AZ

34
Alamosa 19 MW: Xcel
Alamosa County, CO

35
Amherstburg Solar Farm, 20 MW
Ontario, Canada

36
Montalto 72 MW: Lazio, Italy
Largest Solar Power Plant (GWh)

37
9 MW in Progress
Alange, Spain

38
First Systems in Greece
Crete

39
First T0 Tracker in India
Hyderabad
40
…and we’re putting power plants
on rooftops too…
6MW T5 Installation for
Southen California Edison
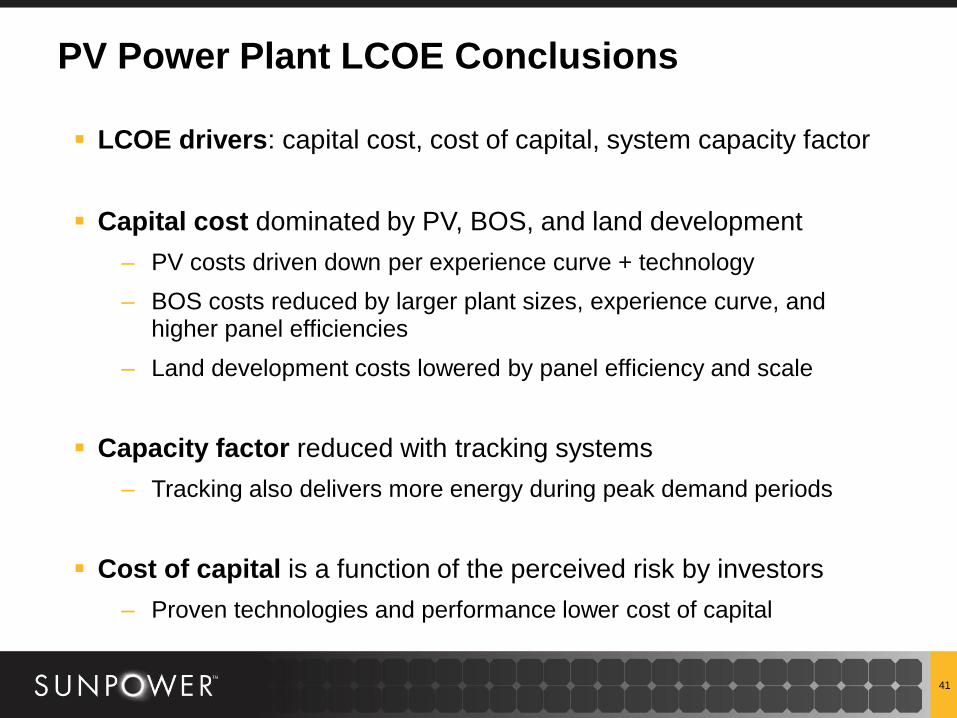
PV Power Plant LCOE Conclusions
LCOE drivers: capital cost, cost of capital, system capacity factor
Capital cost dominated by PV, BOS, and land development
– PV costs driven down per experience curve + technology
– BOS costs reduced by larger plant sizes, experience curve, and higher panel efficiencies
– Land development costs lowered by panel efficiency and scale
Capacity factor reduced with tracking systems
– Tracking also delivers more energy during peak demand periods
Cost of capital is a function of the perceived risk by investors
– Proven technologies and performance lower cost of capital
41