pushing the limits of ir …an update of new possibilities in cls spectroscopy ferenc borondics cap...
Post on 20-Dec-2015
216 views
TRANSCRIPT

Pushing the limits of IR
…an update of new possibilities in CLS
spectroscopy
Ferenc Borondics
CAP Meeting 2011, St. John’s, NL

“
The Canadian Light Source
Location, location, location...
“

The Mid IR beamline

The Mid IR beamline
Source Bending Magnet
Energy range
~200 – 8000 cm-1 (0.025 – 1 eV)
Resolution ~0.1 – 16 cm-1
Spot size Diffraction limited

Synchrotron advantage for Mid IR
Globar(black body)
Synchrotron

Microscopy…
X-ray microscope
Big objective
Oil immersion objectiveN
A =
0.6
5
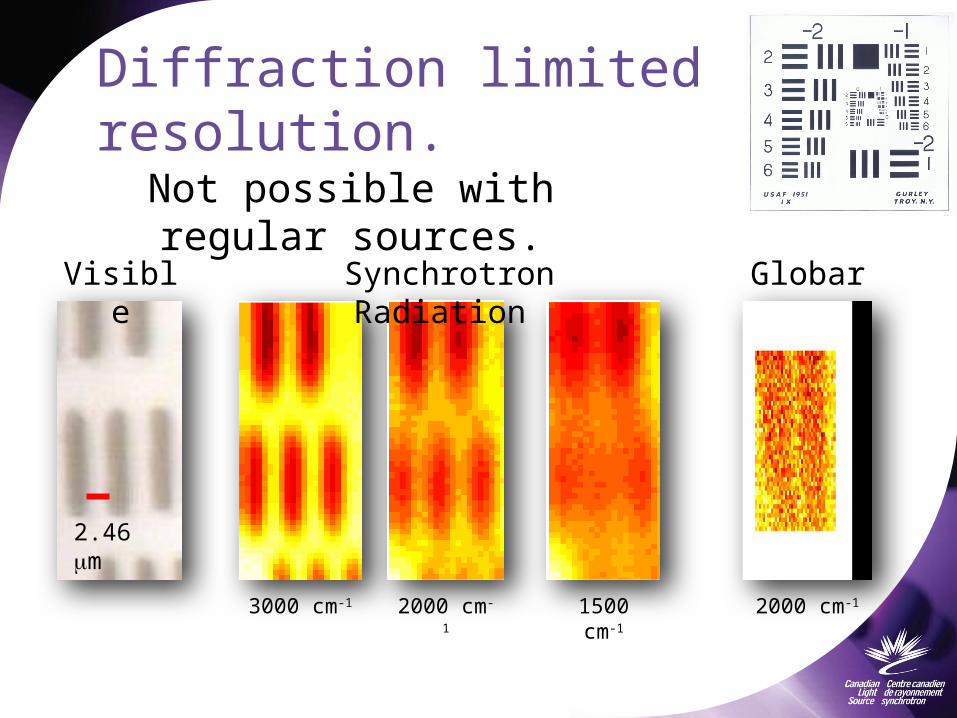
Diffraction limited resolution.
Not possible with regular sources.
2.46 μm
3000 cm-
1
2000 cm-1
1500 cm-1
2000 cm-1
Synchrotron Radiation GlobarVisible

Microscopy
SR FPA imaging
Reflectionsetup
Time resolved measurements
4ns time resolution, Step/Scan bench
TransmissionReflectionGrazing IncidenceATR
64x64 element FPA, Hyperion 3000
Micro-PAS
Low temperature
…recent developments
PEM for polarizationNIR detection
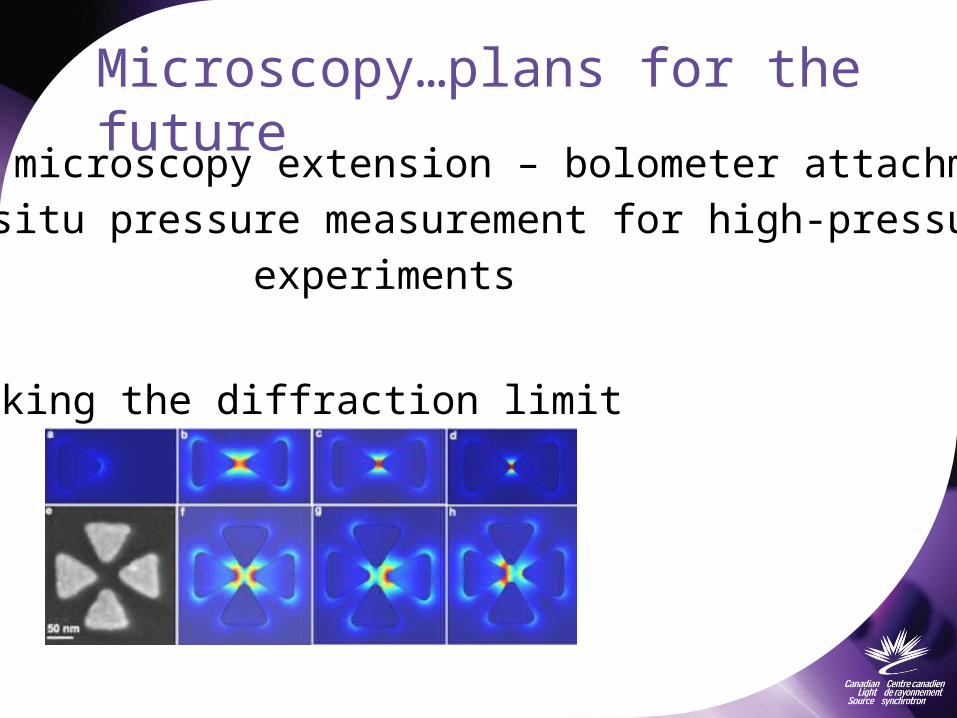
Microscopy…plans for the future
FIR microscopy extension – bolometer attachmentIn situ pressure measurement for high-pressure
experiments
Breaking the diffraction limit

Microscopy…plans for the future
New beamline

Users – various fields
Usage: 68% oversubscribed
Biology: seeds, tissue sections, plant sciences, paleontology, environmental science
60%
Chemistry: electrochemistry, fundamental food science, diamonds15%
Physics: solid state physics, geophysics, high-pressure superconductivity15%
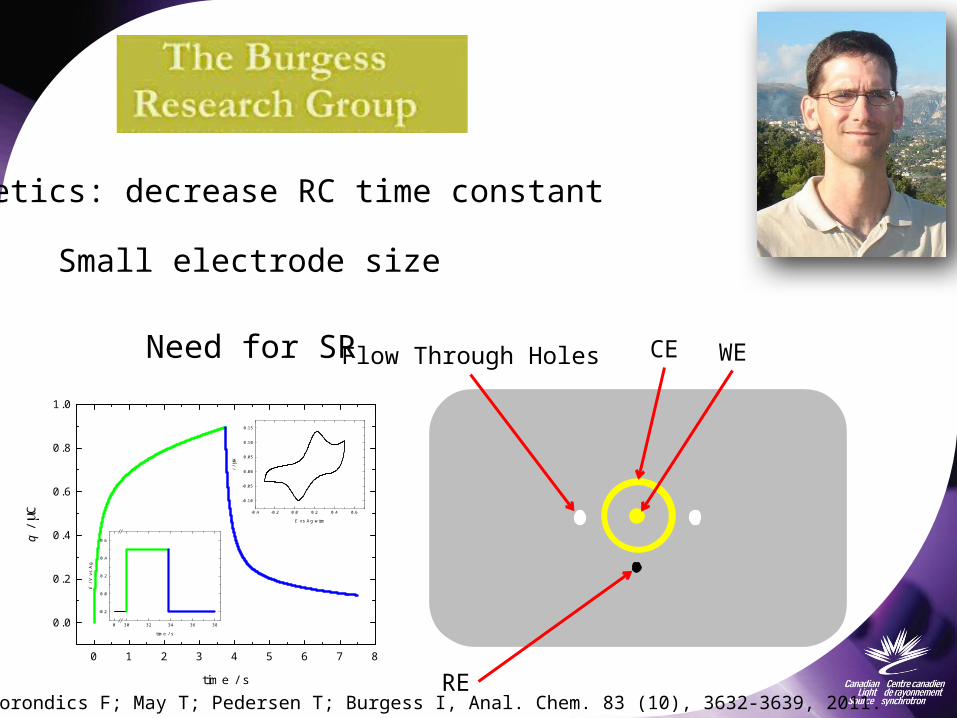
CE WE
RE
Flow Through Holes
Kinetics: decrease RC time constant
Small electrode size
Need for SR
0 1 2 3 4 5 6 7 8
0.0
0.2
0.4
0.6
0.8
1.0
q /
μC
time / s
-0.4 -0.2 0.0 0.2 0.4 0.6
-0.10
-0.05
0.00
0.05
0.10
0.15
i / μ
A
E vs Ag wire
0 30 32 34 36 38
-0.2
0.0
0.2
0.4
0.6
E /
V v
s A
g
time / s
Rosendahl SM; Borondics F; May T; Pedersen T; Burgess I, Anal. Chem. 83 (10), 3632-3639, 2011.
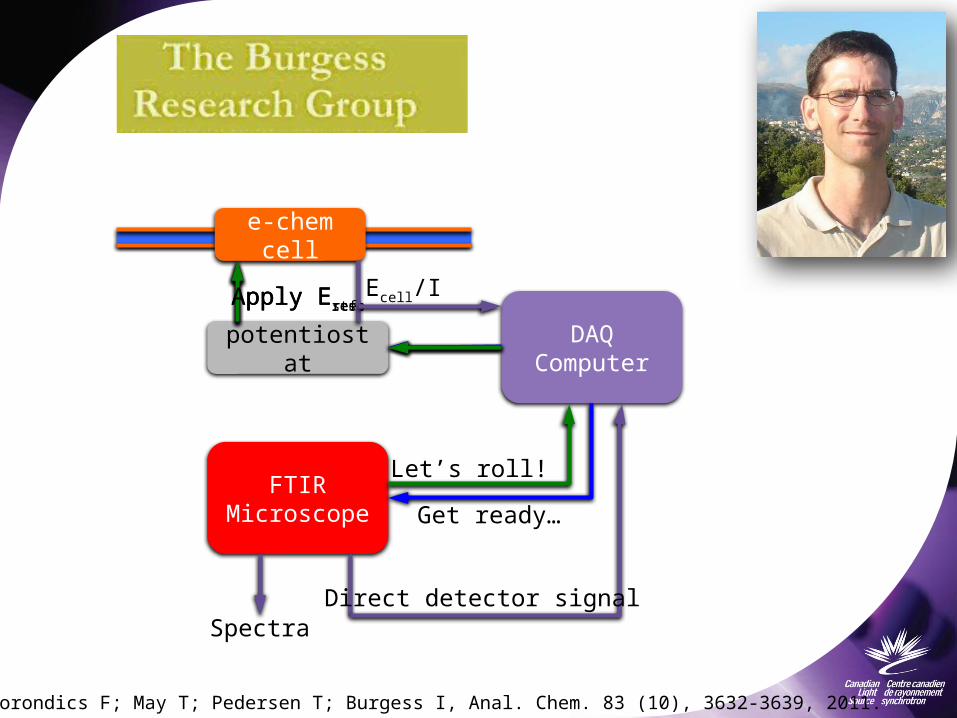
potentiostat
Apply Erest
DAQComputer
FTIRMicroscope
e-chem cell
Apply Eref
Get ready…
Let’s roll!
Apply Estep
SpectraDirect detector signal
Ecell/I
Rosendahl SM; Borondics F; May T; Pedersen T; Burgess I, Anal. Chem. 83 (10), 3632-3639, 2011.
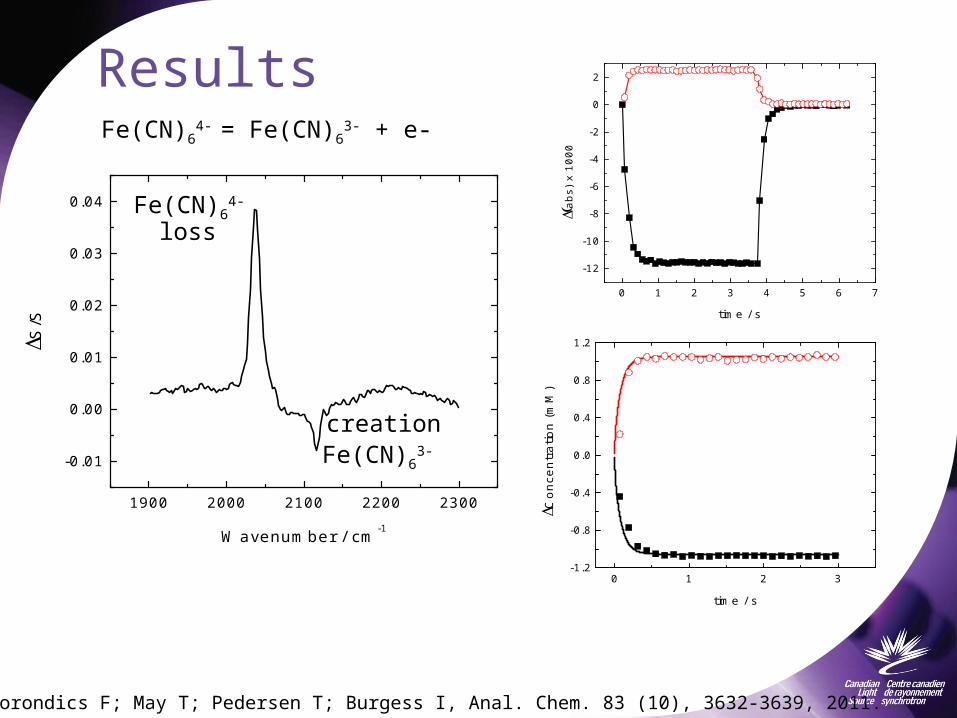
Results
1900 2000 2100 2200 2300
-0.01
0.00
0.01
0.02
0.03
0.04
S/S
Wavenumber / cm-1
0 1 2 3 4 5 6 7
-12
-10
-8
-6
-4
-2
0
2
ab
s) x
100
0
time / s
0 1 2 3-1.2
-0.8
-0.4
0.0
0.4
0.8
1.2
Co
nce
ntr
atio
n (
mM
)
time / s
Fe(CN)64- = Fe(CN)6
3- + e-
Fe(CN)64-
Fe(CN)63-
loss
creation
Rosendahl SM; Borondics F; May T; Pedersen T; Burgess I, Anal. Chem. 83 (10), 3632-3639, 2011.

http://www.physics.utoronto.ca/~kburch/
20μm
42nm160nm 110nm
100nm10μm
20μm
13nm
L.J. Sandilands et al., PRB 82, 064503 (2010)
Bi2Sr2Ca1-xDyxCu2O8+δ
x=0.3,0.4
Exfoliated superconductors
Topological insulators
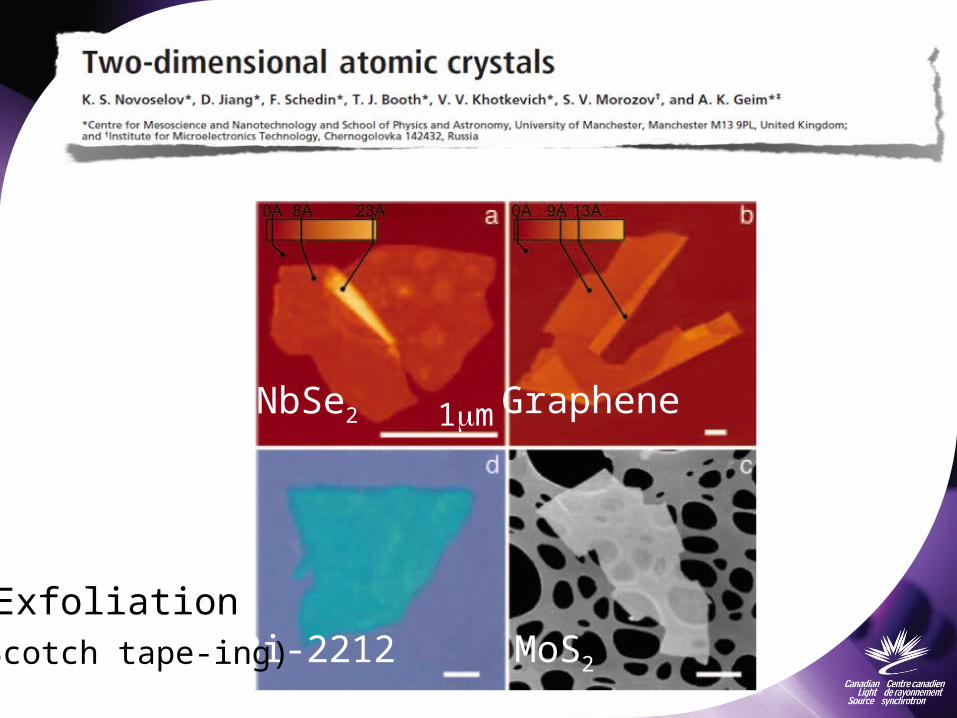
NbSe2
Bi-2212 MoS2
Graphene1mm
Exfoliation (Scotch tape-ing)

…another example (ALS)

Bilayer graphene

Thank you!
Mid IR beamlineCanadian Light Source
http://midir.lightsource.ca