purdue energy academy / june 12, 2012 innovation in the ... · innovation in the energy business...
TRANSCRIPT
siemens.com/answers © Siemens AG 20XX All rights reserved.
Innovation in the Energy Business What’s the big deal?
Purdue Energy Academy / June 12, 2012
© Siemens AG 2013 All rights reserved. Page 2
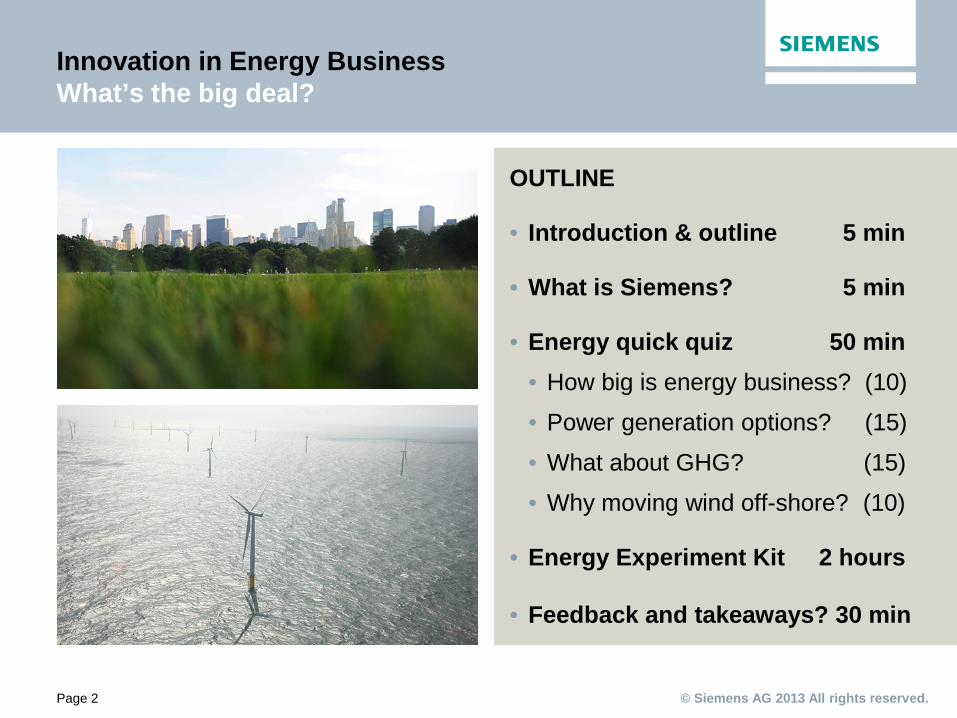
OUTLINE
• Introduction & outline 5 min
• What is Siemens? 5 min
• Energy quick quiz 50 min • How big is energy business? (10)
• Power generation options? (15)
• What about GHG? (15)
• Why moving wind off-shore? (10)
• Energy Experiment Kit 2 hours
• Feedback and takeaways? 30 min
Innovation in Energy Business What’s the big deal?
© Siemens AG 2013 All rights reserved. Page 3
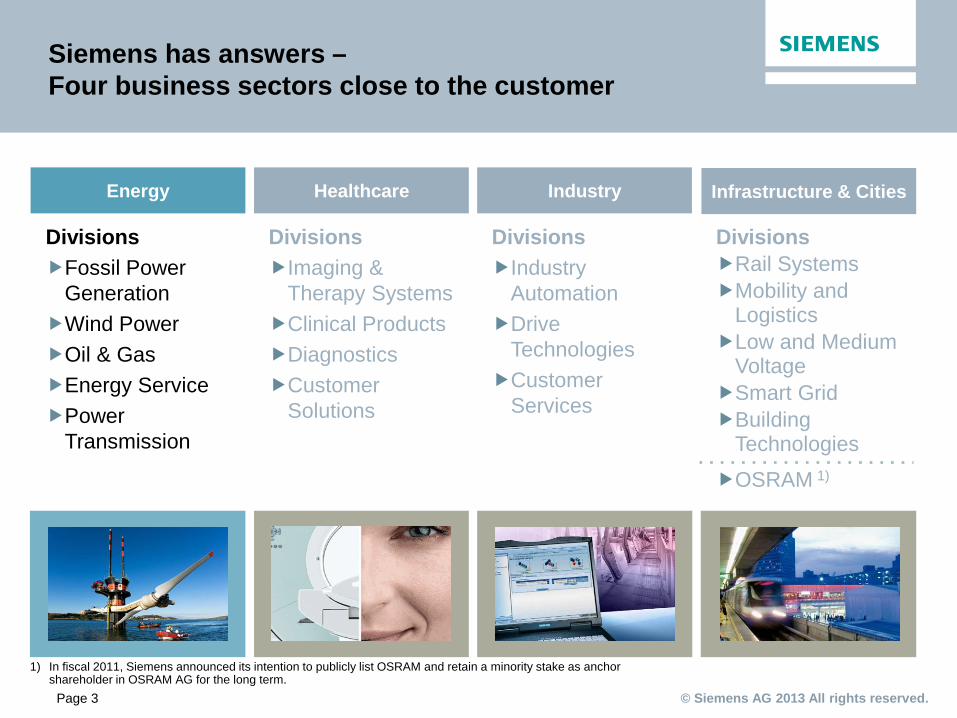
Divisions Fossil Power
Generation Wind Power Oil & Gas Energy Service Power
Transmission
Divisions Imaging &
Therapy Systems Clinical Products Diagnostics Customer
Solutions
Divisions Industry
Automation Drive
Technologies Customer
Services
Divisions Rail Systems Mobility and
Logistics Low and Medium
Voltage Smart Grid Building
Technologies
OSRAM 1)
Siemens has answers – Four business sectors close to the customer
Energy Healthcare Industry Infrastructure & Cities
1) In fiscal 2011, Siemens announced its intention to publicly list OSRAM and retain a minority stake as anchor shareholder in OSRAM AG for the long term.
© Siemens AG 2013 All rights reserved. Page 4
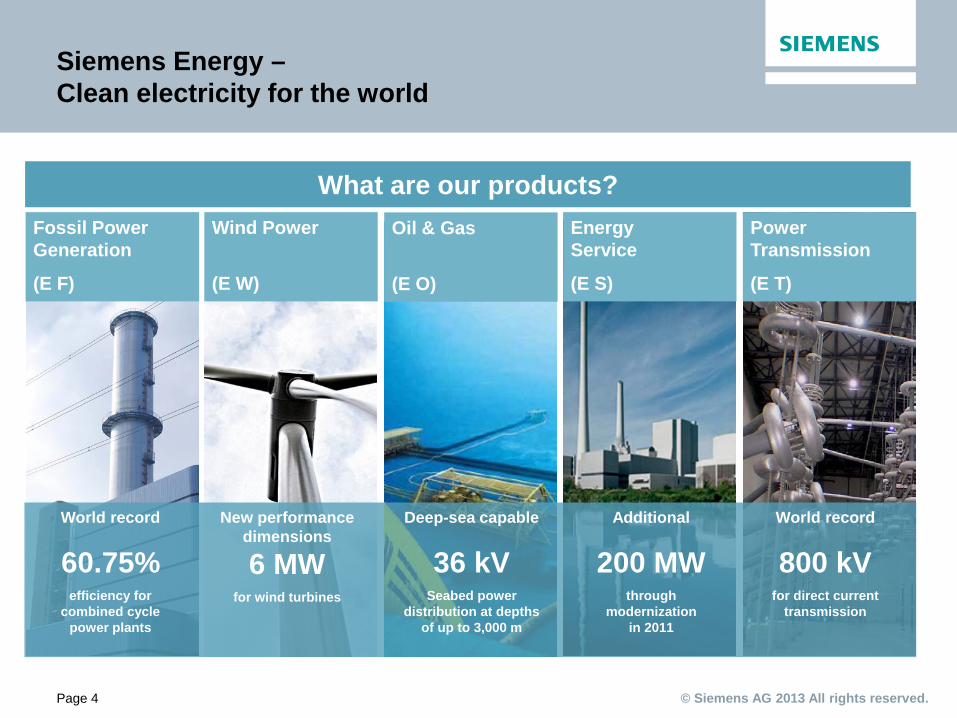
What are our products?
Siemens Energy – Clean electricity for the world
Fossil Power Generation
(E F)
Wind Power
(E W)
Oil & Gas
(E O)
Energy Service
(E S)
Power Transmission
(E T)
Additional
200 MW through
modernization in 2011
World record
800 kV for direct current
transmission
Deep-sea capable
36 kV Seabed power
distribution at depths of up to 3,000 m
World record
60.75% efficiency for
combined cycle power plants
New performance dimensions
6 MW for wind turbines
© Siemens AG 2013 All rights reserved. Page 5
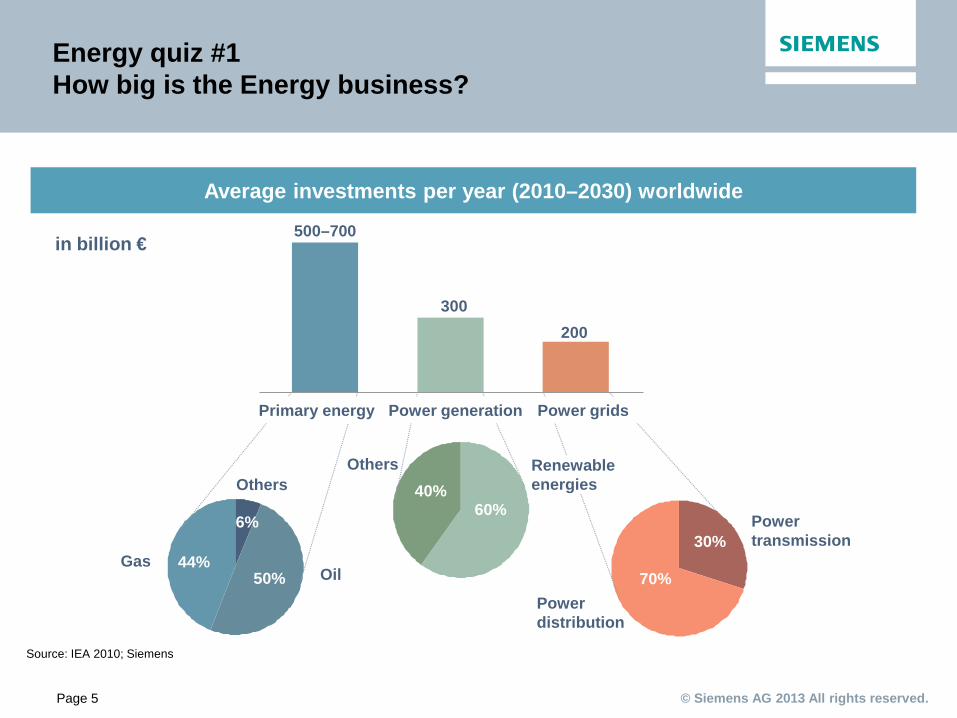
Average investments per year (2010–2030) worldwide
Energy quiz #1 How big is the Energy business?
500–700
300 200
in billion €
Gas
Others
Oil
Power distribution
Power transmission
70%
30%
40% 60%
44% 50%
6%
Source: IEA 2010; Siemens
Others
Primary energy Power grids Power generation
Renewable energies
© Siemens AG 2013 All rights reserved. Page 6
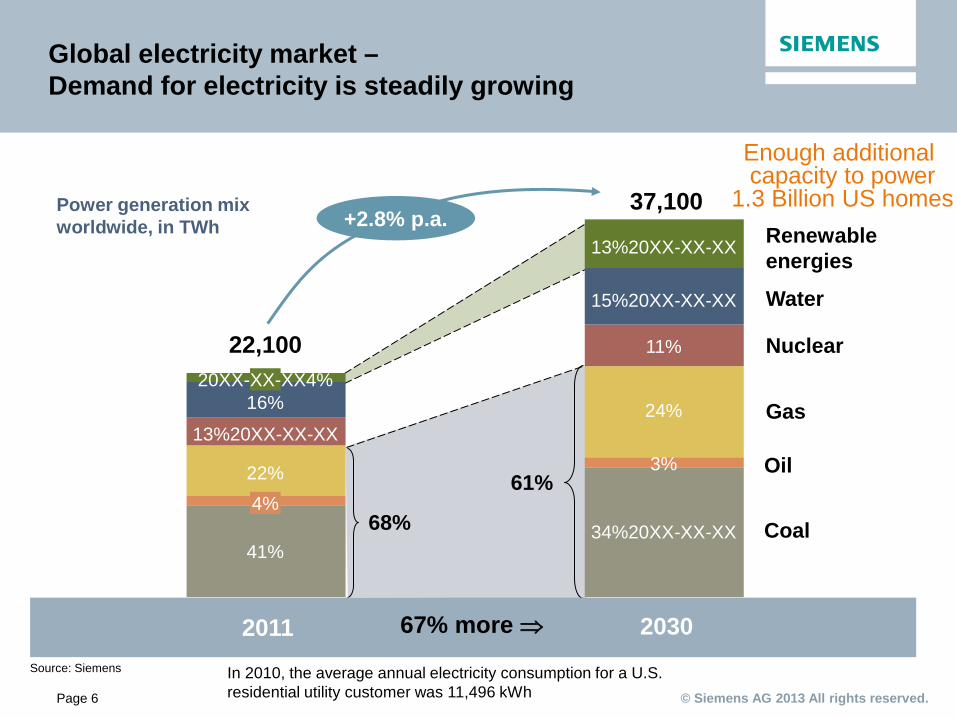
Global electricity market – Demand for electricity is steadily growing
Source: Siemens
Power generation mix worldwide, in TWh
Coal
Oil
Gas
Nuclear
Water
Renewable energies
37,100
34%20XX-XX-XX
3%
24%
11%
15%20XX-XX-XX
13%20XX-XX-XX
41%
4% 22%
13%20XX-XX-XX
16% 20XX-XX-XX4%
68%
61%
+2.8% p.a.
22,100
2030 2011 67% more ⇒
In 2010, the average annual electricity consumption for a U.S. residential utility customer was 11,496 kWh
Enough additional capacity to power
1.3 Billion US homes
© Siemens AG 2013 All rights reserved. Page 7
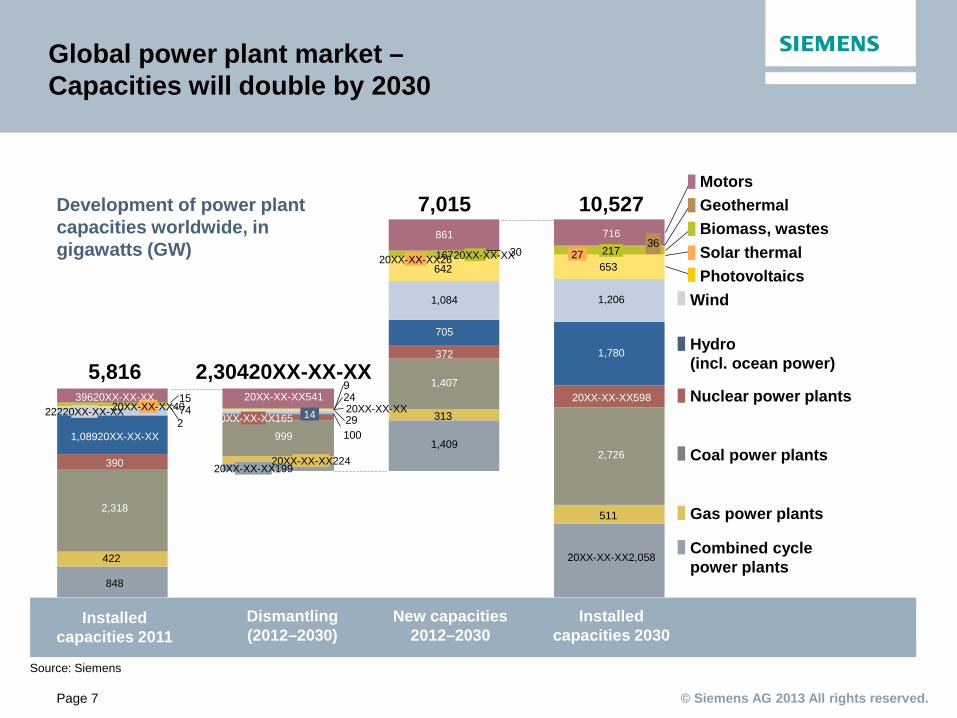
642 653
422
511
313
100292
2474
3630
915
Global power plant market – Capacities will double by 2030
New capacities 2012–2030
Dismantling (2012–2030)
Installed capacities 2011
Installed capacities 2030
Source: Siemens
Development of power plant capacities worldwide, in gigawatts (GW) 27
20XX-XX-XX40
390
1,08920XX-XX-XX
22220XX-XX-XX 39620XX-XX-XX
1,084
861
20XX-XX-XX199 20XX-XX-XX224
20XX-XX-XX165 14
20XX-XX-XX541
848
2,318
999
20XX-XX-XX
20XX-XX-XX26
Coal power plants
Gas power plants
Nuclear power plants
Hydro (incl. ocean power)
Solar thermal
Motors
Wind
5,816
217 16720XX-XX-XX
Combined cycle power plants
Geothermal Biomass, wastes
Photovoltaics
10,527 7,015
2,30420XX-XX-XX
20XX-XX-XX2,058
2,726
20XX-XX-XX598
1,780
1,206
716
1,409
1,407
372
705
© Siemens AG 2013 All rights reserved. Page 8
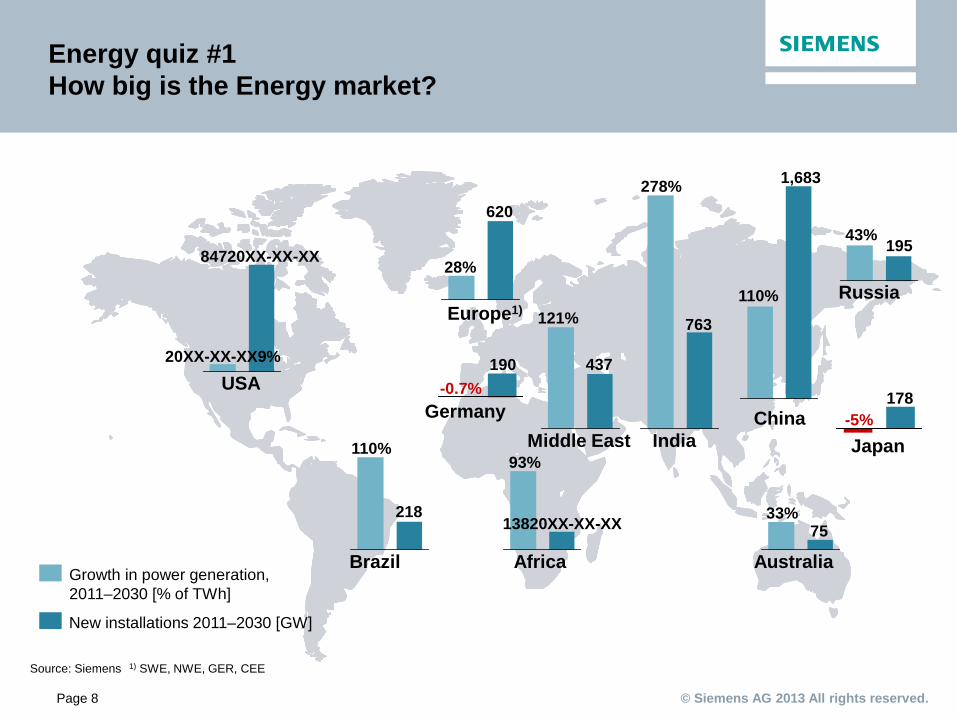
84720XX-XX-XX
13820XX-XX-XX
190
93% 110%
-0.7%
20XX-XX-XX9%
Energy quiz #1 How big is the Energy market?
USA
Russia
Japan China
Brazil
Europe1)
Middle East
Africa
Germany
Source: Siemens 1) SWE, NWE, GER, CEE
218
Growth in power generation, 2011–2030 [% of TWh]
New installations 2011–2030 [GW]
763
India
278% 1,683
110%
195 43%
178 -5%
33%
Australia 75
437
121%
28%
620
© Siemens AG 2013 All rights reserved. Page 9
Energy quiz #2 Power generation options
I have a chart that shows the cost of all the power generation options and a map of the cost of electricity state-by-state in the US, and a comparison to costs in other parts of the world. We can use this to explore with students/teachers what the different mixes of electric power production used in different areas, and why. We can also use this as a basis for exploring: - why not 100% renewables - what are the effects from fracking and the shale gas boom - what is different between the US and EU markets, and why
© Siemens AG 2013 All rights reserved. Page 10
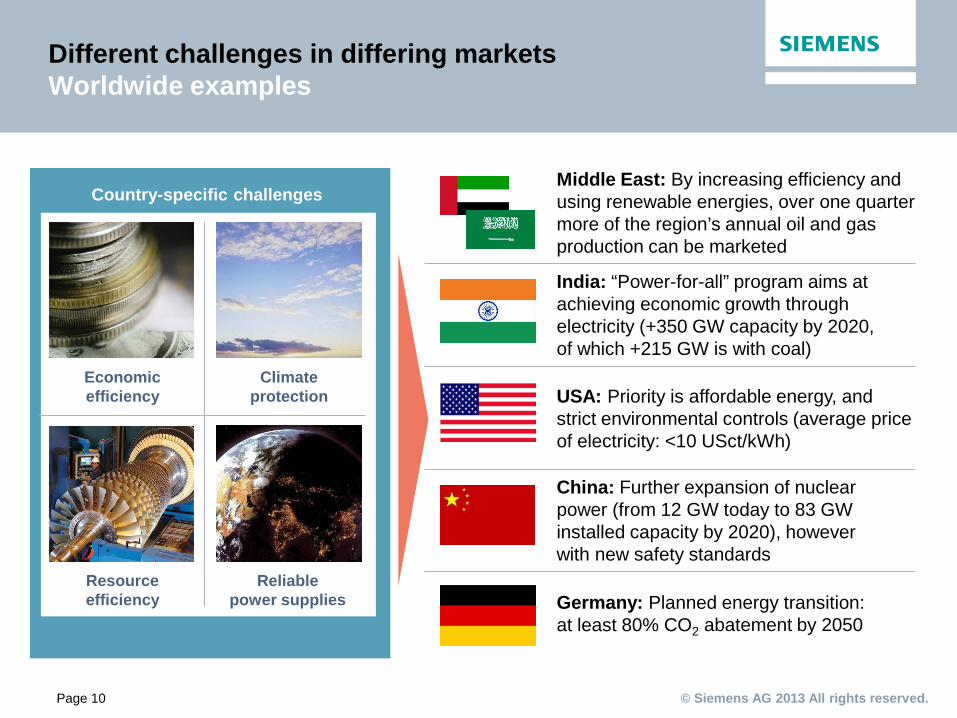
Different challenges in differing markets Worldwide examples
Middle East: By increasing efficiency and using renewable energies, over one quarter more of the region’s annual oil and gas production can be marketed
India: “Power-for-all” program aims at achieving economic growth through electricity (+350 GW capacity by 2020, of which +215 GW is with coal)
USA: Priority is affordable energy, and strict environmental controls (average price of electricity: <10 USct/kWh)
China: Further expansion of nuclear power (from 12 GW today to 83 GW installed capacity by 2020), however with new safety standards
Germany: Planned energy transition: at least 80% CO2 abatement by 2050
Economic efficiency
Climate protection
Reliable power supplies
Resource efficiency
Country-specific challenges
© Siemens AG 2013 All rights reserved. Page 11
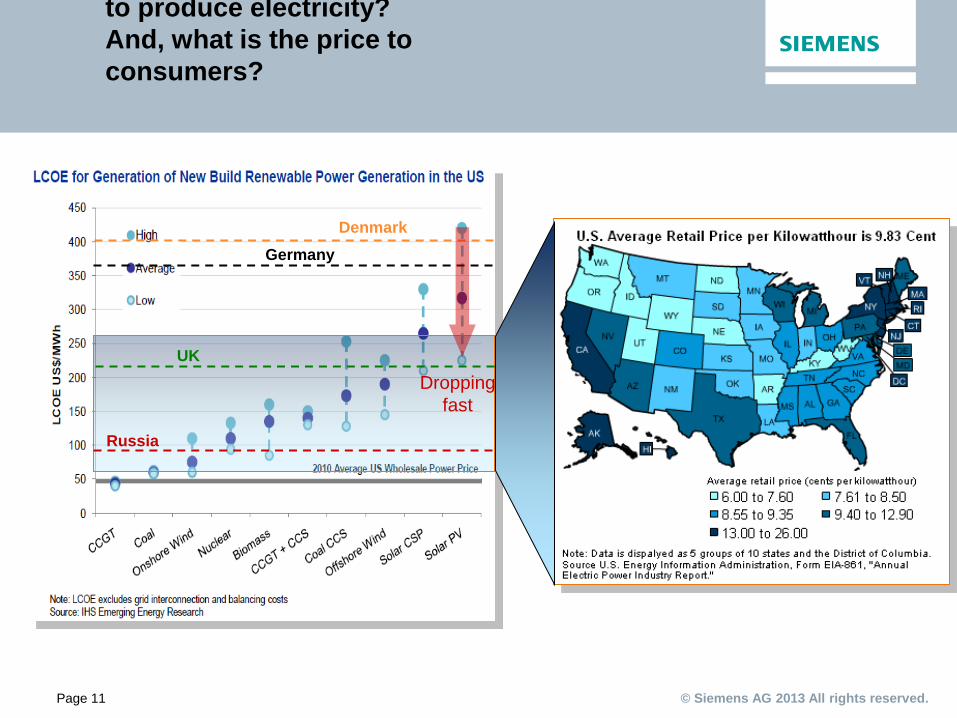
to produce electricity? And, what is the price to consumers?
Russia
UK
Germany Denmark
Dropping fast
© Siemens AG 2013 All rights reserved. Page 12
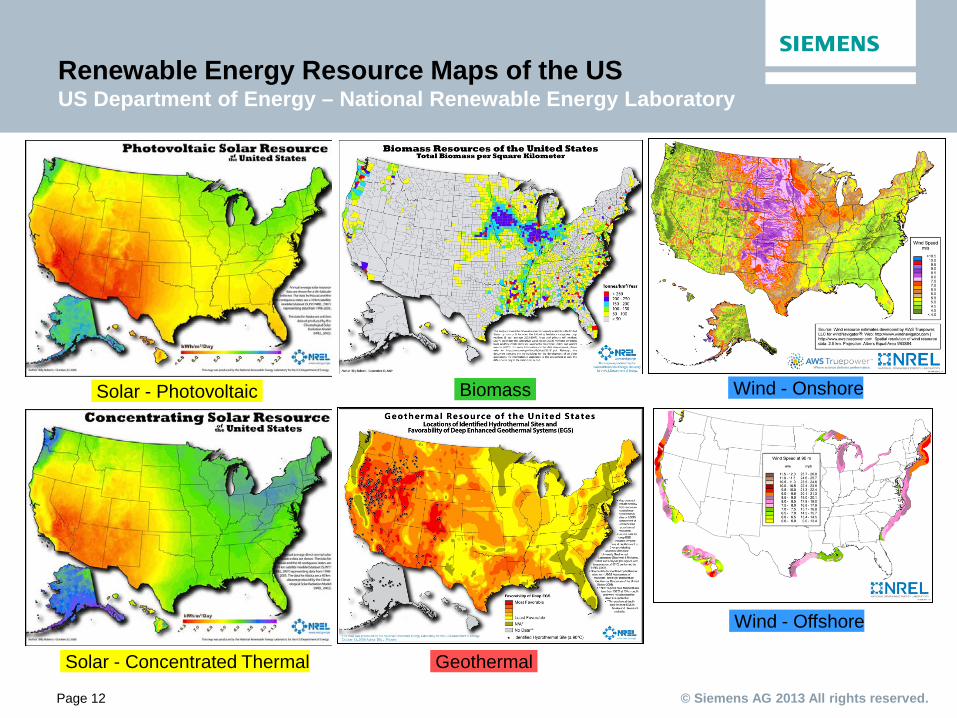
Renewable Energy Resource Maps of the US US Department of Energy – National Renewable Energy Laboratory
Solar - Photovoltaic Biomass Wind - Onshore
Solar - Concentrated Thermal Geothermal
Wind - Offshore
© Siemens AG 2013 All rights reserved. Page 13
Energy quiz #3 What about greenhouse gases (GHG)?
Data graph called the EPRI wedge – what is CO2 concentration in the atmosphere, how fast is it growing, what actions will reduce it, and how much?
© Siemens AG 2013 All rights reserved. Page 14
Energy quiz #3 What about greenhouse gases (GHG)?
Q: What are the drivers a business looks at for greenhouse gas control? A. Market drivers, Technology drivers, Customer drivers, Competitive drivers
Q: What are market drivers? Show world maps and how the drivers are different around the world. Q: What are technology drivers?
Show some engineering solutions, and the challenges (scale and costs) Q: What are customer drivers” Who will pay? Show US example vs. EU example (Germany) Q: What are Competitive Drivers? Show what various technology companies are developing, and why?
© Siemens AG 2013 All rights reserved. Page 15
Energy quiz #3 What about greenhouse gases (GHG)?
Data showing how much is being spent on CO2 capture and storage, and who is paying for it.
© Siemens AG 2013 All rights reserved. Page 16
Energy quiz #3 What about greenhouse gases (GHG)?
Why not just capture all of the CO2 from power plants and be done with it? Answers include: a) engineering challenges, b) costs, c) policy
© Siemens AG 2013 All rights reserved. Page 17
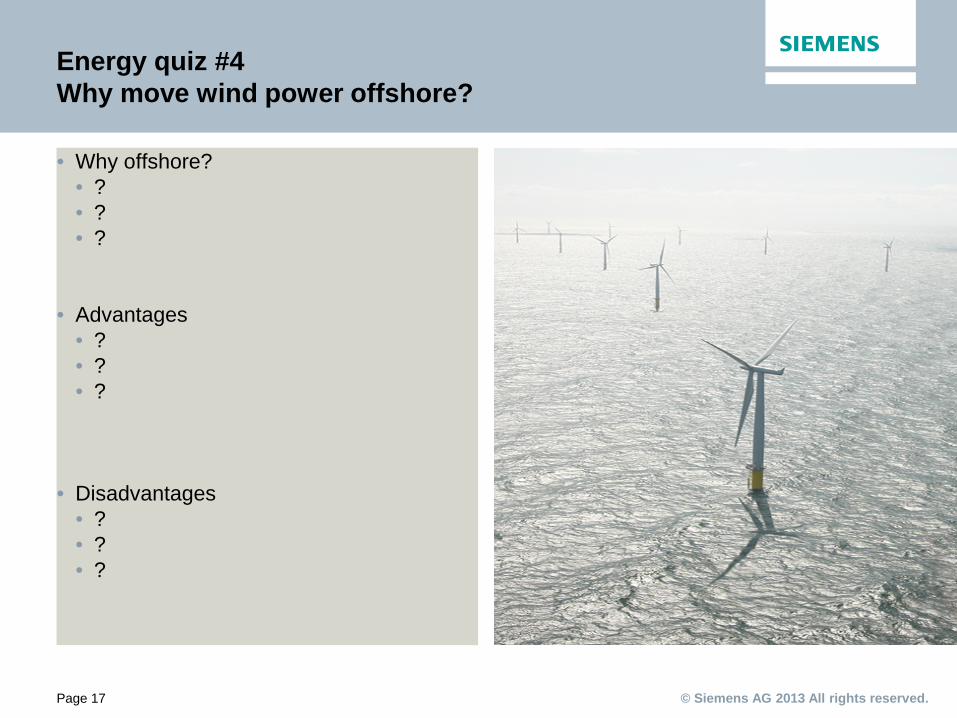
Energy quiz #4 Why move wind power offshore?
• Why offshore? • ? • ? • ?
• Advantages • ? • ? • ?
• Disadvantages • ? • ? • ?
© Siemens AG 2013 All rights reserved. Page 18
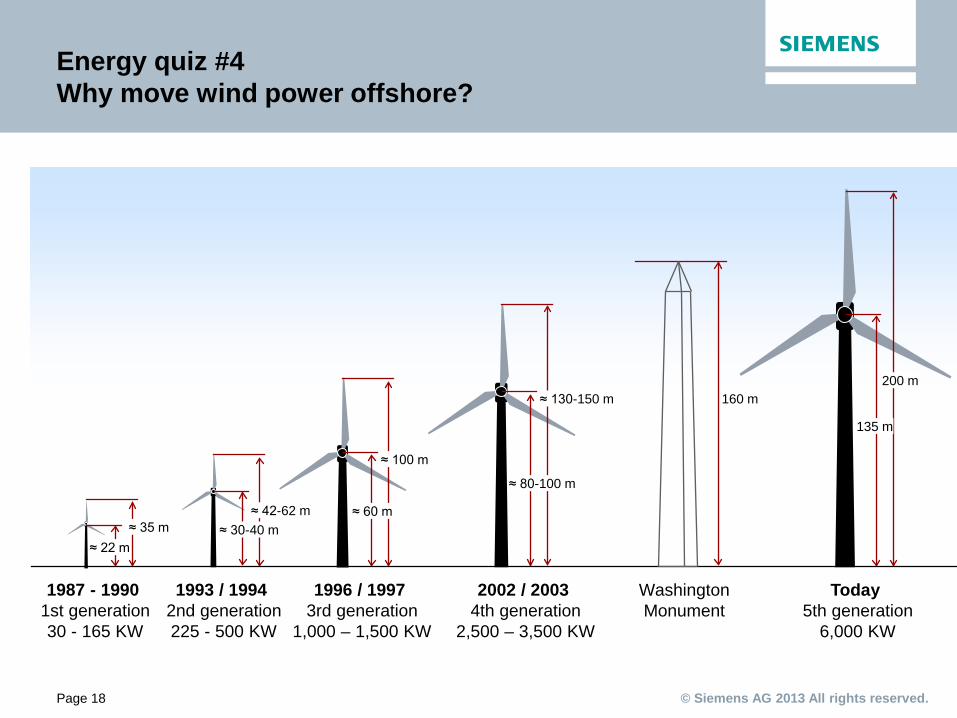
1987 - 1990 1st generation 30 - 165 KW
1993 / 1994 2nd generation 225 - 500 KW
1996 / 1997 3rd generation
1,000 – 1,500 KW
2002 / 2003 4th generation
2,500 – 3,500 KW
Today 5th generation
6,000 KW
Washington Monument
≈ 22 m ≈ 35 m ≈ 30-40 m
≈ 42-62 m ≈ 60 m
≈ 100 m
≈ 80-100 m
≈ 130-150 m
135 m
200 m 160 m
Energy quiz #4 Why move wind power offshore?
© Siemens AG 2013 All rights reserved. Page 19
Siemens Energy - Clean electricity for the world
Final thoughts? Questions? Bob Shannon Innovation Manager Energy Technology & Innovation
4400 Alafaya Trail Orlando, FL
Phone: +1 (407) 736-2376
E-mail: [email protected]
siemens.com/answers
© Siemens AG 2013 All rights reserved. Page 20
Back up slides about Siemens
© Siemens AG 2013 All rights reserved. Page 21
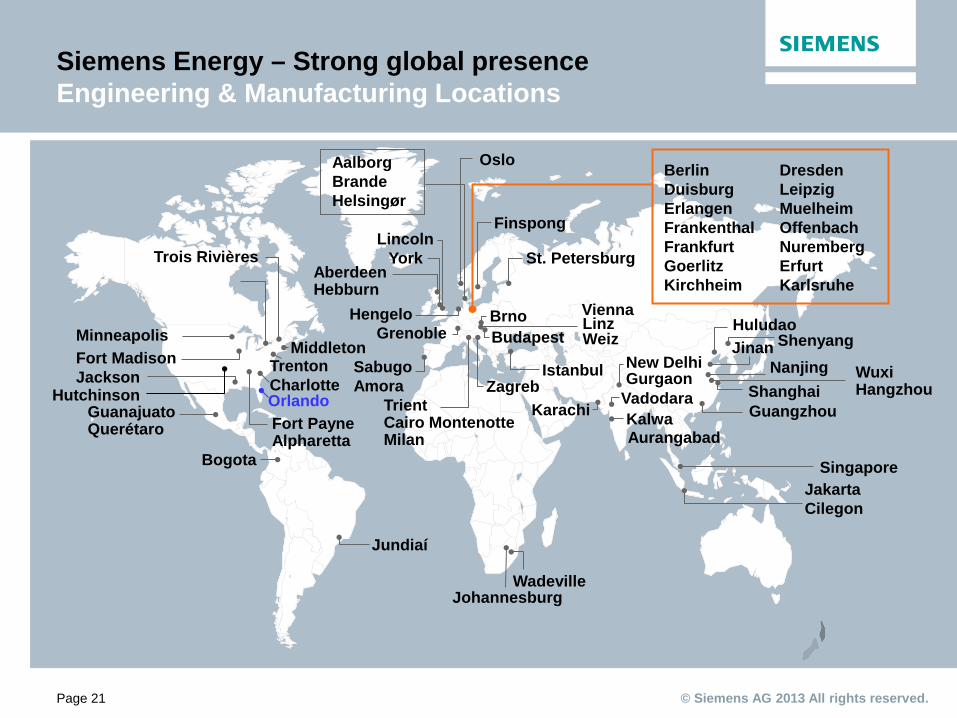
Siemens Energy – Strong global presence Engineering & Manufacturing Locations
Aberdeen Hebburn
Jundiaí
Vienna Budapest
Hengelo
St. Petersburg
Finspong
Brno
Bogota
Kalwa
Grenoble
Johannesburg
Orlando
Lincoln
Fort Madison Jackson
Guanajuato Querétaro
Minneapolis
Trois Rivières
Jakarta Cilegon
Nanjing New Delhi Gurgaon
Shanghai
Singapore
Jinan
Aurangabad Karachi
Zagreb Istanbul
Vadodara
Sabugo Amora
Trient Cairo Montenotte Milan
Huludao Middleton
Trenton Charlotte
Fort Payne Alpharetta
Linz Weiz
York
Aalborg Brande Helsingør
Oslo Berlin Duisburg Erlangen Frankenthal Frankfurt Goerlitz Kirchheim
Dresden Leipzig Muelheim Offenbach Nuremberg Erfurt Karlsruhe
Guangzhou
Wuxi Hangzhou
Wadeville
Shenyang
Hutchinson
© Siemens AG 2013 All rights reserved. Page 22
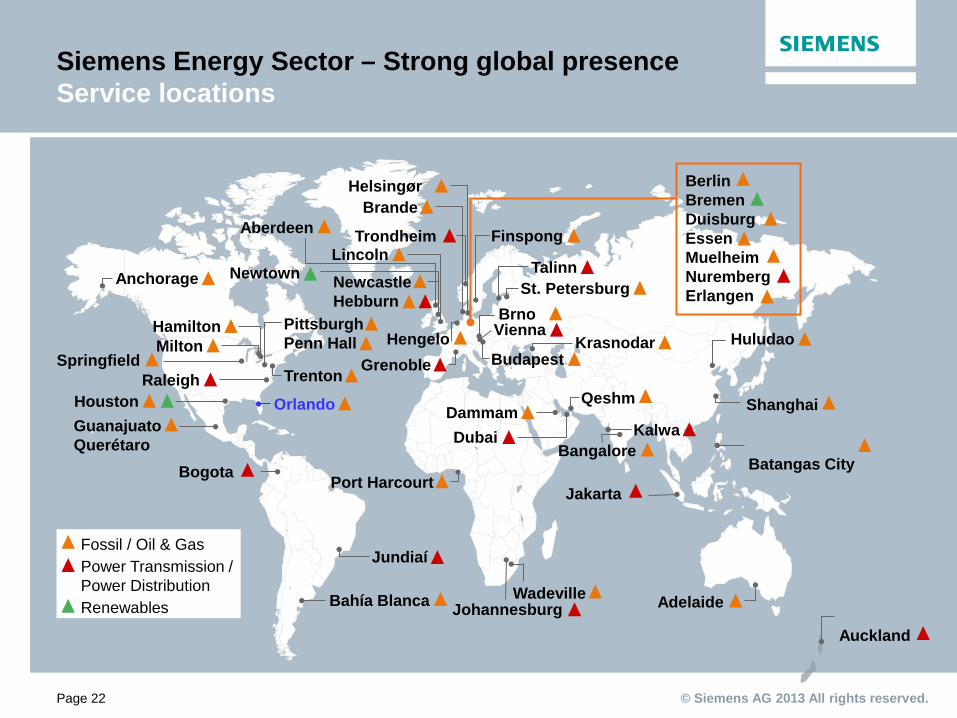
Siemens Energy Sector – Strong global presence Service locations
Brande
Newcastle Hebburn
Houston
Pittsburgh Penn Hall
Hamilton
Batangas City
Dammam
Vienna
Budapest Hengelo
St. Petersburg
Finspong
Brno
Kalwa Dubai
Berlin Bremen Duisburg Essen Muelheim Nuremberg Erlangen
Grenoble
Talinn
Trondheim
Auckland
Raleigh
Milton
Helsingør
Lincoln
Trenton
Orlando
Springfield
Jakarta
Huludao
Shanghai
Adelaide
Qeshm
Krasnodar
Port Harcourt
Bahía Blanca
Anchorage
Aberdeen
Bangalore
Fossil / Oil & Gas Power Transmission / Power Distribution Renewables
Newtown
Jundiaí
Johannesburg Wadeville
Bogota
Guanajuato Querétaro