pur injection for rock mass stabilization - …... injection for rock mass stabilization ... and at...
TRANSCRIPT
POLYURETHANE RESIN (PUR) INJECTION FOR ROCK MASS STABILIZATION
Publication No. FHWA-CFL/TD-08-004 September 2008
Central Federal Lands Highway Division 12300 West Dakota Avenue
Lakewood, CO 80228
Technical Report Documentation Page 1. Report No. FHWA-CFL/TD-08-004
2. Government Accession No.
3. Recipient's Catalog No.
5. Report Date September 2008
4. Title and Subtitle Polyurethane Resin (PUR) Injection for Rock Mass Stabilization
6. Performing Organization Code
7. Author(s) Ben Arndt, P.E., P.G., Yeh and Associates, Inc.; Matthew DeMarco, FHWA-CFLHD; and Richard Andrew, P.G., Yeh and Associates, Inc.
8. Performing Organization Report No.
10. Work Unit No. (TRAIS)
9. Performing Organization Name and Address Yeh and Associates, Inc. 5700 East Evans Avenue Denver, Colorado, 80222
11. Contract or Grant No. DTFH68-04-D-00004 13. Type of Report and Period Covered Final Report September 2005 – August 2008
12. Sponsoring Agency Name and Address Federal Highway Administration Central Federal Lands Highway Division 12300 W. Dakota Avenue, Suite 210 Lakewood, CO 80228
14. Sponsoring Agency Code HFTS-16.4
15. Supplementary Notes COTR: Matthew DeMarco, FHWA-CFLHD; Advisory Panel Members: Roger Surdahl, FHWA-CFLHD; Ty Ortiz, CDOT; Matthew Greer, FHWA-CO Division; Barry Siel, FHWA-RC. This project was funded under the FHWA Federal Lands Highway Technology Deployment Initiatives and Partnership Program (TDIPP)
16. Abstract The Federal Lands Highway (FLH) of the Federal Highway Administration (FHWA) recently investigated the application of polyurethane resin (PUR) injection as a rapidly deployed, cost-effective ground and structure stabilization method. Application objectives included the preservation of historic, cultural and other environmentally sensitive natural and man-made features, while maintaining the original visual characteristics and aesthetic appeal. Most recently, in cooperation with the Colorado Department of Transportation (CDOT), FLH completed full-scale PUR demonstration projects at a historic tunnel located along highway SH 14 in the scenic Poudre Canyon west of Ft. Collins, CO, and at a dry-stack stone masonry retaining wall supporting highway SH 149 along the Rio Grande River northwest of South Fork, CO. The Poudre Canyon demonstration involved PUR injection and stabilization of a previously bolted section of the western tunnel portal, where annual freeze/thaw cycles and rock mass creep toward the adjacent Cache La Poudre River were contributing to rock mass instability. The South Fork demonstration involved PUR injection within a culturally-sensitive dry-stack stone masonry wall that was progressively failing. In addition to the FLH sites, CDOT also contributed PUR injection data from a recent rock slope stabilization project along highway US 6 in Clear Creek Canyon just west of Golden, CO. Based on the “lessons learned” from these investigations, application guidance has been developed for the selection of polyurethane resin products and injection methods to (1) stabilize failing rock-masses (e.g., rock slopes, unique rock promontories, escarpments), and (2) preserve aging and/or deteriorating man-made structures (e.g., historic retaining walls, archeological structures).
17. Key Words POLYURETHANE, POLYURETHANE RESIN, PUR, GROUND STABILIZATION, ROCK GLUING, POLYMERS
18. Distribution Statement No restriction. This document is available to the public from the sponsoring agency at the website http://www.cflhd.gov.
19. Security Classif. (of this report) Unclassified
20. Security Classif. (of this page) Unclassified
21. No. of Pages 76
22. Price
Form DOT F 1700.7 (8-72) Reproduction of completed page authorized
POLYURETHANE (PUR) INJECTION – TABLE OF CONTENTS
ii
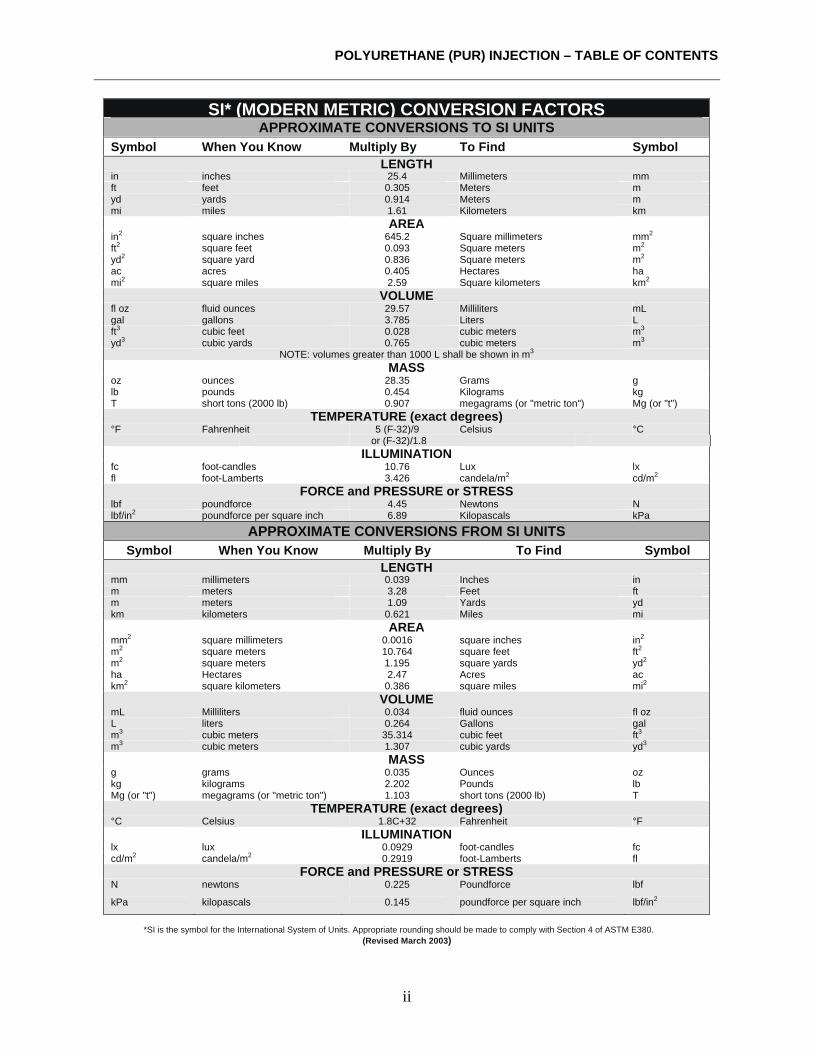
SI* (MODERN METRIC) CONVERSION FACTORS APPROXIMATE CONVERSIONS TO SI UNITS
Symbol When You Know Multiply By To Find Symbol LENGTH
in inches 25.4 Millimeters mm ft feet 0.305 Meters m yd yards 0.914 Meters m mi miles 1.61 Kilometers km
AREAin2 square inches 645.2 Square millimeters mm2 ft2 square feet 0.093 Square meters m2 yd2 square yard 0.836 Square meters m2 ac acres 0.405 Hectares ha mi2 square miles 2.59 Square kilometers km2
VOLUMEfl oz fluid ounces 29.57 Milliliters mL gal gallons 3.785 Liters L ft3 cubic feet 0.028 cubic meters m3 yd3 cubic yards 0.765 cubic meters m3
NOTE: volumes greater than 1000 L shall be shown in m3 MASS
oz ounces 28.35 Grams g lb pounds 0.454 Kilograms kg T short tons (2000 lb) 0.907 megagrams (or "metric ton") Mg (or "t")
TEMPERATURE (exact degrees)°F Fahrenheit 5 (F-32)/9 Celsius °C
or (F-32)/1.8 ILLUMINATION
fc foot-candles 10.76 Lux lx fl foot-Lamberts 3.426 candela/m2 cd/m2
FORCE and PRESSURE or STRESS lbf poundforce 4.45 Newtons N lbf/in2 poundforce per square inch 6.89 Kilopascals kPa
APPROXIMATE CONVERSIONS FROM SI UNITS Symbol When You Know Multiply By To Find Symbol
LENGTHmm millimeters 0.039 Inches in m meters 3.28 Feet ft m meters 1.09 Yards yd km kilometers 0.621 Miles mi
AREAmm2 square millimeters 0.0016 square inches in2 m2 square meters 10.764 square feet ft2 m2 square meters 1.195 square yards yd2 ha Hectares 2.47 Acres ac km2 square kilometers 0.386 square miles mi2
VOLUMEmL Milliliters 0.034 fluid ounces fl oz L liters 0.264 Gallons gal m3 cubic meters 35.314 cubic feet ft3 m3 cubic meters 1.307 cubic yards yd3
MASSg grams 0.035 Ounces oz kg kilograms 2.202 Pounds lb Mg (or "t") megagrams (or "metric ton") 1.103 short tons (2000 lb) T
TEMPERATURE (exact degrees) °C Celsius 1.8C+32 Fahrenheit °F
ILLUMINATION lx lux 0.0929 foot-candles fc cd/m2 candela/m2 0.2919 foot-Lamberts fl
FORCE and PRESSURE or STRESSN newtons 0.225 Poundforce lbf
kPa kilopascals 0.145 poundforce per square inch lbf/in2 *SI is the symbol for the International System of Units. Appropriate rounding should be made to comply with Section 4 of ASTM E380.
(Revised March 2003)
POLYURETHANE (PUR) INJECTION – TABLE OF CONTENTS
iii
TABLE OF CONTENTS EXECUTIVE SUMMARY .......................................................................................................... 1
CHAPTER 1 – INTRODUCTION.............................................................................................. 3
CHAPTER 2 – REVIEW OF POLYURETHANE AND EPOXY GROUTS ......................... 5
WATER INTERACTIONS - HYDROPHILIC vs. HYDROPHOBIC ...................................... 5 SINGLE-STAGE INJECTION SYSTEMS................................................................................ 6 TWO-STAGE INJECTION SYSTEMS..................................................................................... 6 TOXICITY AND ENVIRONMENTAL ISSUES WITH POLYMER PRODUCTS................. 6 TEMPERATURE CONSTRAINTS........................................................................................... 7 COMPARISON OF PU, PUR, AND EPOXY ........................................................................... 8
CHAPTER 3 – GROUT STABILIZATION METHODS....................................................... 11
COMPARISON OF CEMENTITIOUS GROUTS WITH CHEMICAL GROUTS ................ 11 POLYMER METHODS USED FOR UNDERGROUND STABILIZATION........................ 11
PU Membrane Spray for Underground Stabilization............................................................ 11 PUR Injection for Underground Stabilization ...................................................................... 12
PU FOR SUBGRADE IMPROVEMENT................................................................................ 13
CHAPTER 4 – ROCK MASS STABILIZATION DEMONSTRATION PROJECTS........ 15 POUDRE CANYON TUNNEL STABILIZATION ................................................................ 15
Construction Description ...................................................................................................... 16 Construction Summary and Details ...................................................................................... 19
CLEAR CREEK CANYON ROCK MASS STABILIZATION.............................................. 23
CHAPTER 5 – RETAINING WALL DEMONSTRATION PROJECT............................... 27 OVERVIEW ............................................................................................................................. 27
Construction Description ...................................................................................................... 27 Construction Summary and Details ...................................................................................... 35
CHAPTER 6 – CONCLUSIONS AND RECOMMENDATIONS......................................... 39
APPLICABILITY OF PUR FOR THE SITE CONDITIONS ................................................. 39 Rock Mass Stabilization ....................................................................................................... 39 Dry-stack Wall Stabilization................................................................................................. 40
PRELIMINARY PUR VOLUME ESTIMATION................................................................... 40 Rock Mass Stabilization ....................................................................................................... 40 Dry-stack Wall Stabilization................................................................................................. 41
PUR PRODUCT REQUIREMENTS ....................................................................................... 42 PUR PLACEMENT CONSIDERATIONS .............................................................................. 42
Rock Mass Stabilization ....................................................................................................... 42 Dry-stack Wall Stabilization................................................................................................. 42
SITE MONITORING CONSIDERATIONS............................................................................ 43 CLEAN UP AND DISPOSAL REQUIREMENTS ................................................................. 43
POLYURETHANE (PUR) INJECTION – TABLE OF CONTENTS
iv
APPENDIX A – SPECIAL CONTRACT REQUIREMENTS............................................... 45
APPENDIX B – INJECTION PLAN AND LABORATORY TESTING, SOUTHFORK DEMONSTRATION PROJECT......................................................................................... 49
APPENDIX C – DELINEATING PUR INJECTION WITH SURFACE REFRACTION
TOMOGRAPHY .................................................................................................................. 53 GLOSSARY OF TERMS........................................................................................................... 59
REFERENCES.............................................................................................................................56 BIBLIOGRAPHY....................................................................................................................... 63
ACKNOWLEDGEMENTS ....................................................................................................... 65
POLYURETHANE (PUR) INJECTION – TABLE OF CONTENTS
v
LIST OF FIGURES Figure 1. Photo. PUR and rock fragments test sample prepared at project site............................ 3 Figure 2. Graph. Representative Viscosity vs. Temperature relationship for isocyanate and polyol resin components for a typical PUR product (Source: Micon)............................................ 8 Figure 3. Photo. Western portal of the Poudre Canyon Tunnel with PUR injection hole sequence indicated in red. ............................................................................................................. 15 Figure 4. Photo. Close-up of the foliation joint-defined blocks above the western portal and previous spot-bolting. ................................................................................................................... 16 Figure 5. Photo. Jackleg drilling into western portal abutment (Hole # 1)................................. 17 Figure 6. Photo. Insertion of the injection port/packer into drillhole. ........................................ 18 Figure 7. Photo. Connection of PUR Component A and B hoses to injection port.................... 18 Figure 8. Photo. PUR Components A and B (red and blue barrels) and pumping system. ........ 19 Figure 9. Photo. Migration of PUR from below the injection point # 11 (red arrow), upward through the rock mass. Note that some of the resin is foaming due to moisture in the surface fractures......................................................................................................................................... 21 Figure 10. Photo. Cured PUR product infilling a discontinuity within rock mass. .................... 22 Figure 11. Photo. Rapid removal of expanded PUR product immediately following injection and prior to set. Removal typically requires hand tools following set......................................... 22 Figure 12. Photo. Single-component PU product used to seal fractures in order to inject PUR product into rock fractures. ........................................................................................................... 23 Figure 13. Photo. Approximate locations of selected PUR injection holes................................ 24 Figure 14. Photo. Approximate locations of selected PUR injection holes................................ 24 Figure 15. Photo. Bulging dry-stack wall, looking northwest along the test section. ................ 28 Figure 16. Photo. Jam-rod used to inject PUR product. Connection on right allows addition of extension rods, as needed. Injection ports are along the lower third of the jam-rod. Arrow indicates flow direction of product out of end port....................................................................... 29
POLYURETHANE (PUR) INJECTION – TABLE OF CONTENTS
vi
Figure 17. Photo. Driving jam-rod just behind visible wall settlement zone with fence post driver. Arrows indicate areas of wall displacement and settlement............................................. 29 Figure 18. Photo. Jam-rods placed along the top of a well-built, well performing section of the study wall. No signs of wall settlement allowed placement of the injection rods closer to the wall face................................................................................................................................................ 30 Figure 19. Photo. PUR A and B components are pumped separately to the top of the jam rod assembly. Mixing occurs within the injection rod assembly via a spiraled insert prior to product injection within the rock mass. ..................................................................................................... 31 Figure 20. Photo. Blue arrows indicate location of balanced rocks used as “tell-tales” to detect outward wall deflection................................................................................................................. 31 Figure 21. Photo. PUR that has foamed due to high moisture within the wall rock mass. This material can be readily peeled off the rock face and bagged for disposal. ................................... 32 Figure 22. Photo. PUR product distribution within large void in dry-stack wall. This location was initially injected via jam-rods behind the wall the day after steady rains passed through the area, resulting in foaming of the PUR. Subsequent face injection days later, when the wall rock had dried substantially, resulted in non-foamed resin coverage of the interior rocks. The foamed PUR provides for consolidation, whereas the non-foamed product provides for rock-on-rock adhesion. ....................................................................................................................................... 33 Figure 23. Photo. Light-colored, foamed PUR in core sample................................................... 34 Figure 24. Photo. PUR injection directly between wall facing rocks using a hand-held injection nozzle. ........................................................................................................................................... 34 Figure 25. Photo. Elevation view of the South Fork dry-stack wall following completion of PUR injection. PUR overruns are nearly invisible from this distance......................................... 35 Figure 26. Photo. 2D seismic refraction line layout along roadway edge above retaining wall, including 24-channel “Landstreamer” geophone string and 20-lb triggered sledgehammer seismic source. ...............................................................................................................................54 Figure 27. Schematic. Example visualization of the GAP-3D model configuration as applied to a retaining wall evaluation. ............................................................................................................55 Figure 28. Schematic. Velocity difference tomogram of the surveyed wall volume at the South Fork study site. The red points at the top and bottom of the wall volume represent geophone locations; blue points represent source locations. The highlighted 250+ ft/sec volume is interpreted as representing significant changes in ground conditions resulting from PUR injection..........................................................................................................................................56
POLYURETHANE (PUR) INJECTION – TABLE OF CONTENTS
vii
Figure 29. Schematic. Selected velocity difference tomogram cross-sections along the retaining wall (wall face is on the right). Higher velocity changes generally emanate from the ground surface behind the top edge of the wall (coincident with injection rod locations), and migrate toward the more porous wall face – where PUR was routinely seen flowing from the toe to mid-height of the wall. ..........................................................................................................................57
POLYURETHANE (PUR) INJECTION – TABLE OF CONTENTS
viii
LIST OF TABLES
Table 1. Relative comparison of PU, PUR and EP........................................................................ 9 Table 2. Properties of Micon RokLok 70 polyurethane resin...................................................... 16 Table 3. Drilling and PUR injection production rates on the Poudre Canyon project................. 21 Table 4. Production rates for PUR on the US 6 Project............................................................... 25 Table 5. Injection rates for PUR on the South Fork project. ....................................................... 37
EXECUTIVE SUMMARY
1
EXECUTIVE SUMMARY The Federal Lands Highway (FLH) of the Federal Highway Administration (FHWA) recently investigated the application of polyurethane resin (PUR) injection as a rapidly deployed, cost-effective ground structure stabilization method. Application objectives included the preservation of historic, cultural and other environmentally sensitive natural and man-made features, while maintaining the original visual characteristics and aesthetic appeal. Most recently, in cooperation with the Colorado Department of Transportation (CDOT), FLH completed full-scale PUR demonstration projects at a historic tunnel located along highway SH 14 in the scenic Poudre Canyon west of Ft. Collins, CO, and at a dry-stack stone masonry retaining wall supporting highway SH 149 along the Rio Grande River northwest of South Fork, CO. The Poudre Canyon demonstration involved PUR injection and stabilization of a previously bolted section of the western tunnel portal, where annual freeze/thaw cycles and rock mass creep toward the adjacent Cache La Poudre River were contributing to rock mass instability. The South Fork demonstration involved PUR injection within a culturally-sensitive dry-stack stone masonry wall that was progressively failing. In addition to the FLH sites, CDOT also contributed PUR injection data from a recent rock slope stabilization project along highway US 6 in Clear Creek Canyon just west of Golden, CO. Based on the “lessons learned” from these investigations, application guidance has been developed for the selection of polyurethane resin products and injection methods to (1) stabilize failing rock-masses (e.g., rock slopes, unique rock promontories, escarpments), and (2) preserve aging and/or deteriorating man-made structures (e.g., historic retaining walls, archeological structures).

CHAPTER 1 – INTRODUCTION
3
CHAPTER 1 – INTRODUCTION The Federal Lands Highway Division (FLH) of the Federal Highway Administration (FHWA), along with its partner federal land management agencies (FLMA’s), is responsible for the repair, rehabilitation and construction of roadways within our nation’s forests, parks and refuges. By promoting a “Light on the Land” construction philosophy, FLH projects further seek to preserve sensitive historic, cultural and other similar environmental features, including unique geologic features and man-made structures. Preservation requirements, which can be particularly stringent within National Parks, often call for stabilization measures that do not impact or detract from the historic, visual, or aesthetic significance and appeal of the feature.
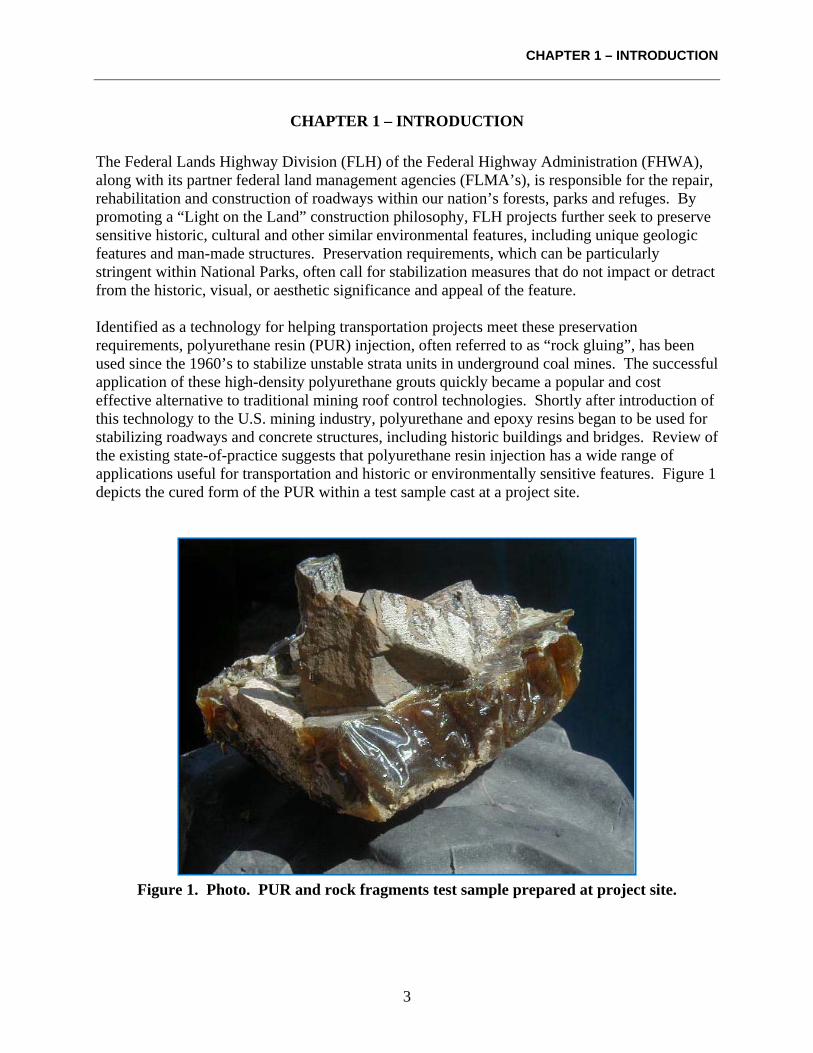
Identified as a technology for helping transportation projects meet these preservation requirements, polyurethane resin (PUR) injection, often referred to as “rock gluing”, has been used since the 1960’s to stabilize unstable strata units in underground coal mines. The successful application of these high-density polyurethane grouts quickly became a popular and cost effective alternative to traditional mining roof control technologies. Shortly after introduction of this technology to the U.S. mining industry, polyurethane and epoxy resins began to be used for stabilizing roadways and concrete structures, including historic buildings and bridges. Review of the existing state-of-practice suggests that polyurethane resin injection has a wide range of applications useful for transportation and historic or environmentally sensitive features. Figure 1 depicts the cured form of the PUR within a test sample cast at a project site.
Figure 1. Photo. PUR and rock fragments test sample prepared at project site.
CHAPTER 1 – INTRODUCTION
4
Polyurethane resin (PUR) injection has been employed for civil applications, including:
1. Soil stabilization; 2. Roadway subsidence remediation; 3. Tieback anchor repair; 4. Slope stabilization; 5. Tunnel repair; 6. Concrete structure rehabilitation; and 7. Erosion control.
These applications have employed both one- and two-phase component mixes that are easily transported, require only modest equipment to inject, and are environmentally inert once fully cured. The objective of this study was to evaluate the application of PUR technologies for the preservation and/or rehabilitation of historic structures, unique geologic features, tunnels and other environmentally sensitive features typically found on public lands. Based on the findings of two field evaluations and an extensive literature search, this manual summarizes current PUR injection practices for stabilizing sensitive historic, cultural and environmental features and provides general guidelines for the use and specification of (PUR) products. More specifically, the following topics are addressed:
1. Review and general description of cement and chemical grouts. 2. Applications of polyurethane and epoxy grouts. 3. Hydrophilic and hydrophobic interaction of polyurethane with water. 4. Case histories in which polyurethane products have been used. 5. Field demonstrations depicting applications of the technology for highway related use for
rock slope and dry-stack retaining wall stabilization and mitigation. 6. Considerations/specifications for implementation of polyurethane technologies. 7. Procurement specification and constructability issues related to PUR product systems.
This report has been developed to serve as an FLH reference for projects where stabilization of similar features may require PUR injection methods. In addition, federal land management agencies, state departments of transportation (DOT) and others may also find the results and recommendations provided herein useful.
CHAPTER 2 – REVIEW OF POLYURETHANE AND EPOXY GROUTS
5
CHAPTER 2 – REVIEW OF POLYURETHANE AND EPOXY GROUTS The study was focused on the use of polyurethane resin (PUR) injection techniques for stabilizing rock slopes, unique rock features, historic retaining walls and other features/structures where minimizing visual and aesthetic impacts is required. Typically these features have been stabilized using rock bolting, ground anchors and other invasive methods that can diminish the historic nature and/or visual quality. To evaluate PUR products it is necessary to also review and compare the other related polymer products such as single-stage polyurethane mixes and epoxy resins. There are tens of thousands of different combinations and component mixes of polyurethane (PU), polyurethane resin, and epoxy resin. Due to the multitude of component mixing options, it is sometimes difficult to distinguish PU from PUR products when evaluating different vendor products. To further add uncertainty, vendors commonly interchange the terms PU and PUR. General characteristics broadly define separate types of polymers, including density, strength, number of mixing stages, and reactivity with water. In order to fully compare PU, PUR and EP products it is necessary to understand how the products interact with water and what types of component mixing are typically done to prepare the product for injection. For PUR applications, this document provides special contract requirements in Appendix A, specifying both physical property and installation requirements.
WATER INTERACTIONS - HYDROPHILIC vs. HYDROPHOBIC When evaluating an epoxy or polyurethane product it is important to determine the effects of the presence or absence of water for the application. These products are typically categorized as either having hydrophilic or hydrophobic water interaction properties. Hydrophilic products will foam in the presence of water. The product incorporates water into the chemical structure and will shrink and swell indefinitely depending on the groundwater conditions present. Hydrophilic products can expand from approximately 25% to 3,000%, and/or elongate approximately 10% to 500% depending on the type of product and availability of water. Upon drying, hydrophilic products can also shrink in excess of 10%. The shear strength of the foamed product is significantly less than denser hydrophobic products. Since the interaction of groundwater dramatically affects the strength and effectiveness of the product, the hydrophilic polyurethane grouts are typically used for sealing and creating barriers to groundwater flow. The hydrophilic products also perform better if they do not dry out. If they dry out completely, they typically shrink and crack allowing water to transmit past the seal. Hydrophobic products are less likely to react with water; however, these products may still have expansion and elongation properties similar to hydrophilic products. In general, the hydrophobic products are less affected by the interaction with water than the hydrophilic products (i.e. less foam), which results in a final product with greater shear strength and higher density. Hydrophobic products are also considered less likely to shrink in the absence of water.
CHAPTER 2 – REVIEW OF POLYURETHANE AND EPOXY GROUTS
6
Epoxy grouts are the only products reviewed in this study that are truly hydrophobic, neither shrinking nor swelling in the presence of water. Depending on the application, interaction of the product with water and subsequent foaming is often necessary to insure that the grout is permeating the fracture or void. The foaming products generally permeate well into moist or water filled fractures and/or discontinuities without drastically increasing pumping pressures. Epoxy products generally have to displace the water, and will not as effectively permeate water-bearing structures. The required pumping pressures are also increased in hydrophobic products since the head pressure of the water has to be overcome to inject the product into the fractures or voids.
SINGLE-STAGE INJECTION SYSTEMS Polyurethane (PU) products generally only require a single-stage mix component with an accelerator added to set the reaction time. Set-times can vary widely, ranging from 15 seconds to several hours. Single-stage PU products, using foams or gels, are commonly used for crack repair, void filling, consolidation of weak substrata, and groundwater contaminant flow barriers. The single-component system, generally pumped at low pressures, greatly simplifies the injection process and equipment requirements. Injected PU densities range from 0.5 kN/m3 to 7 kN/m3 (3 lb/ft3 to 50 lb/ft3). PU applications are less technically demanding than the two-component systems, but may foam extensively in the presence of water. When the product foams, the shear strength of the material dramatically decreases.
TWO-STAGE INJECTION SYSTEMS Polyurethane resins (PUR) and epoxy resins (EP) most commonly fall within the category of a two-stage mix component system. As with PU products, reaction set-times can also be varied from seconds to hours depending on the application and temperature. In general, the two-stage mix systems are associated with products that have greater compressive and tensile strengths than single-stage mix systems. In underground mining applications, caving or failing ground sections require high product strengths early in the application. Fractured, incompetent rock strata are injected under pressure with two components at a 1:1 ratio forming an elastomer commonly known as “glue”. This process provides supplementary support of weak areas and structures. Densities for this type of product generally range from 3 kN/m3 to 11 kN/m3 (20 lb/ft3 to 70 lb/ft3), with high compressive, flexural, shear and torsional properties that can exceed 70 MPa (10,000 psi). Initial set times are on the order of a few minutes, with final resin cure within 1-2 days.
TOXICITY AND ENVIRONMENTAL ISSUES WITH POLYMER PRODUCTS PU, PUR and EP products are considered inert and chemically stable in a cured form. However, depending on the formulation, PUR products that have isocyanate-based grouts have the potential to be moderately toxic in an uncured form. The solvents used to dilute and control the viscosity of the urethane prepolymers may also have the potential to contribute pollutants to groundwater sources. There may be additional safety issues related to combustion products if
CHAPTER 2 – REVIEW OF POLYURETHANE AND EPOXY GROUTS
7
the grout is exposed to flame. Some grout mixtures are highly flammable before and after setting; however, injected products are generally well protected within natural rock or man-made structures. The PUR used in this study consists of two components: polymeric isocyanate (component A) and polyol resin (component B). Polymeric isocyanate is an irritant to skin, eyes and mucous membranes and my cause an allergic reaction if inhaled. Conversely, polyol resin may produce a slight skin irritation, but is generally considered a low toxicity hazard. To avoid contact with the individual components, they should both be contained within separate 208-l (55-gal) drums that are clearly labeled and connected to a closed pumping system. In an outdoor setting and closed pumping system, the two PUR components did not appear to pose any significant health concerns during the demonstration projects. Final curing of the mixed components, which can occur in just a few minutes, results in an inert, non-toxic final product. Two main environmental factors that may affect the performance of PUR products include ultraviolet light (UV) degradation and microbial attack. For the purposes of this report, it is assumed that all or a great majority of the product would be injected within a structure or groundmass and, therefore, would not be affected by sunlight. In addition to UV susceptibility, the literature review indicated potential fungi-related biodegradability issues with polyester-based PUR products. No polyester-based products were evaluated in this study. Excessive PUR foaming may also be an issue in certain applications. As previously noted, PUR products commonly foam when encountering water. In some cases, foamed PUR may noticeably extrude from the treated area; however, cleanup can easily be managed at the time of application.
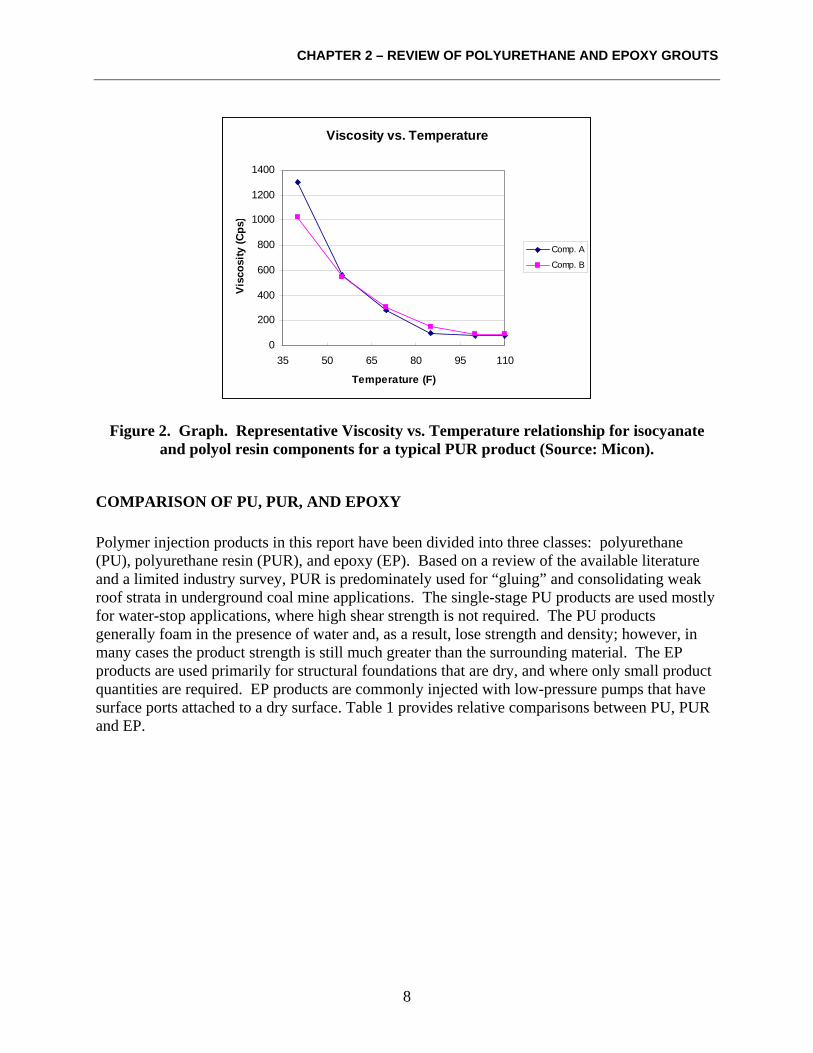
TEMPERATURE CONSTRAINTS PUR products have typically been used in underground settings subject to constant air and rock temperatures. Wide variations in application temperature will greatly influence injection processes and overall product performance. In general, PUR products should be injected at an ambient air/structure temperature between 13o and 32o C (55o and 90o F) as shown in Figure 2. If the product is installed above or below this temperature range, the resin viscosity, shown in centipoise (cps), and set times will be greatly affected: failing to penetrate narrow fractures if too cold, or “flash setting” in the mixing nozzle/delivery rod assembly during injection if too hot.
CHAPTER 2 – REVIEW OF POLYURETHANE AND EPOXY GROUTS
8
Viscosity vs. Temperature
0
200
400
600
800
1000
1200
1400
35 50 65 80 95 110
Temperature (F)
Visc
osity
(Cps
)Comp. A
Comp. B
Figure 2. Graph. Representative Viscosity vs. Temperature relationship for isocyanate and polyol resin components for a typical PUR product (Source: Micon).
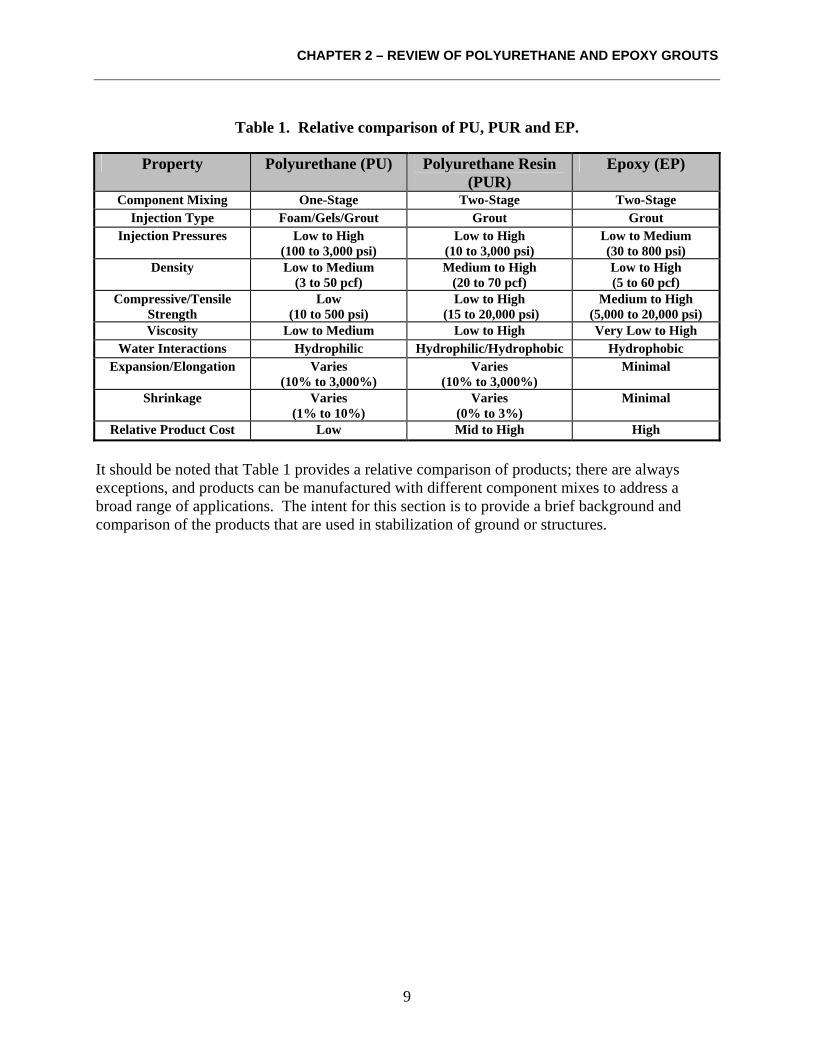
COMPARISON OF PU, PUR, AND EPOXY Polymer injection products in this report have been divided into three classes: polyurethane (PU), polyurethane resin (PUR), and epoxy (EP). Based on a review of the available literature and a limited industry survey, PUR is predominately used for “gluing” and consolidating weak roof strata in underground coal mine applications. The single-stage PU products are used mostly for water-stop applications, where high shear strength is not required. The PU products generally foam in the presence of water and, as a result, lose strength and density; however, in many cases the product strength is still much greater than the surrounding material. The EP products are used primarily for structural foundations that are dry, and where only small product quantities are required. EP products are commonly injected with low-pressure pumps that have surface ports attached to a dry surface. Table 1 provides relative comparisons between PU, PUR and EP.
CHAPTER 2 – REVIEW OF POLYURETHANE AND EPOXY GROUTS
9
Table 1. Relative comparison of PU, PUR and EP.
Property Polyurethane (PU) Polyurethane Resin (PUR)
Epoxy (EP)
Component Mixing One-Stage Two-Stage Two-Stage Injection Type Foam/Gels/Grout Grout Grout
Injection Pressures Low to High (100 to 3,000 psi)
Low to High (10 to 3,000 psi)
Low to Medium (30 to 800 psi)
Density Low to Medium (3 to 50 pcf)
Medium to High (20 to 70 pcf)
Low to High (5 to 60 pcf)
Compressive/Tensile Strength
Low (10 to 500 psi)
Low to High (15 to 20,000 psi)
Medium to High (5,000 to 20,000 psi)
Viscosity Low to Medium Low to High Very Low to High Water Interactions Hydrophilic Hydrophilic/Hydrophobic Hydrophobic
Expansion/Elongation Varies (10% to 3,000%)
Varies (10% to 3,000%)
Minimal
Shrinkage Varies (1% to 10%)
Varies (0% to 3%)
Minimal
Relative Product Cost Low Mid to High High
It should be noted that Table 1 provides a relative comparison of products; there are always exceptions, and products can be manufactured with different component mixes to address a broad range of applications. The intent for this section is to provide a brief background and comparison of the products that are used in stabilization of ground or structures.

CHAPTER 3 – GROUT STABILIZATION METHODS
11
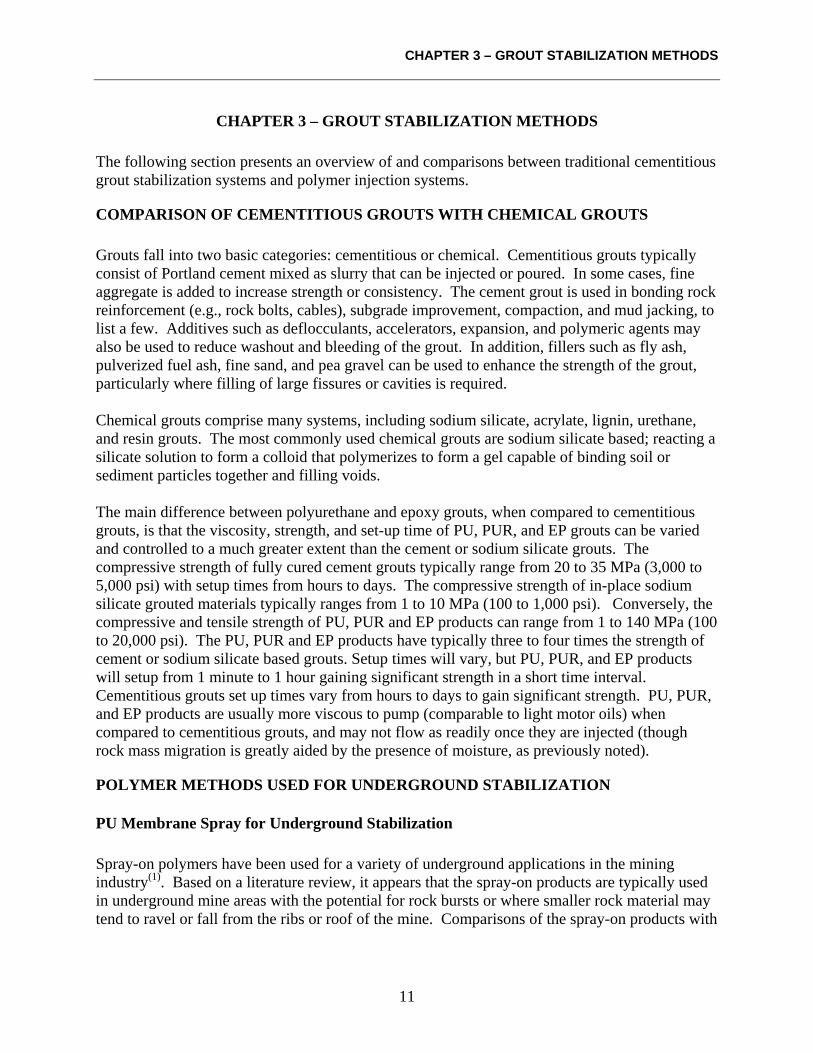
CHAPTER 3 – GROUT STABILIZATION METHODS The following section presents an overview of and comparisons between traditional cementitious grout stabilization systems and polymer injection systems.
COMPARISON OF CEMENTITIOUS GROUTS WITH CHEMICAL GROUTS Grouts fall into two basic categories: cementitious or chemical. Cementitious grouts typically consist of Portland cement mixed as slurry that can be injected or poured. In some cases, fine aggregate is added to increase strength or consistency. The cement grout is used in bonding rock reinforcement (e.g., rock bolts, cables), subgrade improvement, compaction, and mud jacking, to list a few. Additives such as deflocculants, accelerators, expansion, and polymeric agents may also be used to reduce washout and bleeding of the grout. In addition, fillers such as fly ash, pulverized fuel ash, fine sand, and pea gravel can be used to enhance the strength of the grout, particularly where filling of large fissures or cavities is required. Chemical grouts comprise many systems, including sodium silicate, acrylate, lignin, urethane, and resin grouts. The most commonly used chemical grouts are sodium silicate based; reacting a silicate solution to form a colloid that polymerizes to form a gel capable of binding soil or sediment particles together and filling voids. The main difference between polyurethane and epoxy grouts, when compared to cementitious grouts, is that the viscosity, strength, and set-up time of PU, PUR, and EP grouts can be varied and controlled to a much greater extent than the cement or sodium silicate grouts. The compressive strength of fully cured cement grouts typically range from 20 to 35 MPa (3,000 to 5,000 psi) with setup times from hours to days. The compressive strength of in-place sodium silicate grouted materials typically ranges from 1 to 10 MPa (100 to 1,000 psi). Conversely, the compressive and tensile strength of PU, PUR and EP products can range from 1 to 140 MPa (100 to 20,000 psi). The PU, PUR and EP products have typically three to four times the strength of cement or sodium silicate based grouts. Setup times will vary, but PU, PUR, and EP products will setup from 1 minute to 1 hour gaining significant strength in a short time interval. Cementitious grouts set up times vary from hours to days to gain significant strength. PU, PUR, and EP products are usually more viscous to pump (comparable to light motor oils) when compared to cementitious grouts, and may not flow as readily once they are injected (though rock mass migration is greatly aided by the presence of moisture, as previously noted).
POLYMER METHODS USED FOR UNDERGROUND STABILIZATION
PU Membrane Spray for Underground Stabilization Spray-on polymers have been used for a variety of underground applications in the mining industry(1). Based on a literature review, it appears that the spray-on products are typically used in underground mine areas with the potential for rock bursts or where smaller rock material may tend to ravel or fall from the ribs or roof of the mine. Comparisons of the spray-on products with
CHAPTER 3 – GROUT STABILIZATION METHODS
12
shotcrete indicate the spray-on polymers have 2 to 10 times the tensile strength of shotcrete with a thickness less than half of the shotcrete(2).
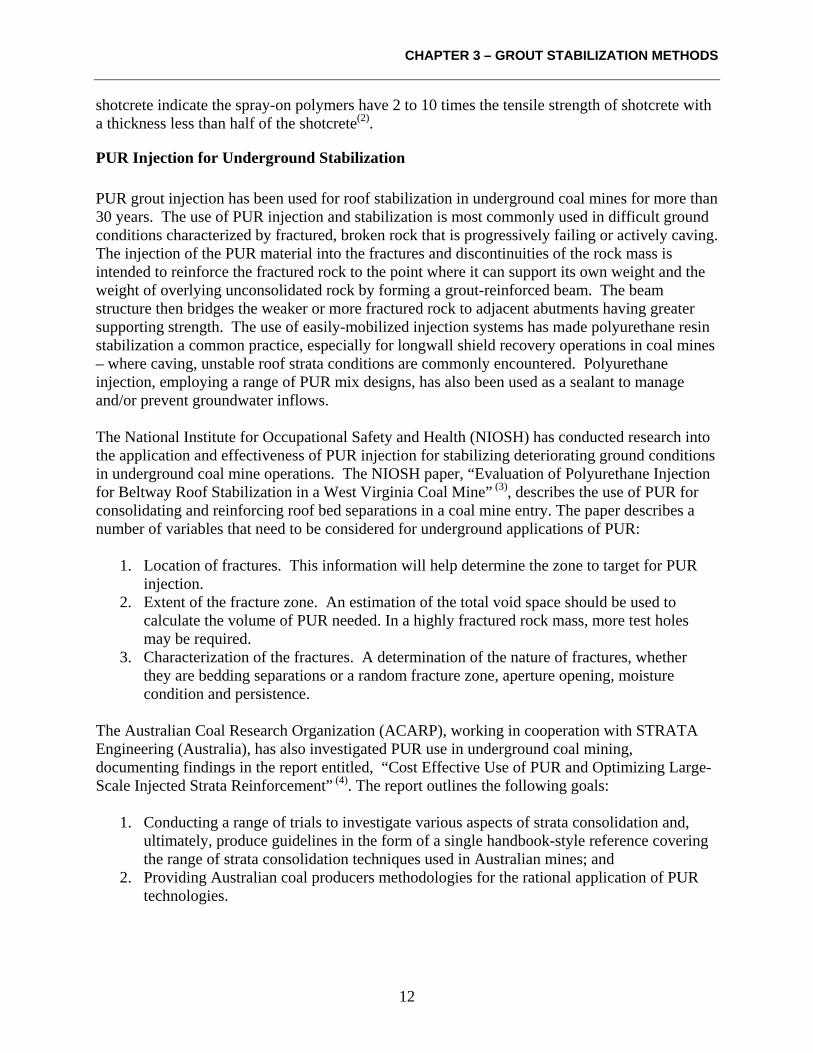
PUR Injection for Underground Stabilization PUR grout injection has been used for roof stabilization in underground coal mines for more than 30 years. The use of PUR injection and stabilization is most commonly used in difficult ground conditions characterized by fractured, broken rock that is progressively failing or actively caving. The injection of the PUR material into the fractures and discontinuities of the rock mass is intended to reinforce the fractured rock to the point where it can support its own weight and the weight of overlying unconsolidated rock by forming a grout-reinforced beam. The beam structure then bridges the weaker or more fractured rock to adjacent abutments having greater supporting strength. The use of easily-mobilized injection systems has made polyurethane resin stabilization a common practice, especially for longwall shield recovery operations in coal mines – where caving, unstable roof strata conditions are commonly encountered. Polyurethane injection, employing a range of PUR mix designs, has also been used as a sealant to manage and/or prevent groundwater inflows. The National Institute for Occupational Safety and Health (NIOSH) has conducted research into the application and effectiveness of PUR injection for stabilizing deteriorating ground conditions in underground coal mine operations. The NIOSH paper, “Evaluation of Polyurethane Injection for Beltway Roof Stabilization in a West Virginia Coal Mine” (3), describes the use of PUR for consolidating and reinforcing roof bed separations in a coal mine entry. The paper describes a number of variables that need to be considered for underground applications of PUR:
1. Location of fractures. This information will help determine the zone to target for PUR injection.
2. Extent of the fracture zone. An estimation of the total void space should be used to calculate the volume of PUR needed. In a highly fractured rock mass, more test holes may be required.
3. Characterization of the fractures. A determination of the nature of fractures, whether they are bedding separations or a random fracture zone, aperture opening, moisture condition and persistence.
The Australian Coal Research Organization (ACARP), working in cooperation with STRATA Engineering (Australia), has also investigated PUR use in underground coal mining, documenting findings in the report entitled, “Cost Effective Use of PUR and Optimizing Large-Scale Injected Strata Reinforcement” (4). The report outlines the following goals:
1. Conducting a range of trials to investigate various aspects of strata consolidation and, ultimately, produce guidelines in the form of a single handbook-style reference covering the range of strata consolidation techniques used in Australian mines; and
2. Providing Australian coal producers methodologies for the rational application of PUR technologies.
CHAPTER 3 – GROUT STABILIZATION METHODS
13
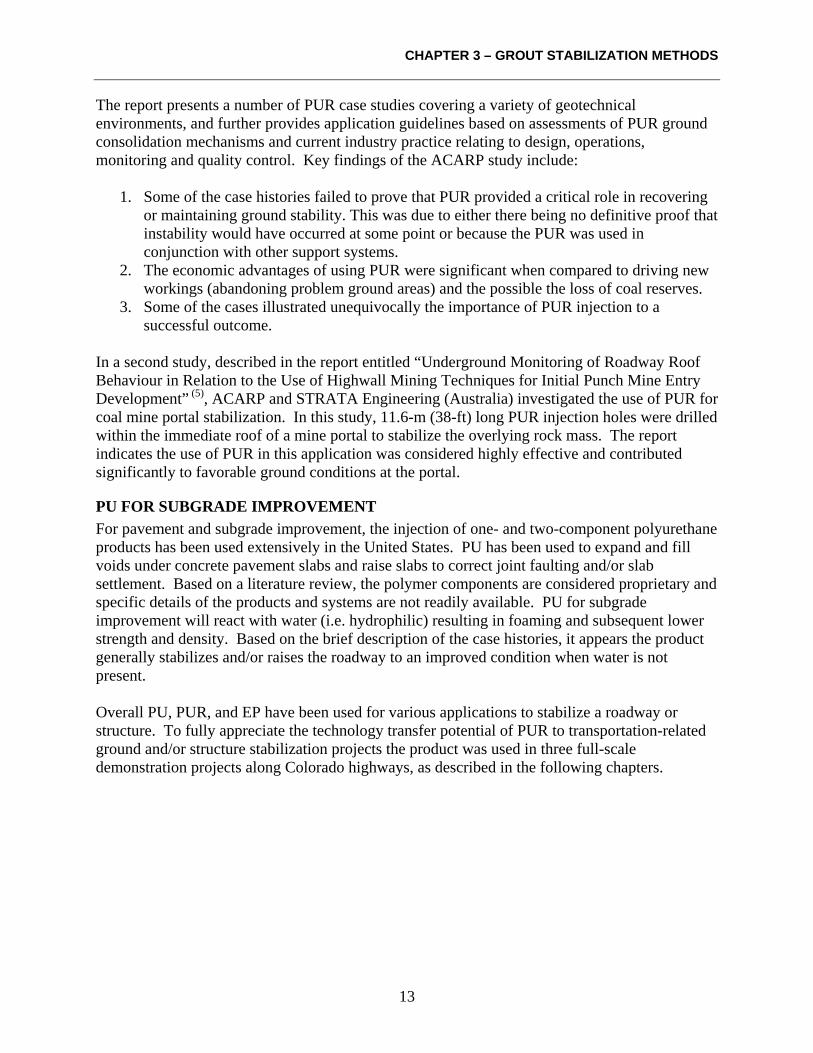
The report presents a number of PUR case studies covering a variety of geotechnical environments, and further provides application guidelines based on assessments of PUR ground consolidation mechanisms and current industry practice relating to design, operations, monitoring and quality control. Key findings of the ACARP study include:
1. Some of the case histories failed to prove that PUR provided a critical role in recovering or maintaining ground stability. This was due to either there being no definitive proof that instability would have occurred at some point or because the PUR was used in conjunction with other support systems.
2. The economic advantages of using PUR were significant when compared to driving new workings (abandoning problem ground areas) and the possible the loss of coal reserves.
3. Some of the cases illustrated unequivocally the importance of PUR injection to a successful outcome.
In a second study, described in the report entitled “Underground Monitoring of Roadway Roof Behaviour in Relation to the Use of Highwall Mining Techniques for Initial Punch Mine Entry Development” (5), ACARP and STRATA Engineering (Australia) investigated the use of PUR for coal mine portal stabilization. In this study, 11.6-m (38-ft) long PUR injection holes were drilled within the immediate roof of a mine portal to stabilize the overlying rock mass. The report indicates the use of PUR in this application was considered highly effective and contributed significantly to favorable ground conditions at the portal.
PU FOR SUBGRADE IMPROVEMENT For pavement and subgrade improvement, the injection of one- and two-component polyurethane products has been used extensively in the United States. PU has been used to expand and fill voids under concrete pavement slabs and raise slabs to correct joint faulting and/or slab settlement. Based on a literature review, the polymer components are considered proprietary and specific details of the products and systems are not readily available. PU for subgrade improvement will react with water (i.e. hydrophilic) resulting in foaming and subsequent lower strength and density. Based on the brief description of the case histories, it appears the product generally stabilizes and/or raises the roadway to an improved condition when water is not present. Overall PU, PUR, and EP have been used for various applications to stabilize a roadway or structure. To fully appreciate the technology transfer potential of PUR to transportation-related ground and/or structure stabilization projects the product was used in three full-scale demonstration projects along Colorado highways, as described in the following chapters.

CHAPTER 4 – ROCK MASS STABILIZATION DEMONSTRATION PROJECTS
15
CHAPTER 4 – ROCK MASS STABILIZATION DEMONSTRATION PROJECTS FLH demonstration projects to stabilize two rock mass sites were conducted in Colorado in 2006 and 2007. The first site was chosen to stabilize the western portal of the Poudre Canyon Tunnel, located along SH 14 west of Fort Collins, Colorado. The second site, a full production application sponsored by CDOT, involved a rock slope located on US 6 west of Golden, Colorado.
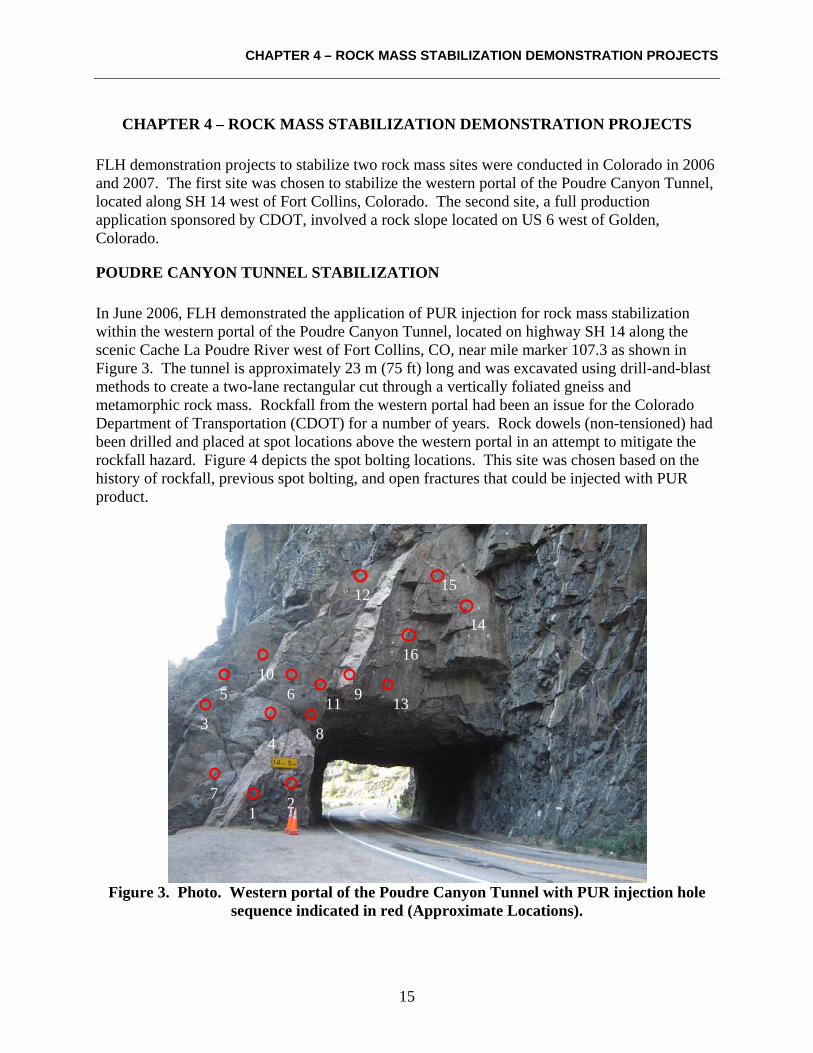
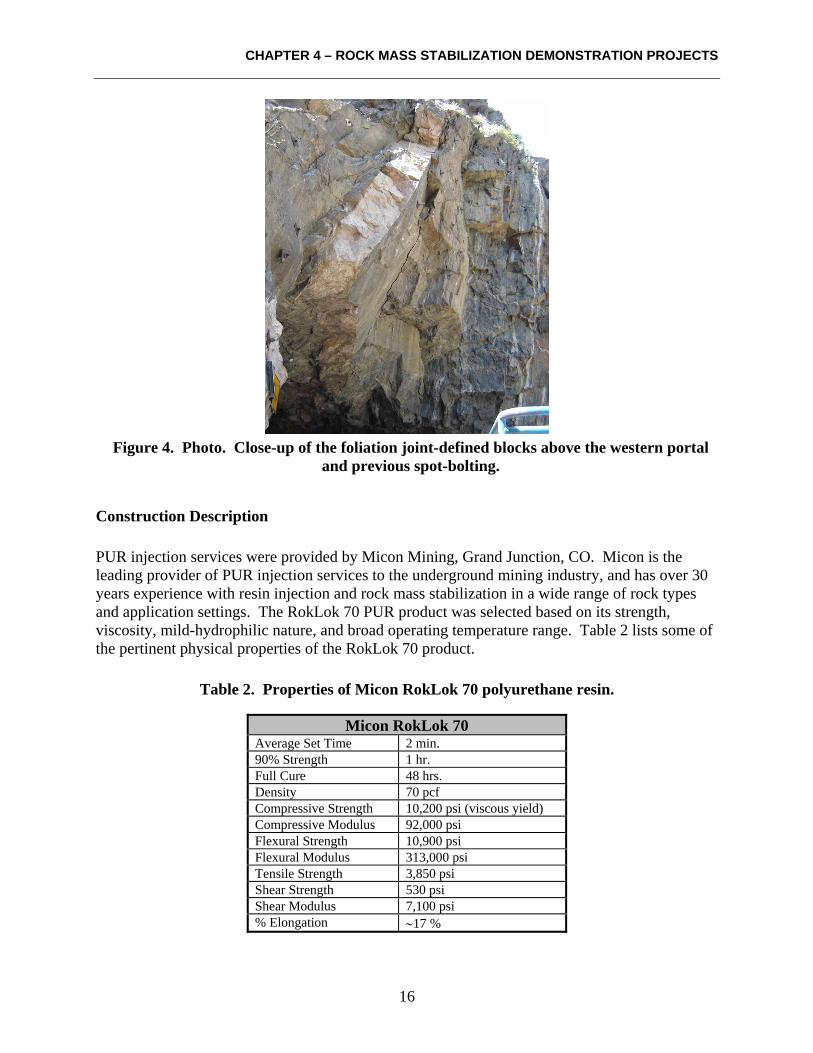
POUDRE CANYON TUNNEL STABILIZATION In June 2006, FLH demonstrated the application of PUR injection for rock mass stabilization within the western portal of the Poudre Canyon Tunnel, located on highway SH 14 along the scenic Cache La Poudre River west of Fort Collins, CO, near mile marker 107.3 as shown in Figure 3. The tunnel is approximately 23 m (75 ft) long and was excavated using drill-and-blast methods to create a two-lane rectangular cut through a vertically foliated gneiss and metamorphic rock mass. Rockfall from the western portal had been an issue for the Colorado Department of Transportation (CDOT) for a number of years. Rock dowels (non-tensioned) had been drilled and placed at spot locations above the western portal in an attempt to mitigate the rockfall hazard. Figure 4 depicts the spot bolting locations. This site was chosen based on the history of rockfall, previous spot bolting, and open fractures that could be injected with PUR product.
Figure 3. Photo. Western portal of the Poudre Canyon Tunnel with PUR injection hole
sequence indicated in red (Approximate Locations).
8 4
2
3
1 7
13 5
14
12 15
16
11
10 6 9
CHAPTER 4 – ROCK MASS STABILIZATION DEMONSTRATION PROJECTS
16
Figure 4. Photo. Close-up of the foliation joint-defined blocks above the western portal
and previous spot-bolting.
Construction Description PUR injection services were provided by Micon Mining, Grand Junction, CO. Micon is the leading provider of PUR injection services to the underground mining industry, and has over 30 years experience with resin injection and rock mass stabilization in a wide range of rock types and application settings. The RokLok 70 PUR product was selected based on its strength, viscosity, mild-hydrophilic nature, and broad operating temperature range. Table 2 lists some of the pertinent physical properties of the RokLok 70 product.
Table 2. Properties of Micon RokLok 70 polyurethane resin.
Micon RokLok 70 Average Set Time 2 min. 90% Strength 1 hr. Full Cure 48 hrs. Density 70 pcf Compressive Strength 10,200 psi (viscous yield) Compressive Modulus 92,000 psi Flexural Strength 10,900 psi Flexural Modulus 313,000 psi Tensile Strength 3,850 psi Shear Strength 530 psi Shear Modulus 7,100 psi % Elongation ∼17 %
CHAPTER 4 – ROCK MASS STABILIZATION DEMONSTRATION PROJECTS
17
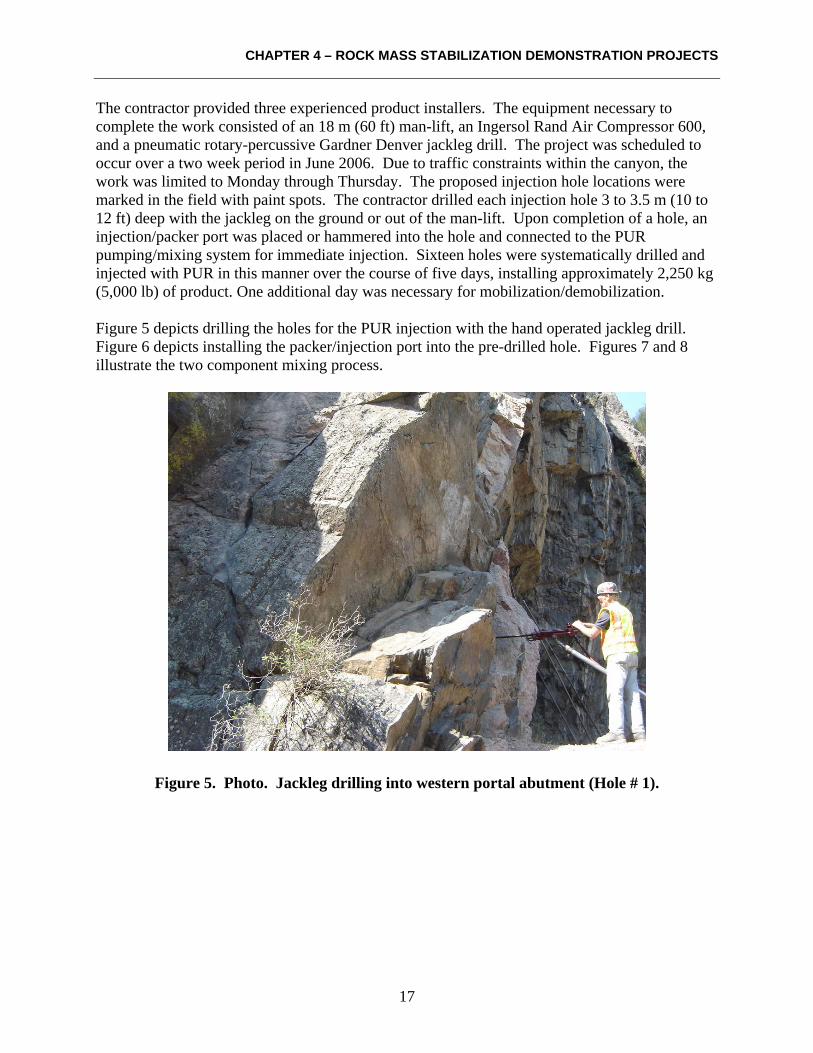
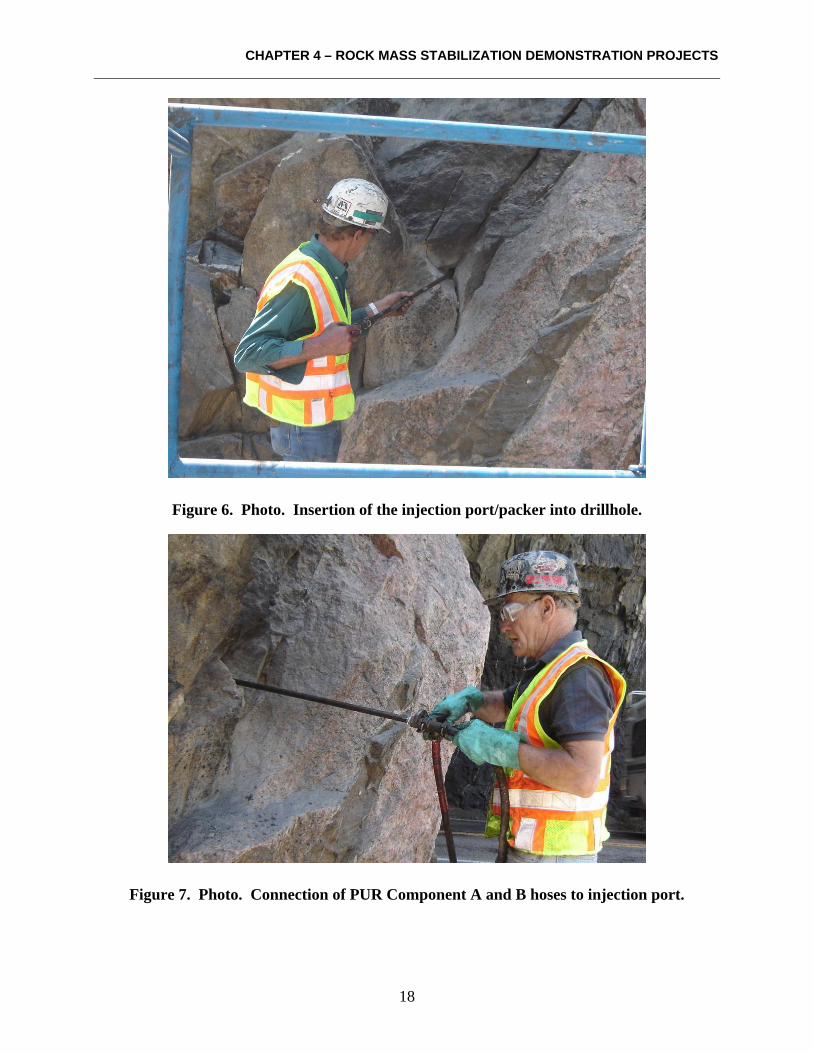
The contractor provided three experienced product installers. The equipment necessary to complete the work consisted of an 18 m (60 ft) man-lift, an Ingersol Rand Air Compressor 600, and a pneumatic rotary-percussive Gardner Denver jackleg drill. The project was scheduled to occur over a two week period in June 2006. Due to traffic constraints within the canyon, the work was limited to Monday through Thursday. The proposed injection hole locations were marked in the field with paint spots. The contractor drilled each injection hole 3 to 3.5 m (10 to 12 ft) deep with the jackleg on the ground or out of the man-lift. Upon completion of a hole, an injection/packer port was placed or hammered into the hole and connected to the PUR pumping/mixing system for immediate injection. Sixteen holes were systematically drilled and injected with PUR in this manner over the course of five days, installing approximately 2,250 kg (5,000 lb) of product. One additional day was necessary for mobilization/demobilization. Figure 5 depicts drilling the holes for the PUR injection with the hand operated jackleg drill. Figure 6 depicts installing the packer/injection port into the pre-drilled hole. Figures 7 and 8 illustrate the two component mixing process.
Figure 5. Photo. Jackleg drilling into western portal abutment (Hole # 1).
CHAPTER 4 – ROCK MASS STABILIZATION DEMONSTRATION PROJECTS
18
Figure 6. Photo. Insertion of the injection port/packer into drillhole.
Figure 7. Photo. Connection of PUR Component A and B hoses to injection port.
CHAPTER 4 – ROCK MASS STABILIZATION DEMONSTRATION PROJECTS
19
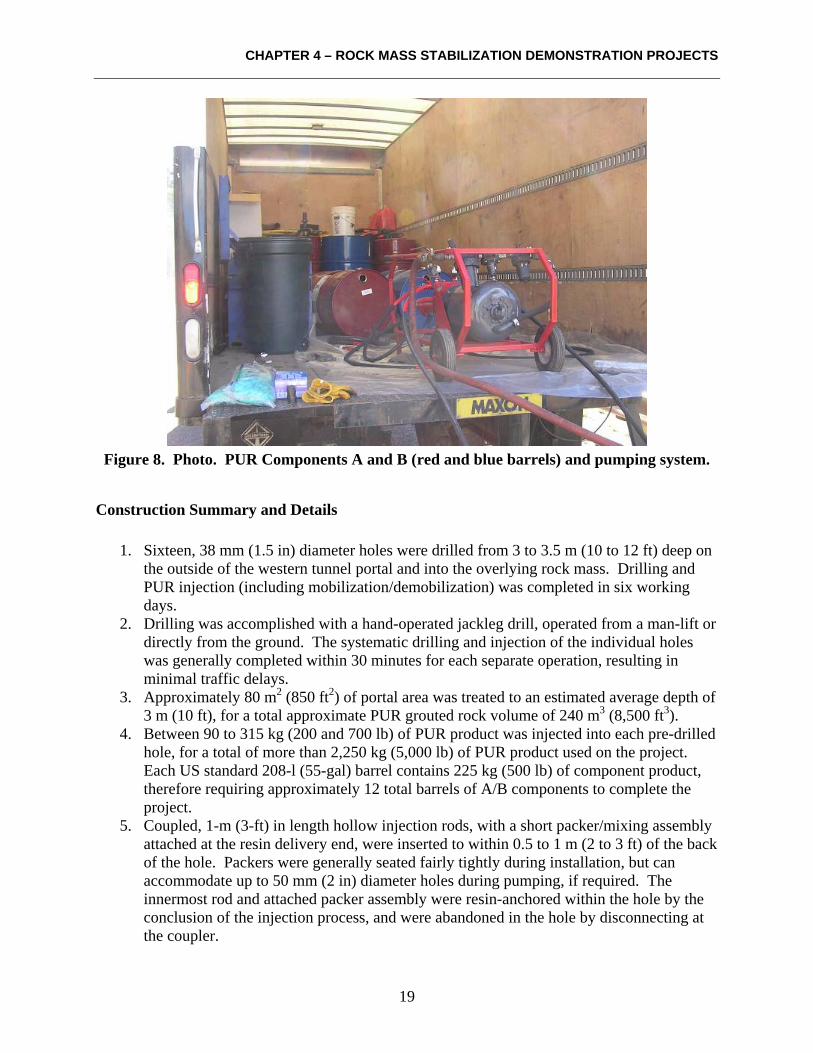
Figure 8. Photo. PUR Components A and B (red and blue barrels) and pumping system.
Construction Summary and Details
1. Sixteen, 38 mm (1.5 in) diameter holes were drilled from 3 to 3.5 m (10 to 12 ft) deep on the outside of the western tunnel portal and into the overlying rock mass. Drilling and PUR injection (including mobilization/demobilization) was completed in six working days.
2. Drilling was accomplished with a hand-operated jackleg drill, operated from a man-lift or directly from the ground. The systematic drilling and injection of the individual holes was generally completed within 30 minutes for each separate operation, resulting in minimal traffic delays.
3. Approximately 80 m2 (850 ft2) of portal area was treated to an estimated average depth of 3 m (10 ft), for a total approximate PUR grouted rock volume of 240 m3 (8,500 ft3).
4. Between 90 to 315 kg (200 and 700 lb) of PUR product was injected into each pre-drilled hole, for a total of more than 2,250 kg (5,000 lb) of PUR product used on the project. Each US standard 208-l (55-gal) barrel contains 225 kg (500 lb) of component product, therefore requiring approximately 12 total barrels of A/B components to complete the project.
5. Coupled, 1-m (3-ft) in length hollow injection rods, with a short packer/mixing assembly attached at the resin delivery end, were inserted to within 0.5 to 1 m (2 to 3 ft) of the back of the hole. Packers were generally seated fairly tightly during installation, but can accommodate up to 50 mm (2 in) diameter holes during pumping, if required. The innermost rod and attached packer assembly were resin-anchored within the hole by the conclusion of the injection process, and were abandoned in the hole by disconnecting at the coupler.
CHAPTER 4 – ROCK MASS STABILIZATION DEMONSTRATION PROJECTS
20
6. Relatively small volumes were pumped (4 to 8 l/min (1 to 4 gpm)) under low pressure (<0.34 MPa, <50 psi) until PUR overrun was observed. Pumping was then suspended for approximately 1 minute, allowing the PUR to begin to set prior to resuming pumping. Staging the pumping in this manner allows cracks to seal, thereby pushing the next volume of PUR delivered along other fracture and joint paths.
7. Work progressed from bottom-to-top. Initial PUR injection would flow down through the rock mass until the rapid set effectively sealed the lower portion of the rock mass. Continued pumping would then cause the PUR to migrate laterally and upward within the rock mass discontinuities surrounding the installation hole. In most cases, PUR migration was confined to an approximate 1.2 to 2.4 m (4 to 8 ft) radius around the installation hole. However, more persistent discontinuities with wide apertures could easily convey PUR 3 to 4.5 m (10 to15 ft) prior to initial set.
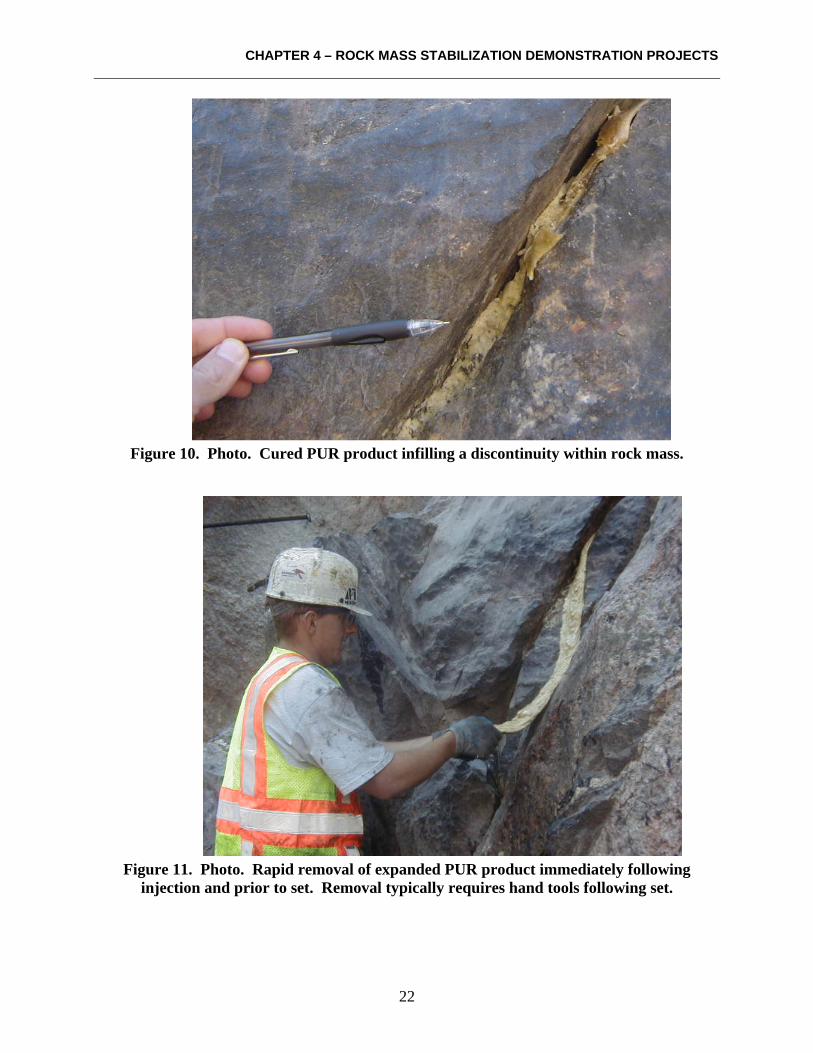
8. A majority of the rock mass discontinuities appeared to be filled with hard, non-expanded, dense resin. Foamed resin was seen coming from rock mass discontinuities located near the overlying slope surface and beneath slope vegetation, indicating sections with higher moisture contents as shown in Figures 9 and 10.
9. Despite the volume of resin pumped within the portal area, no rockfall occurred during or following PUR injection from injection pressures or resin expansion in wet zones. The staged injection and rapid set of the PUR is believed to quickly secure loose rock with minimal displacement.
10. Traffic was stopped during all drilling and injection operations, with average delays running about 30 minutes. Vehicles were kept well back from the injection operation to avoid fine PUR “strands”, occasionally squeezing from fine cracks during pumping, from landing on and affixing to car exteriors.
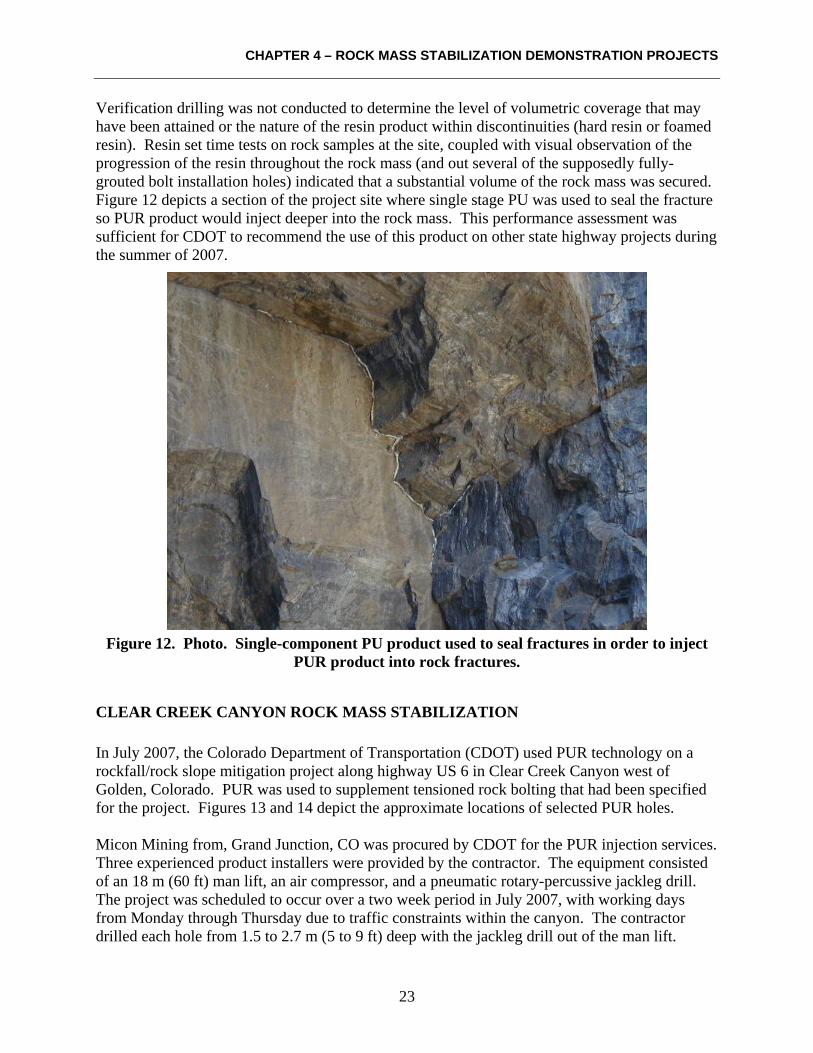
11. No significant overruns were encountered. Cleanup involved rapidly peeling PUR drips and runs from the rock mass prior to set, or chipping hardened overruns from the rock surface with hand tools as shown in Figure 11. Injection holes were plugged with dark-colored grout, rendering them virtually invisible throughout the portal area. A few months after the project was completed, following weathering of the thin veneers of PUR overrun left following cleanup, it was nearly impossible to see that any work had been done at the site.
12. The total cost of the project, less traffic control provided by CDOT Maintenance, was $42,000, or just over $18/kg ($8/lb) of installed PUR.
Table 3 depicts the drilling rate and injection rates for the PUR project for the Poudre Canyon Project.
CHAPTER 4 – ROCK MASS STABILIZATION DEMONSTRATION PROJECTS
21
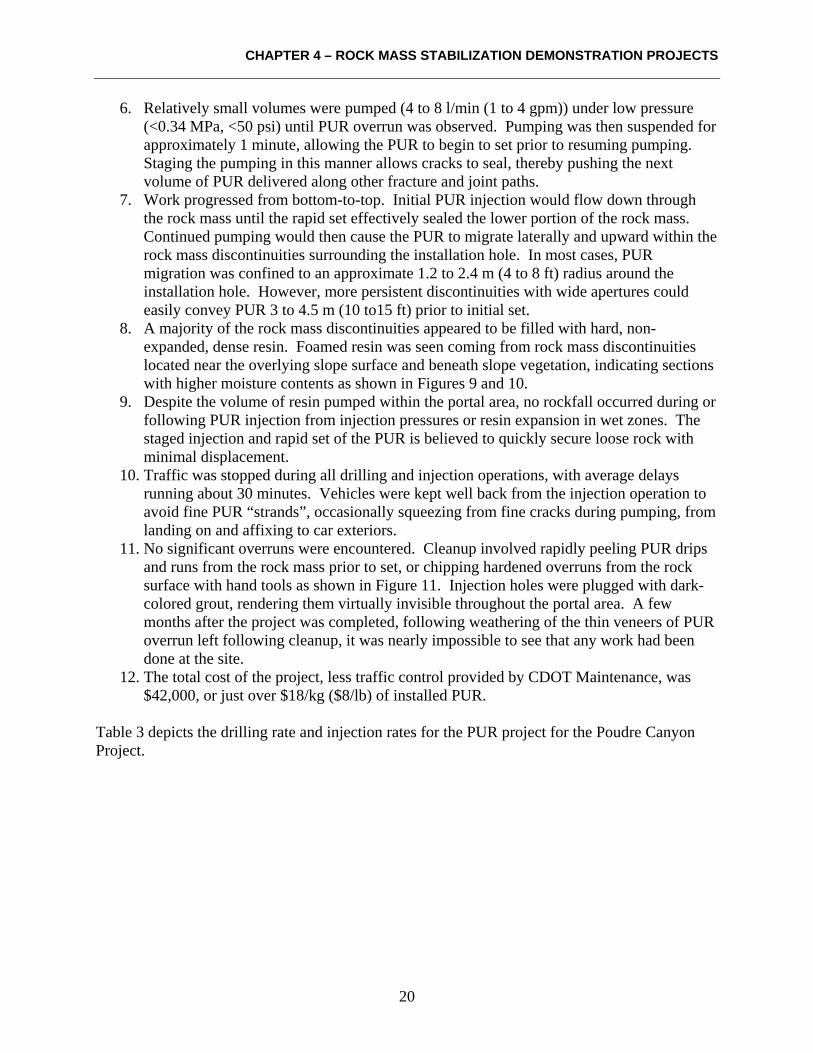
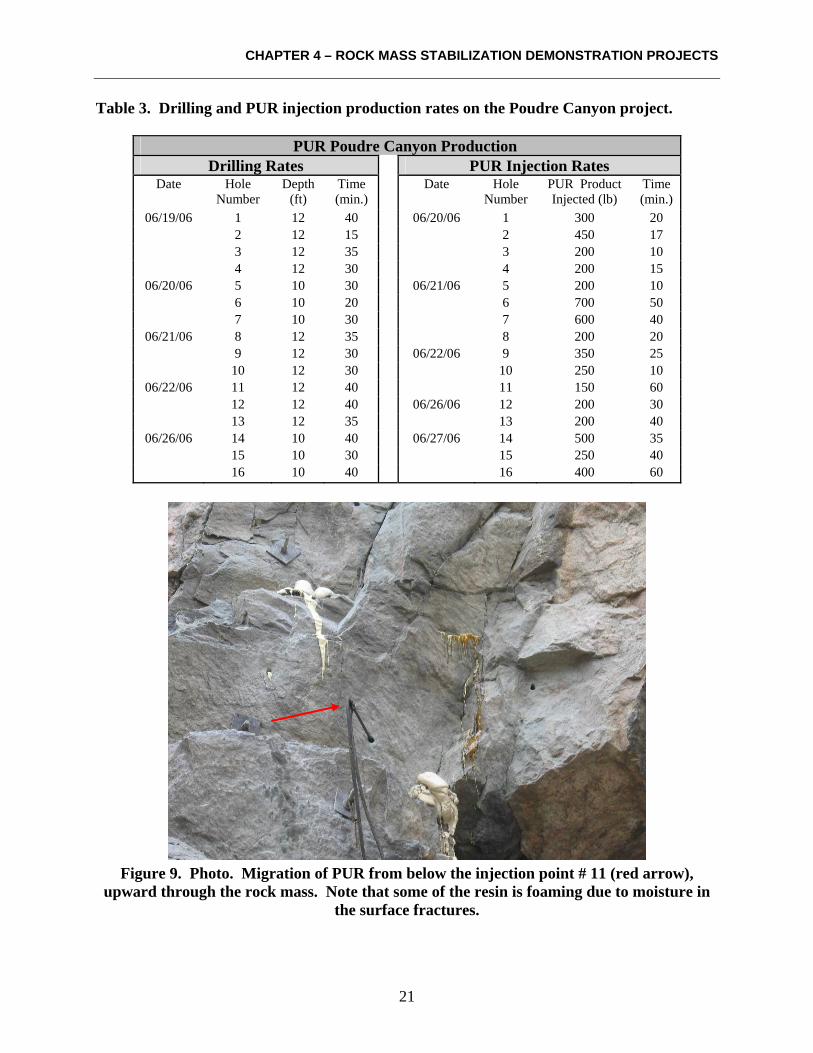
Table 3. Drilling and PUR injection production rates on the Poudre Canyon project.
PUR Poudre Canyon Production Drilling Rates PUR Injection Rates
Date Hole Number
Depth (ft)
Time (min.)
Date Hole Number
PUR Product Injected (lb)
Time (min.)
06/19/06 1 12 40 06/20/06 1 300 20 2 12 15 2 450 17 3 12 35 3 200 10 4 12 30 4 200 15
06/20/06 5 10 30 06/21/06 5 200 10 6 10 20 6 700 50 7 10 30 7 600 40
06/21/06 8 12 35 8 200 20 9 12 30 06/22/06 9 350 25 10 12 30 10 250 10
06/22/06 11 12 40 11 150 60 12 12 40 06/26/06 12 200 30 13 12 35 13 200 40
06/26/06 14 10 40 06/27/06 14 500 35 15 10 30 15 250 40 16 10 40 16 400 60
Figure 9. Photo. Migration of PUR from below the injection point # 11 (red arrow),
upward through the rock mass. Note that some of the resin is foaming due to moisture in the surface fractures.
CHAPTER 4 – ROCK MASS STABILIZATION DEMONSTRATION PROJECTS
22
Figure 10. Photo. Cured PUR product infilling a discontinuity within rock mass.
Figure 11. Photo. Rapid removal of expanded PUR product immediately following
injection and prior to set. Removal typically requires hand tools following set.
CHAPTER 4 – ROCK MASS STABILIZATION DEMONSTRATION PROJECTS
23
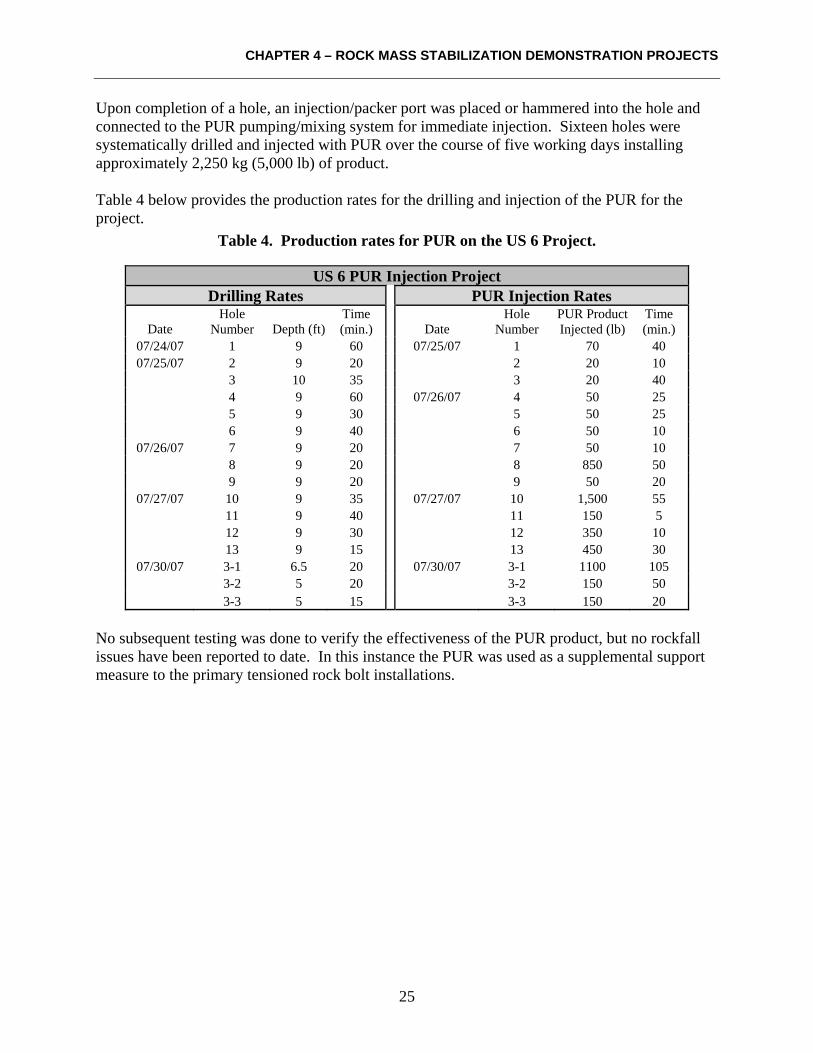
Verification drilling was not conducted to determine the level of volumetric coverage that may have been attained or the nature of the resin product within discontinuities (hard resin or foamed resin). Resin set time tests on rock samples at the site, coupled with visual observation of the progression of the resin throughout the rock mass (and out several of the supposedly fully-grouted bolt installation holes) indicated that a substantial volume of the rock mass was secured. Figure 12 depicts a section of the project site where single stage PU was used to seal the fracture so PUR product would inject deeper into the rock mass. This performance assessment was sufficient for CDOT to recommend the use of this product on other state highway projects during the summer of 2007.
Figure 12. Photo. Single-component PU product used to seal fractures in order to inject
PUR product into rock fractures.
CLEAR CREEK CANYON ROCK MASS STABILIZATION In July 2007, the Colorado Department of Transportation (CDOT) used PUR technology on a rockfall/rock slope mitigation project along highway US 6 in Clear Creek Canyon west of Golden, Colorado. PUR was used to supplement tensioned rock bolting that had been specified for the project. Figures 13 and 14 depict the approximate locations of selected PUR holes. Micon Mining from, Grand Junction, CO was procured by CDOT for the PUR injection services. Three experienced product installers were provided by the contractor. The equipment consisted of an 18 m (60 ft) man lift, an air compressor, and a pneumatic rotary-percussive jackleg drill. The project was scheduled to occur over a two week period in July 2007, with working days from Monday through Thursday due to traffic constraints within the canyon. The contractor drilled each hole from 1.5 to 2.7 m (5 to 9 ft) deep with the jackleg drill out of the man lift.

CHAPTER 4 – ROCK MASS STABILIZATION DEMONSTRATION PROJECTS
24
Figure 13. Photo. Approximate locations of selected PUR injection holes.
Figure 14. Photo. Approximate locations of selected PUR injection holes.
1
2
5 4 3 9
8 6
7
12 13 11
10
CHAPTER 4 – ROCK MASS STABILIZATION DEMONSTRATION PROJECTS
25
Upon completion of a hole, an injection/packer port was placed or hammered into the hole and connected to the PUR pumping/mixing system for immediate injection. Sixteen holes were systematically drilled and injected with PUR over the course of five working days installing approximately 2,250 kg (5,000 lb) of product. Table 4 below provides the production rates for the drilling and injection of the PUR for the project.
Table 4. Production rates for PUR on the US 6 Project.
US 6 PUR Injection Project Drilling Rates PUR Injection Rates
Date Hole
Number Depth (ft) Time (min.) Date
Hole Number
PUR Product Injected (lb)
Time (min.)
07/24/07 1 9 60 07/25/07 1 70 40 07/25/07 2 9 20 2 20 10
3 10 35 3 20 40 4 9 60 07/26/07 4 50 25 5 9 30 5 50 25 6 9 40 6 50 10
07/26/07 7 9 20 7 50 10 8 9 20 8 850 50 9 9 20 9 50 20
07/27/07 10 9 35 07/27/07 10 1,500 55 11 9 40 11 150 5 12 9 30 12 350 10 13 9 15 13 450 30
07/30/07 3-1 6.5 20 07/30/07 3-1 1100 105 3-2 5 20 3-2 150 50 3-3 5 15 3-3 150 20
No subsequent testing was done to verify the effectiveness of the PUR product, but no rockfall issues have been reported to date. In this instance the PUR was used as a supplemental support measure to the primary tensioned rock bolt installations.

CHAPTER 5 – RETAINING WALL DEMONSTRATION PROJECT
27
CHAPTER 5 – RETAINING WALL DEMONSTRATION PROJECT
OVERVIEW In September 2007, FLH evaluated the potential application of PUR injection for stabilizing dry-stack stone masonry retaining walls. Unlike typical rock mass applications, non-mortared rock retaining walls are highly porous, generally ranging from 5% to 30% open space depending on the size of stone placed in the structure, degree of masonry performed, and the overall quality of construction. The non-uniform, high-open space character of these structures can significantly complicate planned PUR delivery within targeted wall volumes. The decades-old structures, many of which are in serious disrepair and/or varying states of failure, are also highly sensitive to injection and PUR expansion pressures, potentially limiting the use of PUR products in wet environments. In addition, the often culturally sensitive nature of these structures further requires that evidence of repair be kept to a minimum, placing considerable emphasis on managing PUR overruns and cleanup. The PUR product was injected behind a failing wall system with soft, open-spaced materials. The PUR product provided the following advantages to cement grouts by providing:
1. Greater viscosity which limited product migration keeping product behind the wall system and out of the nearby sensitive areas.
2. Provided very fast adhesion between the dry-stack boulders. 3. Provided greater tensile strength to the wall system that would not have been achievable
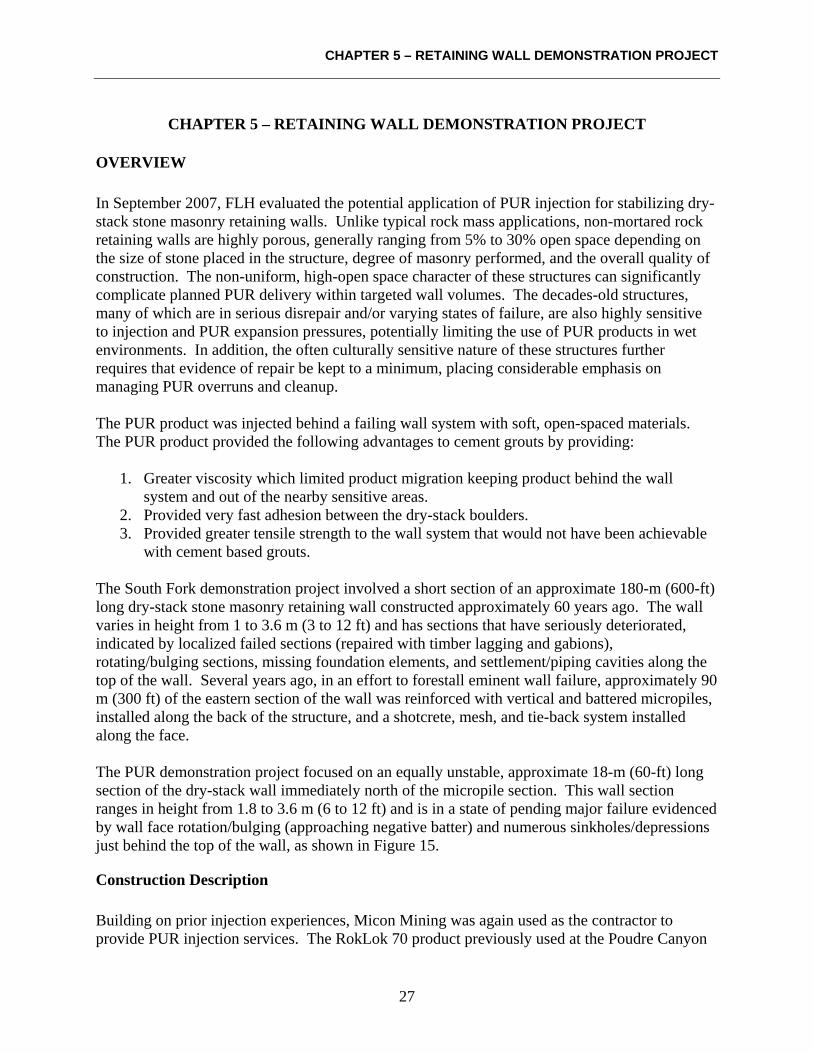
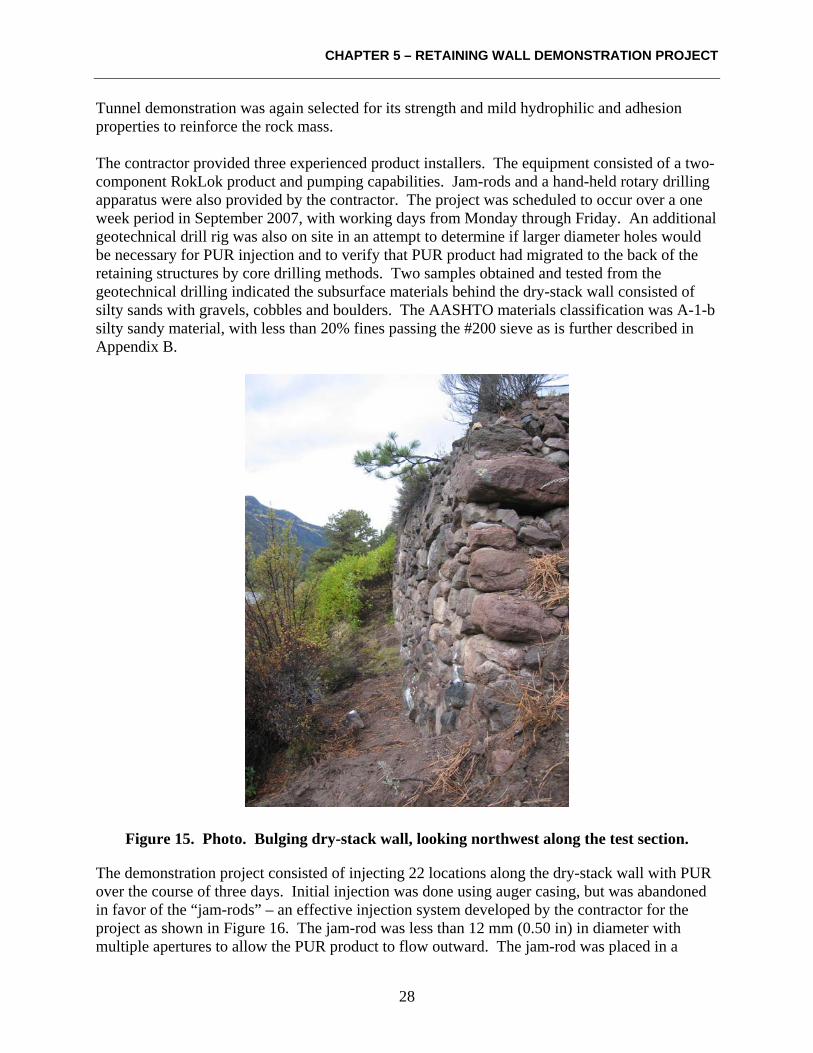
with cement based grouts. The South Fork demonstration project involved a short section of an approximate 180-m (600-ft) long dry-stack stone masonry retaining wall constructed approximately 60 years ago. The wall varies in height from 1 to 3.6 m (3 to 12 ft) and has sections that have seriously deteriorated, indicated by localized failed sections (repaired with timber lagging and gabions), rotating/bulging sections, missing foundation elements, and settlement/piping cavities along the top of the wall. Several years ago, in an effort to forestall eminent wall failure, approximately 90 m (300 ft) of the eastern section of the wall was reinforced with vertical and battered micropiles, installed along the back of the structure, and a shotcrete, mesh, and tie-back system installed along the face. The PUR demonstration project focused on an equally unstable, approximate 18-m (60-ft) long section of the dry-stack wall immediately north of the micropile section. This wall section ranges in height from 1.8 to 3.6 m (6 to 12 ft) and is in a state of pending major failure evidenced by wall face rotation/bulging (approaching negative batter) and numerous sinkholes/depressions just behind the top of the wall, as shown in Figure 15.
Construction Description Building on prior injection experiences, Micon Mining was again used as the contractor to provide PUR injection services. The RokLok 70 product previously used at the Poudre Canyon
CHAPTER 5 – RETAINING WALL DEMONSTRATION PROJECT
28
Tunnel demonstration was again selected for its strength and mild hydrophilic and adhesion properties to reinforce the rock mass. The contractor provided three experienced product installers. The equipment consisted of a two-component RokLok product and pumping capabilities. Jam-rods and a hand-held rotary drilling apparatus were also provided by the contractor. The project was scheduled to occur over a one week period in September 2007, with working days from Monday through Friday. An additional geotechnical drill rig was also on site in an attempt to determine if larger diameter holes would be necessary for PUR injection and to verify that PUR product had migrated to the back of the retaining structures by core drilling methods. Two samples obtained and tested from the geotechnical drilling indicated the subsurface materials behind the dry-stack wall consisted of silty sands with gravels, cobbles and boulders. The AASHTO materials classification was A-1-b silty sandy material, with less than 20% fines passing the #200 sieve as is further described in Appendix B.
Figure 15. Photo. Bulging dry-stack wall, looking northwest along the test section.
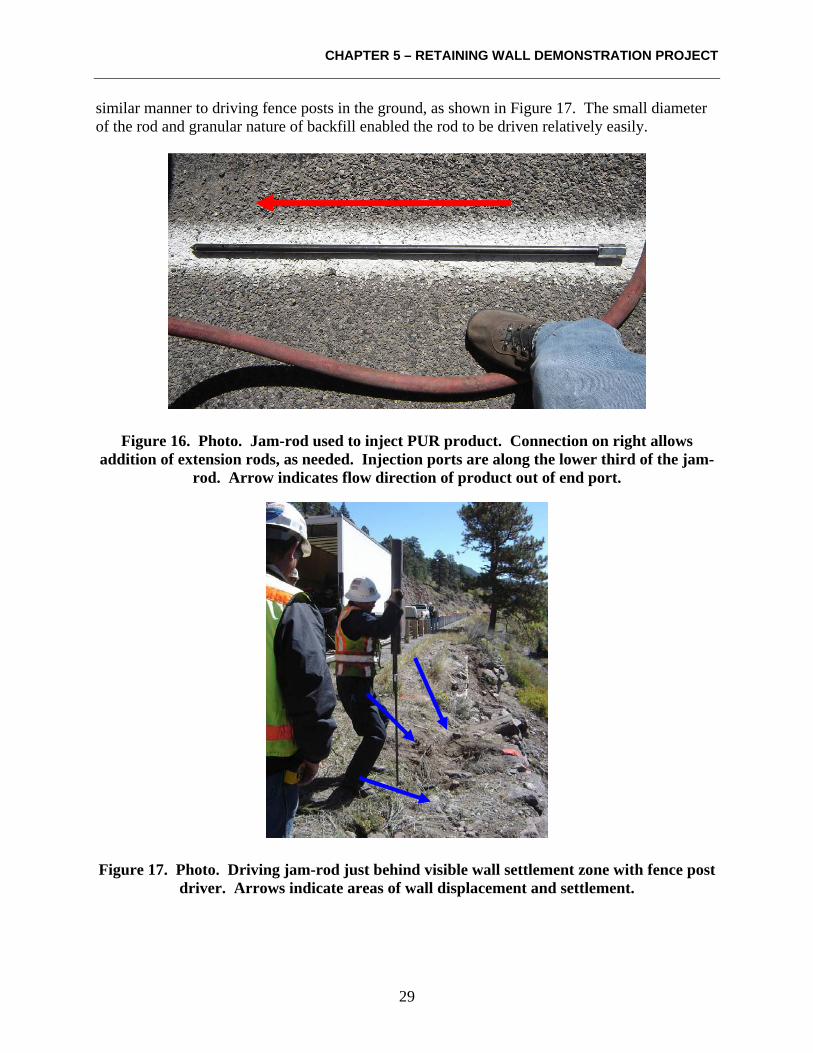
The demonstration project consisted of injecting 22 locations along the dry-stack wall with PUR over the course of three days. Initial injection was done using auger casing, but was abandoned in favor of the “jam-rods” – an effective injection system developed by the contractor for the project as shown in Figure 16. The jam-rod was less than 12 mm (0.50 in) in diameter with multiple apertures to allow the PUR product to flow outward. The jam-rod was placed in a
CHAPTER 5 – RETAINING WALL DEMONSTRATION PROJECT
29
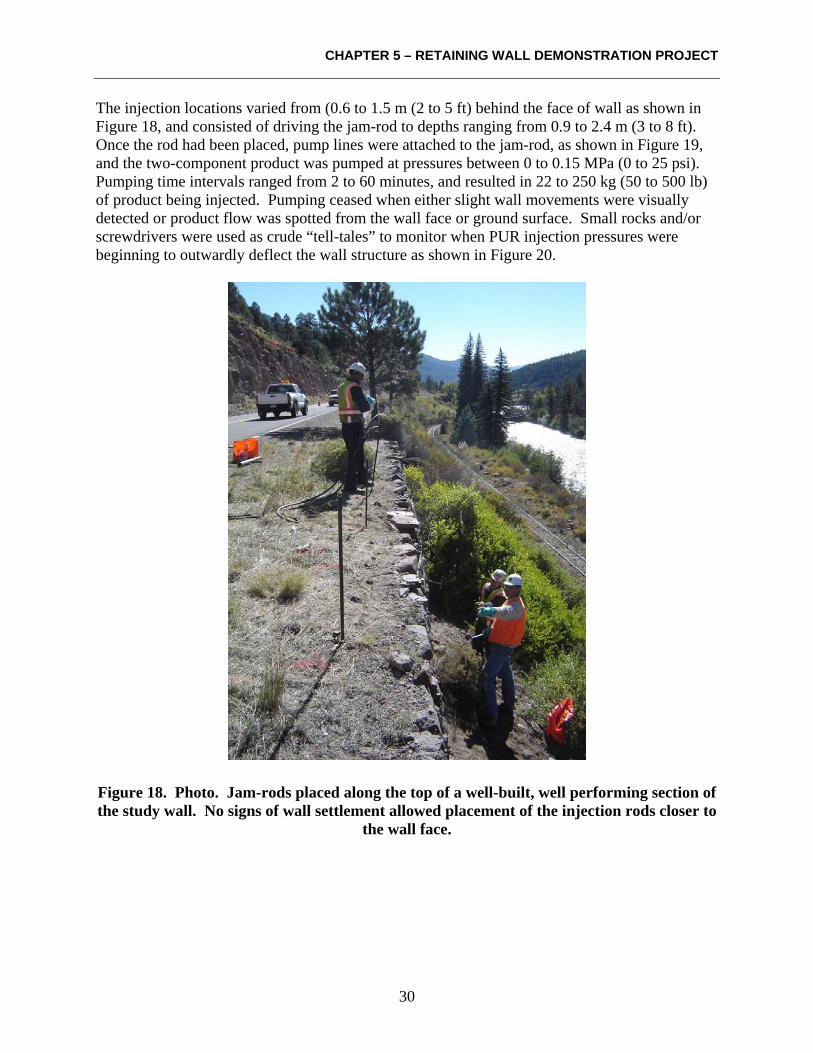
similar manner to driving fence posts in the ground, as shown in Figure 17. The small diameter of the rod and granular nature of backfill enabled the rod to be driven relatively easily.
Figure 16. Photo. Jam-rod used to inject PUR product. Connection on right allows addition of extension rods, as needed. Injection ports are along the lower third of the jam-
rod. Arrow indicates flow direction of product out of end port.
Figure 17. Photo. Driving jam-rod just behind visible wall settlement zone with fence post driver. Arrows indicate areas of wall displacement and settlement.
CHAPTER 5 – RETAINING WALL DEMONSTRATION PROJECT
30
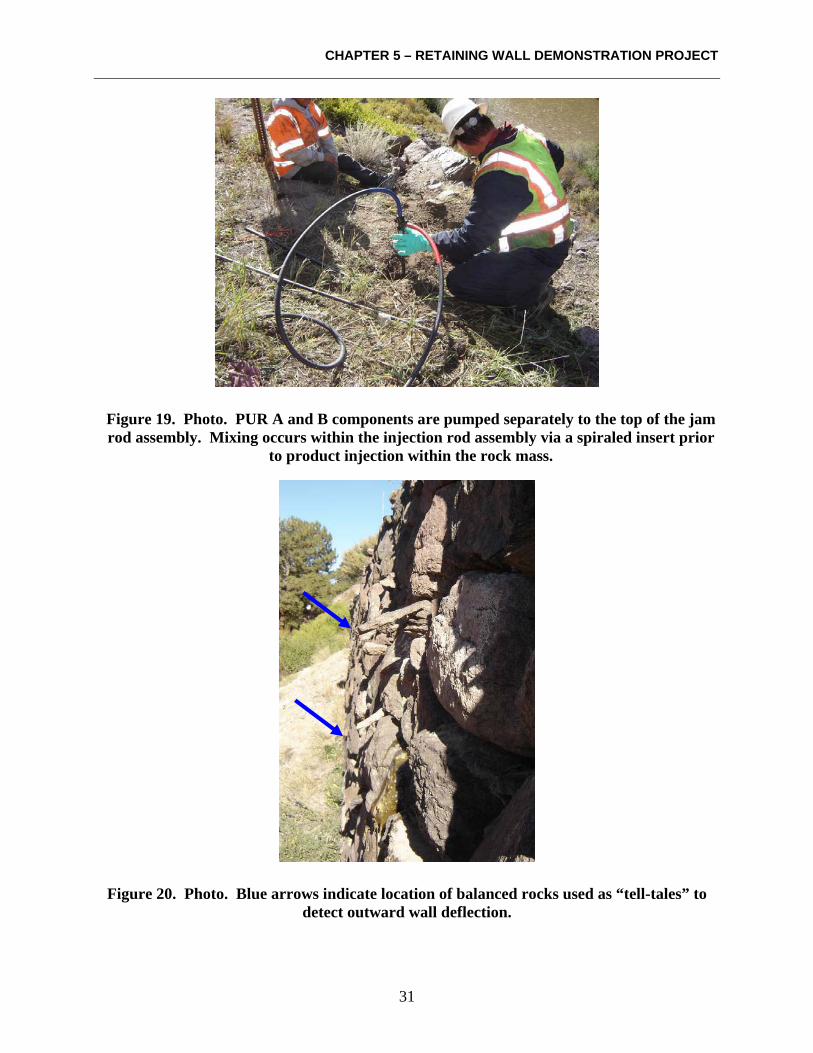
The injection locations varied from (0.6 to 1.5 m (2 to 5 ft) behind the face of wall as shown in Figure 18, and consisted of driving the jam-rod to depths ranging from 0.9 to 2.4 m (3 to 8 ft). Once the rod had been placed, pump lines were attached to the jam-rod, as shown in Figure 19, and the two-component product was pumped at pressures between 0 to 0.15 MPa (0 to 25 psi). Pumping time intervals ranged from 2 to 60 minutes, and resulted in 22 to 250 kg (50 to 500 lb) of product being injected. Pumping ceased when either slight wall movements were visually detected or product flow was spotted from the wall face or ground surface. Small rocks and/or screwdrivers were used as crude “tell-tales” to monitor when PUR injection pressures were beginning to outwardly deflect the wall structure as shown in Figure 20.
Figure 18. Photo. Jam-rods placed along the top of a well-built, well performing section of the study wall. No signs of wall settlement allowed placement of the injection rods closer to
the wall face.
CHAPTER 5 – RETAINING WALL DEMONSTRATION PROJECT
31
Figure 19. Photo. PUR A and B components are pumped separately to the top of the jam rod assembly. Mixing occurs within the injection rod assembly via a spiraled insert prior
to product injection within the rock mass.
Figure 20. Photo. Blue arrows indicate location of balanced rocks used as “tell-tales” to detect outward wall deflection.
CHAPTER 5 – RETAINING WALL DEMONSTRATION PROJECT
32
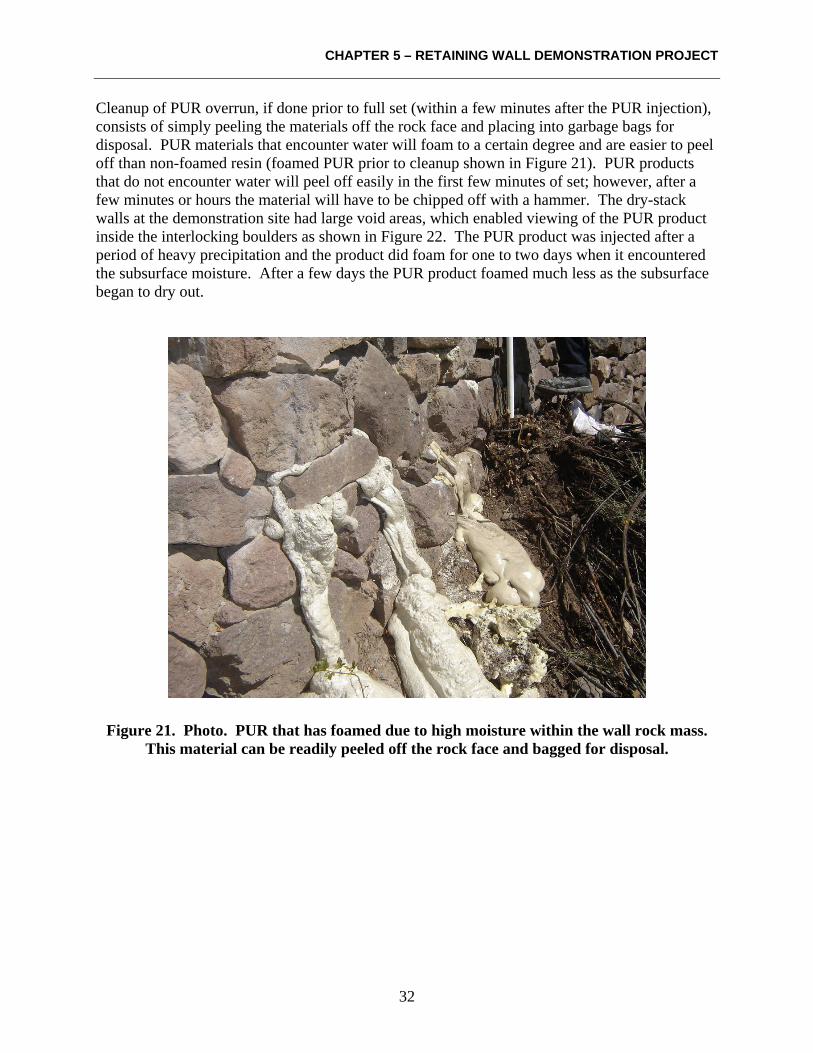
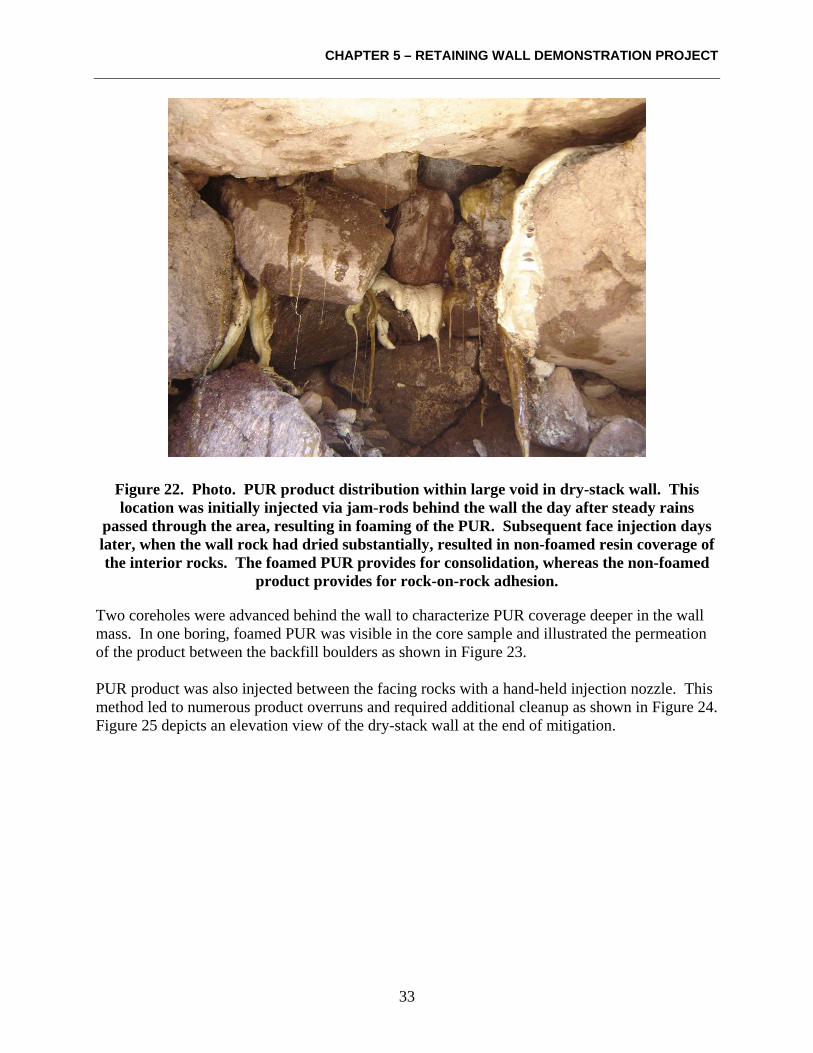
Cleanup of PUR overrun, if done prior to full set (within a few minutes after the PUR injection), consists of simply peeling the materials off the rock face and placing into garbage bags for disposal. PUR materials that encounter water will foam to a certain degree and are easier to peel off than non-foamed resin (foamed PUR prior to cleanup shown in Figure 21). PUR products that do not encounter water will peel off easily in the first few minutes of set; however, after a few minutes or hours the material will have to be chipped off with a hammer. The dry-stack walls at the demonstration site had large void areas, which enabled viewing of the PUR product inside the interlocking boulders as shown in Figure 22. The PUR product was injected after a period of heavy precipitation and the product did foam for one to two days when it encountered the subsurface moisture. After a few days the PUR product foamed much less as the subsurface began to dry out.
Figure 21. Photo. PUR that has foamed due to high moisture within the wall rock mass. This material can be readily peeled off the rock face and bagged for disposal.
CHAPTER 5 – RETAINING WALL DEMONSTRATION PROJECT
33
Figure 22. Photo. PUR product distribution within large void in dry-stack wall. This location was initially injected via jam-rods behind the wall the day after steady rains
passed through the area, resulting in foaming of the PUR. Subsequent face injection days later, when the wall rock had dried substantially, resulted in non-foamed resin coverage of the interior rocks. The foamed PUR provides for consolidation, whereas the non-foamed
product provides for rock-on-rock adhesion.
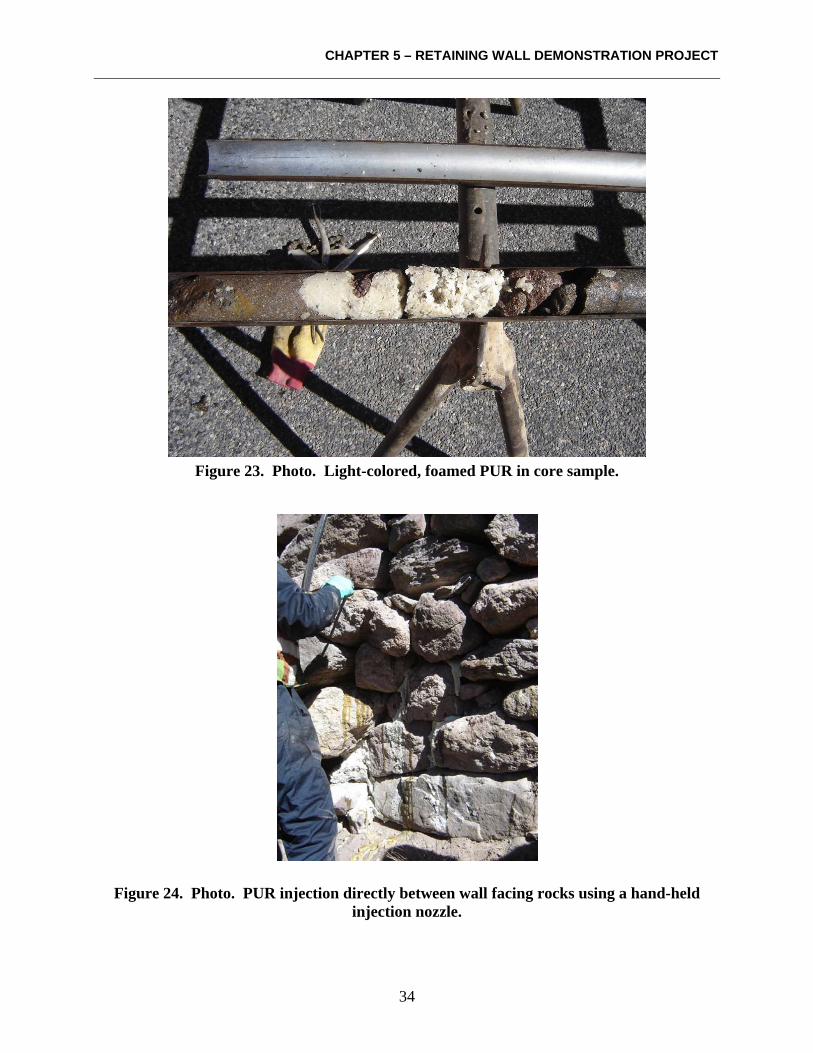
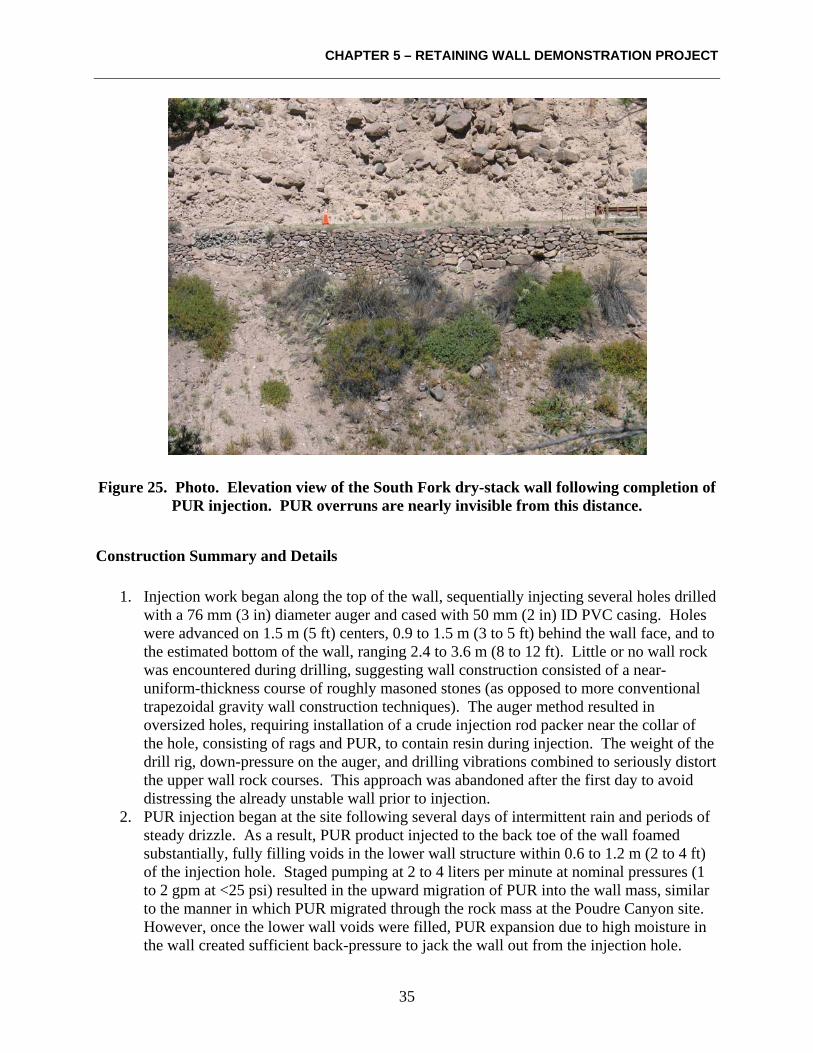
Two coreholes were advanced behind the wall to characterize PUR coverage deeper in the wall mass. In one boring, foamed PUR was visible in the core sample and illustrated the permeation of the product between the backfill boulders as shown in Figure 23. PUR product was also injected between the facing rocks with a hand-held injection nozzle. This method led to numerous product overruns and required additional cleanup as shown in Figure 24. Figure 25 depicts an elevation view of the dry-stack wall at the end of mitigation.
CHAPTER 5 – RETAINING WALL DEMONSTRATION PROJECT
34
Figure 23. Photo. Light-colored, foamed PUR in core sample.
Figure 24. Photo. PUR injection directly between wall facing rocks using a hand-held injection nozzle.
CHAPTER 5 – RETAINING WALL DEMONSTRATION PROJECT
35
Figure 25. Photo. Elevation view of the South Fork dry-stack wall following completion of PUR injection. PUR overruns are nearly invisible from this distance.
Construction Summary and Details
1. Injection work began along the top of the wall, sequentially injecting several holes drilled with a 76 mm (3 in) diameter auger and cased with 50 mm (2 in) ID PVC casing. Holes were advanced on 1.5 m (5 ft) centers, 0.9 to 1.5 m (3 to 5 ft) behind the wall face, and to the estimated bottom of the wall, ranging 2.4 to 3.6 m (8 to 12 ft). Little or no wall rock was encountered during drilling, suggesting wall construction consisted of a near-uniform-thickness course of roughly masoned stones (as opposed to more conventional trapezoidal gravity wall construction techniques). The auger method resulted in oversized holes, requiring installation of a crude injection rod packer near the collar of the hole, consisting of rags and PUR, to contain resin during injection. The weight of the drill rig, down-pressure on the auger, and drilling vibrations combined to seriously distort the upper wall rock courses. This approach was abandoned after the first day to avoid distressing the already unstable wall prior to injection.
2. PUR injection began at the site following several days of intermittent rain and periods of steady drizzle. As a result, PUR product injected to the back toe of the wall foamed substantially, fully filling voids in the lower wall structure within 0.6 to 1.2 m (2 to 4 ft) of the injection hole. Staged pumping at 2 to 4 liters per minute at nominal pressures (1 to 2 gpm at <25 psi) resulted in the upward migration of PUR into the wall mass, similar to the manner in which PUR migrated through the rock mass at the Poudre Canyon site. However, once the lower wall voids were filled, PUR expansion due to high moisture in the wall created sufficient back-pressure to jack the wall out from the injection hole.
CHAPTER 5 – RETAINING WALL DEMONSTRATION PROJECT
36
Minor wall deformations were observed, and in one instance half-moon cracking developed at the top of the wall radiating several ft from the injection hole and parallel to the face. This prompted a different approach to injection management.
3. Small-diameter hollow injection jam-rods were then manually driven on intervening 1.5-m (5-ft) centers, within 0.9 m (3 ft) of the wall face, and to a depth of approximately mid-wall-height. PUR injection proceeded as before, with steady, small volumes injected over the course of several minutes. PUR flowed down through the wall mass, first appearing in the face at the wall foundation. Continued pumping filled the back of the wall to the estimated rod tip depth, at which time pumping was stopped to avoid over-pressuring the wall. This approach allowed fast insertion of the injection rods (approximately 5 minutes each), delivered PUR to targeted zones within the wall, and allowed for better injection pressure management in the wet conditions.
4. The upper 0.9 to 1.2 m (3 to 5 ft) of wall was then injected by simply hand-placing an injection rod within the openings between capstones. PUR flowed downward several ft before setting and causing subsequent pumping to flow out the face. This work was done one day later when the upper facing stones were mostly dry, so very little resin foaming occurred. Visual inspection indicated that the dense resin actually coated the interior rock surfaces and rock-on-rock contact points, rather than fill the open voids. This method resulted in minor overruns through the face that were removed.
5. Injection directly into the face was also evaluated using a short 450 mm (18 in) injection “wand”. This method can very quickly inject resin throughout the wall mass, but resulted in significant face drips and overruns as the injection gun was moved from one placement to the next. Improvements to the injection tooling could overcome much of this problem
6. Over the course of three days, 18 m (60 ft) of wall, averaging 2.7 m (9 ft) in height was injected with 1,800 kg (4,000 lb) of PUR. It is estimated that approximately 57 m3 (2,000 ft3) of wall structure was treated. Of this volume, approximately 11 m3 (400 ft3) was estimated to be open void space within the backfill and behind the dry-stack boulders. In addition approximately 1.7 m3 (60 ft3) of non-foamed resin was injected, likely filling approximately 20 to 25% volume of open void space within the wall. Note, in a classical soil context, we are not referring to soil void ratios. The open void space is not to be confused with soil void space which is a ratio of volume of voids to volume of solids within a soil matrix. The PUR product does not readily permeate moist soils like a cement grout which migrates within the soil matrix. The PUR will typically foam and seal off in the presence of any moisture, but will migrate through the open void pathways within the dry-stack boulders.
7. Core drilling confirmed PUR void filling in the back of the wall. Follow-up geophysical investigations, including 3-D seismic tomography and ground penetrating radar (GPR) surveys before and after PUR injection, were also conducted. Although GPR proved unsuccessful in delineating PUR ground improvements, seismic tomography was able to detect significant increases in wall velocity, suggesting improved cohesion within the wall rock mass. Results of the seismic investigations are provided in Appendix C.
8. Wall cleanup required vigilance during resin injection to quickly locate and remove PUR overruns, to the extent possible. The hard, non-foamed resin could be seen as drips, runs and small area coatings over a significant portion of the wall face. It is anticipated that this material will eventually weather away due to the strong southern exposure of the wall face and UV susceptibility of PUR. The foamed PUR was easier to remove, but left a
CHAPTER 5 – RETAINING WALL DEMONSTRATION PROJECT
37
visual impact along the wall where it fully filled face voids. Overall, the PUR overruns are only visible when standing directly in front of the wall. No signs of the injection program were visible from below the wall along the Rio Grande River or from nearby pedestrian access points.
9. Based on the lessons learned during the demonstration, this section of wall could have been treated in less than two days – with work progressing at about 1.5 m/hr (5 ft/hr). The total cost of the project, less traffic control provided by CDOT Maintenance, was $32,000, or about $18/kg ($7 to $8/lb) of installed PUR.
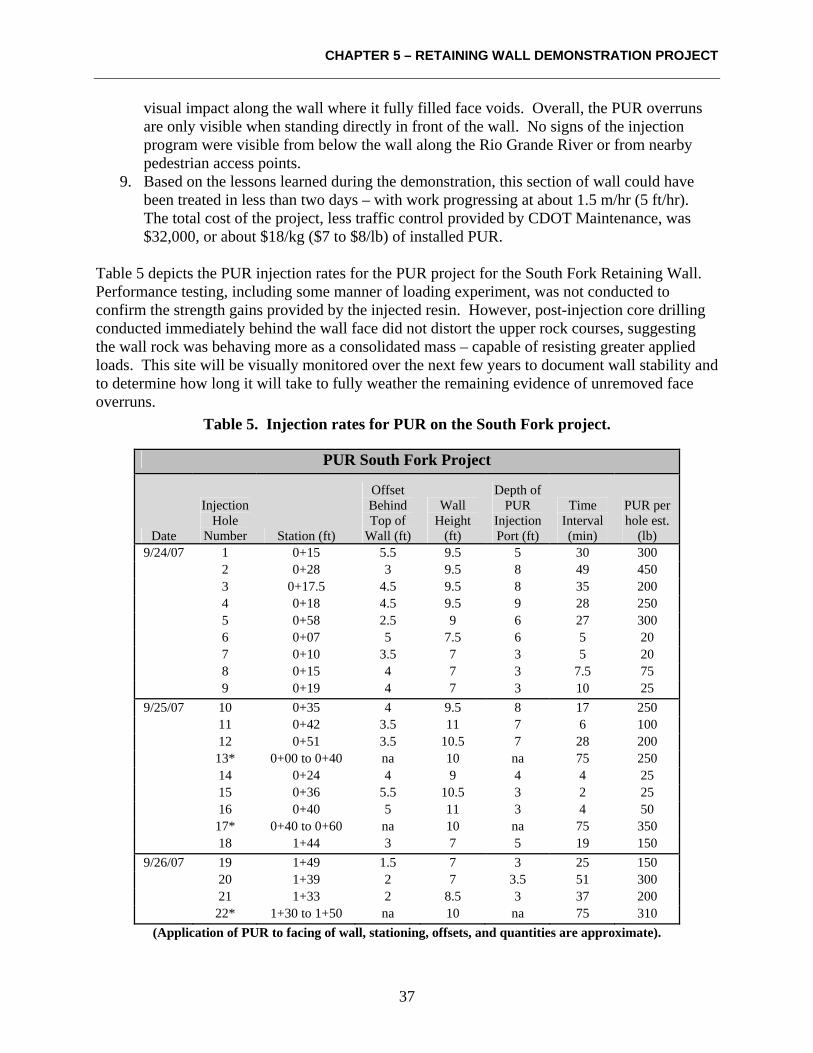
Table 5 depicts the PUR injection rates for the PUR project for the South Fork Retaining Wall. Performance testing, including some manner of loading experiment, was not conducted to confirm the strength gains provided by the injected resin. However, post-injection core drilling conducted immediately behind the wall face did not distort the upper rock courses, suggesting the wall rock was behaving more as a consolidated mass – capable of resisting greater applied loads. This site will be visually monitored over the next few years to document wall stability and to determine how long it will take to fully weather the remaining evidence of unremoved face overruns.
Table 5. Injection rates for PUR on the South Fork project.
PUR South Fork Project
Date
Injection Hole
Number Station (ft)
Offset Behind Top of
Wall (ft)
Wall Height
(ft)
Depth of PUR
Injection Port (ft)
Time Interval (min)
PUR per hole est.
(lb) 9/24/07 1 0+15 5.5 9.5 5 30 300
2 0+28 3 9.5 8 49 450 3 0+17.5 4.5 9.5 8 35 200 4 0+18 4.5 9.5 9 28 250 5 0+58 2.5 9 6 27 300 6 0+07 5 7.5 6 5 20 7 0+10 3.5 7 3 5 20 8 0+15 4 7 3 7.5 75 9 0+19 4 7 3 10 25
9/25/07 10 0+35 4 9.5 8 17 250 11 0+42 3.5 11 7 6 100 12 0+51 3.5 10.5 7 28 200 13* 0+00 to 0+40 na 10 na 75 250 14 0+24 4 9 4 4 25 15 0+36 5.5 10.5 3 2 25 16 0+40 5 11 3 4 50 17* 0+40 to 0+60 na 10 na 75 350 18 1+44 3 7 5 19 150
9/26/07 19 1+49 1.5 7 3 25 150 20 1+39 2 7 3.5 51 300 21 1+33 2 8.5 3 37 200 22* 1+30 to 1+50 na 10 na 75 310
(Application of PUR to facing of wall, stationing, offsets, and quantities are approximate).

CHAPTER 6 – CONCLUSIONS AND RECOMMENDATIONS
39
CHAPTER 6 – CONCLUSIONS AND RECOMMENDATIONS Based on the results of the three case studies using PUR product for stabilization of rock slopes and dry-stack walls, the following should be considered when designing the PUR mitigation system:
• Applicability of PUR for the Site Conditions • Preliminary PUR Volume Estimation • PUR Product Requirements • PUR Placement Considerations • Site Monitoring Considerations • Clean Up and Disposal Requirements
APPLICABILITY OF PUR FOR THE SITE CONDITIONS
Rock Mass Stabilization The case studies involved injecting PUR product into a rock mass with open fracture apertures larger than approximately 2 mm (1/8 in). The PUR product migrated into fractures and fracture orientations that were interconnected and resin flowed from one set of fractures into adjacent fractured sets. The rock mass joint and fracture sets varied from 0.5 to 3 m (1.5 to 9 ft) apart. PUR product was visibly flowing out from the joint sets at distances in excess of 1.5 m (5 ft) adjacent to the point of injection. The two case studies in this report focused on rock mass stabilization in hard metamorphic gneisses and schists; however, based on extensive use in underground coal mining applications, PUR is also applicable in bedded, jointed sedimentary formations. It should be noted that if the joint sets are not interconnected PUR placement volumes and uniform dispersion through the rock mass may decrease significantly resulting in unsatisfactory stabilization of the rock mass. Due to the nature of the work, crane baskets or man-lifts were necessary to access the rockslopes, requiring traffic control during construction on roadway projects. Man-lifts are typically limited to approximately 30 m (100 ft) above the roadway section. Cranes could also be used for the installation of PUR product; however, it may not be cost effective to mobilize a large crane to a remote site and may require roadway closures to reach sections that cannot be accessed with man-lifts significantly impacting traffic. Until PUR is more fully evaluated for the mitigation of unstable rock slopes, PUR is not recommended to replace tensioned or non-tensioned rock bolting. However, PUR can be effectively used to optimize required bolting, and may mitigate the need for other types of surface treatments (for example, plates, straps, and mesh). If only a small percentage of PUR is successfully injected into a fracture plane, it will substantially increase the cohesion between the opposing sides of the fracture. For example, it can be shown that an increase in 1 kPa (20 psf) will dramatically increase the overall factor of safety of the joint set.
CHAPTER 6 – CONCLUSIONS AND RECOMMENDATIONS
40
Visually the PUR product may blend into the rock background depending on the rock type. If aesthetics are important, it will be imperative to remove product overruns during placement to minimize the effort required to peel it off the rock face. Fully hardened PUR product can be chipped from the rock face, but requires greater effort. Removal of exposed PUR product immediately after injection facilitates the removal process.
Dry-stack Wall Stabilization Based on the successful outcome of the case study for the dry-stack wall stabilization, the PUR product was injected behind a failing wall system with soft, open-voided sections. The PUR product provided the following advantages to cement grouts by providing:
• Greater viscosity which limited product migration keeping product behind the wall system and out of the nearby sensitive areas.
• Provided very fast adhesion between the dry-stack boulders. • Provided greater tensile strength to the wall system that would not have been achievable
with cement based grouts. The PUR product in the case study migrated behind the dry-stack walls since the materials behind the walls were very loose to loose with open-void sections behind the boulder facing which made it possible to insert small diameter jam-rods behind the wall sections. Tight or very dense materials behind dry-stack walls may have required other methods of placing the injection ports behind the wall such as mechanical drilling (i.e. core or auger) to create ports in which to inject the product. The case study had easy access to the wall structure in order to inject the PUR product from a central point. Long pumping distances were not required in the case studies. Long pumping distances may affect the temperature of the component products causing accelerated or reduced set times depending on the ambient temperature and heating or cooling of the delivery hoses.
PRELIMINARY PUR VOLUME ESTIMATION As discussed in this report, the presence or absence of moisture will greatly affect the strength, viscosity and foaming aspects of the PUR product. Pre-injection volume estimation is difficult. Dry conditions will require more PUR product to be placed and will result in a greater bonding and strength set-up, but may require a more labor intensive effort to clean-up material overruns. Wet conditions will require less PUR product to be placed, since the material will foam in the presence of water and may migrate much shorter distances. Clean-up will be much easier with a foamed or slightly foamed product.
Rock Mass Stabilization Based on the case studies in fractured rock applications, which were drilled to depths ranging from 2.5 to 3.6 m (8 to 12 ft), approximately 450 kg (1,000 lb) of product was injected per day. As a daily average based on the two field demonstration sites, the amount of PUR injected per hole ranged from 22 to 450 kg (50 lb to 1000 lb) and the time of injection ranged from 20 to 60
CHAPTER 6 – CONCLUSIONS AND RECOMMENDATIONS
41
minutes. At the Poudre Canyon Site, approximately 80 m2 (850 ft2) of portal area was treated to an estimated average depth of 3 m (10 ft), for a total approximate PUR grouted rock volume of 240 m3 (8,500 ft3), however, it is was not possible to determine the total depth that the product actually migrated. The preceding volume estimations are provided as a general observation of the case study. It was determined that a measurable volume of PUR product was injected into a fracture pathway which will qualitatively increase the stability of the rock mass, but it was not possible to determine the exact extent of the product migration or the quantitative increase in factor of safety. The case studies for the rock mass stabilization were generally moist to dry. Foaming was observed at each location, but the majority of the product placement occurred in dry fracture pathways. If wet or very moist conditions were encountered the volume placement of product would be estimated to be half or even one quarter of what was placed under dry conditions.
Dry-stack Wall Stabilization Based on the case study for placement of PUR product in the dry-stack wall, where injection portals could be hand driven, approximately 900 kg (2,000 lb) of PUR was injected daily. The amount of PUR injected per hole ranged from 22 to 225 kg (50 lb to 500 lb), with injection times ranging from 20 to 60 minutes. Approximately 135 kg (300 lb) of PUR product per injection hole/jam-rod installation was observed for the dry-stack wall. Over the course of three days, 18 m (60 ft) of wall, averaging 2.7 m (9 ft) in height was injected with 1,800 kg (4,000 lb) of PUR. It is estimated that approximately 57 m3 (2,000 ft3) of wall structure was treated, and of this volume, approximately 11 m3 (400 ft3) was estimated to be open voids within the backfill and behind the dry-stack boulders. In addition approximately 1.7 m3 (60 ft3) of non-foamed resin was injected, likely filling approximately 20% to 25% volume of open void space within the wall. Note, in a classical soil context, the open void space is not to be confused with soil void space which is a ratio of volume of voids to volume of solids within a soil matrix. The PUR product does not readily permeate moist soils like a cement grout which migrates within the soil matrix. The PUR will typically foam and seal off in the presence of any moisture, but will migrate through the open void pathways behind the dry-stack boulders. The case study for the dry-stack stabilization started in very moist conditions after several days of heavy precipitation, but then continued through a period of dryness. Extensive foaming occurred initially since the PUR product was coming into contact with soil moisture, but then as the subsurface dried out, foaming ceased and non-foaming PUR product was migrating from the wall face. Due to the presence of large open-space features within and behind the wall facing, the PUR placed volumes were not significantly governed by the moisture content of the soil. It was possible to place product that foamed or did not foam since the product could find large pathways to migrate and was generally not confined to a particular pathway as with the rock mass case studies. The main aspect that did govern product placement was the potential to move and outwardly deflect the wall system.
CHAPTER 6 – CONCLUSIONS AND RECOMMENDATIONS
42
PUR PRODUCT REQUIREMENTS A special contract requirement (SCR) specification has been provided in Appendix A. This specification was developed as a general guideline for referencing PUR products for rock mass and dry-stack wall stabilization. Overall, the PUR product is sensitive to water and temperature. Water will reduce the strength of the product and create foaming and reduce volume takes, but will still be greater than the in-situ rock mass strengths or cohesions. Low or high temperatures outside the working range of the particular product may render the product difficult to use, since it will not be possible to inject the product due to rapid set times (hot temperatures) or poor mixing and slow set times (cold temperatures).
PUR PLACEMENT CONSIDERATIONS
Rock Mass Stabilization Planning the efficient progression of work is essential to a successful installation. On rock slopes, work should progress from the bottom up. This ensures that staged pumping is always working against a well-filled and mostly sealed volume of rock as the PUR migrates upward through the rock mass. Drill holes should be located to intersect rock fractures to maximize the injection potential of the PUR product. The orientation, persistence, aperture and condition of the fractures and joints should be considered prior to PUR injection to maximize rock mass stabilization. Drilling and PUR injection should be conducted sequentially – completing resin injection immediately following drilling before moving to the next drilling/injection location. The contractor may elect to pre-drill several holes prior to injection operations; however, this practice risks premature sealing of open holes adjacent to injection operations if holes are spaced too closely together. In highly fractured rock masses, or rock units with persistent jointing, it is prudent to drill and then inject PUR sequentially to accommodate unexpected resin migration patterns within the injection plan. Although not observed during the demonstration projects described in this manual, the potential for complete rock mass sealing in wet or periodically wet environments should be considered when planning PUR injection operations. At the demonstration sites, observations indicate that sufficient jointing and fracturing remained open following resin injection to allow for the dissipation of groundwater pressures during seasonal runoff. However, consideration should be given to the installation of permanent drainage (e.g., horizontal drains, weep holes) in areas particularly susceptible to hydrostatic pressures.
Dry-stack Wall Stabilization For rock retaining structures, it is recommended to treat the top of the wall first to stabilize loose, unconfined blocks before proceeding with interior wall injection. Injection rods placed several ft behind the wall face, on approximate 1.5-m (5-ft) centers along the wall, and to within 1.5 m (5 ft) of the bottom of the wall, should then be injected, taking care not to create conditions within the wall where expanding resin is pressuring against prior sealed sections of the structure. Direct
CHAPTER 6 – CONCLUSIONS AND RECOMMENDATIONS
43
face injection can be done to stabilize facing rock. Drilling was not required for PUR applications based on the demonstration at South Fork. The jam-rod technology was sufficient for effective PUR delivery behind and within the wall mass.
SITE MONITORING CONSIDERATIONS Controlling pressure and volume is critical to a successful project outcome. Too much pressure or too much quantity at once may topple a dry-stack wall or peel an unstable rock flake off a rock slope. Staged pumping of relatively small volumes of PUR at very low pump pressures appears to work well for the progressive stabilization of both rock and retaining structures. Higher volume, high-pressure pumping should be limited to the mining industry where isolated rock failure during injection (intentional hydrofracturing of the rock mass) can be tolerated. Staged pumping, coupled with fast set times, ensures that loads from hydrostatic injection pressures are isolated and of short duration. Based on the case studies, pumping pressures should be closely monitored during installation, as pressures more than 1,800 kPa (250 psi) would likely have initiated movement within the rock mass. In the case studies, pumping pressures were kept to a minimum to minimize rock displacement. Monitoring for either the dry-stack walls or rock slopes typically relies on continual visual inspection, but may employ simple “tell-tales” consisting of rocks or wedges placed in fractures and discontinuities that can quickly indicate potentially adverse rock mass displacements during PUR injection. More elaborate systems, such as crackmeters and extensometers, could also be used on projects particularly sensitive to rock mass or wall displacements. There does not appear to be a need for drainage pipe installation when treating porous retaining walls. PUR coverage is neither continuous within the wall mass or sufficient to fill entire voids for either dry-stack walls or rock slopes. Although only a fraction of the existing open void space may be filled, the strength increase achieved by bonding wall elements together and/or consolidating wet sections with foaming PUR appears to greatly enhance wall stability.
CLEAN UP AND DISPOSAL REQUIREMENTS The majority of the cleanup effort should be done within 1 to 2 minutes of PUR overrun, before early set. Hand tools are effective at chipping and peeling drips and runs from rock surfaces, but cannot remove all of the resin overrun. The PUR RokLok product was dark brown and blended well with most surfaces, making it difficult to see from more than 3 to 5 m (10 to 15 ft) away. The foaming product is a much lighter color, and may be readily visible from a short distance against darker rock units. Fortunately, foamed PUR is much easier to remove than dense, non-foamed PUR, limiting its visibility on most projects.

APPENDIX A – SPECIAL CONTRACT REQUIREMENTS
45
APPENDIX A – SPECIAL CONTRACT REQUIREMENTS The following is a guide specification to be used for polyurethane resin injection (PUR) projects and should be modified, as necessary, to meet the specifics of each individual project. The Section and Subsection numbers shown below refer to FLH’s Standard Specifications for Construction of Roads and Bridges on Federal Highway Projects, FP-03.
Section XXX. – POLYURETHANE RESIN INJECTION (PUR)
Description
XXX.01 This work consists of furnishing and injecting polyurethane resin (PUR) for the purpose of stabilizing, consolidating, and strengthening fractured and jointed rock masses and masoned and placed-stone earth retaining structures.
Material
XXX.02 Conform to the following Subsection:
Polyurethane Resin (PUR) 725.XX
Construction Requirements
XXX.03 Qualifications. Submit the following at least 30 days before the start of PUR injection operations:
(a) Submit Contractor or subcontractor references citing satisfactory completion of at least 3 PUR injection projects of similar scope and complexity within the last 3 years. Submit a brief description of each project including the owning agency's name, a contact at the owning agency, and current telephone number.
(b) Provide an on-site supervisor and drill operators with at least 2 years experience with injecting PUR products on projects of similar scope and complexity. Identify on-site supervisors and drill operators assigned to the project and submit a summary of each individual's experience.
XXX.04 Submittals. Submit the following at least 30 days before the start of PUR injection operations:
(a) Product information. (1) Product description; including whether the PUR product is a single- or two-
component system, what the components are and their exact mix ratios, and whether the injected PUR product is a non- to mildly-foaming hydrophobic product or a highly-foaming hydrophilic product (with approximate expansion ratios in the presence of water). Provide product information sheets and Material Safety Data Sheets (MSDS) for PUR components.
APPENDIX A – SPECIAL CONTRACT REQUIREMENTS
46
(2) Initial and final set times. (3) Water absorption. (4) Average cured density (under dry injection conditions). (5) Maximum percent volume expansion in presence of water. (6) Compressive strength. (7) Tensile strength. (8) Shear strength. (9) Viscosity. (10) Elongation. (11) Flash point. (12) Manufacturer’s recommended air and rock mass injection temperature range. (13) Toxicity rating when cured.
(b) Product samples. Provide cured samples of product to be injected. The CO will determine at the pre-construction meeting if sampling and testing during progression of PUR injection are necessary. (c) Drilling and site access equipment. Provide a description of the drilling equipment to be used, including power and operating requirements, approximate dimensions of the drill rig, and range of hole sizes and depths to be drilled. Provide a description of ancillary equipment to be used to access the site, including lifts and cranes. Describe temporary ground support measures that may be required during drilling, initial PUR injection, or both.
(d) Injection equipment. Provide a description of the pumping system, power requirements, operating pressure ranges, PUR component conveyance system, PUR quantity and injection pressure measurement systems, component mixing system, and injection nozzle/packer assemblies and installation. (e) Injection plan. Provide the approximate number, spacing and depths of holes to be drilled, and describe the general progression of work. Provide an estimate of the quantity of PUR take for each hole. Provide a description of rock mass monitoring methods and procedures to be used during PUR injection. (f) Traffic control. Provide a proposed traffic control plan, per Section 635 Temporary Traffic Control, for both drilling and PUR injection operations. Include provisions for minimizing PUR drips onto vehicles and nearby structures. (g) Site cleanup. Describe the methods and equipment to be used to remove PUR overruns from rock surfaces, including the estimated time interval between injection and when cleanup is to be initiated. Describe the expected degree or percent to which overruns can be successfully removed with these methods. Describe waste disposal requirements.
XXX.05 Storing and Handling. Handle and store PUR according to the manufacturer’s recommendations to avoid extreme temperature variations, reduce the potential for spillage,
APPENDIX A – SPECIAL CONTRACT REQUIREMENTS
47
mitigate vapors and fumes in confined transportation vehicles or enclosures, and protect against fire hazards. Provide required cleanup equipment and resources to quickly respond to PUR component spills.
XXX.06 Injection Operations. Inject PUR according to the accepted injection plan and manufacturer’s recommendations. The Contractor’s means, methods and experience may suggest deviations from the general procedures presented here. Such deviations will be reviewed and approved by the CO.
Drill injection holes either in a pre-determined pattern, as shown on the plans, and/or at spot locations selected as work progresses to effectively grout the designated rock mass and confine and manage PUR volumes. Drill injection holes using dry-drilling techniques only.
Systematically inject PUR into the holes at depths, locations, and rates determined by the Contractor to optimize PUR take within the ground mass while mitigating the potential for displacing rock or creating instability within the rock mass. Begin resin injection in the lowermost holes, progressively working upward through the rock or structure mass unless conditions dictate optimal grout take through other approaches. Estimate maximum injection pressures, PUR quantities, and injection rates based on a visual site review and communicate with the CO prior to injection operations; adjust and communicate with the CO during installation as conditions warrant. The Contractor may choose to temporarily plug the exterior traces of openings and fractures to prevent premature loss of PUR prior to initial set.
Maintain a daily record of hole diameter and depths, injection packer placement depths, average and maximum injection pressures, drilling and injection times per hole, quantities injected in each hole, and any occurrences of excessive overruns, ground deformations or failures, or unplanned formation of cracks.
Clean up and dispose of PUR overruns. Continue cleanup until product overruns have been sufficiently removed to no longer be acutely visible by normal pedestrian traffic. Seal drillholes with colored grout matching the surrounding rock mass
Conduct daily safety and work coordination meetings with project and traffic control personnel. Ensure that only trained and experienced Contractor PUR injection personnel are in the immediate work zone during drilling or PUR injection activities. Determine when it is safe for project personnel and the public to travel within the work zone. Suspend vehicle and personnel travel, when necessary, within the work zone during drilling and injection activities and until sufficient PUR set has been obtained such that there is no risk of drips or airborne strands damaging vehicle finishes.
XXX.07 Acceptance. Injection of polyurethane resin will be evaluated under Subsections 106.02 and 106.04. At the discretion of the CO, the Contractor may be required to demonstrate and test their proposed means and methods through a sacrificial injection hole.
Measurement XXX.08 Measure the Section XXX items listed in the bid schedule according to Subsection 109.02 and the following as applicable.
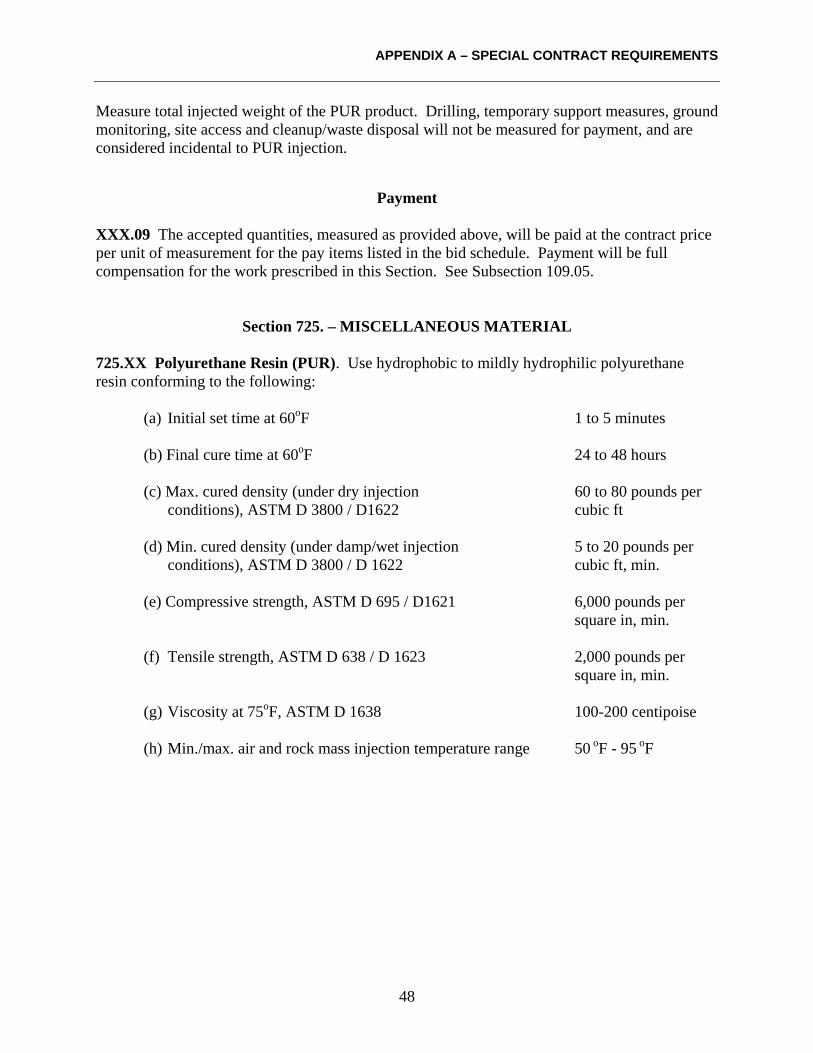
APPENDIX A – SPECIAL CONTRACT REQUIREMENTS
48
Measure total injected weight of the PUR product. Drilling, temporary support measures, ground monitoring, site access and cleanup/waste disposal will not be measured for payment, and are considered incidental to PUR injection.
Payment
XXX.09 The accepted quantities, measured as provided above, will be paid at the contract price per unit of measurement for the pay items listed in the bid schedule. Payment will be full compensation for the work prescribed in this Section. See Subsection 109.05.
Section 725. – MISCELLANEOUS MATERIAL 725.XX Polyurethane Resin (PUR). Use hydrophobic to mildly hydrophilic polyurethane resin conforming to the following:
(a) Initial set time at 60oF 1 to 5 minutes (b) Final cure time at 60oF 24 to 48 hours (c) Max. cured density (under dry injection 60 to 80 pounds per
conditions), ASTM D 3800 / D1622 cubic ft (d) Min. cured density (under damp/wet injection 5 to 20 pounds per
conditions), ASTM D 3800 / D 1622 cubic ft, min.
(e) Compressive strength, ASTM D 695 / D1621 6,000 pounds per square in, min.
(f) Tensile strength, ASTM D 638 / D 1623 2,000 pounds per
square in, min. (g) Viscosity at 75oF, ASTM D 1638 100-200 centipoise (h) Min./max. air and rock mass injection temperature range 50 oF - 95 oF
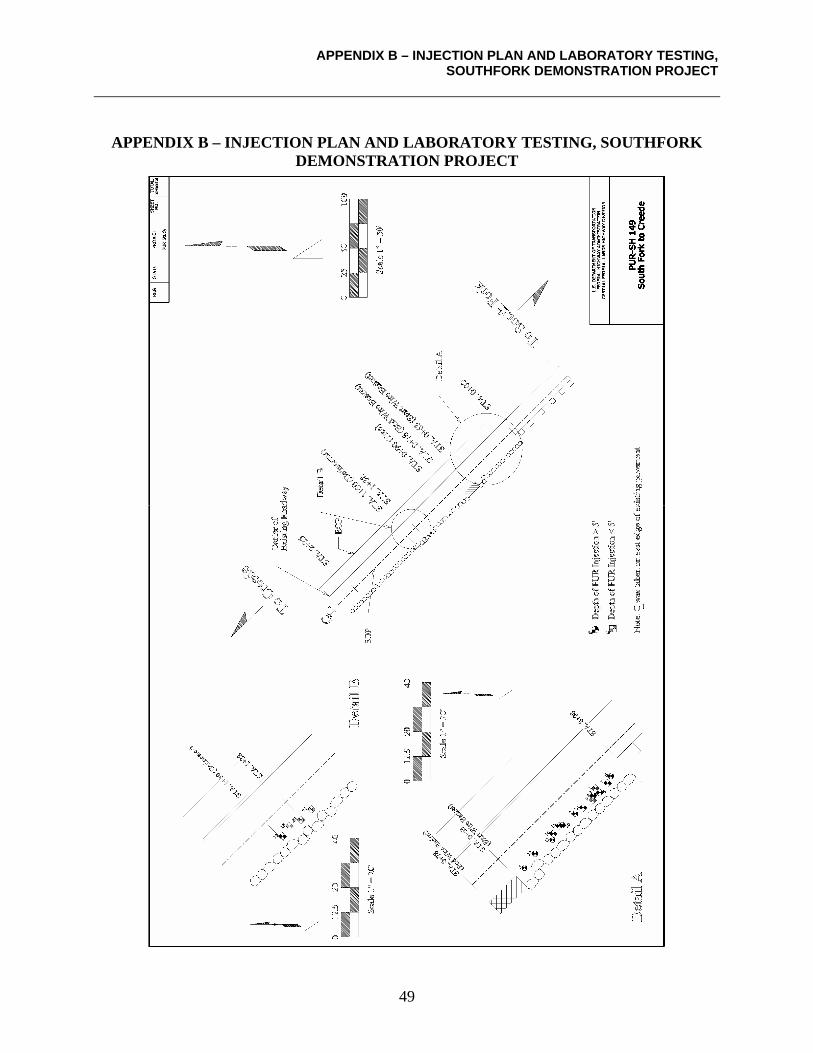
APPENDIX B – INJECTION PLAN AND LABORATORY TESTING, SOUTHFORK DEMONSTRATION PROJECT
49
APPENDIX B – INJECTION PLAN AND LABORATORY TESTING, SOUTHFORK DEMONSTRATION PROJECT
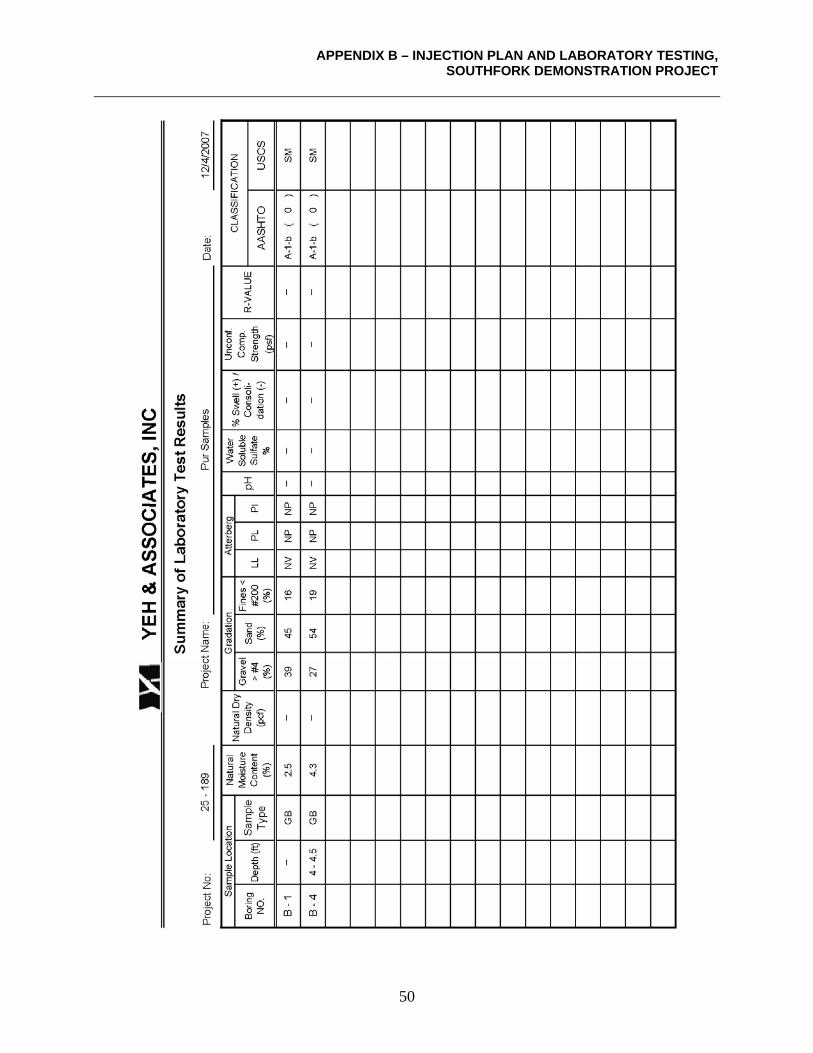
APPENDIX B – INJECTION PLAN AND LABORATORY TESTING, SOUTHFORK DEMONSTRATION PROJECT
50
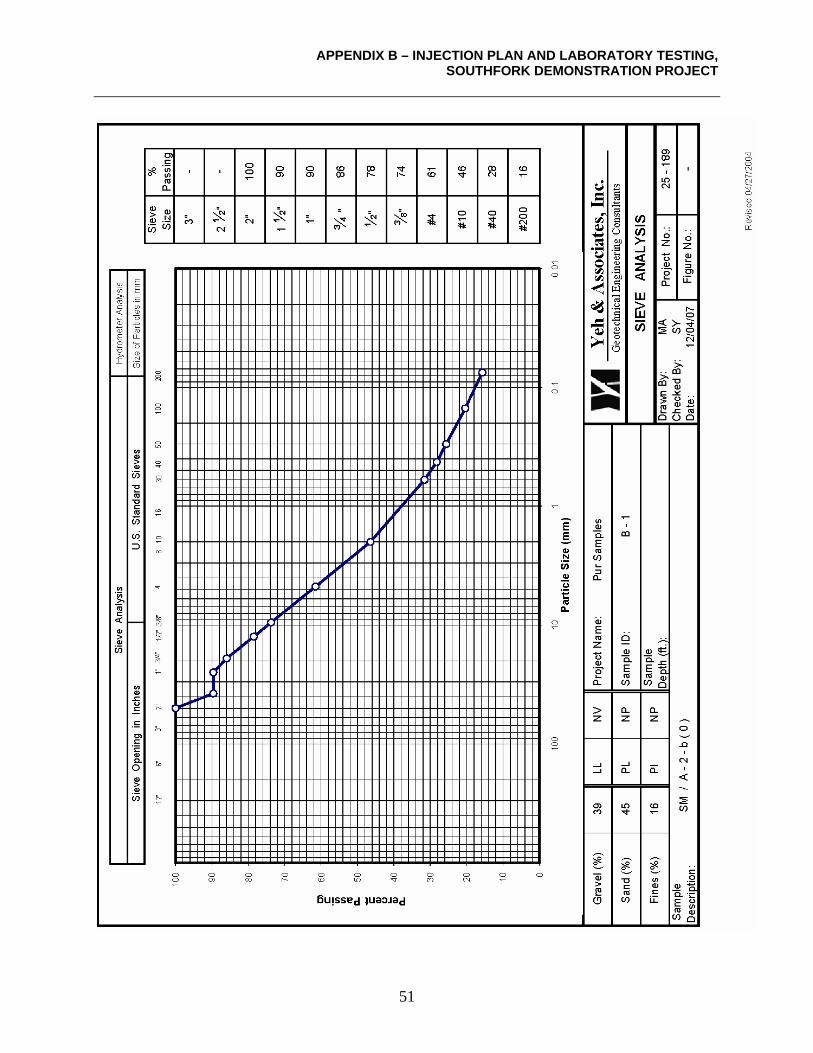
APPENDIX B – INJECTION PLAN AND LABORATORY TESTING, SOUTHFORK DEMONSTRATION PROJECT
51

APPENDIX C – DELINEATING PUR INJECTION WITH SURFACE REFRACTION TOMOGRAPHY
53
APPENDIX C – DELINEATING PUR INJECTION WITH SURFACE REFRACTION TOMOGRAPHY
“Surface Refraction Tomography (SRT)” is an analytical method for reconstructing subsurface properties using first arrival travel times of seismic energy propagating from surface-located sources through soil/rock materials to surface-mounted receivers. This method allows data from multiple conventional 2D seismic refraction surveys to be processed into one 3D assessment of subsurface conditions. Although somewhat labor intensive, running multiple 2D surveys for 3D volumetric ground imaging is considerably more economical than 3D data acquisition, using standard refraction sources and receivers. For the South Fork retaining wall investigation, the survey included the ground volume bounded by the roadway shoulder (retained wall fill) and retaining wall structure. Three geophone lines were established within the survey area:
(1) along the edge of the adjacent roadway approximately 3.7 m (12 ft) from the top edge of the wall, (2) along the roadway shoulder approximately 1.8 m (6 ft) from the top edge of the wall, and (3) approximately 0.6 m (2 ft) out from the toe of the wall. Each receiver line contained 24, 4.5 Hz, uniaxial plate-mounted geophones spaced on 1.5-m (5-ft) centers.
Four source lines were run for each geophone line:
(1) along the edge of the roadway approximately 3.7 m (12 ft) from the top edge of the wall, (2) along the roadway shoulder approximately 1.8 m (6 ft) from the top edge of the wall, (3) along the wall face approximately 1 m (3 ft) above the toe of the wall, and (4) approximately 0.6 m (2 ft) out from the toe of the wall.
Each line contained 12 source locations spaced on 3-m (10-ft) centers, generated by a 9.1 kg (20 lb) sledge hammer, totaling 48 sources distributed above, on and below the wall for each geophone line surveyed. A typical source/receiver layout is shown in Figure 26. The surveyed source/receiver array resulted in nearly 3,500 raypaths intersecting the wall structure and retained fill – an adequate coverage within the limits of the investigation. Each source/receiver pair was mapped to the corresponding seismic signal collected with a Geometrics StrataView seismograph and stored in SEG-2 format. The first arrival times were determined using the GAP-3D automated picking algorithm, developed by Summit Peak Technologies, Inc., Parker, CO. GAP-3D uses a multi-dimensional B-Spline Interpolation Network (BIN) which accounts for waveform shape, source/receiver distance, time, adjacent picks, and filter distortion when automatically determining first arrivals based on user-provided picking examples. This technique provides more consistent picks, is unaffected by fatigue or variations in manual picks, and is more customized to variations in field conditions and filter parameters than other static automatic pickers.
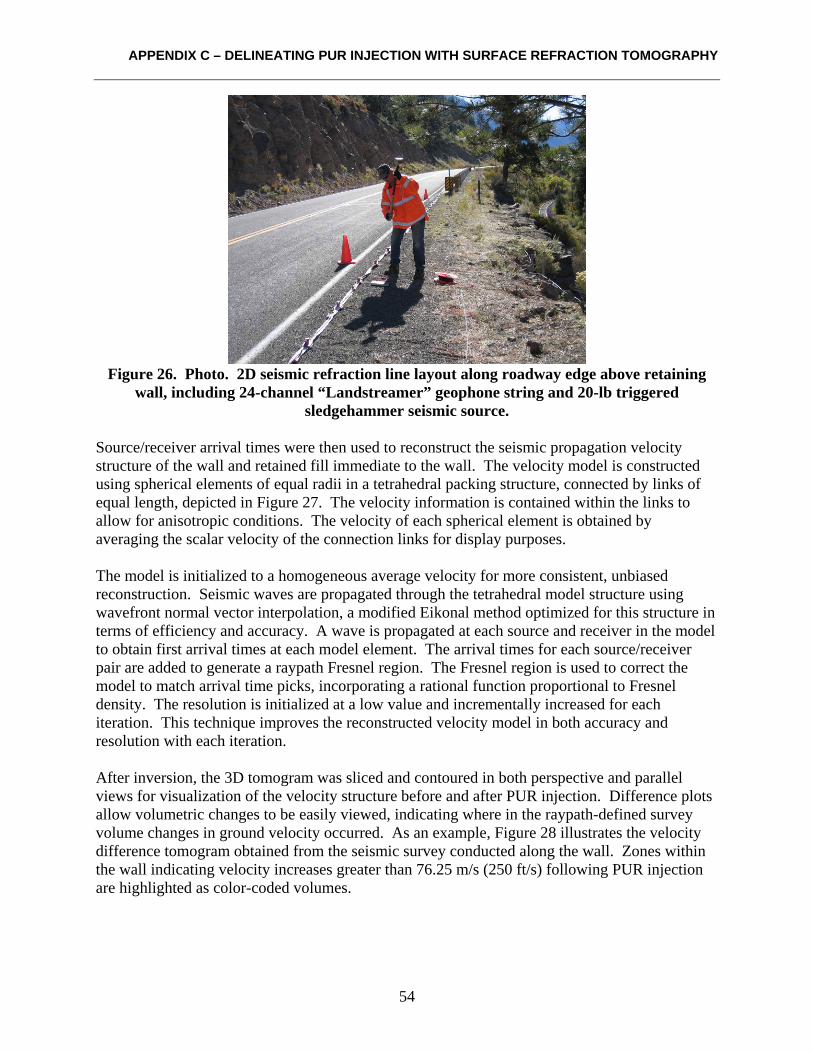
APPENDIX C – DELINEATING PUR INJECTION WITH SURFACE REFRACTION TOMOGRAPHY
54
Figure 26. Photo. 2D seismic refraction line layout along roadway edge above retaining
wall, including 24-channel “Landstreamer” geophone string and 20-lb triggered sledgehammer seismic source.
Source/receiver arrival times were then used to reconstruct the seismic propagation velocity structure of the wall and retained fill immediate to the wall. The velocity model is constructed using spherical elements of equal radii in a tetrahedral packing structure, connected by links of equal length, depicted in Figure 27. The velocity information is contained within the links to allow for anisotropic conditions. The velocity of each spherical element is obtained by averaging the scalar velocity of the connection links for display purposes. The model is initialized to a homogeneous average velocity for more consistent, unbiased reconstruction. Seismic waves are propagated through the tetrahedral model structure using wavefront normal vector interpolation, a modified Eikonal method optimized for this structure in terms of efficiency and accuracy. A wave is propagated at each source and receiver in the model to obtain first arrival times at each model element. The arrival times for each source/receiver pair are added to generate a raypath Fresnel region. The Fresnel region is used to correct the model to match arrival time picks, incorporating a rational function proportional to Fresnel density. The resolution is initialized at a low value and incrementally increased for each iteration. This technique improves the reconstructed velocity model in both accuracy and resolution with each iteration. After inversion, the 3D tomogram was sliced and contoured in both perspective and parallel views for visualization of the velocity structure before and after PUR injection. Difference plots allow volumetric changes to be easily viewed, indicating where in the raypath-defined survey volume changes in ground velocity occurred. As an example, Figure 28 illustrates the velocity difference tomogram obtained from the seismic survey conducted along the wall. Zones within the wall indicating velocity increases greater than 76.25 m/s (250 ft/s) following PUR injection are highlighted as color-coded volumes.
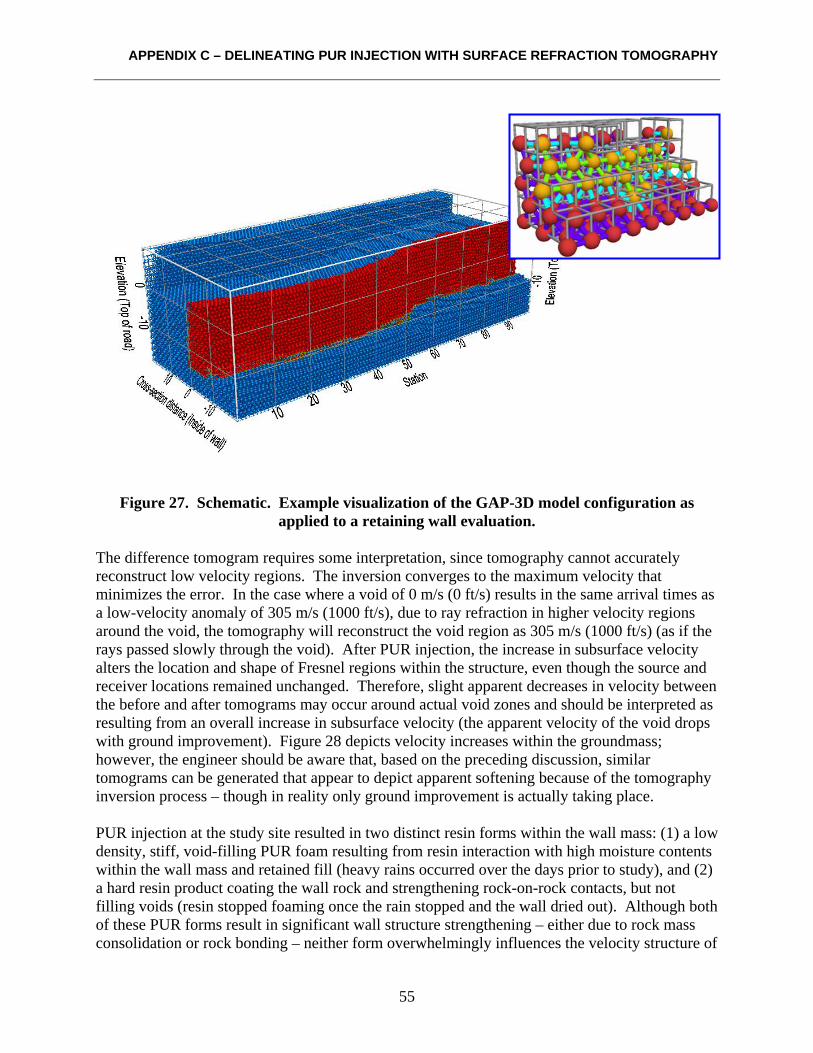
APPENDIX C – DELINEATING PUR INJECTION WITH SURFACE REFRACTION TOMOGRAPHY
55
Figure 27. Schematic. Example visualization of the GAP-3D model configuration as applied to a retaining wall evaluation.
The difference tomogram requires some interpretation, since tomography cannot accurately reconstruct low velocity regions. The inversion converges to the maximum velocity that minimizes the error. In the case where a void of 0 m/s (0 ft/s) results in the same arrival times as a low-velocity anomaly of 305 m/s (1000 ft/s), due to ray refraction in higher velocity regions around the void, the tomography will reconstruct the void region as 305 m/s (1000 ft/s) (as if the rays passed slowly through the void). After PUR injection, the increase in subsurface velocity alters the location and shape of Fresnel regions within the structure, even though the source and receiver locations remained unchanged. Therefore, slight apparent decreases in velocity between the before and after tomograms may occur around actual void zones and should be interpreted as resulting from an overall increase in subsurface velocity (the apparent velocity of the void drops with ground improvement). Figure 28 depicts velocity increases within the groundmass; however, the engineer should be aware that, based on the preceding discussion, similar tomograms can be generated that appear to depict apparent softening because of the tomography inversion process – though in reality only ground improvement is actually taking place. PUR injection at the study site resulted in two distinct resin forms within the wall mass: (1) a low density, stiff, void-filling PUR foam resulting from resin interaction with high moisture contents within the wall mass and retained fill (heavy rains occurred over the days prior to study), and (2) a hard resin product coating the wall rock and strengthening rock-on-rock contacts, but not filling voids (resin stopped foaming once the rain stopped and the wall dried out). Although both of these PUR forms result in significant wall structure strengthening – either due to rock mass consolidation or rock bonding – neither form overwhelmingly influences the velocity structure of
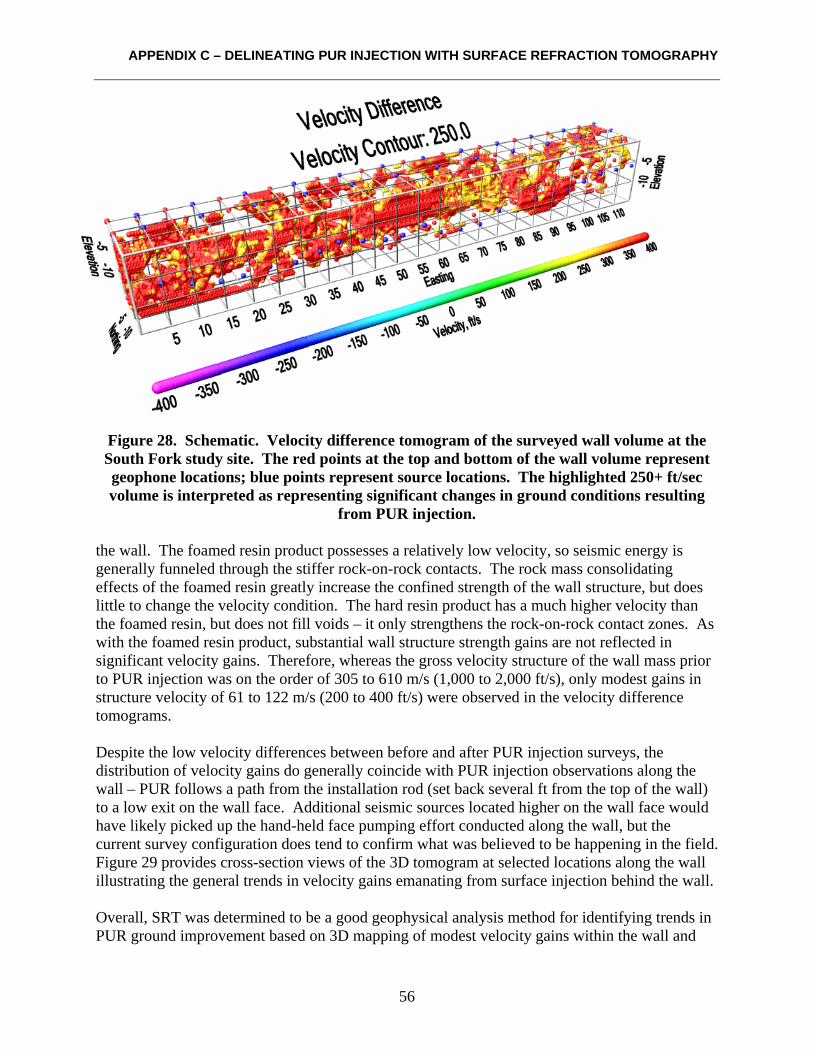
APPENDIX C – DELINEATING PUR INJECTION WITH SURFACE REFRACTION TOMOGRAPHY
56
Figure 28. Schematic. Velocity difference tomogram of the surveyed wall volume at the South Fork study site. The red points at the top and bottom of the wall volume represent geophone locations; blue points represent source locations. The highlighted 250+ ft/sec volume is interpreted as representing significant changes in ground conditions resulting
from PUR injection. the wall. The foamed resin product possesses a relatively low velocity, so seismic energy is generally funneled through the stiffer rock-on-rock contacts. The rock mass consolidating effects of the foamed resin greatly increase the confined strength of the wall structure, but does little to change the velocity condition. The hard resin product has a much higher velocity than the foamed resin, but does not fill voids – it only strengthens the rock-on-rock contact zones. As with the foamed resin product, substantial wall structure strength gains are not reflected in significant velocity gains. Therefore, whereas the gross velocity structure of the wall mass prior to PUR injection was on the order of 305 to 610 m/s (1,000 to 2,000 ft/s), only modest gains in structure velocity of 61 to 122 m/s (200 to 400 ft/s) were observed in the velocity difference tomograms. Despite the low velocity differences between before and after PUR injection surveys, the distribution of velocity gains do generally coincide with PUR injection observations along the wall – PUR follows a path from the installation rod (set back several ft from the top of the wall) to a low exit on the wall face. Additional seismic sources located higher on the wall face would have likely picked up the hand-held face pumping effort conducted along the wall, but the current survey configuration does tend to confirm what was believed to be happening in the field. Figure 29 provides cross-section views of the 3D tomogram at selected locations along the wall illustrating the general trends in velocity gains emanating from surface injection behind the wall. Overall, SRT was determined to be a good geophysical analysis method for identifying trends in PUR ground improvement based on 3D mapping of modest velocity gains within the wall and
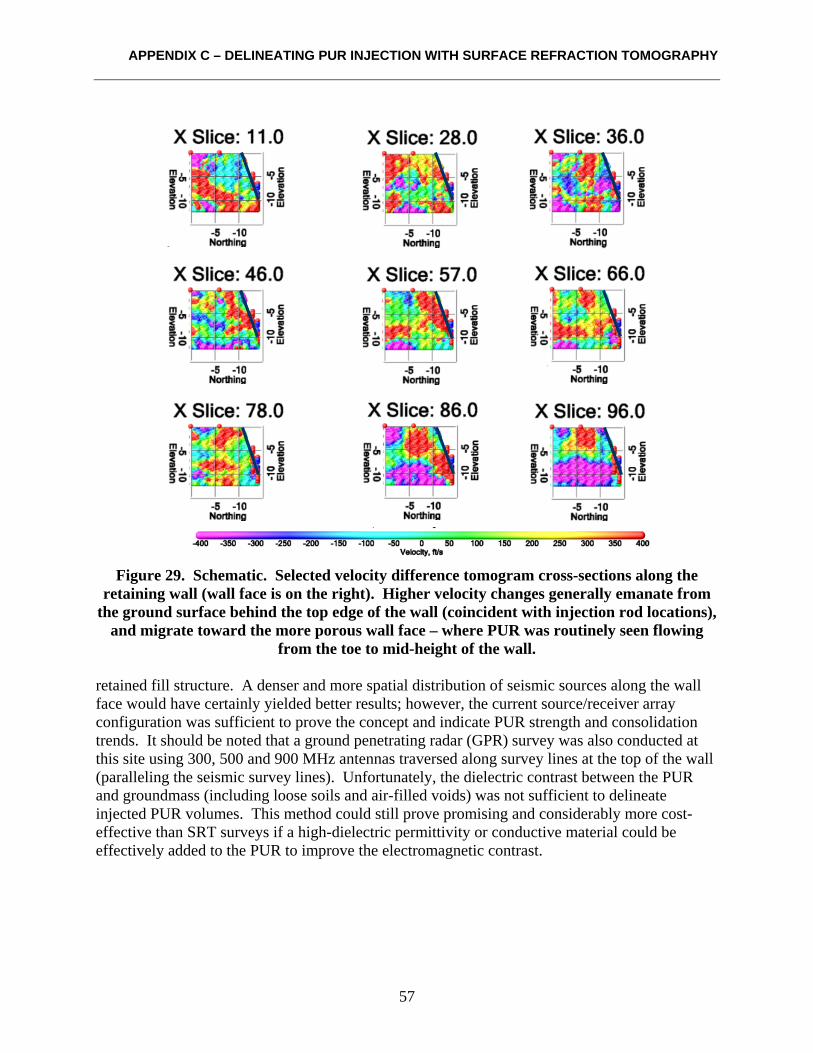
APPENDIX C – DELINEATING PUR INJECTION WITH SURFACE REFRACTION TOMOGRAPHY
57
Figure 29. Schematic. Selected velocity difference tomogram cross-sections along the
retaining wall (wall face is on the right). Higher velocity changes generally emanate from the ground surface behind the top edge of the wall (coincident with injection rod locations),
and migrate toward the more porous wall face – where PUR was routinely seen flowing from the toe to mid-height of the wall.
retained fill structure. A denser and more spatial distribution of seismic sources along the wall face would have certainly yielded better results; however, the current source/receiver array configuration was sufficient to prove the concept and indicate PUR strength and consolidation trends. It should be noted that a ground penetrating radar (GPR) survey was also conducted at this site using 300, 500 and 900 MHz antennas traversed along survey lines at the top of the wall (paralleling the seismic survey lines). Unfortunately, the dielectric contrast between the PUR and groundmass (including loose soils and air-filled voids) was not sufficient to delineate injected PUR volumes. This method could still prove promising and considerably more cost-effective than SRT surveys if a high-dielectric permittivity or conductive material could be effectively added to the PUR to improve the electromagnetic contrast.

GLOSSARY OF TERMS
59
GLOSSARY OF TERMS Cementitious Grout. Grout mixtures which contain cement and water, with or without aggregate, proportioned to produce a pourable consistency without segregation of the constituents; also a mixture of other composition, but of similar consistency. Chemical Grouts. Chemical grouts consist of many non-cement mixtures, including sodium silicate, acrylate, lignin, urethane, and resin. Epoxy Resins (EP). Multi-component liquid chemical converted to a solid when mixed with a curing agent. Resultant material is characterized by significant tensile, compressive and bond strengths. Epoxies are resins that, in the uncured form, contain one or more reactive epoxide or oxirane groups. These epoxide groups serve as cross-linking points in the subsequent curing step, in which the uncured epoxy is reacted with a curing agent or hardener. Cross-linking is accomplished through the epoxide groups, as well as through hydroxyl groups that may be present. Most conventional unmodified epoxy resins are produced from epichlorohydrin (chloropropylene oxide) and bisphenol A. The other types of epoxy resins are phenoxy resins, novolac resins, and cycloaliphatic resins. Typical epoxy resins are two-component mix systems and can be formulated with low to high viscosities. Grout. A substance that has sufficient fluidity to be injected or pumped into a porous body or into cracks, and is intended to harden in place (see “Cementitious Grout”, “Chemical Grout”). Grouting. A process of injecting, filling, and/or displacing a volume with grout. Ground Improvement/Stabilization. Any method used to increase the shear strength properties of subsurface materials. Hydrophobic. A material that repels or displaces water. Hydrophilic. A material that can interact with and absorb water. Hydrophilic Gels. Moisture sensitive polyurethanes that may shrink or crack if subjected to a dry environment. Not applicable to situations when subsurface or injected area may completely dry out. Typically material is low in viscosity and penetrates most soils. Injection Ports. Injection ports can consist of a surface port which is placed or driven into a hole (for low pressure injection) or a mechanical packer (for high pressure injection). Polymer. A chemical mix created by reacting two or more monomers. The resultant large-molecule substances include epoxy, polyester, nylon, acrylic, polyurethane, and others. Polymer Grout. A solution injected into a porous body or a crack that reacts in place to form a gel, foam or solid. Examples include mixtures of polyurethanes and epoxy resins.

GLOSSARY OF TERMS
60
Polyurethane (PU). Polyurethanes are extremely versatile plastics in terms of the forms in which they are available: flexible or rigid foams, solid elastomers (or rubbers), coatings, adhesives and sealants. Their versatility also extends to chemical structure in that, although the urethanes are generally considered thermosets, there are grades of urethane elastomers that are thermoplastic in nature and are supplied in pellet form for molding, calendering and extrusion. Like all urethanes, the foams are prepared by first reacting two liquid components - polyols and isocyanates. In the form of elastomers, polyurethanes offer abrasion resistance and toughness. The commonly used isocyanates for manufacturing polyurethanes are toluene diisocyanate, methylene diphenyl isocyanate, and polymeric isocyanates, obtained by the phosgenation of polyamines derived from the condensation of aniline with formaldehyde. Polyols (with hydroxyl groups) are macroglycols, which are either polyester or polyether based. Polyurethane elastomers and resins take the form of liquid castings systems, thermoplastic elastomers and resins, microcellular products, and millible gums. Polyurethane Resin (PUR). In a review of the recent literature, it is sometimes difficult to distinguish polyurethane (PU) products from polyurethane resin (PUR) products. Typically, PU products can be injected as either a one-stage or two-stage component mixing process and may or may not have a resin component. PUR products are typically considered a two-stage component mixing process and generally have a resin component. In general, PUR is considered a higher strength injection grout used for rock stabilization. PU single stage grouts are generally lower in strength and are considered more as a water sealant (especially for hydrophilic type grouts) than a stabilization product. Resin. Any of a class of amorphous solids or semi-solids. Although generally a naturally occurring substance, PUR is a manufactured product. Rigid Cellular Plastics. Typically these are plastic foams, but some literature refers to PUR with this term as well. Sodium Silicate. The most commonly used chemical grouts are sodium silicate based. Sodium silicates have been developed into a variety of different grout systems, and are based on reacting a silicate solution to form a gel that binds soil or sediment particles together and fills voids. Thixotropic. Property of a material that is a gel at rest, becoming fluid when agitated.
REFERENCES
61
REFERENCES (1) Archibald, J.F., and Katsabanis, P.T., 2003, Comparative Evaluation of Shotcrete, Fibrecrete
and Thin, Spray-on Polymer Liners for Blast Damage Mitigation. Presented at the 105th Annual General Meeting of the Canadian Institute Mining, Metallurgy and Petroleum, Montreal, Quebec, May, 2003.
(2) Archibald, J.F., 2003, Effectiveness of Conventional Support Systems and Polymer Spray-on
Liners for Reducing Hazards Associated with Rockbursting. Presented at the Mining Health and Safety Conference 2003, Sudbury, Ontario, April, 2003.
(3) Molinda, G.M., 2004, Evaluation of Polyurethane Injection for Beltway Roof Stabilization in
a West Virginia Coal Mine, National Institute for Occupational Safety and Health, (4) Australian Coal Research (ACARP), Cost Effective Use Of PUR And Optimizing Large-
Scale Injected Strata Reinforcement, August 2003, Report No: 00-180-ACR, STRATA Engineering (Australia) Pty Ltd.
(5) Australian Coal Research (ACARP), Underground Monitoring of Roadway Roof Behaviour
in Relation to the Use of Highwall Mining Techniques for Initial Punch Mine Entry Development, October 2000, Report No: 98-160-ACR, STRATA Engineering (Australia) Pty Ltd.
(6) Alan Rock, President, Summit Peak Technologies LLC, Parker, CO.

BIBLIOGRAPHY
63
BIBLIOGRAPHY Archibald, J.F., and Katsabanis, P.T., 2003, Comparative Evaluation of Shotcrete, Fibrecrete and Thin, Spray-on Polymer Liners for Blast Damage Mitigation. Presented at the 105th Annual General Meeting of the Canadian Institute Mining, Metallurgy and Petroleum, Montreal, Quebec, May, 2003. Archibald, J.F., 2003, Effectiveness of Conventional Support Systems and Polymer Spray-on Liners for Reducing Hazards Associated with Rockbursting. Presented at the Mining Health and Safety Conference 2003, Sudbury, Ontario, April, 2003. Australian Coal Research (ACARP), Cost Effective Use Of PUR And Optimizing Large-Scale Injected Strata Reinforcement, August 2003, Report No: 00-180-ACR, STRATA Engineering (Australia) Pty Ltd. Australian Coal Research (ACARP), Underground Monitoring of Roadway Roof Behaviour in Relation to the Use of Highwall Mining Techniques for Initial Punch Mine Entry Development, October 2000, Report No: 98-160-ACR, STRATA Engineering (Australia) Pty Ltd. Burghardt, J.E., 1994, Polyurethane Foam Applications in the Closure of Abandoned Mine Openings. National Park Service. De Neef Construction Chemicals - http://www.deneef.com/ Federal Highway Administration, 2005, FHWA Tunnel Leak Assessment Boston Central Artery Interim Report Green Mountain - http://www.mountaingrout.com/index.html Micon - http://www.miconmining.com/ Minova - http://www.minovainternational.com/UK2/UKHome.asp Multiurethanes - http://www.multiurethanes.com/homepages/index.html Molinda, G.M., 2004, Evaluation of Polyurethane Injection for Beltway Roof Stabilization in a West Virginia Coal Mine, National Institute for Occupational Safety and Health, Nakajima-Kambe, T., Shigeno-Akutsu, Y., Nomura, N., Onuma, F., Nakahara, T., 1999, Microbial Degradation of Polyurethane, Polyester Polyurethanes and Polyether Polyurethanes. Applied Microbiology Biotechnical. 1999 February; 51 (2): 134-40. Prime Resins - http://www.primeresins.com/ Rembco Geotechnical Contractors - http://www.rembco.com/
BIBLIOGRAPHY
64
Sub-technical - http://www.sub-technical.com/ Tannant, D.D., Swan, G., Espley, S., Graham, C., 1999, Laboratory Test Procedures for Validating the Use of Thin Sprayed-On Liners for Mesh Replacement. CIM-AGM Calgary, 1999. Tannant, D.D., 2001, Thin Spray-on Liners for Underground Rock Support. Proc. 17th Int. Mining Congress of Turkey, Balkema, 57-68. URETEK - http://www.sub-technical.com/ US Army Corps of Engineers, January 31, 1995, Chemical Grouting, EM 1110-1-3500. WEBAC Corporation - http://www.webac.com/ Wilson Mining Company - http://www.wilsonmining.com.au/Polyurethane.htm
ACKNOWLEDGEMENTS
65
ACKNOWLEDGEMENTS The authors, Mr. Ben Arndt and Mr. Rick Andrew of Yeh & Associates, Inc., and Mr. Matthew DeMarco of the FHWA CFLHD would like to recognize Mr. Roger Surdahl, FHWA CFLHD Technology Deployment Engineer, for actively and enthusiastically supporting this project under the Technology Deployment Initiatives and Partnership Program. This report also benefited from the input provided by the other Advisory Panel members: Ty Ortiz of the Colorado Department of Transportation, Mr. Matthew Greer of the FHWA Colorado Division, and Mr. Barry Siel of the FHWA Resource Center. The authors would also like to recognize the contributions of several individuals from the Colorado Department of Transportation for their efforts and use of CDOT Region 4 and Region 5 sites for the demonstration projects including but not limited to Mr. Ty Ortiz, Mr. Greg Gargan, Mr. Don Sjaastad, Mr. Ed Archuleta, and Mr. Tony Cady. The authors would also like to recognize both Mr. Dave Hussey and Mr. Johnny Higgs of Micon Mining who provided great technical insight and invaluable experience for the successful completion of the demonstration projects. Other individuals who provided value in input, review, or field assistance in the completion of the report were Mr. Robert LaForce, Mr. Mike Kiefer, Mr. Brian Francis, Mr. Todd Schlittenhart, Mr. Randy Cheney, Mr. Jon Lovekin, and Mr. Steve Foster of Yeh and Associates, Inc.