pupil absence in schools in england: 2014 to 2015 · the full school year 2014 to 2015. information...
TRANSCRIPT

Contact: Email: [email protected] Press office: 020 7783 8300 Public enquiries: 0370 000 2288
Pupil absence in schools in England:
2014 to 2015
SFR 10/2016, 24 March 2016
Overall absence rates have increased slightly since last year
The overall absence rate across
state-funded primary, secondary
and special schools has increased
slightly from 4.5 per cent in 2013/14
to 4.6 per cent in 2014/15.
Overall absence rates have followed
a generally downward trend since
2006/07 when the overall absence
rate was 6.5 per cent.
The increase in overall absence is driven by an increase in illness, whilst levels of absence for other reasons are relatively unchanged
Absence due to illness has increased from 2.6 per cent in 2013/14 to 2.8 per cent in 2014/15. Illness
remains the most common reason for absence, accounting for 60.1 per cent of all absences.
The percentage of pupils who are persistent absentees has increased slightly
The percentage of pupils who are
persistent absentees across state-funded
primary and secondary schools has
increased from 3.6 per cent in 2013/14 to
3.7 per cent in 2014/15.
Persistent absence rates have followed a
general downward trend since 2010/11.
5.0
Primary schools 4.0
6.5 Secondary schools
5.3
10.0 Special schools
9.4
5.8 All schools
4.6
0
1
2
3
4
5
6
7
8
9
10
11
2010/11 2011/12 2012/13 2013/14 2014/15
Data for the sixth half term was first included in 2012/13
3.9
Primary schools
2.1
8.4
Secondary schools
5.4
16.7
Special schools 15.4
6.1 All schools
3.7
0
2
4
6
8
10
12
14
16
18
2010/11 2011/12 2012/13 2013/14 2014/15
Data for the sixth half term was first included in 2012/13

Contact: Email: [email protected] Press office: 020 7783 8300 Public enquiries: 0370 000 2288
Contents
1. Absence rates (Tables 1.1, 2.1, 2.2 & underlying data) .................................. 3
2. Persistent absence (Tables 1.2, 4.1) ............................................................. 4
3. Reasons for absence (Tables 2.1, 2.2) .......................................................... 5
4. Distribution of absence (Tables 3.1, 3.2 & underlying data) ........................... 5
5. Absence by pupil characteristics (Tables 5.1, 5.2, 5.3, 5.4, 5.5, 6.1) ............. 6
6. Absence for four year olds (Table 12.1) ......................................................... 7
7. Pupil referral unit absence (Table 13.1) ......................................................... 7
8. Pupil absence by local authority (Table 11.1) ................................................ 7
9. Background: Additional information and updates ........................................... 9
10. Future changes to this release ....................................................................... 9
11. Accompanying tables ................................................................................... 10
12. Further information is available .................................................................... 12
13. National Statistics ........................................................................................ 12
14. Technical information ................................................................................... 13
15. Get in touch ................................................................................................. 13
Media enquiries ....................................................................................................................... 13
Other enquiries/feedback ......................................................................................................... 13
About this release This statistical first release (SFR) reports on absence in state-funded primary, secondary and special schools during the full school year 2014 to 2015. Information on absence in pupil referral units is also included.
The Department uses two key measures to monitor pupil absence - overall and persistent absence. Absence by reason and characteristics is also included in this release.
Figures held in this release are used as key indicators in behaviour and attendance policy. High levels of attendance are essential in ensuring that all pupils can benefit from the opportunities provided by education.
A “Guide to absence statistics”, which provides historical information on absence statistics, as well as technical background information on the figures and data collection, should be referenced alongside this release.
In this publication
The following sets of tables are included in this release:
• SFR10_2016_Main_tables (Excel .xls)
• SFR10_2016_Local_authority_tables (Excel .xls)
• SFR10_2016_Additional_tables_pupil_residency_and_school_location_tables (Excel .xls)
• SFR10_2016_Additional_tables_new_PA_methodology_15_perc_tables (Excel .xls)
• SFR10_2016_Additional_tables_new_PA_methodology_10_perc_tables (Excel .xls)
• Underlying data (open format .csv and metadata .txt)
Feedback
We are changing how our releases look and welcome feedback on any aspect of this document to [email protected].
3
1. Absence rates (Tables 1.1, 2.1, 2.2 & underlying data)
Overall absence rate definition
The overall absence rate is the total number of overall absence sessions for all pupils as a percentage of the total number of possible sessions for all pupils, where overall absence is the sum of authorised and unauthorised absence and one session is equal to half a day.
Overall absence rate = Total overall absence sessions
Total sessions possible× 100
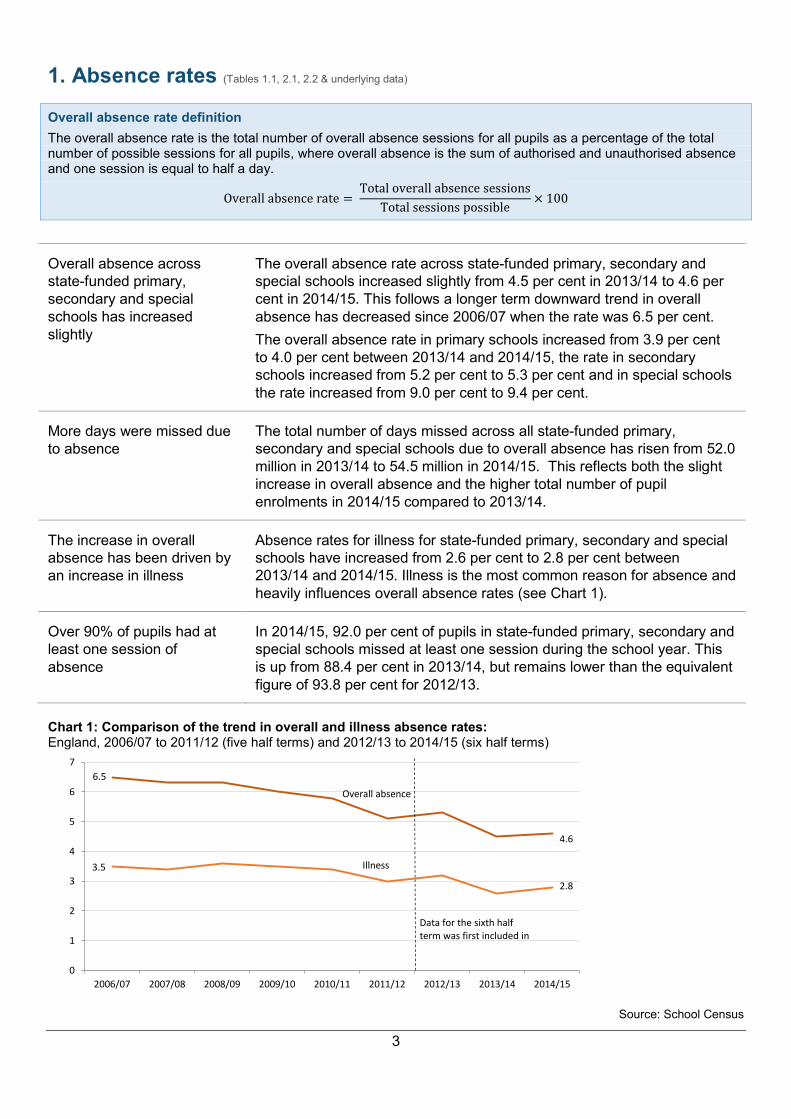
Overall absence across
state-funded primary,
secondary and special
schools has increased
slightly
The overall absence rate across state-funded primary, secondary and
special schools increased slightly from 4.5 per cent in 2013/14 to 4.6 per
cent in 2014/15. This follows a longer term downward trend in overall
absence has decreased since 2006/07 when the rate was 6.5 per cent.
The overall absence rate in primary schools increased from 3.9 per cent
to 4.0 per cent between 2013/14 and 2014/15, the rate in secondary
schools increased from 5.2 per cent to 5.3 per cent and in special schools
the rate increased from 9.0 per cent to 9.4 per cent.
More days were missed due
to absence
The total number of days missed across all state-funded primary,
secondary and special schools due to overall absence has risen from 52.0
million in 2013/14 to 54.5 million in 2014/15. This reflects both the slight
increase in overall absence and the higher total number of pupil
enrolments in 2014/15 compared to 2013/14.
The increase in overall
absence has been driven by
an increase in illness
Absence rates for illness for state-funded primary, secondary and special
schools have increased from 2.6 per cent to 2.8 per cent between
2013/14 and 2014/15. Illness is the most common reason for absence and
heavily influences overall absence rates (see Chart 1).
Over 90% of pupils had at
least one session of
absence
In 2014/15, 92.0 per cent of pupils in state-funded primary, secondary and
special schools missed at least one session during the school year. This
is up from 88.4 per cent in 2013/14, but remains lower than the equivalent
figure of 93.8 per cent for 2012/13.
Chart 1: Comparison of the trend in overall and illness absence rates: England, 2006/07 to 2011/12 (five half terms) and 2012/13 to 2014/15 (six half terms)
Source: School Census
6.5
Overall absence
4.6
3.5 Illness
2.8
0
1
2
3
4
5
6
7
2006/07 2007/08 2008/09 2009/10 2010/11 2011/12 2012/13 2013/14 2014/15
Data for the sixth half term was first included in

4
2. Persistent absence (Tables 1.2, 4.1)
Persistent absence definition
Pupils are identified as persistent absentees by comparing the number of overall absence sessions they have against a standard threshold of around 15 per cent of possible sessions, equating to 56 or more sessions across the full academic year for pupils aged 5 to 14 and 46 or more sessions across the full academic year for pupils aged 15.
Persistent absence thresholds are reviewed every year to account for any changes to the typical amount of possible sessions for all pupils, but do not tend to change (see Chapter 3 of the “Guide to absence statistics” for more details).
The percentage of pupil
enrolments who are
persistent absentees has
increased slightly
For state-funded primary schools, secondary schools and special schools,
the percentage of pupils who are persistent absentees has increased from
3.6 per cent in all schools in 2013/14 to 3.7 per cent in 2014/15.
Special schools have the highest rate of persistent absence (15.4 per
cent) and also saw the greatest increase (up from 14.6 per cent in
2013/14).
Persistent absentees
accounted for around a fifth
of all absence
In 2014/15, persistent absentees accounted for 20.2 per cent of all
absence compared to 19.9 per cent in 2013/14. Longer term, there has
been a decrease in the proportion of absence that persistent absentees
account for – down from 26.6 per cent in 2010/11 (see Chart 2).
Absence rates for persistent
absentees are considerably
higher than for all pupils
The overall absence rate for persistent absentees across all schools was
25.9 per cent, over five times higher than the rate for all pupils. This is a
slight decrease from 2013/14, when the overall absence rate for persistent
absentees was 26.0 per cent.
Chart 2: Percentage of overall absence accounted for by persistent absentees: England, 2010/11 to 2011/12 (five half terms) and 2012/13 to 2014/15 (six half terms)
Source: School Census
26.6 25.1 21.3 19.9 20.2
0
5
10
15
20
25
30
2010/11 2011/12 2012/13 2013/14 2014/15
Data for the sixth half term was first included in 2012/13

5
3. Reasons for absence (Tables 2.1, 2.2)
Illness (not medical or dental appointments) accounted for 60.1 per cent of all absence
compared to 57.9 per cent in 2013/14. 2.8 per cent of all possible sessions were missed
through illness, compared to 2.6 per cent in 2013/14.
In 2014/15, 82.7 per cent of pupil enrolments had missed at least one session due to illness,
an increase from 80.6 per cent in 2013/14.
Family holidays (authorised and unauthorised) accounted for 7.5 per cent of all absences in
2014/15 compared to 8.5 per cent in 2013/14. The percentage of all possible sessions missed
due to all family holidays decreased slightly from 0.4 per cent to 0.3 percent between 2013/14
and 2014/15.
In 2014/15, 13.8 per cent of pupil enrolments had missed at least one session for family
holidays (both authorised and unauthorised); a decrease from 15.0 per cent in 2013/14.
4. Distribution of absence (Tables 3.1, 3.2 & underlying data)
Nearly half of pupils were
absent for five days or fewer 48.8 per cent of pupil enrolments across state-funded primary, secondary
and special schools had five or fewer days of absence in 2014/15, down
from 50.6 per cent in 2013/14.
4.4 per cent of pupil enrolments had more than 25 days of absence in
2014/15. These pupil enrolments accounted for 22.6 per cent of days
missed (see Chart 3).
Pupils in primary school miss
fewer days on average
Per pupil enrolment, the average total absence in primary schools was
7.2 days. This compares to 16.3 days in special schools and 9.2 days in
secondary schools.
Chart 3: Distribution of enrolments and overall absence England, 2014/15 (six half terms)
Source: School Census
8.0
40.8
13.4
24.6
22.6
12.7
19.4
6.3
13.5
3.1
8.5
4.4
22.6
0%
10%
20%
30%
40%
50%
60%
70%
80%
90%
100%
Percentage of pupil enrolments Percentage of overall absence
No Absence
0.5 to 5 days
5.5 to 10 days
10.5 to 15 days
15.5 to 20 days
20.5 to 25 days
more than 25 days
6
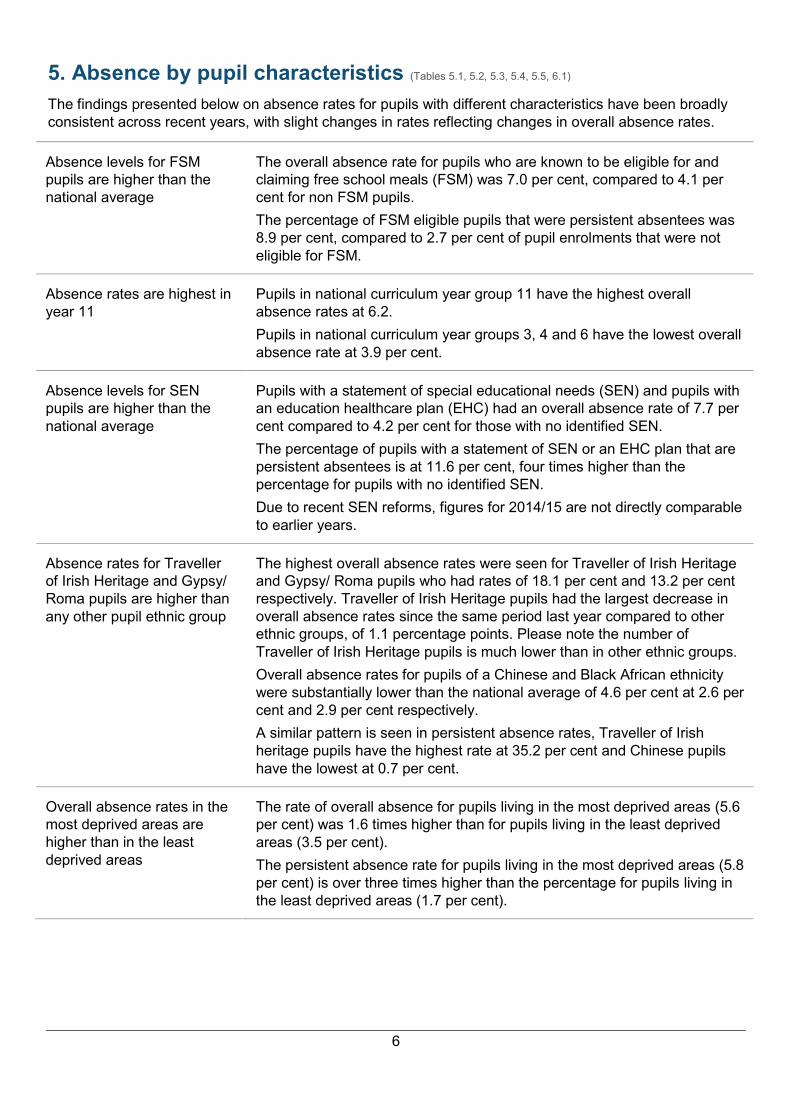
5. Absence by pupil characteristics (Tables 5.1, 5.2, 5.3, 5.4, 5.5, 6.1)
The findings presented below on absence rates for pupils with different characteristics have been broadly
consistent across recent years, with slight changes in rates reflecting changes in overall absence rates.
Absence levels for FSM
pupils are higher than the
national average
The overall absence rate for pupils who are known to be eligible for and
claiming free school meals (FSM) was 7.0 per cent, compared to 4.1 per
cent for non FSM pupils.
The percentage of FSM eligible pupils that were persistent absentees was
8.9 per cent, compared to 2.7 per cent of pupil enrolments that were not
eligible for FSM.
Absence rates are highest in
year 11
Pupils in national curriculum year group 11 have the highest overall
absence rates at 6.2.
Pupils in national curriculum year groups 3, 4 and 6 have the lowest overall
absence rate at 3.9 per cent.
Absence levels for SEN
pupils are higher than the
national average
Pupils with a statement of special educational needs (SEN) and pupils with
an education healthcare plan (EHC) had an overall absence rate of 7.7 per
cent compared to 4.2 per cent for those with no identified SEN.
The percentage of pupils with a statement of SEN or an EHC plan that are
persistent absentees is at 11.6 per cent, four times higher than the
percentage for pupils with no identified SEN.
Due to recent SEN reforms, figures for 2014/15 are not directly comparable
to earlier years.
Absence rates for Traveller
of Irish Heritage and Gypsy/
Roma pupils are higher than
any other pupil ethnic group
The highest overall absence rates were seen for Traveller of Irish Heritage
and Gypsy/ Roma pupils who had rates of 18.1 per cent and 13.2 per cent
respectively. Traveller of Irish Heritage pupils had the largest decrease in
overall absence rates since the same period last year compared to other
ethnic groups, of 1.1 percentage points. Please note the number of
Traveller of Irish Heritage pupils is much lower than in other ethnic groups.
Overall absence rates for pupils of a Chinese and Black African ethnicity
were substantially lower than the national average of 4.6 per cent at 2.6 per
cent and 2.9 per cent respectively.
A similar pattern is seen in persistent absence rates, Traveller of Irish
heritage pupils have the highest rate at 35.2 per cent and Chinese pupils
have the lowest at 0.7 per cent.
Overall absence rates in the
most deprived areas are
higher than in the least
deprived areas
The rate of overall absence for pupils living in the most deprived areas (5.6
per cent) was 1.6 times higher than for pupils living in the least deprived
areas (3.5 per cent).
The persistent absence rate for pupils living in the most deprived areas (5.8
per cent) is over three times higher than the percentage for pupils living in
the least deprived areas (1.7 per cent).

7
6. Absence for four year olds (Table 12.1)
The overall absence rate for four year olds (who are not of compulsory school age) has increased slightly
since 2013/14 from 5.1 per cent to 5.2 per cent.
7. Pupil referral unit absence (Table 13.1)
The overall absence rate for pupil referral units in 2014/15 was 31.5 per cent, down from 31.9 per cent in
2013/14.
The percentage of enrolments in pupil referral units who are persistent absentees was 38.3 per cent in
2014/15, down from 37.6 per cent in 2013/14.
8. Pupil absence by local authority (Table 11.1)
There is variation in overall and persistent absence rates across state-funded primary, secondary and
special schools by region and local authority (See Chart 4).
The region with the highest overall absence rate across all state-funded primary, secondary and special
schools is the North East (4.9 per cent), with Inner London having the lowest overall absence rate (4.4 per
cent). The region with the highest persistent absence rate is Yorkshire and the Humber, where 4.2 per cent
of pupil enrolments are persistent absentees, with Inner and Outer London having the joint lowest rate of
persistent absence (at 3.3 per cent).

8
Chart 4: Pupil absence by local authority England, 2014/15 (six half terms)

9
9. Background: Additional information and updates
This SFR is accompanied by underlying data, including national, local authority and school level information. The accompanying file includes a metadata document which provides further information on the contents of these files. This data is released under the terms of the Open Government License and is intended to meet at least 3 stars for Open Data.
10. Future changes to this release
In October 2014 the Department consulted on proposed changes to the persistent absence methodology
and structure of the absence statistics publications. The full consultation can be found in Section 9 of the
“Pupil absence in schools in England: autumn 2013 and spring 2014” Statistical First Release. A response
to this consultation, outlining the next steps to implement changes from the 2015/16 academic year, is
available on the same page as the original consultation.
Additional tables are provided in this release to show 15 per cent persistent absence figures under the new
methodology set out in the consultation so that users can fully understand the differences between the
existing and new methodology.
From the beginning of the 2015/16 academic year the persistent absence threshold will change from 15 per
cent to 10 per cent. Figures for persistent absence at the 10 per cent level based on the new methodology
are also included in additional tables accompanying this release to assist users in understanding how the
change from 15% to 10% will affect persistent absence figures.

10
11. Accompanying tables
The following tables are available in Excel format on the Department’s statistics website.
Table coverage
All tables are based on the full academic year (six half terms), and relate to state-funded primary and secondary schools unless otherwise stated.
As of the 2012/13 academic year, the Department’s key absence indicators have been based on the full academic year’s (six half term) data. Information for the first five half terms for 2006/07 to 2014/15 is available in the release’s underlying data section.
Main tables
Charts
1 Overall absence rates by type of school
2 Percentage of pupil enrolments that are persistent absentees (15 per cent threshold)
Tables
1.1 Pupil absence by type of school
1.2 Pupil enrolments that are persistent absentees (15 per cent threshold)
2.1 Pupil absence by reason and gender
2.2 Pupil enrolments with one or more session of absence by reason
2.3 Pupil absence by reason for persistent absentees (15 per cent threshold)
3.1 Distribution of enrolments by length of overall absence
3.2 Percentage of enrolments by their overall absence rates
4.1 Number of schools by the percentage of persistent absentees (15 per cent threshold)
5.1 Pupil absence by characteristics
5.2 Characteristics of pupil enrolments that are persistent absentees (15 per cent threshold)
5.3 Pupil absence by ethnic group
5.4 Pupil enrolments that are persistent absentees by ethnic group (15 per cent threshold)
5.5 Pupil absence by type of special educational need
6.1 Pupil absence by Income Deprivation Affecting Children Indices (IDACI) decile of pupil residence
Local authority tables
11.1 Pupil absence by type of school
12.1 Pupil absence for four year olds
13.1 Pupil absence for pupil referral units
Additional tables – pupil residency and school location tables
14.1 Pupil absence by degree of rurality of school location
14.2 Pupil absence by local authority district of school location
14.3 Pupil absence by degree of rurality of pupil residence
14.4 Pupil absence by local authority district of pupil residence
14.5 Pupil absence by IDACI decile of pupil residence
Additional tables – new persistent absence methodology (15 per cent)
National tables
15.1 Percentage of pupil enrolments that are persistent absentees (15 per cent, new methodology)
15.2 Characteristics of pupil enrolments that are persistent absentees (15 per cent, new methodology)
15.3 Pupil enrolments that are persistent absentees by ethnic group (15 per cent, new methodology)

11
Local authority tables
15.4 Pupil enrolments that are persistent absentees by type of school (15 per cent, new methodology)
15.5 Pupil enrolments that are persistent absentees in pupil referral units (15 per cent, new methodology)
School level tables
15.6 Pupil enrolments that are persistent absentees at school level (15 per cent, new methodology)
Additional tables – new persistent absence methodology (10 per cent)
National tables
16.1 Percentage of pupil enrolments that are persistent absentees (10 per cent, new methodology)
16.2 Characteristics of pupil enrolments that are persistent absentees (10 per cent, new methodology)
16.3 Pupil enrolments that are persistent absentees by ethnic group (10 per cent, new methodology)
Local authority tables
16.4 Pupil enrolments that are persistent absentees by type of school (10 per cent, new methodology)
16.5 Pupil enrolments that are persistent absentees in pupil referral units (10 per cent, new methodology)
School level tables
16.6 Pupil enrolments that are persistent absentees at school level (10 per cent, new methodology)
When reviewing the tables, please note that:
We preserve confidentiality The Code of Practice for Official Statistics requires that reasonable steps
should be taken to ensure that all published or disseminated statistics
produced by the Department for Education protect confidentiality.
We round numbers Enrolment numbers at national and regional levels have been rounded to
the nearest 5. Enrolment numbers of 1 or 2 have been suppressed to
protect confidentiality. Where any number is shown as 0, the original
figure was also 0. Where the numerator or denominator of any percentage
calculated on enrolment numbers is less than 3, the percentage has been
suppressed. This suppression is consistent with the Departmental
statistical policy.
We adopt symbols to help
identify suppression
Symbols are used in the tables as follows:
0 zero
x small number suppressed to preserve confidentiality
. not applicable
.. not available

12
12. Further information is available
Want previously published
figures?
For the previous full year pupil absence figures visit: Pupil Absence in Schools in England, Including Pupil Characteristics: 2013/14
Want Wales, Scotland,
Northern Ireland?
The School Census only collects absence information from schools in England. For information for Wales, Scotland and Northern Ireland, contact the departments below or access their statistics at the following links:
Wales: [email protected] or Welsh Government - Statistics and Research
Scotland: [email protected] or Scottish Government - School Education Statistics
Northern Ireland: [email protected] or Department of Education - Education Statistics
For related publications For related publications, visit Pupil absence in schools in England
Revisions? There are no further planned revisions to this Statistical First Release.
However, if at a later date we need to make a revision, this will comply with the Departmental revisions policy.
13. National Statistics
The United Kingdom Statistics Authority has designated these statistics as National Statistics, in
accordance with the Statistics and Registration Service Act 2007 and signifying compliance with the Code
of Practice for Official Statistics.
Designation can be broadly interpreted to mean that the statistics:
meet identified user needs;
are well explained and readily accessible;
are produced according to sound methods, and
are managed impartially and objectively in the public interest.
Once statistics have been designated as National Statistics it is a statutory requirement that the Code of
Practice shall continue to be observed.
The Department has a set of statistical policies in line with the Code of Practice for Official Statistics.

13
14. Technical information
These statistics are presented as emerging findings and have been released to help planning, to study
trends and to monitor outcomes of initiatives and interventions on pupil attendance.
A “Guide to absence statistics”, which provides historical information on absence statistics, technical
background information on the figures and data collection, and definitions of key terms should be referred
to alongside this release.
The following technical notes are specific to this publication.
Data are collected a term in arrears, meaning that where a school closes, data are not collected for
the last term the school was open. For schools which close at the end of a term, data for that term
will not be collected.
- 13 sponsor-led academies opened part way through the year and incorrectly returned absence
data for their predecessor school. As the combined absence data would then be related to both
the academy and their predecessor school these academies have been completely removed
from this analysis.
- Year-on-year comparisons of local authority data may be affected by schools converting to
academies.
Schools with fewer than six pupil enrolments aged between five and fifteen are removed from our
analysis. For this release, 12 schools were removed from the main five to fifteen year old analysis.
15. Get in touch
Media enquiries
Press Office News Desk, Department for Education, Sanctuary Buildings, Great Smith Street, London
SW1P 3BT.
Tel: 020 7783 8300
Other enquiries/feedback
Education Standards Evidence and Dissemination Division, Level 2, Department for Education, Sanctuary
Buildings, Great Smith Street, London, SW1P 3BT.

© Crown copyright 2016
This publication (not including logos) is licensed under the terms of the
Open Government Licence v3.0 except where otherwise stated. Where
we have identified any third party copyright information you will need to
obtain permission from the copyright holders concerned.
To view this licence:
visit www.nationalarchives.gov.uk/doc/open-government-licence/version/3
email [email protected]
write to Information Policy Team, The National Archives, Kew, London, TW9 4DU
About this publication:
Enquiries: Clare Jones, Education Standards Evidence and Dissemination Division, Level 2,
Department for Education, Sanctuary Buildings, Great Smith Street, London, SW1P 3BT
This document is also available from our website “statistics: pupil absence”.
Reference: [SFR 10/2016]
Follow us on Twitter: @educationgovuk
Like us on Facebook: facebook.com/educationgovuk