pump primer : how do the economists keep track of international transactions? 41
TRANSCRIPT

Pump PrimerPump Primer::
• How do the economists keep track of international transactions?
41

ModuleCapitalFlows and theBalance of Payments
KRUGMAN'SMACROECONOMICS for AP*
41
Margaret Ray and David Anderson

Biblical IntegrationBiblical Integration::
• You are most likely beginning to see how so many of the economic principles you have studied in the various chapters work simultaneously and together in our economy. Now you should better understand why the Bible states that "god- liness with contentment is great gain" (1 Tim 6:6)/ Genuine and lasting contentment is exceedingly scarce; hence, its value is exceedingly high." (Carter 294)

What you will learnWhat you will learn
in thisin this ModuleModule::
• The meaning of the balance of payments accounts
• The determinants of international capital flows

Balance of Payments AccountsBalance of Payments Accounts
Every year Americans buy trillions of dollars of “stuff” from firms in foreign countries. Consumers in foreign countries buy nearly the same amount of “stuff” from America. Economists keep track of international transactions using the balance of payments accounts.
Balance of Payments AccountsBalance of Payments Accounts
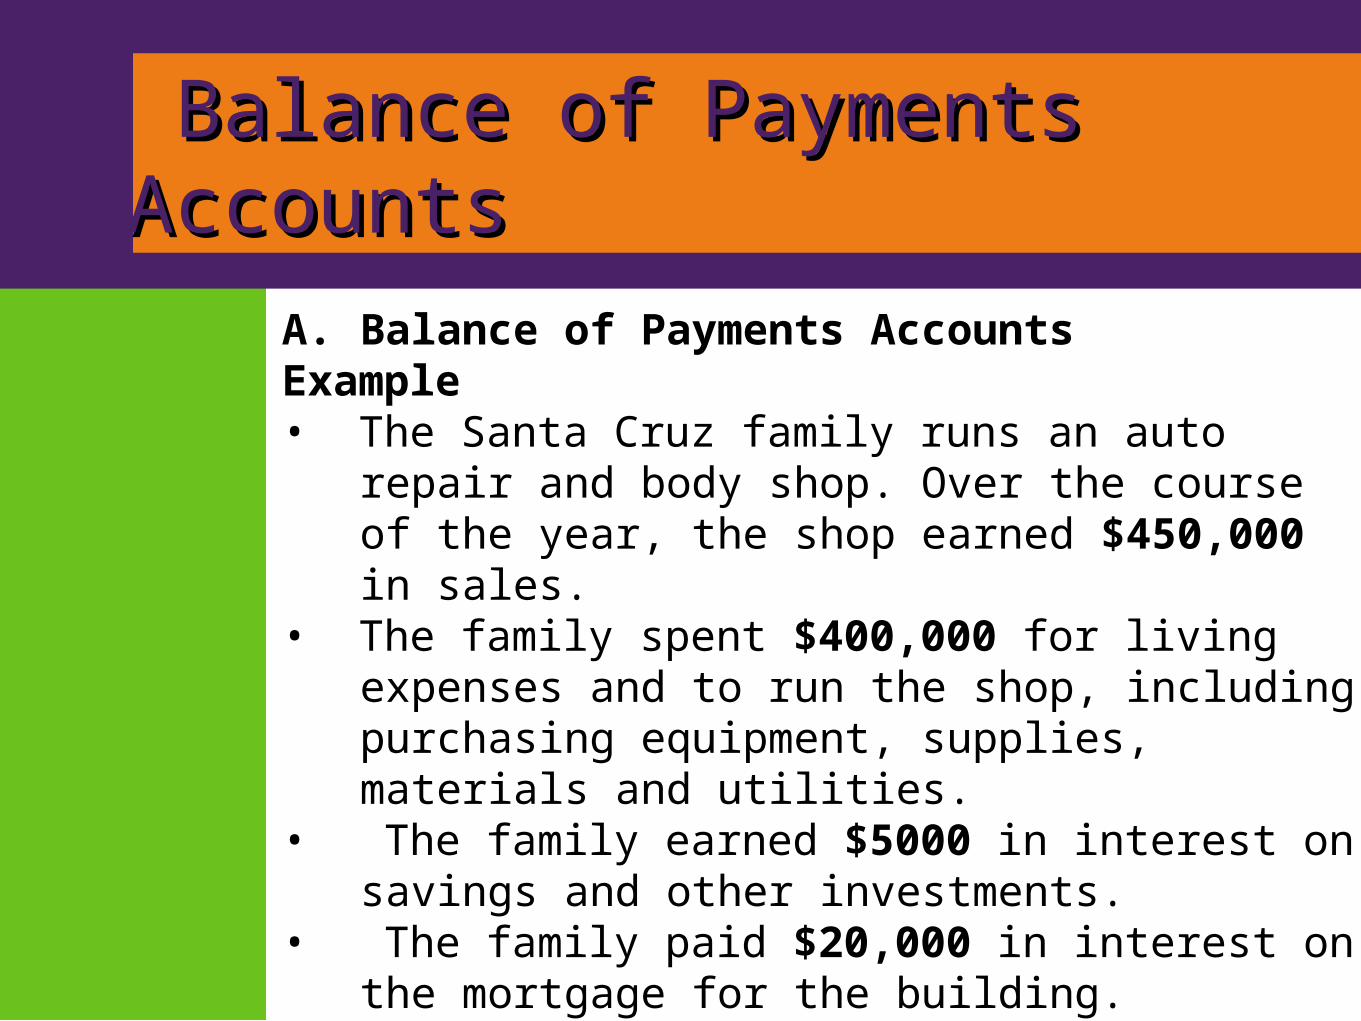
A. Balance of Payments AccountsExample• The Santa Cruz family runs an auto repair and
body shop. Over the course of the year, the shop earned $450,000 in sales.
• The family spent $400,000 for living expenses and to run the shop, including purchasing equipment, supplies, materials and utilities.
• The family earned $5000 in interest on savings and other investments.
• The family paid $20,000 in interest on the mortgage for the building.
• After paying all of the bills, the family took the remaining cash and deposited it into the bank.
Balance of Payments AccountsBalance of Payments Accounts
Balance of Payments AccountsBalance of Payments Accounts
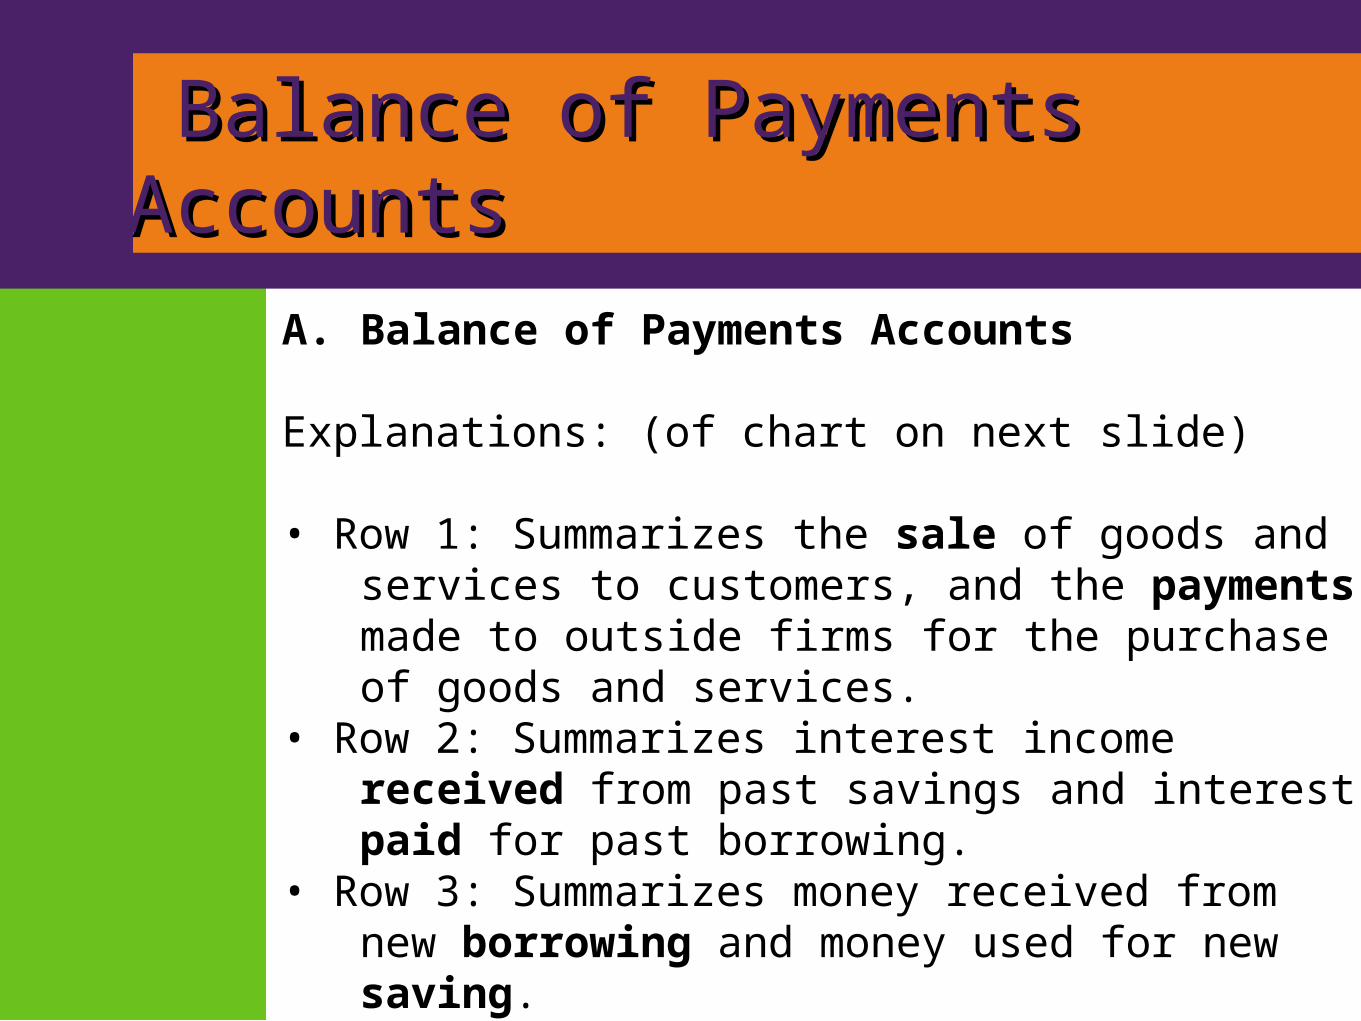
A. Balance of Payments Accounts
Explanations: (of chart on next slide)
• Row 1: Summarizes the sale of goods and services to customers, and the payments made to outside firms for the purchase of goods and services.
• Row 2: Summarizes interest income received from past savings and interest paid for past borrowing.
• Row 3: Summarizes money received from new borrowing and money used for new saving.
Balance of Payments AccountsBalance of Payments Accounts
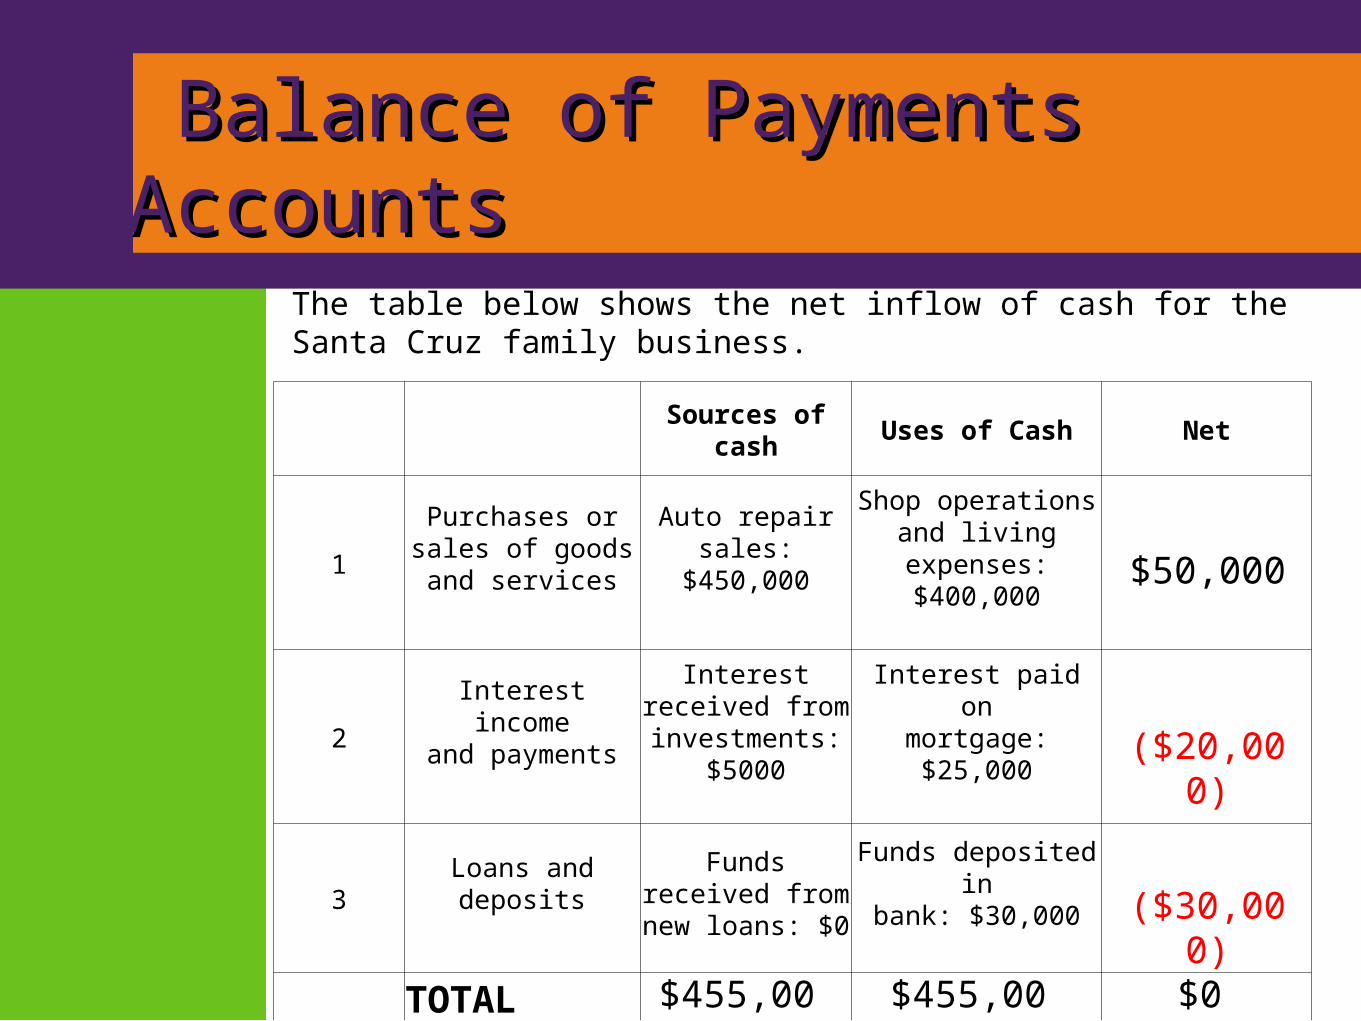
Sources of cash Uses of Cash Net
1
Purchases orsales of goodsand services
Auto repair sales:$450,000
Shop operationsand livingexpenses:$400,000
2Interest incomeand payments
Interest received from
investments: $5000
Interest paid onmortgage:$25,000
3Loans anddeposits
Funds received from
new loans: $0
Funds deposited inbank: $30,000
TOTAL
The table below shows the net inflow of cash for the Santa Cruz family business.
$50,000
($20,000)
($30,000)
$455,000
$455,000
$0

Balance of Payments AccountsBalance of Payments Accounts
It is important to remember that the sum of cash coming in from all sources and the sum of all cash used are equal, by definition: every dollar has a source, and every dollar received gets used somewhere.
Balance of Payments AccountsBalance of Payments Accounts
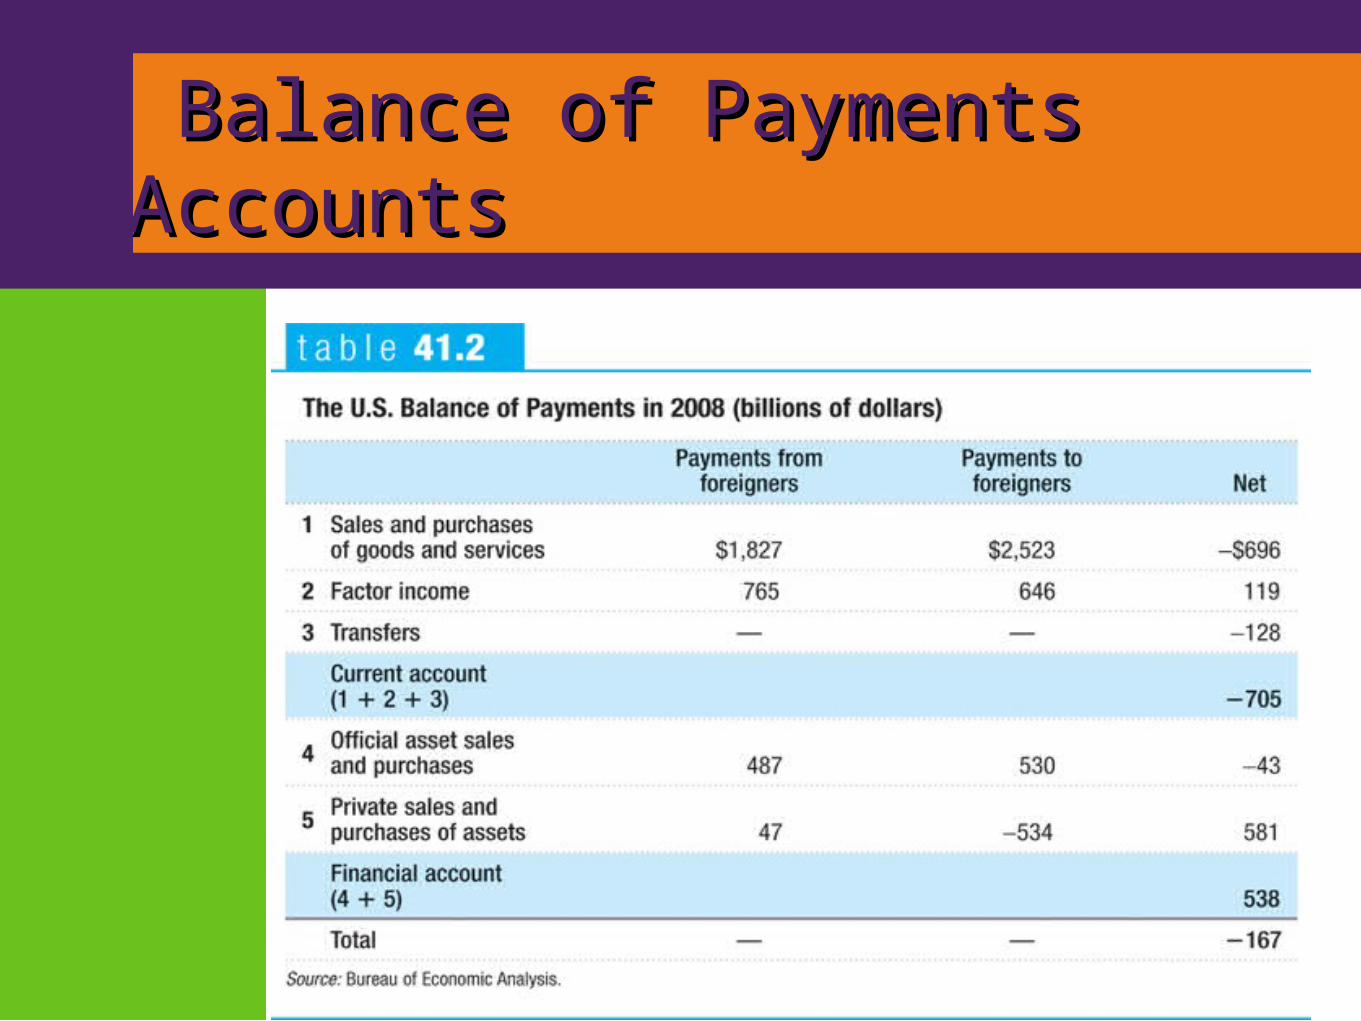
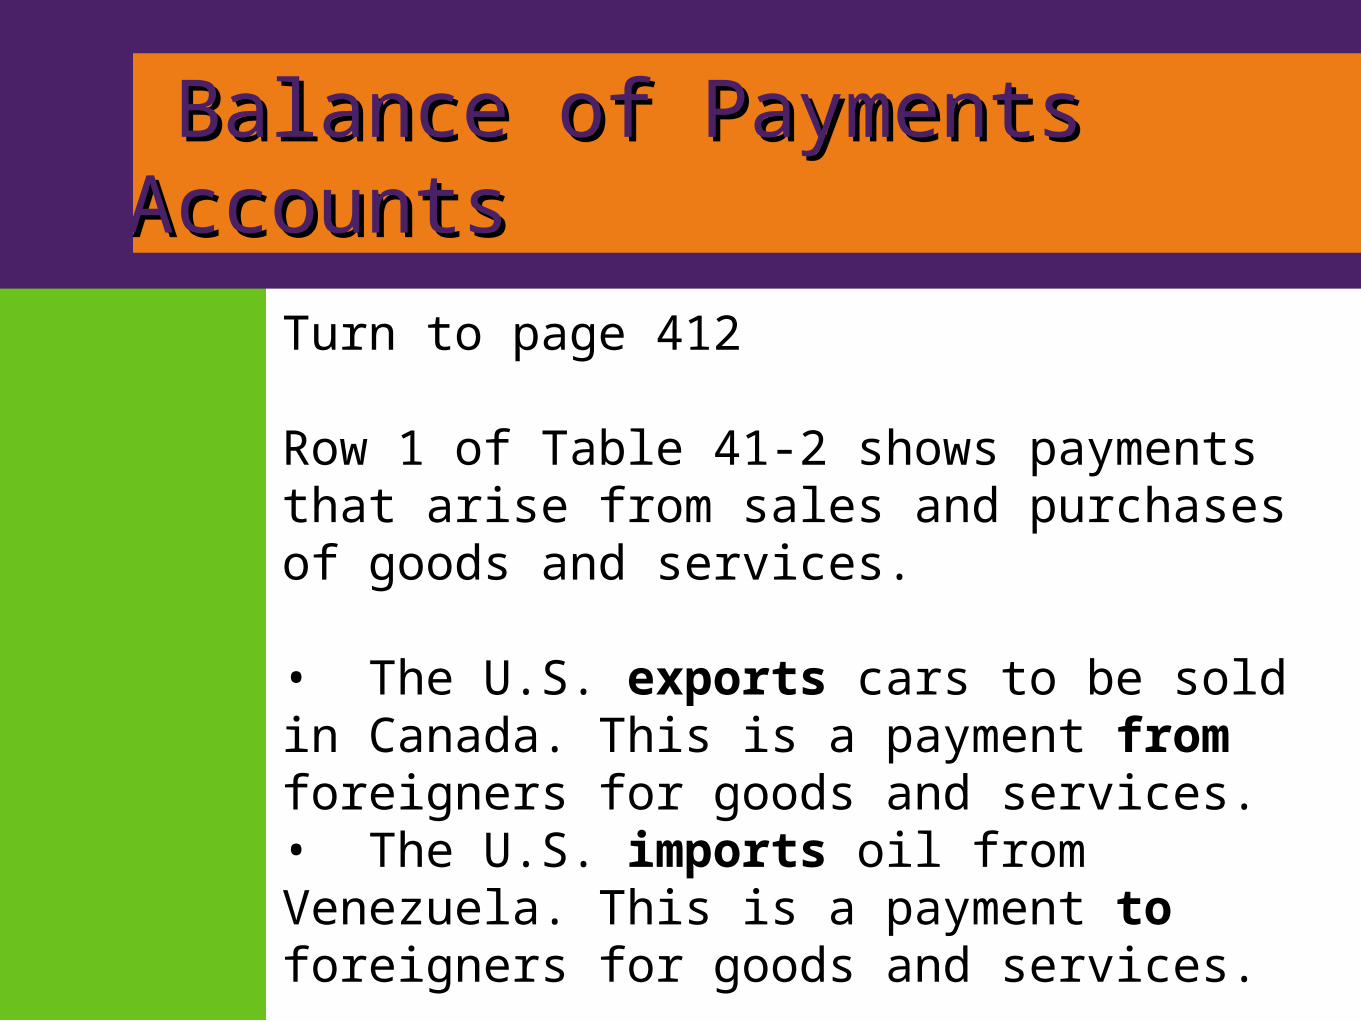
Turn to page 412 Row 1 of Table 41-2 shows payments that arise from sales and purchases of goods and services.
• The U.S. exports cars to be sold in Canada. This is a payment from foreigners for goods and services.• The U.S. imports oil from Venezuela. This is a payment to foreigners for goods and services.
Balance of Payments AccountsBalance of Payments Accounts
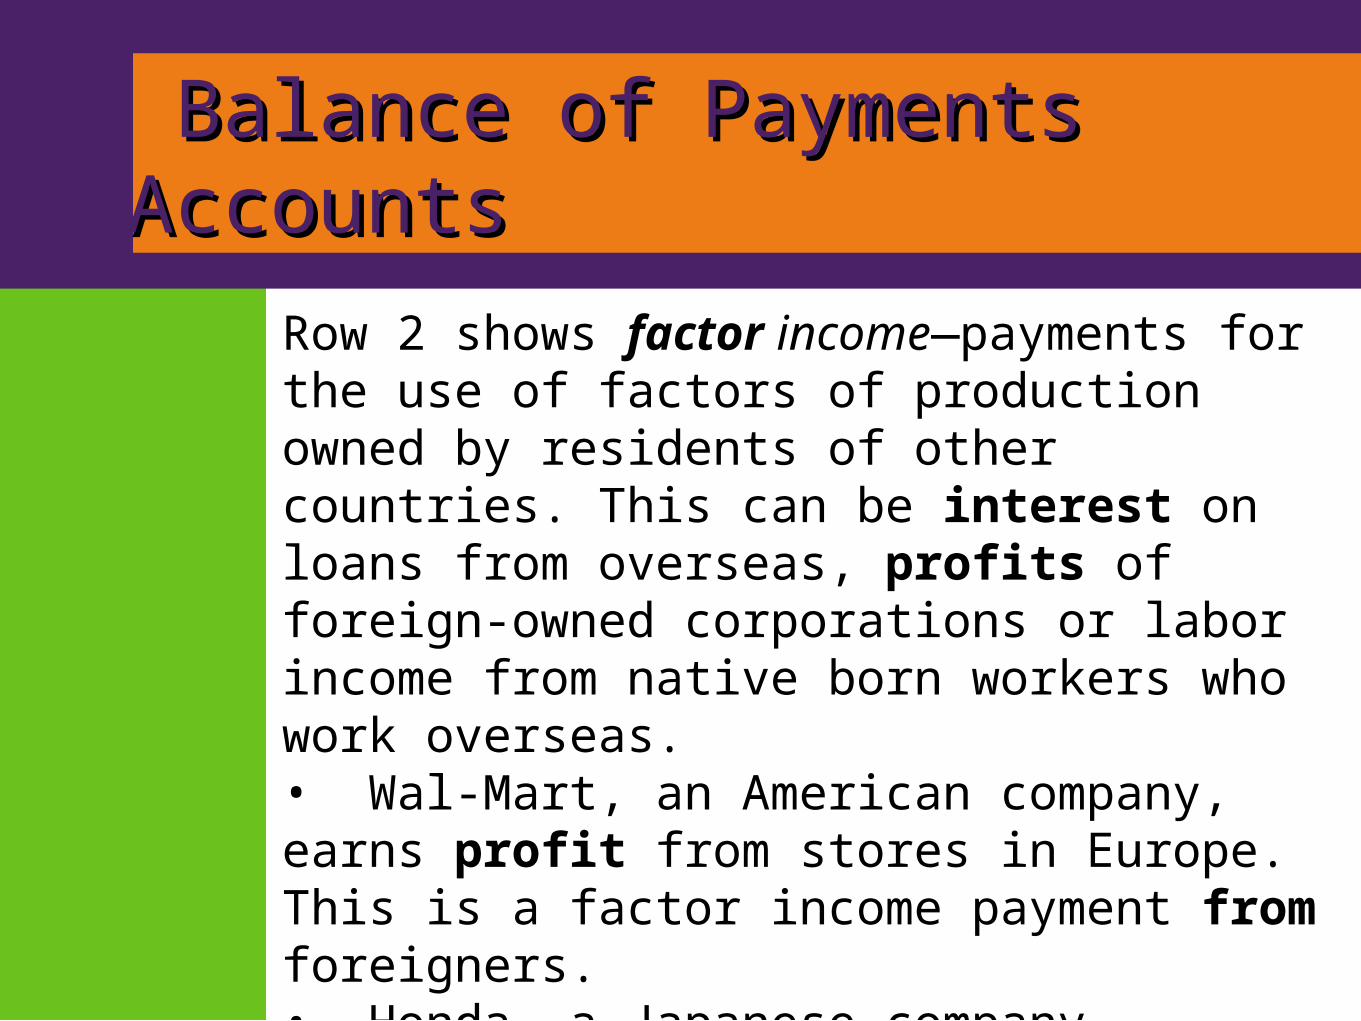
Row 2 shows factor income—payments for the use of factors of production owned by residents of other countries. This can be interest on loans from overseas, profits of foreign-owned corporations or labor income from native born workers who work overseas.• Wal-Mart, an American company, earns profit from stores in Europe. This is a factor income payment from foreigners.• Honda, a Japanese company, produces and sells cars in Indiana and other U.S. states. This is a factory income payment to foreigners.

Balance of Payments AccountsBalance of Payments Accounts
Row 3 shows international transfers—funds sent by residents of one country to residents of another. The main element here is the remittances that immigrants, such as the millions of Mexican-born workers employed in the United States, send to their families in their country of origin. Notice that Table 41-2 only shows the net value of transfers. That’s because the U.S. government only provides an estimate of the net, not a breakdown between payments to foreigners and payments from foreigners. .

Balance of Payments AccountsBalance of Payments Accounts
The next two rows of Table 41-2 shows payments resulting from sales and purchases of assets, broken down by who is doing the buying and selling.
Row 4 shows transactions that involve governments or government agencies, mainly central banks.• When the central bank of China purchases a U.S. Treasury, cash flows from China to the U.S.

Balance of Payments AccountsBalance of Payments Accounts
Row 5 shows private sales and purchases of assets.
• When Coca-Cola buys a factory in Mexico, this is an asset purchase and payment to foreigners.
• If a Brazilian company buys an apartment building in Boston, this is an asset sale, and payment to foreigners.

Balance of Payments AccountsBalance of Payments Accounts
In laying out Table 41-2, we have separated rows 1, 2, and 3 into one group and rows 4 and 5 into another. This reflects a fundamental difference in how these two groups of transactions affect the future. • Transactions that don’t create liabilities are considered part of the balance of payments on current account, often referred to simply as the current account: the balance of payments on goods and services plus factor income and net international transfer payments.
Balance of Payments AccountsBalance of Payments Accounts
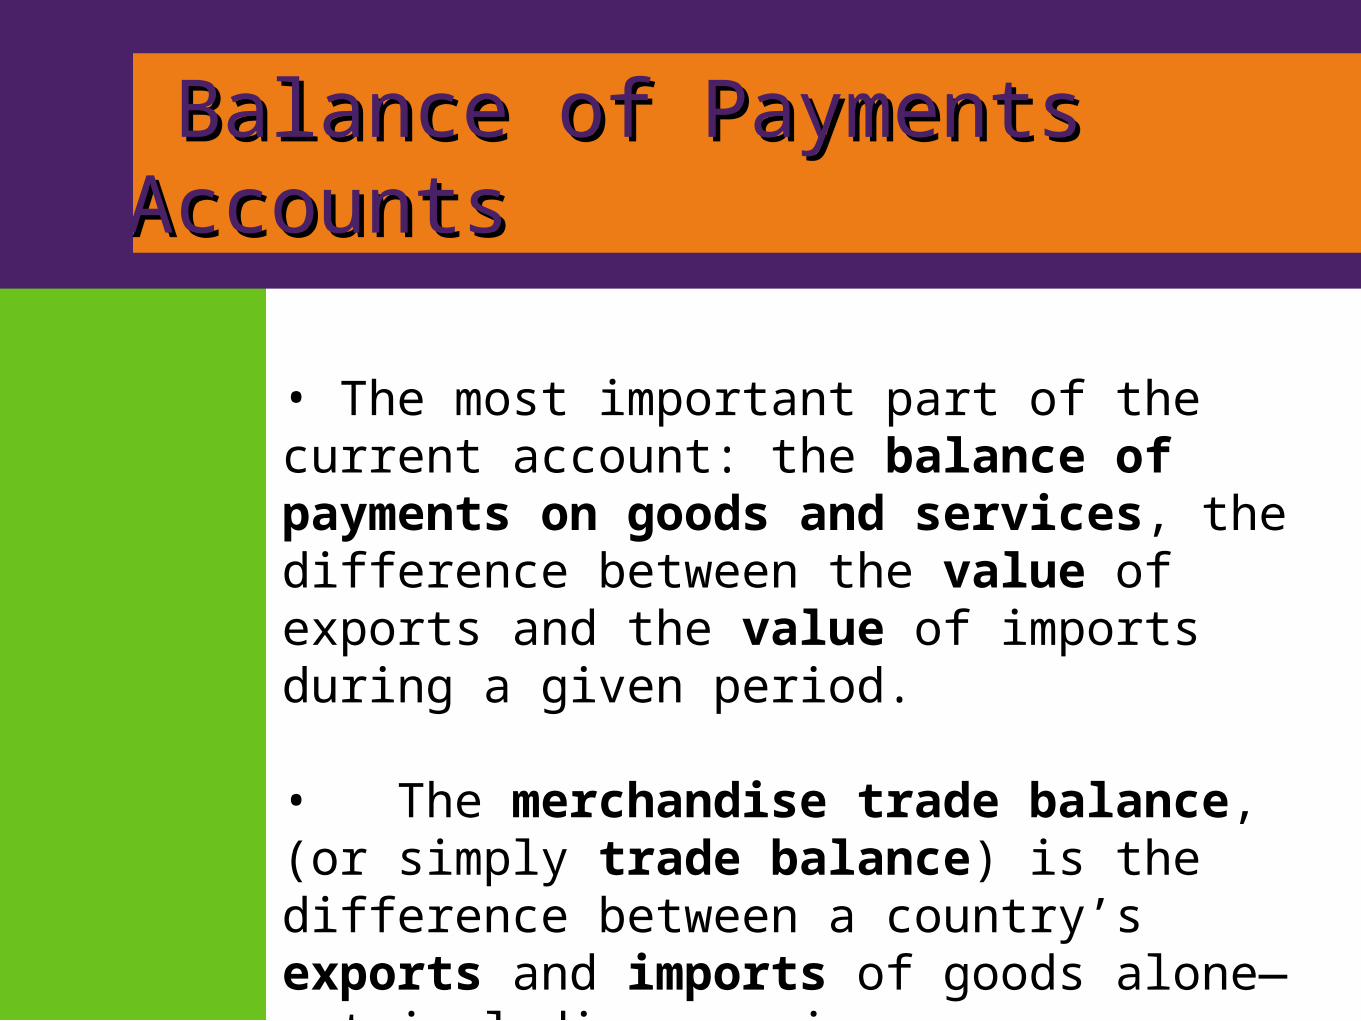
• The most important part of the current account: the balance of payments on goods and services, the difference between the value of exports and the value of imports during a given period. • The merchandise trade balance, (or simply trade balance) is the difference between a country’s exports and imports of goods alone—not including services.
Balance of Payments AccountsBalance of Payments Accounts
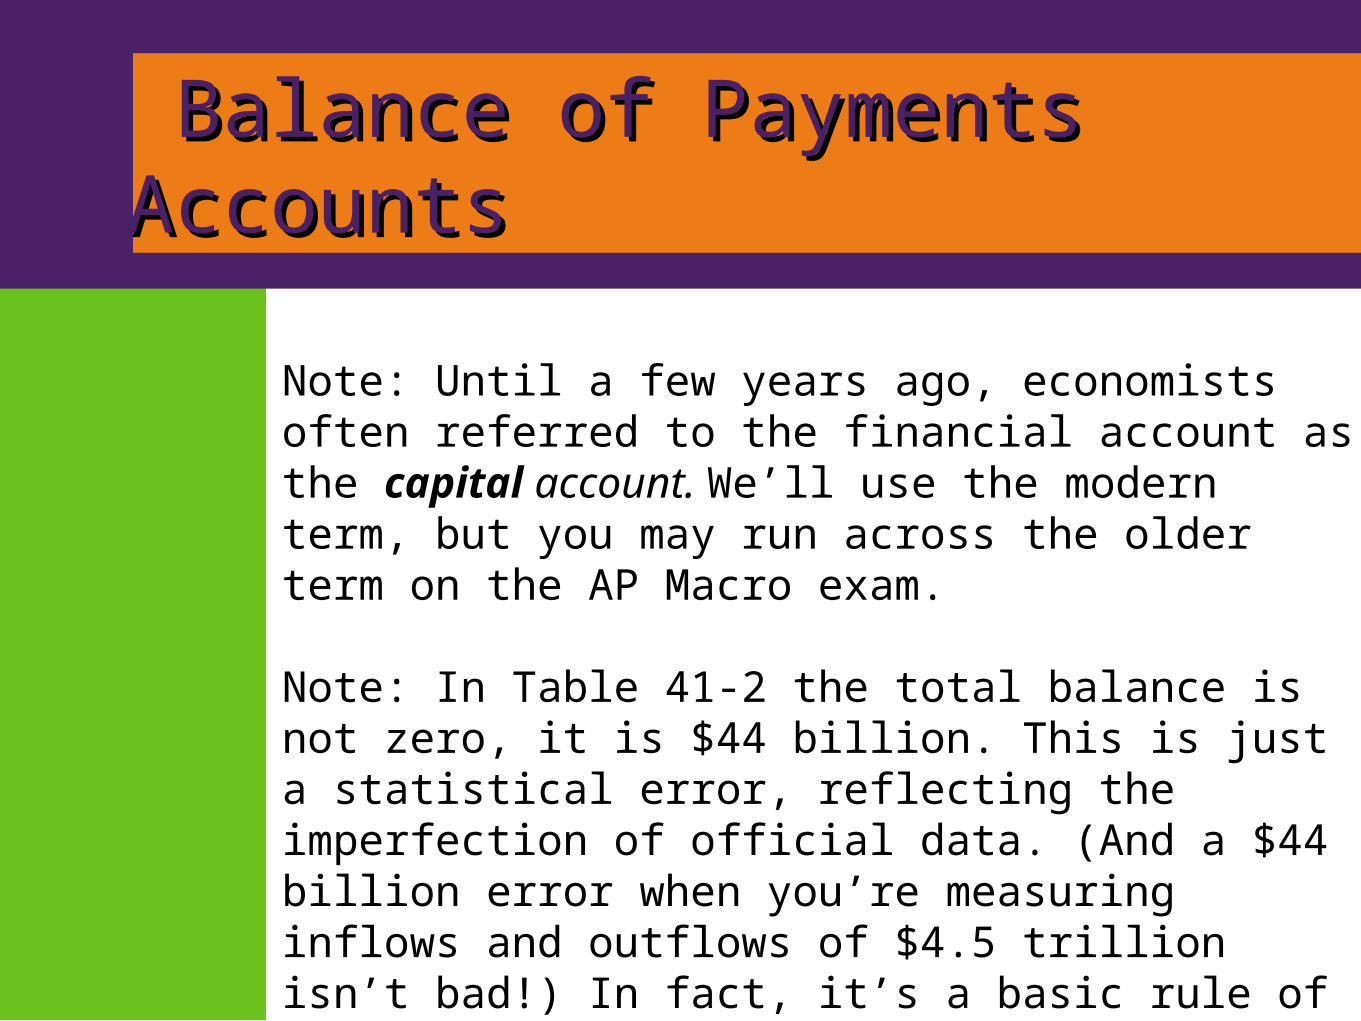
Note: Until a few years ago, economists often referred to the financial account as the capital account. We’ll use the modern term, but you may run across the older term on the AP Macro exam. Note: In Table 41-2 the total balance is not zero, it is $44 billion. This is just a statistical error, reflecting the imperfection of official data. (And a $44 billion error when you’re measuring inflows and outflows of $4.5 trillion isn’t bad!) In fact, it’s a basic rule of balance of payments accounting that the current account and the financial account must sum to zero:
Balance of Payments AccountsBalance of Payments Accounts
Current account (CA) + Financial account (FA) = 0 orCA = −FA Why must this be true? In total, the sources of cash must equal the uses of cash.
Note: Look over the circular flow diagram Figure 41-1that describes the flow of money between national economies. Two other equivalent ways to see the equation above:

Balance of Payments AccountsBalance of Payments Accounts
Positive entries on current account + Positive entries on financial account = Negative entries on current account + Negative entries on financial account Positive entries on current account - Negative entries on current account = Positive entries on financial account - Negative entries on financial account = 0

Modeling the Financial AccountModeling the Financial Account
B. Modeling the Financial Account
What determines whether money flows into a nation’s financial account?
The financial account is a measure of capital inflows, of foreign savings that are available to finance domestic investment spending. The basic model of the loanable funds market is used to model the flow of financial capital from one nation to another.

Modeling the Financial AccountModeling the Financial Account
In using this model, we make two important simplifications:
• We simplify the reality of international capital flows by assuming that all flows are in the form of loans. In reality, capital flows take many forms, including purchases of shares of stock in foreign companies and foreign real estate as well as direct foreign investment, in which companies build factories or acquire other productive assets abroad.

Modeling the Financial AccountModeling the Financial Account
• We also ignore the effects of expected changes in exchange rates, the relative values of different national currencies. We analyze the determination of exchange rates later.
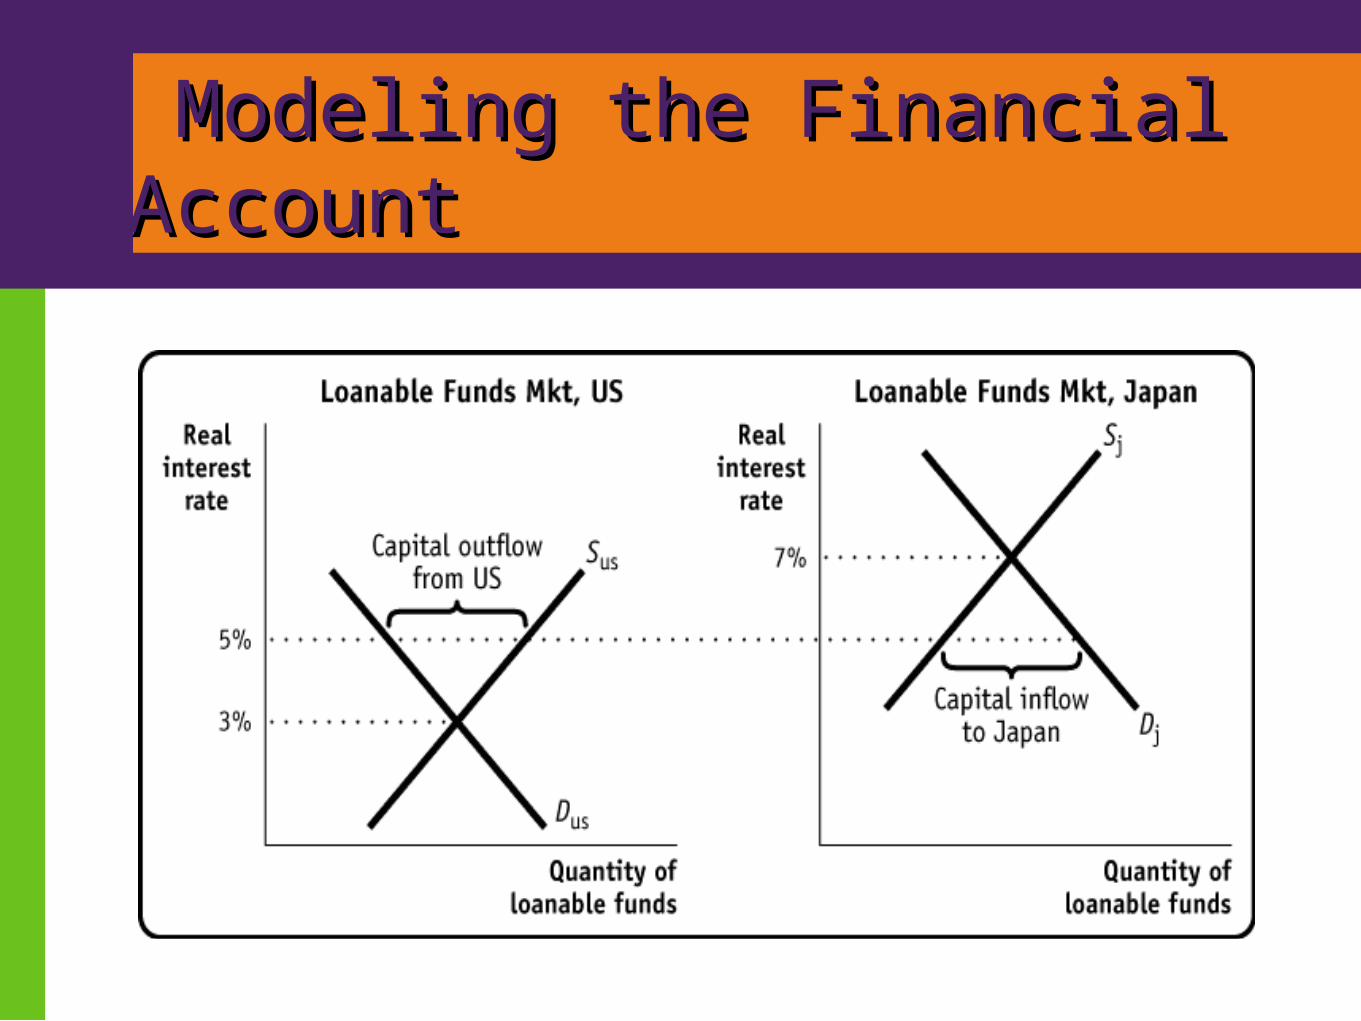
Suppose that the real interest rate in the U.S. is 3% and the real interest rate in Japan is 7%.
Modeling the Financial AccountModeling the Financial Account

Modeling the Financial AccountModeling the Financial Account
When two nations have differing real interest rates in their domestic loanable funds markets, savers in the U.S. begin to look for countries like Japan where the return on a financial asset is higher. Individuals and firms in the U.S. begin to purchase financial assets in Japan, sending dollars as payment to Japan. Another way to think about it is that the U.S. is exporting dollars and importing financial assets. Japan is exporting the financial assets and importing dollars.
Modeling the Financial AccountModeling the Financial Account
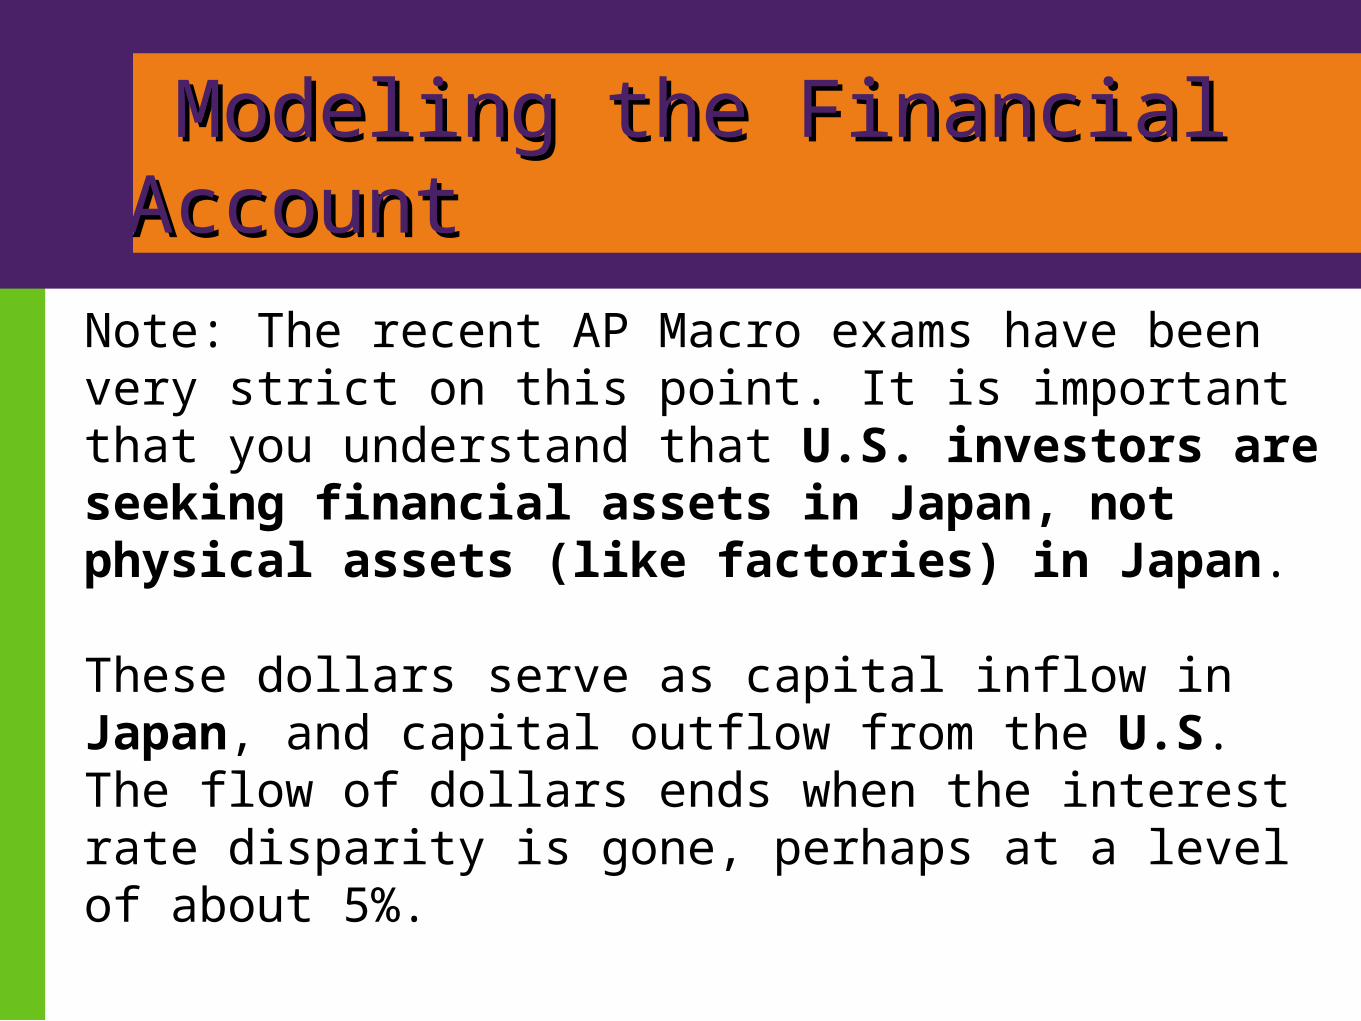
Note: The recent AP Macro exams have been very strict on this point. It is important that you understand that U.S. investors are seeking financial assets in Japan, not physical assets (like factories) in Japan. These dollars serve as capital inflow in Japan, and capital outflow from the U.S. The flow of dollars ends when the interest rate disparity is gone, perhaps at a level of about 5%.

Modeling the Financial AccountModeling the Financial Account
r%
QLF USA
SLF USA
DLF Japan
r%
QLF Japan
SLF Japan
DLF China
SLF 1 USA
SLF 1 Japan
Debit to the US Financial Account or Capital Outflow
Credit to the Japanese Financial Account or Capital Inflow

Underlying Determinants ofUnderlying Determinants of International Capital Flows International Capital Flows
But what underlies differences across countries in the supply and demand for funds? International differences in the demand for funds reflect underlying differences in investment opportunities.
• A country with a rapidly growing economy, other things equal, tends to offer more investment opportunities than a country with a slowly growing economy. So, a rapidly growing economy typically—though not always—has a higher demand for capital and offers higher returns to tends to flow from slowly growing to rapidly growing economies.

Underlying Determinants ofUnderlying Determinants of International Capital Flows International Capital Flows
• International differences in the supply of funds reflect differences in savings across countries. These may be the result of differences in private savings rates, which vary widely among countries. • They may also reflect differences in savings by governments. In particular, government budget deficits, which reduce overall national savings, can lead to capital inflows.

Two-way Capital FlowsTwo-way Capital Flows
The flow of financial capital is a two-way street. Financial investors in the U.S. are sending money to Japan because interest rates might be higher, but Japanese investors are sending money to the U.S. stock market because they believe the U.S. economy has a brighter future. Corporations diversify financial risk by both selling shares of their own stock to foreign investors, but also by purchasing foreign shares of stocks or foreign bonds