pultruded gfrp sections as stay-in-place structural open
TRANSCRIPT

Pultruded GFRP Sections as Stay-in-Place Structural Open Formwork for Concrete
Slabs and Girders
By
Hart Noah Honickman
A thesis submitted to the Department of Civil Engineering in conformity with the requirements for the degree of Master of
Science (Engineering)
Queen's University Kingston, Ontario, Canada
July, 2008
Copyright © Hart Noah Honickman, 2008

ABSTRACT
Commercially available glass fiber-reinforced polymer (GFRP) off-the-shelf structural shapes
have great potential as stay-in-place open structural forms for concrete structures, including
bridge decks and girders. The system simplifies and accelerates construction, and the non-
corrosive GFRP forms can fully or partially replace steel rebar. In this study, eight concrete slabs
were constructed using flat pultruded GFRP plates, and nine girders were constructed using
trapezoidal pultruded GFRP sheet pile sections as stay-in-place structural forms. No tension steel
reinforcement was used. All specimens were tested in four-point monotonic uniaxial bending.
Four adhesive and mechanical bond mechanisms were explored to accomplish composite action.
The most effective mechanism, considering structural performance and ease of fabrication, was
wet adhesive bonding of fresh concrete to GFRP. Although failure was by debonding, no slip was
observed prior to failure. Other parameters studied were concrete slabs’ thicknesses and their
shear span-to-depth ratios. For the girders, three different cross-sectional configurations were
examined, namely, totally filled sheet piles, one with a voided concrete fill, and an all-GFRP box
girder developed by bonding flat GFRP sheets to the upper flanges of the sheet piles with a cast-
in-place concrete flange. Girders were tested in positive and negative bending to simulate
continuity. The built-up box girders showed superior performance, with up to 70% higher
strength and 65% lower weight than the totally filled sections. It was found that similar size
conventional steel-reinforced concrete sections of comparable stiffness have considerably lower
strength, while those of comparable strength have considerably higher stiffness than FRP-concrete
members. An analytical model was developed to predict the behaviour and failure loads of slabs
and girders, using cracked section analysis. A unique feature of the model is a multi-stepped
failure criteria check that can detect flexural, shear, or bond failure. The model was successfully
validated using the experimental results, and used in a parametric study. It was shown that using
the typical value of 1MPa for shear strength of cement mortar predicts debonding failure, which
occurs slightly above the interface, quite well. Also, in practical applications of longer spans,
flexural failure is likely to occur prior to bond failure. The effects of concrete strength, thickness
and configurations of the GFRP sheet pile, and varying the shear strength of the cement paste
were also explored.
i

ACKNOWLEDGEMENTS
I wish to express my deepest gratitude to my supervisor, Dr. Amir Fam, for the
extensive mentoring, training, support, and technical guidance he provided me with
throughout the tenure of this research work.
I would like to thank the technical staff of the Civil Engineering Department at
Queen's University, including Lloyd Rhymer, Jamie Escobar, Neil Porter, Stan Prunster,
Bill Boulton, Paul Thrasher, and especially Dave Tryon. I would also like to express my
appreciation for all of my fellow graduate students who helped my throughout my studies,
and to Elena Khazova for her assistance in completing the final stages of this research.
My profound gratitude goes to Mark Nelson; without his help, the breadth and depth of
this research would have truly been impossible.
I would like to extend my gratitude to Queen's University, the Intelligent Sensing
for Innovative Structures (ISIS Canada), and the Natural Sciences and Engineering
Research Council of Canada (NSERC) for their financial support. I would also like to
thank Sika Canada, Inc. for their in-kind donation of materials.
Special thanks goes to Baylee Madge for all of the assistance and support she
provided me with throughout my studies.
This thesis is dedicated to my parents, Gloria and Howard, and to my sister, Julia,
whose unconditional love and support will be forever appreciated.
ii

TABLE OF CONTENTS
ABSTRACT
ACKNOWLEDGEMENTS
TABLE OF CONTENTS
LIST OF TABLES
LIST OF FIGURES
NOTATIONS
CHAPTER 1: INTRODUCTION
1.1 General
1.2 Objectives
1.3 Scope
1.4 Outline of Thesis
CHAPTER 2: LITERATURE REVIEW
2.1 Introduction
2.2 Conventional Structural Form Systems
2.2.1 Prestressed Concrete Slab Forms
2.2.2 Corrugated Steel Forms
2.3 Flexural Behaviour of Pultruded FRP Sections
2.4 Bond Mechanism between Concrete and Structural Forms
2.4.1 Shear Strength of Adhesive Bond to Wet Concrete
2.5 Different Stay-in-Place Structural Open Formwork Systems
i
ii
iii
ix
x
xvii
1
1
2
3
4
6
6
7
7
8
9
11
13
14
iii

2.5.1 Hybrid FRP-Concrete Sandwich Panels
2.5.2 Steel-Free Composite Slab on Girder
2.5.3 FRP Box Girder with Concrete in the Compression Zone
CHAPTER 3: EXPERIMENTAL AND ANALYTICAL
INVESTIGATIONS OF GFRP STAY-IN-PLACE SYSTEM FOR
CONCRETE SLABS
3.1 Introduction
3.2 Experimental Program
3.2.1 Test Specimens and Parameters
3.2.2 Materials
3.2.2.1 Concrete
3.2.2.2 GFRP plates
3.2.2.3 Epoxy adhesives
3.2.2.4 Coarse aggregates
3.2.2.5 Mechanical shear connectors
3.2.3 Fabrication of Slabs
3.2.4 Test Setup and Instrumentation
3.3 Results of the Experimental Program
3.3.1 Effect of Bond Mechanism
3.3.2 Effect of Reinforcement Ratio
3.4 Analytical Model
3.4.1 Moment-Curvature Response
3.4.2 Failure Criteria
14
16
17
24
24
24
25
25
25
26
27
27
28
28
29
29
30
33
33
34
36
iv

3.4.2.1 Flexure
3.4.2.2 Diagonal Tension Shear
3.4.2.3 Bond
3.4.3 Validation of Model
3.4.4 Model Application to other Load Cases
3.5 Comparison with Conventional Reinforced Concrete Slabs
CHAPTER 4: EXPERIMENTAL INVESTIGATION OF GFRP STAY-
IN-PLACE SYSTEM FOR CONCRETE GIRDERS
4.1 Introduction
4.2 Experimental Program
4.2.1 Test Specimens
4.2.1.1 Geometric Configurations
4.2.1.2 Bond Mechanisms
4.2.1.3 Parameters Studied
4.2.2 Materials
4.2.2.1 Concrete
4.2.2.2 Grout
4.2.2.3 GFRP Sheet Pile Sections
4.2.2.4 GFRP plates
4.2.2.5 Epoxy adhesives
4.2.2.6 Coarse aggregates
4.2.2.7 Mechanical shear stud connectors
4.2.3 Fabrication of Test Specimens
36
36
37
40
41
41
53
53
53
53
54
55
56
57
57
57
58
59
60
61
61
61
v

4.2.4 Test Setup and Instrumentation
4.3 Results of the Experimental Program
4.3.1 Effect of Bond Mechanism
4.3.1.1 Effect on Stiffness
4.3.1.2 Effect on Strength and Failure Mode
4.3.2 Effect of Geometric Configuration
4.3.2.1 Effect on Stiffness
4.3.2.2 Effect on Strength
4.3.3 Performance under Negative Bending Conditions
4.3.3.1 General Behaviour
4.3.3.2 Comparison of Behaviour in Negative and Positive
Moments
4.4 Comparison with Conventional Reinforced Concrete and
Prestressed Sections
4.4.1 Comparison with Girder 6
4.4.2 Comparison with Girder 7
CHAPTER 5: ANALYTICAL MODEL OF GFRP STAY-IN-PLACE
SYSTEM FOR CONCRETE GIRDERS
5.1 Introduction
5.2 Description of Analytical Model
5.2.1 Constitutive Relationships
5.2.1.1 Concrete in Compression
5.2.1.2 Concrete in Tension
62
64
64
64
66
68
68
70
72
72
74
75
76
77
128
128
129
129
129
129
vi

5.2.1.3 GFRP Sections in Tension or Compression
5.2.2 Section Geometry
5.2.3 Algorithm for Moment-Curvature Response
5.2.4 Failure Criteria
5.2.5 Load-Deflection Predictions
5.3 Validation of Analytical Model
5.4 Parametric Study
5.4.1 Effect of Concrete Strength, fc’
5.4.2 Effect of Bond Strength and Shear Span-to-Depth Ratio
5.4.3 Effect of Angle of Webs of Sheet Pile Section
5.4.4 Effect of Thickness of Flanges of Sheet Pile Section
5.4.5 Effect of Width of Concrete Slab
CHAPTER 6: SUMMARY AND CONCLUSIONS
6.1 Introduction
6.2 Summary and Conclusions
6.2.1 One-Way Slabs with Flat Pultruded GFRP Sheets
6.2.2 Girders Using Trapezoidal GFRP Sheet Pile Sections:
Experimental Investigation
6.2.3 Girders Using Trapezoidal GFRP Sheet Pile Sections:
Analytical Investigation
6.3 Recommendations for Future Work
6.4 Practical Applications
131
132
135
136
140
141
142
143
143
145
146
147
168
168
168
168
170
172
174
176
vii

viii
REFERENCES
APPENDIX 1
APPENDIX 2
177
183
188

LIST OF TABLES
Table 3-1: Summary of test matrix
Table 3-2: Summary of test results
Table 3-3: Summary of model predictions
Table 4-1: Girder specimen descriptions
Table 4-2: Summary of girder test results
44
45
45
79
79
ix

LIST OF FIGURES
Figure 2-1: Conventional composite slab-on-girder construction using
corrugated steel form
Figure 2-2: Comflor Composite Floor System by Bailey Metal Products
Ltd.
Figure 2-3: A selection of commercially available FRP sections
Figure 2-4: Concrete and GFRP ribbed sheet hybrid section (Hall et al,
1998)
Figure 2-5: Bridge deck section with GFRP stay-in-place open form and
FRP grid reinforcement (Dieter et al, 2002)
Figure 2-6: Installation of FRP planks as stay-in-place open structural
forms for the deck of a bridge in Wisconsin (Bank et al, 2007)
Figure 2-7: Shear strength of cement mortar with varying amounts of
confining stress (σ) (Pluijm, 1993, and Hegemier et al, 1978)
Figure 2-8: Sandwich panel comprising a GFRP ribbed sheet and concrete
of two different densities (Keller et al, 2006)
Figure 2-9: Steel-free composite slab-on-girder design (Li et al, 2006)
Figure 2-10: Novel FRP/concrete hybrid flexural member (Deskovic et al,
1995)
Figure 3-1: GFRP plate bending test
Figure 3-2: Fabrication of slab test specimens
Figure 3-3: Test setup
Figure 3-4: Test results of slabs 1 to 4
19
19
20
20
21
21
22
22
23
23
46
46
46
47
x

Figure 3-5: Test results of slabs 5 to 8
Figure 3-6: Failure modes
Figure 3-7: Progression of interface bond stress distribution as load
increases in four-point bending
Figure 3-8: Experimental versus predicted moment-curvature responses
Figure 3-9: Progression of interface bond stress distribution under
uniform load
Figure 3-10: Comparison between slabs 5 and 7 and conventional RC slabs
Figure 4-1: Material data pertaining to GFRP sections
Figure 4-2: GFRP sections used to fabricate test specimens
Figure 4-3: Dimensions and test setup for girders 1 to 3
Figure 4-4 Dimensions and test setup for girder 4
Figure 4-5 Dimensions and test setup for girder 5
Figure 4-6 Picture of girder 4
Figure 4-7: Dimensions and test setup for girders 6 and 7
Figure 4-8: Dimensions and test setup for girder 8
Figure 4-9: Dimensions and test setup for positive bending of girder 9
Figure 4-10: Dimensions and test setup for negative bending of girder 9
Figure 4-11: Cross-section of girders 6, 7, and 8
Figure 4-12: Coupons used for assessing material properties of GFRP
sections
Figure 4-13: Stress-strain curves from coupon tension tests used to assess
material properties of GFRP sheet piles
49
50
51
51
52
80
83
84
85
86
87
88
89
90
91
92
92
93
xi

Figure 4-14: Stress-strain curves from coupon tension tests used to assess
material properties of GFRP plates
Figure 4-15: Application of M1 adhesive bond mechanism
Figure 4-16: M2 silica pebble aggregate bond mechanism
Figure 4-17: Headed and non-headed studs (bond mechanisms M3 and
M4)
Figure 4-18: Foam used to create void within Type 1 girder specimens
Figure 4-19: Concrete pour and vibration
Figure 4-20: Positive bending test setup
Figure 4-21: Negative bending test setup
Figure 4-22: Strain gauges at mid-span
Figure 4-23: Strain gauges and rosettes within shear span
Figure 4-24: PI gauges at mid-span
Figure 4-25: PI gauges within shear span
Figure 4-26: Linear potentiometers (LPs) at mid-span
Figure 4-27: Linear potentiometers (LPs) at ends of girder
Figure 4-28: Load-deflection responses of all girder specimens
Figure 4-29: Load-deflection responses of girder specimens 1, 2, and 3
Figure 4-30: Load-deflection responses of girder specimens 6 and 7
Figure 4-31: Load-deflection responses of girder specimens 1, 4, and 6
Figure 4-32: Load-deflection responses of girder specimens 5 and 8
Figure 4-33: Load-deflection responses of girder specimens 4 and 5
Figure 4-34: Load-deflection responses of girder specimens 7 and 8
94
94
95
95
96
96
97
97
98
99
100
101
102
103
104
105
105
106
106
107
107
xii

Figure 4-35: Load-deflection responses of girder specimens 7 and 9a in
positive bending
Figure 4-36: Load-deflection responses of girder specimens 8 and 9b in
negative bending
Figure 4-37: Moment-curvature response of girder specimens 1, 2, and 3
Figure 4-38: Moment-curvature response of girder specimens 6 and 7
Figure 4-39: Moment-curvature response of girder specimens 1, 4, and 6
Figure 4-40: Moment-curvature response of girder specimens 6 and 7
Figure 4-41: Moment-curvature response of girder specimens 5 and 8
Figure 4-42: Moment-curvature response of girder specimen 8 within
diaphragm region (constant moment zone), and within hollow
box region (shear span)
Figure 4-43: Moment-curvature responses of girder specimens 4 and 5
Figure 4-44: Moment-curvature responses of girder specimens 7 and 8
Figure 4-45: Moment-curvature responses of girder specimens 9a and 7
Figure 4-46: Moment-curvature responses of girder specimens 9b and 8
Figure 4-47: Load versus bond slip of girder specimens 1, 2, and 3
Figure 4-48: Load versus bond slip of girder specimen 4
Figure 4-49: Load versus bond slip of girder specimens 6 and 7
Figure 4-50: Load-strain responses of girder specimens 1, 2, and 3
Figure 4-51: Load-strain responses of girder specimens 6 and 7
Figure 4-52: Load-strain responses of girder specimens 1, 4, and 6
Figure 4-53: Load-strain responses of girder specimens 5 and 8
108
108
109
109
110
110
111
111
112
112
113
113
114
114
115
116
116
117
117
xiii

Figure 4-54: Load-strain responses of girder specimen 8 illustrating the
effect of the diaphragm within the constant moment zone
Figure 4-55: Load-strain responses of girder specimens 9a and 7
Figure 4-56: Load-strain responses of girder specimens 9b and 8
Figure 4-57: Bond failure in girders 1, 2, and 4
Figure 4-58: Pull-out of mechanism M3 studs in girder 3
Figure 4-59: Bond failure in girder 6
Figure 4-60: Delamination and crushing of concrete in girder 7
Figure 4-61: Lateral opening of sheet pile in girder 5
Figure 4-62: Buckling and crushing of webs and compression flange of
girder 8
Figure 4-63: Warping and local buckling of upper flange of girder 9 in
positive bending (9a)
Figure 4-64: Hypothetical conventional RC sections designed to match
strength and stiffness of girders 6 and 7
Figure 4-65: Hypothetical conventional prestressed concrete sections
designed to match the strength of girders 6 and 7
Figure 4-66: Moment-curvature response of RC6a, RC6b, and girder 6
Figure 4-67: Moment-curvature response of PS6a and girder 6
Figure 4-68: Moment-curvature response of RC7a, RC7b, and girder 7
Figure 4-69: Moment-curvature response of PS7a and girder 7
Figure 5-1: Stress-strain relationship for concrete in uniaxial compression
and tension
118
119
119
120
120
121
121
122
122
123
124
125
126
126
127
127
149
xiv

Figure 5-2: Stress distribution in Type 2 specimens in positive bending
(girder 4)
Figure 5-3: Assumed geometry of different sections
Figure 5-4: Discrete regions in cross-sectional geometry
Figure 5-5: Flow chart illustrating algorithm used for determining
moment-curvature response
Figure 5-6: Section transformation accounting for variable elastic
modulus in concrete
Figure 5-7: Schematic of the process for determining load-deflection
response
Figure 5-8: Experimental versus predicted moment-curvature responses of
girder specimen 1
Figure 5-9: Experimental versus predicted moment-curvature responses of
girder specimen 4
Figure 5-10: Experimental versus predicted moment-curvature responses of
girder specimen 6
Figure 5-11: Experimental versus predicted moment-curvature responses of
girder specimen 7
Figure 5-12: Experimental versus predicted load-deflection responses of
girder specimen 1
Figure 5-13: Experimental versus predicted load-deflection responses of
girder specimen 4
Figure 5-14: Experimental versus predicted load-deflection responses of
girder specimen 6
150
151
152
153
154
155
156
156
157
157
158
158
159
xv

xvi
Figure 5-15: Experimental versus predicted load-deflection responses of
girder specimen 7
Figure 5-16: Moment-strain response of girder specimen 1
Figure 5-17: Moment-strain response of girder specimen 4
Figure 5-18: Moment-strain response of girder specimen 6
Figure 5-19: Moment-strain response of girder specimen 7
Figure 5-20: Effect of concrete strength (fc’)
Figure 5-21: Effect of bond strength (τult) when various shear spans are
used
Figure 5-22: Effect of web angle (θ)
Figure 5-23: Effect of flange thickness (t)
Figure 5-24: Effect of slab width (B)
159
160
160
161
161
162
163
164
165
166

NOTATIONS
B Total width of section
Bi Total width of the section at the elevation or layer number (i) of interest
Blf Width of lower flange of GFRP sheet pile section
Bwt Distance between outer surfaces of webs of GFRP sheet pile section at the
location where the webs meet the lower surface of the upper flanges
c Depth to neutral axis measured from extreme compression fibre
d Depth of slab specimens measured from extreme compression fibre to
centroid of flat GFRP plate
dTS Thickness of region within which tension stiffening is effective
dx Length of discrete region of interest along the length of the beam
Ec Secant elastic modulus of concrete taken between a stress of 0 and 0.4 fc’
Eci Secant elastic modulus of concrete taken at layer i
Eck Secant elastic modulus of concrete taken at layer k
Eco Elastic modulus of unstrained concrete
Ef Elastic modulus of FRP
fc Stress in concrete
fc’ Peak strength of concrete
fci Stress in concrete in layer i
fck Stress in concrete in layer k
fr Rupture stress of concrete
Hpile Total depth of the trapezoidal GFRP sheet pile sections
xvii

i Summation of all layers from the bottom of the section to the elevation of
interest
Ixx Second moment of inertia of the section about its x-x neutral axis
M Bending moment induced on the section
Mcr Bending moment at which concrete first cracks
Mi Bending moment at location or discrete region of interest along the length
of the beam
Mr (bond) Bending moment in section at time of ultimate failure due to bond
Mr (bond-final) Bending moment in section at time of final bond failure
Mr (bond-initial) Bending moment in section at time of initial bond failure
Mr (flexure) Bending moment in section at time of flexure failure
Mr (shear) Bending moment in section at time of shear failure
Mr Bending moment in section at time of failure
Qi First moment of areas of all layers in the section either above or below the
elevation or layer number (i) of interest
t Thickness of a discrete layer within a section being modeled
tflange Thickness of the flanges of the GFRP sheet pile section
tweb Thickness of webs of GFRP sheet pile section
V Vertical shear force
Vc Contribution of vertical shear strength provided by concrete
Wconcrete Width of concrete present within a single discrete layer of the section
being modeled
WGFRP Width of GFRP present within a single discrete layer of the section being
modelled
xviii

xix
α1 Tension stiffening coefficient accounting for bond characteristics of
reinforcement
α2 Tension stiffening coefficient accounting for sustained or repeated loading
γc Density of concrete
δ Total mid-span deflection of the beam
Δvi Change in deflection of beam within a discrete region of interest along the
length of the beam
Δθi Change in slope of beam within a discrete region of interest along the
length of the beam
εc Strain in concrete
εc’ Strain in concrete when stress equals fc’
εcc Crushing strain of concrete
εfc Crushing strain of FRP
εfr Rupture strain of FRP
εr Rupture strain of concrete
θ Angle of the webs of the GFRP sheet pile section measured relative to the
vertical
θi Slope of beam within a discrete region of interest along the length of the
beam
τ Shear stress
τult Ultimate bond strength at concrete/GFRP interface
ψ Curvature, measured as the strain gradient through a cross section
Ψ Curvature at location or discrete region of interest along the length of the
beam

CHAPTER 1: INTRODUCTION
1.1 General
Conventional reinforced concrete structures are fabricated by casting concrete in
temporary forms that are usually made from wood or steel. The forms are often held in
place by temporary shoring or scaffolding structures. Upon hardening of the concrete, the
forms and shoring are removed, revealing the concrete structure within. Stay-in-place
formwork is a system that is not intended to be removed upon hardening of concrete for
one or more reasons, often related to the speed and ease of construction. In this case, it is
logical to design the system to provide a structural contribution, essentially as tension
reinforcement. Open forms are particularly well suited for applications where positive
bending is involved. This is because the inherent location of the formwork, at the bottom
of the member, allows it to provide tensile reinforcement for resisting positive moments.
This resistance, however, can only occur if sufficient shear connection exists between the
concrete and the formwork.
The elimination of conventional rebar cages can significantly simplify the
engineering and detailing process, as well as saving a great deal of time and effort during
construction. It can also help to improve the longevity of the system by eliminating steel
reinforcements that are susceptible to corrosion. Numerous corrosion-resistant stay-in-
place open structural formwork systems have been explored in recent years (Cheng et al,
2006). They often utilize fibre reinforced polymer (FRP) materials. It should be noted
that FRP materials still have a relatively short track record in structural applications,
relative to steel. As such, their long term durability is yet to be confirmed. Since this
type of formwork is typically mass produced using FRP pultrusion in factories, it is ready
1

to be used immediately when it arrives at the construction site. It is also relatively light
weight, so forms can be shipped, maneuvered, and installed by a few workers without the
aid of heavy machinery. Since these forms have excellent stiffness and dimensional
stability, the need for scaffolding or shoring is greatly reduced or eliminated completely.
In this case, the FRP formwork can simply be rested on supports at either end of the span,
and then the concrete can be poured onto the formwork. In essence, the resultant member
is a concrete/FRP hybrid member in which each of these materials is utilized efficiently;
the FRP resists tension, and the concrete primarily resists compression. While the initial
cost of FRP stay-in-place forms is likely greater than that of conventional concrete forms
fabricated from wood or steel, this additional cost would be offset by improved ease and
speed of erection, and reduced life-cycle costs of the overall structure due to superior
longevity and durability.
1.2 Objectives
The primary objective of this study is to assess the performance of pultruded
GFRP sections as stay-in-place structural open formwork for concrete flexural members,
as well as to investigate some of the logistical details that arose while developing such a
structural system. The main topics addressed by this study are:
1. Assessment of the performance of various adhesive and mechanical bond
mechanisms at the concrete/FRP interface.
2. Studying both slab and girder systems using flat FRP sheets and trapezoidal FRP
sheet pile sections, respectively.
3. Examining the various failure modes of slabs and girders.
2

4. Assessing the effect of introducing voids within the tension region of the concrete
girder, essentially creating a box section to reduce self weight.
5. Developing an all-GFRP box girder by adhering flat pultruded GFRP sheets to the
trapezoidal GFRP sheet pile sections. The box section was then used as a stay-in-
place structural form for a thin concrete slab.
6. Studying the girder systems in both positive and negative bending to simulate
continuity.
7. Compare the flexural performance of the hybrid concrete-FRP slab and girder
systems tested in this study to conventional steel-reinforced slabs and girders.
8. Develop analytical models to help understand the structural behaviour of the slabs
and girders, with an emphasis on bond behaviour at the FRP/concrete interface.
The model is also used to study the following parameters for the girders: concrete
strength (fc’), bond strength (τult) at the concrete/FRP interface, angle of webs of
the GFRP sheet pile section, thickness of the GFRP flanges, and width of the
concrete slab over the sheet pile section.
1.3 Scope
The scope of this study includes experimental investigations and analytical models
of the behaviour of flexural concrete members reinforced with GFRP stay-in-place
structural open formwork.
The experimental investigation was intended to assess the feasibility of using
commercially available, mass produced, pultruded GFRP sections as stay-in-place
structural open forms for concrete slabs and girders. Eight one-way slabs and nine
girders were constructed and tested in four-point quasi-static uniaxial monotonic bending.
3

These tests were used to quantify the performance of the concrete/GFRP hybrid system,
and to investigate the performance of various bond mechanisms at the concrete/GFRP
interface. The tests were also used to refine and optimize the cross-sectional geometry of
such members by assessing the effects of several geometric variations such as the
inclusion of a void within the tension region of the concrete, and the use of all-GFRP box
girder sections.
The analytical model was developed to test theories and concepts pertaining to the
complex mechanical behaviour of the aforementioned structural system. The model uses
cracked section analysis, using a layer-by-layer technique in order to establish the flexural
response of the member. It accounts for the non-linearity of the concrete in the section,
and adopts conventional empirical tension stiffening theories. As the model synthesizes
the flexural response of the member, it simultaneously checks various failure criteria such
as flexural tension or compression failure, concrete shear failure by diagonal tension, and
bond failure at the concrete/GFRP interface. Once the model was fully developed and
verified, it was used in a parametric study to examine different types and ranges of
parameters beyond the limitations of the experimental program.
1.4 Outline of Thesis
The contents of this thesis are listed below:
Chapter 2: A brief review of literature pertaining to the topics studied in this
investigation.
Chapter 3: A manuscript that experimentally and analytically investigates concrete slabs
reinforced with flat GFRP sheets using various bond mechanisms at the concrete/GFRP
interface, various concrete thicknesses, and various spans.
4

5
Chapter 4: A manuscript that experimentally investigates concrete girders reinforced with
trapezoidal GFRP stay-in-place structural open forms composed of commercially
available sheet pile sections. Different bond mechanisms, cross-section configurations,
and the effects of positive and negative bending are assessed.
Chapter 5: A manuscript that presents an analytical model of the girders discussed in
chapter 4. The model is then used for a parametric study.
Chapter 6: Several conclusions that were drawn from this investigation, as well
recommendations for further work in this area of research.
References
Appendix: A detailed description of the experimental method used, as well as the
FORTRAN90 code used for some of the analytical models.

CHAPTER 2: LITERATURE REVIEW
2.1 Introduction
Fibre Reinforced Polymers (FRPs) have generated a great deal of interest in the
structural engineering research field, due to their excellent physical and mechanical
properties, including corrosion resistance, low self weight, and high tensile strength. The
concept of structurally integrated formwork for concrete structures first emerged in 1901
when Sewell developed concrete-filled steel tubes (CFST) for columns and piles for
offshore structures (Gardner and Jacobson, 1967). Concrete-filled FRP tubes (CFFTs)
then emerged in the 1990s, taking advantage of FRP tubes as a noncorrosive alternative to
steel tubes. In addition to the aforementioned qualities of FRP materials, CFFTs benefit
from exceptional ease of construction because the FRP tube behaves as a stay-in-place
structural form that replaces internal steel reinforcement. Under applied loads, the FRP
tube acts as reinforcement that contributes to shear and flexural strength, in addition to
providing the concrete core with confinement that can significantly improve compressive
strength and prevent moisture intrusion. This synthesis of admirable qualities has made
CFFTs an attractive system that has been researched mainly by two major groups
(Mirmiran and Shahawy, 1997, and Fam and Rizkalla, 2001). This research has revealed
many of the inherent advantages of FRP stay-in-place structural formwork, and has
subsequently triggered interest in other types of FRP stay-in-place form systems. A
comprehensive literature review on stay-in-place closed structural forms can be found in
Chapter 9 of the ACI 440R-07 report.
Recently, there has recently been an interest in studying stay-in-place open forms.
The term open formwork refers to formwork that does not completely enclose the
6
concrete within. This type of formwork is essentially a basin into which the concrete is
poured. Stay-in-place open structural forms are particularly well suited for applications
where positive bending is present. This is because the inherent location of the formwork
(at the bottom of the member) allows it to provide tensile reinforcement for resisting
positive bending moments. As a result, the majority of research performed on this topic
has been related to slabs and beams.
This chapter generally reviews research that has been performed on stay-in-place
open structural formwork for reinforced concrete flexural members. In particular, the
chapter addresses FRP profiles that have potential as structural forms, various bond
mechanisms, and flexural members that have been developed and studied. First, two
conventional open form systems using steel and concrete materials are introduced.
2.2 Conventional Structural Form Systems
2.2.1 Prestressed Concrete Slab Forms
This system of open formwork comes in the form of very thin precast concrete
panels, pretensioned using steel tendons, and is used in bridge deck applications. The
panels are placed across the girders of the bridge, and concrete is then cast in place on the
panels. The panels are designed to bear the weight of fresh concrete to avoid the need for
shoring during construction. After the concrete has hardened, the system becomes fully
composite. Chapter 16.2 of the PCI Bridge Design Manual (PCI, 2001) recommends a
design procedure for implementing this technology. A newer version of this technology
has been proposed (Badie et al, 1998) in order to improve composite action between slabs
and bridge girders, as well as to improve the performance of the system in negative
7

bending applications. Clearly, the presence of steel prestressing tendons renders this
system susceptible to corrosion.
2.2.2 Corrugated Steel Forms
Corrugated steel floor deck is essentially a stay-in-place open formwork for
concrete slab applications. The corrugated shape of the steel sheet provides adequate
flexural stiffness to bear the weight of the concrete before it hardens. Many steel decking
systems also incorporate surface deformations so that a mechanical interlock may occur
between the concrete and the steel form, thus resulting in composite action, which
contributes to the flexural strength and stiffness of the concrete slab. Figure 2-1 is a cut-
away drawing of a typical composite slab-on-girder floor.
Bailey Metal Products Ltd. has developed a steel stay-in-place structural open
formwork system that is essentially an enlarged version of the aforementioned corrugated
steel deck section. The product (Comflor Composite Floor System) is essentially a cold-
formed stamped galvanized steel sheet that is trapezoidal in section, as shown in Figure 2-
2. Multiple sections can be joined together in a tongue-and-groove fashion in order to
create a large corrugated sheet of any size. The corrugations in this product feature a
larger amplitude and wavelength than conventional corrugated steel decking. The sheet
metal of these sections is also stamped with ribs running transversely on all surfaces
(webs and flanges). The primary purpose of these ribs is to provide mechanical interlock
between the steel forms and the concrete overlay in order to ensure that full composite
action can be achieved. Upon completion, the system essentially takes the form of many
reinforced concrete T-beams running parallel to one-another, as shown in Figure 2-2. It is
designed for flooring, roofing, and decking applications. The steel section itself is stiff
8

enough that it can serve as a stable working platform prior to pouring concrete, and is
capable of supporting the self-weight of fresh concrete without the aid of shoring.
It has been well established that the use of stay-in-place forms trap moisture
within the concrete, which can cause harmful chloride attack leading to accelerated
corrosion (Kuennen, 2006). Corrosion of conventional steel reinforcing bars can be
structurally detrimental due to the loss of cross-sectional area, and spalling of concrete
covers. Similarly, corrosion of steel open structural formwork, if not protected or
galvanized, would cause reduction of cross-sectional area of the form, as well as a loss of
the crucial bond between the steel form and the concrete overlay. Therefore, the use of
FRP materials for these stay-in-place structural open forms could be a suitable alternative.
2.3 Flexural Behaviour of Pultruded FRP Sections
Several pultruded FRP sections are now commercially available and have the
potential to be used as stay-in-place structural forms for concrete structures. Figure 2-3
shows some of these off-the-shelf sections of different configurations. Of particular
interest is the trapezoidal section shown in Figure 2-3(e), which is produced as a sheet
pile section. This section, as well as the flat sheet shown in Figure 2.3(a), are used in this
study as stay-in-place forms. A series of flexural tests were performed on pultruded
GFRP sheet pile sections in order to characterize their behaviour for use in waterfront
retaining structures (Shao, 2006). The sections tested were not identical to those studied
in this thesis, but are similar enough such that the test results could provide important
information regarding failure modes and general flexural behaviour. Flexural and shear
stiffnesses were determined using a multiple-span test method. The following equation
describes deflection (δ) with respect to shear stiffness (GkA), flexural stiffness (EI), load
9

(P), and span (L), where C1 and C2 are coefficients that are dependent upon the loading
configuration.
PLGkACPL
EIC 231 +=δ (2-1)
Multiple spans and loading configurations were used in order to solve for the two
coefficients, and subsequently determine the proportion of the deflection that was caused
by shear deformation. Moment resistance was determined by applying a uniformly
distributed load using an air bag. The profile was found to have a non-linear response,
probably arising from the local buckling and flattening of the section. As a result,
Equation 2-1 underestimated deflection at failure by 18%. Local buckling of the section
was a significant problem. Transverse ties were used to prevent opening of the section.
Under large deflections, the longitudinal stresses in a flexural member tend to produce a
vertical component that compresses the cross-section of the member, due to large
curvature. In essence, the extreme tension and compression fibres tend to be forced
toward each other in regions of large curvature. This phenomenon is quite similar to
ovalization exhibited by round hollow tubes undergoing bending (Ibrahim, 2000). As a
result, the trapezoidal sheet pile section tends to flatten when experiencing large bending
moments and curvatures. Consequently, the depth of the section would be reduced,
which would effectively reduce the moment of inertia of the section. For this flattening to
occur, the section must be able to expand laterally as the webs rotate outward. By
installing horizontal ties, the sections were restrained from this expansion, and flattening
was prevented. This flattening effect may also be prevented by placing multiple sheet
piles side-by-side because they would restrain each other from lateral expansion.
10
2.4 Bond Mechanisms between Concrete and Structural Forms
In order to ensure that stay-in-place open structural forms contribute as tension
reinforcement in flexure, it is crucial that an adequate shear connection exists between the
concrete and the form. A study was carried out (Hall et al, 1998) on a hybrid concrete-
FRP section incorporating FRP stay-in-place open structural form. Ribbed FRP sheets, as
the one shown in Figure 2-3(b) produced as floor panels, provided tensile reinforcement,
and behaved as permanent stay-in-place open structural formwork for the concrete slab
overlay, as shown in Figure 2-4. The resultant concrete-FRP hybrid beams were tested in
four-point bending. Initially, it was found that a significant amount of horizontal shear
slippage occurred between the concrete and the FRP formwork. This severely limited the
flexural capacity of the member since a large strain lag existed between the concrete and
FRP. In an attempt to combat the aforementioned problem, adhesive bonding was used.
This was accomplished by applying adhesive directly to the surface of the FRP formwork
immediately prior to pouring concrete. This adhesive was specially formulated for
bonding to fresh wet concrete. The resultant system behaved monolithically during
positive bending. The observed mode of failure was diagonal tension shear cracking in
the concrete, which can likely be attributed to the absence of shear reinforcement within
the concrete, and the fact that the beams were designed to be over-reinforced. Tension
cracking of concrete was severe in the vicinity of the longitudinal stiffening ribs of the
FRP sheet. Overall, the concept of applying adhesive to the formwork prior to pouring
concrete appears to have yielded positive results. It is an advantageous technique from a
fabrication standpoint because it eliminates the need for mechanical shear studs or a
bonded coarse aggregate coating on the surface of the formwork, both of which would be
far more time consuming to install than an adhesive coating.
11

Another study was carried out (Dieter et al, 2002) on a hybrid concrete-FRP stay-
in-place open structural formwork and FRP grid reinforcement for bridge deck
applications. A pultruded FRP sheet stiffened by hollow FRP box sections, like the one
shown in Figure 2-3(d), provided tensile reinforcement, and functioned as stay-in-place
structural open formwork for the concrete slab overlay. A bi-direction grid composed of
pultruded FRP elements provided the upper longitudinal and transverse reinforcement for
regions of negative bending moments. A cut-away photograph of this system is shown in
Figure 2-5. In order to generate sufficient shear bond between the FRP stay-in-place
form and the concrete slab overlay, the surface of the FRP form was roughened prior to
pouring the concrete by coating it with a mixture of epoxy and gravel. Due to the
complex geometry of the formwork, this mechanism was only applied to horizontal
surfaces. This was found to have a detrimental effect on the bond performance. In
regions where the bond mechanism was absent, severe slippage occurred between the
form and the concrete overlay. As a result, the flexural crack pattern in the concrete over
unbonded regions was considerably more pronounced than it was in bonded regions.
A similar study (Bank et al, 2007) was carried out on concrete slabs cast on
pultruded FRP planks resembling the section shown in Figure 2-3(b), which provided
tensile reinforcement and acted as stay-in-place structural open forms. The bond
mechanism that was provided between the concrete and FRP consisted of a rough coating
comprising a mixture of epoxy and aggregates; however, the size of aggregates used was
varied (both gravel and sand were used) in order to study the effect that this had on the
flexural performance of the system. It was shown that the finer sand coating lead to a
higher initial cracking moment than was achieved when the gravel coating was used.
This study illustrated the feasibility of using the aforementioned FRP planks as stay-in-
12

place open structural forms for concrete slabs, and showed that the planks functioned as
flexural reinforcement when the aggregate coating was employed. It was shown that the
provisions of the ACI 440.1R-06 code can be used to accurately predict the flexural
capacity of such structural systems; however, shear capacity can be more accurately
predicted using the ACI 318-05 code. The technologies developed in this study were
later used in a bridge that was constructed in Wisconsin in 2007, as shown in Figure 2-6,
in order to create slabs across the main girders of the bridge.
2.4.1 Shear Strength of Adhesive Bond to Wet Concrete
Most adhesive systems intended for bonding to wet concrete have higher tensile
and shear strengths than concrete. In fact, manufacturers of such adhesives will often
claim tensile strengths in the order of 30MPa, and diagonal shear bond strengths
(determined in accordance with ASTM C882) of approximately 10MPa. However, if a
shear bond failure is to occur between a stay-in-place form and its overlying concrete, it is
expected that this failure will occur slightly above the level of the adhesive through a
plane within a thin layer of cement mortar, which is the weakest plane. The concrete is
poured directly onto the adhesive; therefore, the adhesive is actually bonding to the
concrete mortar. Consequently, it is unlikely that any coarse aggregates will intersect the
shear failure plane. Therefore, the shear bond strength of this system will likely be equal
to the shear strength of the cement mortar.
A study conducted on the shear behaviour of masonry bed joints indicates that the
shear strength of mortar is extremely sensitive to confining stress (Pluijm, 1993). In this
study, a confining stress of 1MPa yielded a shear strength of approximately 2MPa;
whereas in the absence of any confining stress, a shear strength of approximately 1MPa
13

was observed. Another study (Hegemier et al, 1978) conducted on the behaviour of
concrete masonry joints further supports the validity of these values. Figure 2-7 shows
some relevant data yielded by these two studies. It is important to note that ASTM C882
inherently introduces normal confining stresses in conjunction with the desired shear
stresses. It also allows strength to be calculated simply by dividing ultimate load by the
cross-sectional area of the failure plane, without adjusting for the fact that the failure
plane is not parallel to the direction of the applied load. Therefore, it is not surprising that
adhesive manufacturers are capable of generating such high values of diagonal shear bond
strength (10MPa) when using ASTM C882 tests.
In the context of horizontal shear between concrete and GFRP stay-in-place open
structural forms in flexure, confining stresses are generally low and limited to the loading
and supporting points. Therefore, the unconfined bond shear strength of any adhesively
bonded system can be expected to be approximately 1MPa when coarse aggregates do not
intersect the failure plane, thereby forcing the failure plane to pass through a thin layer of
cement mortar slightly above the bond line.
2.5 Different Stay-in-Place Structural Open Formwork Systems
2.5.1 Hybrid FRP-Concrete Sandwich Panels
A sandwich panel is a flexural member consisting of a light-weight core that is
sandwiched between two relatively stiff skins. The concept behind sandwich panels is
that the skins are responsible for the longitudinal (tensile and compressive) stresses
associated with flexure, whereas the light-weight core is responsible for the shear stresses
involved. The core also acts as a spacer that separates the skins in order to increase the
14

depth of the section, thereby increasing the moment of inertia. This drastically increases
flexural stiffness and strength with only a minimal increase in the mass of the specimen.
A study was carried out (Keller et al, 2006) on a hybrid FRP-concrete sandwich
bridge deck panel. The tension skin of the panel comprised a commercially available
pultruded GFRP decking sheet with integrated ribs (Figure 2-3(b)). The core of the panel
was made from light weight concrete (densities of 900 and 1300 kg/m3 were used). The
top compression skin of the panel was made from a thin layer of normal density concrete.
The GFRP tension skin behaved as a stay-in-place open structural form for the two layers
of concrete that were poured onto it. This was only possible because the specimen was
designed for positive bending moments. Figure 2-8 is a rendering showing this sandwich
panel section. These sandwich panels were tested in flexure using a three-point bending
set-up. In some panels, the FRP tension skin was not bonded to the concrete. These
panels attempted to rely upon mechanical interlock between the concrete and the ribs of
the pultruded FRP decking panels in order to provide shear connection. However,
because the ribs of the FRP panels were oriented longitudinally, this shear connection
proved to be insufficient. As a result, significant slippage was observed between the light
concrete core and the FRP tension skin, thus reducing composite action between these
two materials. Consequently, tensile stresses within the light concrete core escalated,
leading to flexural failure by tension cracking of the concrete. In order to counter these
effects, some of the sandwich panels were fabricated using an adhesive bond between the
light weight concrete core and the FRP decking panels. These panels failed by horizontal
shear within the light concrete core itself prior to any bond failure occurring in the
vicinity of the concrete/FRP interface.
15

The idea of utilizing lightweight materials in regions of low flexural stresses (near
the neutral axis) is quite attractive because it can significantly reduce the self-weight of a
member without an excessive loss of flexural stiffness or strength. However, it is
important to recognize that the implementation of such a technology could shift the
design to one that is limited by its shear strength.
2.5.2 Steel-Free Composite Slab on Girder
Typical composite slab on girder construction involves steel I-girders and
corrugated steel floor decks that are overlain with a concrete slab. A similar system was
investigated (Li et al, 2006) in which both the steel girder and form were replaced with
GFRP sections of comparable dimensions. The system consisted of a pultruded GFRP I-
beam (with unidirectional longitudinal fibres) overlaid by pultruded GFRP ribbed sheets
(E-shaped sections) oriented horizontally. These ribbed sheets (Figure 2-3(c)) acted as
permanent stay-in-place formwork for the concrete slab which was poured on top of the
sheets, as shown in Figure 2-9. The ribs on these E-shaped sections were oriented
transversely in order to provide adequate stiffness so that these sheets could bear the
weight of the wet concrete. This also could potentially aid in providing the completed
system with improved flexural strength and stiffness in the transverse direction; however,
this characteristic was not studied. FRP bolts were used to connect the E-shaped sections
to the I-beams. These bolts also behaved as shear studs in order to ensure monolithic
composite action between the concrete slab and the FRP sections. The resultant
composite girders were tested in four-point bending. Concrete strength and slab thickness
were the primary test parameters varied; however, some specimens also included a
laminate of carbon-FRP (CFRP) bonded to the bottom flange of the I-beam to improve
16

flexural stiffness and strength. The general mode of failure observed was horizontal shear
cracking of the web of the GFRP I-beam. This proved to be a very brittle mode of failure.
The specimens with thicker concrete slabs gave some warning of failure when the bottom
of the concrete slab began to crack. This, however, was unrelated to the shear failure
mode. It simply illustrated that the neutral axis in this specimen was located within the
concrete slab. These cracks served as an indication that large deflections were occurring.
The stiffness of the members was largely dictated by the thickness of the concrete slab. A
relatively large percentage of deflections were caused by shear deformations occurring
within the web of the girder. As a result, the CFRP layers provided very little
contribution to stiffness. Also, since the specimens ultimately failed in shear, the addition
of the CFRP layers yielded no increase in ultimate strength.
2.5.3 FRP Box Girder with Concrete in the Compression Zone
A novel FRP/concrete hybrid flexural member was proposed (Deskovic et al,
1995) in order to mitigate the shortcomings of structural members composed of these
materials used independently. The new member is composed of a GFRP rectangular box
section that is overlain with a concrete slab (Figure 2-10), and is intended for applications
where positive bending is to be resisted. The concrete slab behaves as the compression
flange of the member. The upper flange of the GFRP box section behaves as a stay-in-
place form for the concrete slab, which simplifies the construction process considerably.
Bond between the concrete and the GFRP section is facilitated by the application of a
two-part epoxy adhesive prior to pouring the wet concrete. The hybrid member also
included a CFRP laminate bonded to the bottom surface of the lower (tension) flange of
the GFRP box section, to increase flexural stiffness. Also, because CFRP has a lower
17

18
failure strain than that of GFRP, the CFRP layer would fail prior to the tension flange of
the GFRP section, thus providing warning signs of imminent flexural failure
(pseudoductility). This is important since FRP and concrete are both brittle materials that
do not provide obvious warning signs prior to failure. A number of potential failure
mechanisms have been studied analytically for this hybrid member. The webs may
buckle or fracture, resulting in shear failure; one of the beam’s elements could exhibit a
flexural failure; the bond between the GFRP section and the concrete slab could fail; and
the concrete slab could fail in diagonal shear. The most common mode of failure
observed experimentally was debonding between the GFRP section and the concrete slab.
Despite this unfortunate premature failure mode, the flexural response of the specimens
showed good pseudoductility as a result of the CFRP laminate tension failure. This study,
like the other ones presented earlier, highlighted the potential of hybrid members
composed of hollow GFRP sections overlain with concrete slabs, but it also illustrated
that such hybrid systems are highly dependent upon the quality of the shear bond between
the concrete and the GFRP section.

Figure 2-1. Conventional composite slab-on-girder construction using corrugated steel form
Permanent steel form
Concrete
Figure 2-2. Comflor Composite Floor System by Bailey Metal Products Ltd.
19

Figure 2-3. A selection of commercially available FRP sections
(a)
(b) (c)
(d)
(e)
Figure 2-4. Concrete and GFRP ribbed sheet hybrid section (Hall et al, 1998)
20
Concrete
GFRP Form

Figure 2-5. Bridge deck section with GFRP stay-in-place open form and FRP grid reinforcement (Dieter et al, 2002)
Figure 2-6. Installation of FRP planks as stay-in-place open structural forms for the deck of a bridge in Wisconsin (Bank
et al, 2007)
21

Figure 2-8. Sandwich panel comprising a GFRP ribbed sheet and concrete of two different densities (Keller et al, 2006)
Normal density concrete
Light weight concrete
22
GFRP Form
Figure 2-7. Shear strength of cement mortar with varying amounts of confining stress (σ) (Pluijm, 1993, and Hegemier
et al, 1978)
(Pluijm, 1993)
(Hegemier et al, 1978)

Figure 2-9. Steel-free composite slab-on-girder design (Li et al, 2006)
Figure 2-10. Novel FRP/concrete hybrid flexural member (Deskovic et al, 1995)
Concrete
GFRP
CFRP
23
Concrete
GFRP Form
GFRP Beam

CHAPTER 3: EXPERIMENTAL AND ANALYTICAL INVESTIGATIONS OF
GFRP STAY-IN-PLACE SYSTEM FOR CONCRETE SLABS
3.1 Introduction
This chapter provides experimental and analytical investigations into the behavior
of one-way concrete slabs cast on glass-fiber reinforced polymer (GFRP) plates used
simultaneously as formwork and as tension reinforcement. Eight slabs were fabricated
and tested in four-point bending to investigate various bond systems and GFRP plate
reinforcement ratios. Bond systems included fresh concrete adhesively bonded to the
plate, coarse aggregates bonded to the plate prior to casting, and GFRP and steel
mechanical shear connectors. The performance of these bond systems was objectively
assessed and the failure modes were examined. The effect of altering the reinforcement
ratio of the slab was examined by testing slabs of varying thicknesses while using a
constant thickness of GFRP. A general analytical model has been developed to predict
the full behavior and strength of the slabs, and was successfully verified. The model is
able to detect various failure modes, including GFRP plate debonding. The performance
of the slabs was compared with conventional steel reinforced concrete slabs of similar
dimensions.
3.2 Experimental Program
The following sections provide details of test specimens and parameters,
fabrication, instrumentation and test procedures of the concrete slabs.
24

3.2.1 Test Specimens and Parameters
Eight slabs, referred to as 1 to 8, were fabricated and tested. Table 3-1 provides a
summary of the test matrix, including dimensions, spans, reinforcement ratios and the
bond mechanisms. Slabs 1 to 4 were 1220 x 400 x 160mm, and were tested to compare
different bond mechanisms: (a) concrete cast on wet adhesive, (b) coarse aggregates
adhesively bonded to the GFRP plate prior to concrete casting, (c) GFRP shear
connectors, and (d) steel shear connectors. Slabs 5 to 8 were 2440 x 400mm and their
thicknesses varied. Slabs 5 to 7 all had a wet adhesive bond and their thicknesses varied
from 110 to 210mm, which provided a GFRP reinforcement ratio ranging from 8.5 to 4.3
percent, respectively. This ratio is defined as the ratio between the cross-sectional area of
the GFRP plate and concrete. It should be noted that because the GFRP plate used has a
fixed thickness, the concrete slab thickness was varied to achieve the different
reinforcement ratios (i.e. it was not possible to assess this parameter using the
conventional technique of varying the amount of reinforcement in a cross-section of fixed
dimensions). Slab 8 was quite similar to slab 6, except it utilized adhesively bonded
coarse aggregates, also to examine different bond mechanisms in long slabs. The shear
span-to-depth (a/d) ratio of slabs 1 to 4 was relatively small (2.4) (i.e. shear-bond critical),
whereas (a/d) of slabs 5 to 8 ranged from 4.7 to 9.2 (i.e. flexural-bond critical).
3.2.2 Materials
3.2.2.1 Concrete – All specimens were fabricated using the same batch of concrete. The
concrete was designed to have a compressive strength of 35MPa at 7 days, using high-
early strength cement. The maximum aggregate size was 14mm, and slump was 152mm.
Concrete cylinders, 102 x 203mm, were made from the same batch of concrete. At the
25

time of testing, the average concrete strength and standard deviation were 36MPa and
1.72MPa, respectively, determined in accordance with ASTM C39. More detailed
statistical data on the concrete strength can be found in Table A1 of Appendix 1.
3.2.2.2 GFRP plates – Commercially available 9.5mm thick GFRP flat plates were
received in a standard size of 1220 x 2440mm. The plates consisted of alternating layers
of unidirectional E-glass roving and random mats, impregnated with polyester resin.
Based on the manufacturer reported data (Figure 4-1(c)), the tensile strength and modulus
in the longitudinal direction were 138MPa and 12.4GPa, respectively, and in the
transverse direction were 69MPa and 6.9GPa, respectively. The bearing strength of the
plate was 220MPa. Three plate bending tests were carried out by the author on 340 x
102mm coupons, to establish the longitudinal elastic modulus. The coupons were tested
in four-point bending, with a span of 300mm and a distance between loads of 50mm as
shown in Figure 3-1. Strains were measured on the tension and compression sides at mid-
span. Based on these tests, the longitudinal flexural modulus was 18GPa, which is higher
than the manufacturer’s specified elastic modulus by 45 percent. These flexural coupons
failed by rupture of the outer most random mats of GFRP.
As discussed in Chapter 4, and to confirm this value, standard coupons for direct
tension tests according to ASTM D3039/D3039M were also cut from these sections as
shown in Figure 4-12. The central region of the coupons, where strains were measured,
was 10mm wide and 50mm long. At either end of this central region, the coupons
widened to 30mm (dog bone shape) in order to accommodate the grips of the loading
machine and ensure that failure occurred within the central region. The total length of
each coupon including the widened tabs and the narrower central region was 340mm.
26

Figure 4-14 shows the stress-strain curves of the coupons in tension. The results of these
coupon tests showed similar elastic modulus (21GPa) to the flexural modulus determined
from the aforementioned plate bending tests. In the absence of the tension coupon data at
the time analysis was carried out, the modulus established from plate bending was used to
model the slabs. This was shown to be lower by 12.6 percent than that established from
tension tests. It should be noted, however, that in relatively thin concrete slabs with
relatively thick GFRP plates as in this study, the FRP plate, although fully in tension, is
likely subjected to a significant strain gradient. Therefore, it was assumed that the elastic
modulus of these GFRP plates was equal to approximately 18GPa. More detailed
statistical data on the results of the coupon tests for these GFRP sections can be found in
Table A3 of Appendix 1.
3.2.2.3 Epoxy adhesives – Two types of epoxy adhesives were used. The first was used
to bond freshly cast concrete to GFRP plates. It has low viscosity and hence can be
applied like a paint. The specified tensile and shear bond strengths by the manufacturer
were 34.5MPa and 10.3MPa, respectively. The second type of adhesives was used to
bond coarse silica aggregates to the GFRP plate surface, prior to casting the concrete. It
has a mortar-like texture with high viscosity, which made it ideal for bonding the coarse
aggregates to the flat surface of the GFRP plates. The manufacturer’s data sheet specifies
a concrete bond tensile strength of 4MPa, and a bond shear strength of 15MPa, based on
failure within the outer concrete layer.
3.2.2.4 Coarse aggregates – Silica stones were used in the bond system and were 4 to
9mm in diameter.
27

3.2.2.5 Mechanical shear connectors – Both GFRP and steel studs were used. Threaded
GFRP rods, 12.7mm diameter, were used, with an ultimate transverse shear resistance of
32.9kN, according to the manufacturer. The steel threaded rods used were 12.7mm
diameter B7 steel, with yield and ultimate tensile strengths of 685MPa and 883MPa,
respectively.
3.2.3 Fabrication of Slabs
GFRP plates were cut to size; their surfaces were cleaned thoroughly using
acetone, and were then fitted with the designated bond system. For the wet adhesive
bond, the surface was coated with a thin layer of epoxy resin using a conventional paint
brush, as shown in Figure 3-2, no more than 45 minutes prior to casting the concrete on
the GFRP plate while the epoxy was still wet. For the bonded coarse aggregates, a thick
layer of the mortar-like adhesive was applied to the surface of the GFRP plates with a
carefully controlled thickness and then a layer of the silica aggregates was applied and
pressed into the adhesive. Once the adhesive was fully hardened, any loose aggregates
were brushed off. This left an extremely rough surface that could interlock with the wet
concrete, as shown in Figure 3-2. For the plates fitted with shear connectors, holes were
drilled through the GFRP plates. For the GFRP connectors, shear studs were created by
inserting the threaded rods into the holes, which were then fastened to the plate using
special GFRP nuts on both sides of the plate. A similar installation method was used for
the steel connectors, using steel nuts and washers. In both cases, the nuts were tightened
to the manufacturer’s specified allowable torque in each case, in order to maximize
friction between the nuts and the GFRP plates. The studs were arranged along two rows,
28

with a 100mm longitudinal spacing and 200mm transverse spacing. All studs were
installed such that they protruded 50mm from the upper surface of the GFRP plate. The
GFRP studs were designed such that the slab would have a comparable ultimate load to
those adhesively bonded. Both the wet epoxy bonded- and aggregate-bonded slabs were
anticipated to have similar strength as failure was expected to be by delamination within
the concrete. Steel studs were designed to have similar size and spacing as GFRP studs;
hence, they were expected to provide a higher bond strength.
After preparation of the GFRP plates, simple wooden wall systems were erected
between each of the GFRP plates to form the sides of the slabs. A steel welded wire mesh
with 3mm diameter wires spaced at 76mm was installed near the upper surface of the
slab, mainly for shrinkage crack control. Concrete was then cast, and the surface was
finished and moist-cured for at least 7 days.
3.2.4 Test Setup and Instrumentation
All specimens were tested in a four-point bending set-up, as shown in Figure 3-3.
Slabs 1 to 4 were tested with a span of 1000mm and a constant moment zone of 250mm.
Slabs 5 to 8 were tested with a span of 2200mm and a constant moment zone of 250mm.
Load was applied in stroke control at a rate of 1mm per minute using a Riehle machine,
with an integrated load cell. The slabs were instrumented with electrical resistance strain
gages applied to the GFRP plate, 100mm displacement-type strain transducers applied to
the GFRP plate and to the concrete on the compression side, and linear potentiometers
(LPs) to measure mid-span deflection and any slip between the concrete and the GFRP
plate at the ends.
29

3.3 Results of the Experimental Program
A summary of test results is provided in Table 3-2. Figure 3-4 shows the load-
deflection, load-strain, and load-slip responses of short slabs 1 to 4. Figure 3-5 shows
similar responses for longer slabs 5 to 8. However, because slabs 5 to 8 varied in concrete
thickness, their normalized moment-curvature responses (M/bd2) versus (ψd) are also
compared, where M, b, d and ψ are the moment, width, effective depth measured to the
mid-thickness of the plate, and curvature of the slab. The curvature is calculated as the
slope of the strain profile.
3.3.1 Effect of Bond Mechanism
Figure 3-4(a) compares the load-deflection responses of slabs 1 to 4. Slabs 1 and
2 with adhesive bond and bonded coarse aggregates behaved quite similarly and showed
significantly higher stiffness than slabs 3 and 4 after cracking. In both slabs, horizontal
shear slip was restrained by the continuously bonded surface. Consequently, all shear
flow was distributed over the concrete-GFRP plate interface plane within each of the
shear spans. Because these systems rely upon adhesive bonding, there was no progressive
horizontal shear slip as the specimens were loaded to failure. This is evident by the
insignificant slip measured at the ends (Figure 3-4(c)). Failure of slabs 1 and 2 was
initiated by a diagonal shear crack, which propagated towards the concrete-GFRP plate
interface. Once the bond shear strength was exceeded, this shear crack rapidly propagated
horizontally along the interface, followed by a sudden and complete debonding at one
shear span, as shown in Figure 3-6(a). By carefully examining the interface surfaces of
slabs 1 and 2 after failure, it was concluded that bond failure occurred within a very thin
layer of the cement mortar and not within the adhesive bond line. This was evident by a
30

visible layer of cement paste that remained bonded to the GFRP plate, as shown in Figure
3-6(c). It is worth noting that no discrete flexural cracks in slabs 1 and 2 were visible, yet
a clear reduction in stiffness is observed at a load of about 60kN (Figure 3-4(a and b)).
Therefore, it is believed that flexural cracking took the form of a network of well
distributed very fine cracks, due to the excellent adhesive bond.
Slabs 3 and 4, with GFRP and steel studs, respectively, behaved quite differently
from slabs 1 and 2. Both specimens exhibited a single flexural crack in the constant
moment zone initially (Figure 3-6(a)), followed by the appearance of a horizontal
debonding crack along the entire concrete-GFRP plate interface, as a result of slip after
the loss of adhesion (Figure 3-4(c)). As the load increased, two more flexural cracks
appeared in slab 3 and its stiffness was considerably lower than slabs 1 and 2 (Figure 3-
4(a)). The flexural cracks occurred through vertical planes that pass directly through a
pair of shear connectors, as would be expected. Eventually, all the GFRP threaded rods
sheared off horizontally within one shear span, causing failure at a load comparable to
those of slabs 1 and 2. In slab 4, although the stiffness after cracking was lower than
slabs 1 and 2 due to some slip, it was higher than slab 3, (Figure 3-4(a)). This was a result
of the higher elastic modulus of steel studs compared to GFRP studs, which led to
significantly less slip (Figure 3-4(c)). As the steel studs did not fail, the slab achieved
higher load than slab 3 and diagonal tension shear cracks appeared within each of the
shear spans, similar to slabs 1 and 2. As the load increased, the shear crack opened
further, and consequently slip at the concrete-GFRP plate interface increased. At the ends
of the slab, vertical splitting cracks were observed along the planes of the two rows of
steel studs, and eventually the load dropped. Slabs 1 to 4 failed well before developing
the full tensile strength of the GFRP plate, as evident by the tensile strains at ultimate,
31

which were about 14 to 24 percent of the rupture strain (0.0135) observed in coupon tests
(Figure 4-13(c) of Chapter 4).
Slabs 6 and 8 had a wet adhesive bond and bonded aggregates, respectively,
similar to slabs 1 and 2, but with larger spans. Figure 3-5(a) shows that both specimens
behaved similarly, with slab 8 being slightly stronger and stiffer. Both specimens
exhibited several fine flexural cracks and then failed suddenly by debonding of the GFRP
plate within one shear span as shown in Figure 3-6(b). The large diagonal tension shear
cracks apparent in the figure are secondary and are consequent to the bond failure.
Figure 3-4(b) shows a distinctly different cracking behavior between slabs 1 and 2
with adhesive bond and 3 and 4 with mechanical shear connectors. The cracking load is
slightly higher in the case of the adhesive bond than the mechanical bond. This is
because the shear studs displace concrete, which creates a vertical plane of relative
weakness in the concrete, making it easier for flexure cracks to be initiated within these
planes. Also, the transition from the uncracked to cracked stiffness is accompanied by
excessive deformations in slabs 3 and 4. This is attributed to the nature of the shear
transfer mechanism, where no bond exists in between the studs, and hence, once a
flexural crack occurred, some relative slip must have taken place before the shear
connectors became fully activated. This initial slip explains the small reduction in load
accompanied by excessive tensile strain in Figure 3-4(b) for slabs 3 and 4. It is also clear
that the adhesive bond in slabs 1 and 2 has excellent tension stiffening characteristics,
relative to the mechanical bond, because of the continuous bond surface, as evident by
their insignificant slip (Figure 3-4(c)).
32

3.3.2 Effect of Reinforcement Ratio
In slabs 5 to 7, the reinforcement ratio was varied by having three different
concrete thicknesses for the same GFRP plate (i.e. GFRP reinforcement ratios of 8.5, 5.7
and 4.3 percent, respectively), while the same wet adhesive bond system was used. The
load-deflection responses (Figure 3-5(a)) can not be used for comparison, because of the
differences in section size; therefore, the normalized moment-curvature responses (Figure
3-5(c)) are suitable for this assessment, as they reflect the effect of the single variable. It
is evident from this plot that the flexural stiffness is proportional to the reinforcement
ratio. A 33 percent increase in reinforcement ratio, from slab 7 to 6, resulted in a 22
percent increase in stiffness; whereas a 96 percent increase in reinforcement ratio, from
slab 7 to 5, resulted in a 65 percent increase in stiffness. In this study it is not possible,
however, to assess the effect of reinforcement ratio on flexural strength. This is because
all specimens inherently failed by debonding, as shown in Figure 3-6(b), and not by
GFRP rupture or concrete crushing. By carefully examining the strains at ultimate
(Figure 3-5(b)), it is clear that the GFRP plate developed about 25 to 34 percent of its
rupture strain (0.0135); however, slab 5 with the thinnest concrete profile had a concrete
compressive strain of about 0.003, and as such, compression failure may have been
imminent in this specimen according to ACI 318-05 code. No slip was observed in slabs
5 to 7 (Figure 3-5(d)).
3.4 Analytical Model
A model has been developed to predict the complete flexural behavior of one-way
slabs reinforced by adhesively bonded FRP plates used as structural forms. The model
was written in FORTRAN90, and incorporates three failure criteria that consider the
33

following possibilities: (a) flexural tension or compression failure, (b) concrete shear
(diagonal tension) failure, and (c) bond failure. The model establishes the moment-
curvature response of the section, which is then terminated at a point governed by one of
the three failure criteria discussed above (i.e. the one producing the minimum load
capacity).
3.4.1 Moment-Curvature Response
Conventional section analysis based on equilibrium of forces and strain
compatibility is carried out, assuming full bond between the GFRP plate and the concrete,
as follows:
Step 1: An initial strain is assumed at the extreme tension fiber of the section.
Step 2: The location of the neutral axis is also assumed in order to establish a complete
strain profile.
Step 3: The stresses in the concrete and the GFRP are then determined at various layers
throughout the depth of the section. For concrete, the following stress-strain function
(Collins and Mitchell, 1997) was used in compression:
⎟⎟⎟⎟
⎠
⎞
⎜⎜⎜⎜
⎝
⎛
⎟⎠⎞⎜
⎝⎛+−
⎟⎠⎞⎜
⎝⎛
= nk
c
c
c
c
cc
n
nff
'1
''
εε
εε
17'
8.0 cfn +=
34
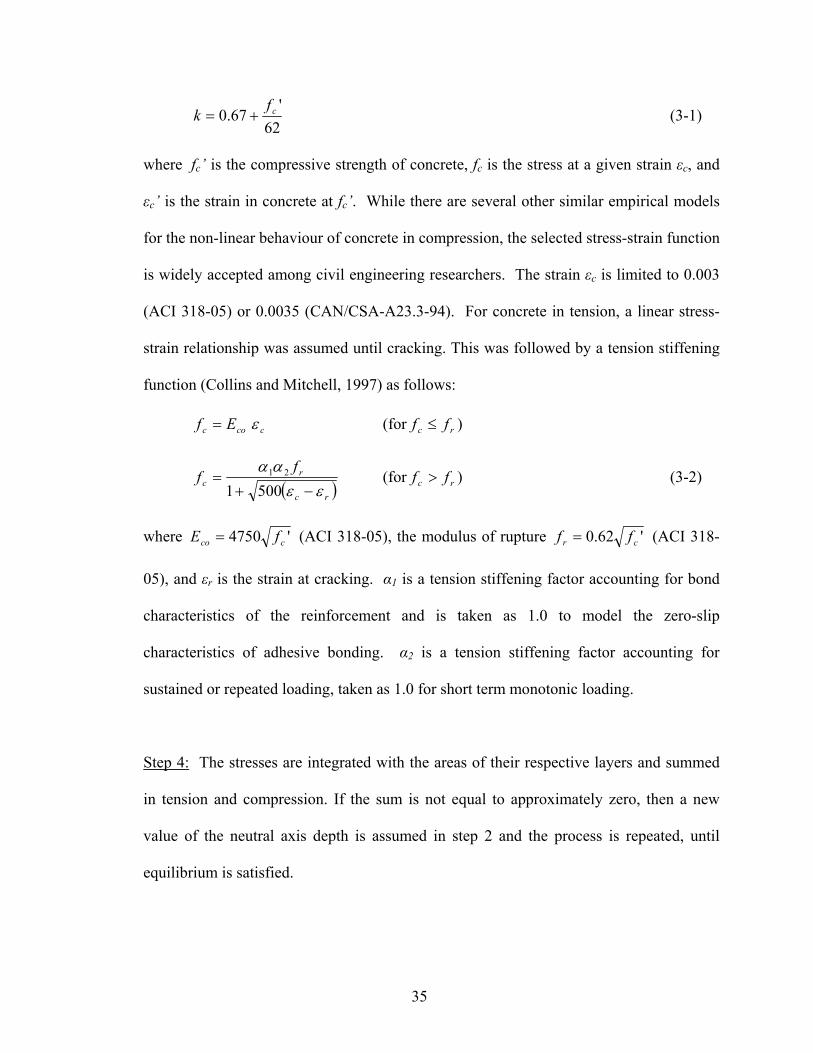
62'
67.0 cfk += (3-1)
where fc’ is the compressive strength of concrete, fc is the stress at a given strain εc, and
εc’ is the strain in concrete at fc’. While there are several other similar empirical models
for the non-linear behaviour of concrete in compression, the selected stress-strain function
is widely accepted among civil engineering researchers. The strain εc is limited to 0.003
(ACI 318-05) or 0.0035 (CAN/CSA-A23.3-94). For concrete in tension, a linear stress-
strain relationship was assumed until cracking. This was followed by a tension stiffening
function (Collins and Mitchell, 1997) as follows:
ccoc Ef ε= (for rc ff ≤ )
( )rc
rc
ff
εεαα
−+=
500121 (for ) (3-2) rc ff >
where '4750 cco fE = (ACI 318-05), the modulus of rupture '62.0 cr ff = (ACI 318-
05), and εr is the strain at cracking. α1 is a tension stiffening factor accounting for bond
characteristics of the reinforcement and is taken as 1.0 to model the zero-slip
characteristics of adhesive bonding. α2 is a tension stiffening factor accounting for
sustained or repeated loading, taken as 1.0 for short term monotonic loading.
Step 4: The stresses are integrated with the areas of their respective layers and summed
in tension and compression. If the sum is not equal to approximately zero, then a new
value of the neutral axis depth is assumed in step 2 and the process is repeated, until
equilibrium is satisfied.
35

Step 5: The sum of the moments generated by all forces (M) is calculated and the
curvature (ψ) is also calculated as the slope of the strain profile for the particular strain
assumed at step 1. This provides one point on the (M-ψ) response. The strain at the
extreme tension fiber is then increased slightly in step 1 and the process is repeated, to
establish the full (M-ψ) response.
3.4.2 Failure Criteria
In order to model the following failure criteria, the aforementioned moment-
curvature algorithm was repeated with the exclusion of tension stiffening in the concrete
to establish the termination (failure) point. The purpose of this omission was to account
for the fact that both flexure and bond failure are likely to occur at the location of a crack.
3.4.2.1 Flexure
The process of developing the moment-curvature response continues until the
extreme concrete strain in compression reaches 0.003 or the GFRP extreme tensile strain
reaches the rupture strain. The corresponding moment in this case defines the ultimate
value, governed by flexural strength Mr(flexure).
3.4.2.2 Diagonal Tension Shear
For a given slab with a specific span and loading system, the possibility of shear
failure of the concrete by diagonal tension is checked. For the moment (M) calculated for
each strain increment in the process of establishing the moment-curvature response, the
corresponding shear force diagram of the slab is established, from which the critical shear
force (V) is determined. The concrete contribution to the shear resistance (Vc) is then
36

calculated using available code provisions, namely ACI 440.1R-06 and CAN/CSA-S806-
02 (both for concrete structures reinforced by FRP):
ACI 440.1R-06: cBfV cc '52
= (3-3)
CAN/CSA-S806-02: dBfV cc '2.0= (3-4)
where B is the slab width, c is the depth of the compression region of the section (above
the neutral axis) (mm), and d is the depth of the section to the centroid of the GFRP plate
(mm).
As will be discussed in the verification section, Equation 3-3 was found to be
excessively conservative, whereas Equation 4 showed very good agreement with the
experimental results. Once the vertical shear force (V) is equal to (Vc), shear failure is
assumed to have occurred and the corresponding mid-span moment is Mr (shear).
3.4.2.3 Bond
This section provides an analytical approach to predict the load at which bond
failure occurs. This approach involves the layer-by-layer process used earlier to establish
the moment-curvature response, applied here at various sections along the span. The
horizontal shear stress (τ) at the level of concrete-GFRP plate interface can be calculated
using the following fundamental equation of mechanics:
BI
VQ
xx
=τ (3-5)
where V is the total vertical shear force experienced by the beam at a given cross section,
Q is the first moment of area of the GFRP plate about the neutral axis of the cross-section
of the slab, Ixx is the second moment of area of the section about its neutral axis, and B is
37

the width of the slab (bonded width). Prior to cracking, this is a fairly simplistic
calculation. However, once flexural cracking occurs, the second moment of area of the
section is reduced, and the neutral axis of the section begins to shift. Therefore, at any
given load, the values of Ixx and Q are only constant within the uncracked region, where
the bending moment (M) is less than the cracking moment (Mcr); however, they vary
substantially in the cracked zone. Within the cracked regions, Ixx, and Q are calculated on
the basis of a cracked section. This is to account for the fact that debonding is typically
initiated at the location of a crack (i.e. τmax is reached at a crack). As the load and
moment increase, the location where Mcr is reached shifts closer to the supports.
Figure 3-7(a) shows conceptual distribution plots of V, M, Ixx, and τ, for a simply
supported slab undergoing four-point bending with an arbitrary load that generates
bending moments exceeding (Mcr). From this plot, it is clear that the points of maximum
horizontal bond shear stress (τ) are directly beneath the applied loads. Therefore, in order
to capture the load at which initial debonding occurred, it was necessary to monitor the
changing values of M, Ixx, V, Q, and τ at these points. The neutral axis location was first
established. By summing the second moment of the areas of each discrete layer of the
section about the neutral axis, it was possible to establish a value of Ixx for the cracked
section at any given bending moment. Similarly, summing the first moment of the areas
of each discrete layer within the GFRP sheet about the neutral axis of the total section
gave a value of Q for the section at any given moment.
It is important to note that because of the concrete non-linearity, the Young’s
modulus is not constant throughout the depth of the section. Therefore, while performing
these calculations, it was important to transform the widths of each layer (Bi) by the
modular ratio of that particular layer, relative to the modulus of unstressed concrete
38

(Eci/Eco), where Eci = fci/εci, fci is the stress at layer i, corresponding to εci of the layer and
is calculated from Equations 3-1 or 3-2, and Eco is the initial modulus as defined earlier.
This means that for layers within the concrete, the modular ratio varied depending upon
the level of strain experienced by that particular layer. For the layers within the GFRP
plate, the modular ratio is a constant value (Ef/Ec), where Ef is the modulus of GFRP,
regardless of the strain level, since GFRP is a linear material.
For each value of M in the cracked section analysis, the values of Ixx, V, Q, and B
were used to calculate τ at the concrete-GFRP plate interface, using Equation 3-5. When
the maximum τ value reaches the ultimate bond shear strength τult (discussed later),
debonding is initiated at this point (Figure 3-7(b)). The corresponding mid-span moment
Mr (bond-initial) is calculated and stored. Because of the loss of bond stress in the regions
where debonding has occurred, the bond shear stress in all remaining bonded regions of
the shear span must be increased in order to make up for this loss of horizontal shear
flow. Consequently, the debonded regions begin to increase in length, propagating
outwards toward the supports (Figure 3-7(c)). Eventually, they will extend to the points
in the slab that experiences Mcr. Beyond these points, the value of τ is constant
(uncracked section); therefore, the bond stress is uniformly distributed between the point
of Mcr and the end of the overhanging region beyond the support (Figure 3-7(d)). In order
to calculate the value of the constant bond stress τ in the uncracked region, it was
necessary to determine the total tension force in the GFRP plate within the unbonded
region. Within this region, the GFRP strain, stress, and force are all constant, and their
values were taken to be equal to the average of those values found at either end of the
unbonded regions. Although the localized unbonded region does not abide by the
assumptions upon which cracked-section-analysis is based, the bonded regions
39

surrounding this region are fully intact and behave in a manner consistent with the
cracked-section-analysis. Figure 3-7(d) illustrates the assumed distribution of tensile
strains in the GFRP sheet. The abrupt shifts in tensile strain can be justified by shifts in
the slab’s neutral axis. The value of constant bond stress τ can then be calculated by
dividing the value of the tension force in the GFRP plate within the unbonded regions by
the total area of the concrete-GFRP plate interface within the uncracked region of one
shear span. Once this value of τ reaches τult, a complete debonding failure occurs. The
corresponding mid-span moment Mr (bond-final) is calculated and stored. The larger value of
Mr (bond-initial) and Mr (bond-final) governs for bond failure and is considered Mr(bond).
In the tested slabs with wet adhesive bonding or bonded aggregates, it was noted
that a thin layer of cement paste was adhered to the GFRP plate after debonding. As such,
failure was governed by the shear strength τult of the cement paste and not by the
adhesive. A typical value reported in literature for the shear strength of unconfined
conventional cement mortar is 1MPa (Hegemier et al, 1978, and Pluijm, 1993).
Therefore, for the purpose of this investigation, the ultimate bond shear strength is
assumed to be 1MPa.
3.4.3 Validation of Model
This model was developed for adhesive bonded slabs; therefore, it has been
validated using the results of slabs 1, 2, and 5 to 8. Figure 3-8 presents the experimental
versus predicted moment-curvature responses of the specimens, which shows good
agreement. Table 3-3 provides a summary of the predicted moment capacities based on
the various failure modes, namely Mr(flexure), Mr(shear), and Mr(bond). The lowest of the three
moments governs. The ultimate strength of slabs 1 and 2 was governed by shear failure
40

of concrete, whereas in all other specimens the model predicted bond failure, similar to
the experimental failure modes. For slabs 1 and 2, which failed in shear, the predicted Vc
values using the ACI 440.1R-06 and the CAN/CSA-S806-02 code equations varied
substantially and were 11 and 28kN, respectively. The CAN/CSA-S806-02 predicted
value agreed best with the experimental results. The ultimate load of slab 2 was
underestimated by the model by 7.5 percent, whereas the ultimate load of slab 1 was
predicted quite accurately to within 0.4 percent, even though both specimens failed in
shear. Also, slab 6 with wet adhesive bonding, failed at a slightly lower load than slab 8
with bonded aggregates; and the model prediction, which is the same for both, was within
24 percent of the actual failure load of slab 6, and within 0.4 percent of the actual failure
load of slab 8.
3.4.4 Model Application to other Load Cases
In the previous sections, the model was illustrated and verified using slabs tested
in four-point bending. The same methodology and concepts can be adopted for any load
case. Figure 3-9 illustrates conceptual plots of M, Ixx, V, and τ, for a simply supported
slab with an arbitrary uniformly distributed load that generates bending moments
exceeding the slab’s cracking moment. It is evident from this illustration that there is
more than one location along the length of the slab at which the bond may first fail (i.e.
two peaks), therefore, both values (τmax1 and τmax2) must be checked against τult.
3.5 Comparison with Conventional Reinforced Concrete Slabs
In this section, an attempt is made to compare the moment-curvature responses of
concrete slabs with GFRP stay-in-place forms, namely slabs 5 and 7 of this study, to
41

conventional steel-reinforced concrete (RC) slabs of the same concrete strength and
similar or comparable outer dimensions. The objectives are to establish the steel
reinforcement ratios required to achieve the same moment at ultimate (i.e. when failure
occurred due to debonding of the GFRP plate) and same flexural stiffness of the GFRP-
reinforced slabs. Conventional cracked section analysis has been used to obtain the
moment-curvature responses of the RC slabs. This analysis was performed using
computer software called Response2000, which was developed by Evan Bentz and
Professor Michael P. Collins at the University of Toronto. Steel rebar of 400MPa and
600MPa yield and ultimate strengths, respectively, has been used in this analysis.
Provisions of ACI 318-05 regarding concrete cover and limitations on rebar spacing have
been satisfied. For cast-in-place concrete slabs exposed to weather, a 40mm concrete
cover has been used for 16M bars and smaller. Clear spacing between bars was at least
equal to the bar diameter, and not less than 25mm.
For comparison with slab 5, an attempt was first made to design section RC5 with
outer dimensions identical to slab 5 and using 16M bars. However, this design failed to
match the flexural capacity and stiffness of slab 5, given the concrete cover and rebar
spacing limitations. Therefore, alternative sections with a slightly increased thickness
were designed, namely section RC5a with a 116mm thickness for a similar stiffness and
section RC5b with a 129mm thickness for similar strength to slab 5. It was found that 7.1
percent and 6 percent steel reinforcement ratios are required in sections RC5a and RC5b
to achieve similar flexural stiffness and strength to slab 5, respectively. Figure 3-10(a)
shows the moment-curvature responses of the slabs. These sections were the thinnest
possible slabs that could be designed with comparable performance to slab 5. This design
has lead to over-reinforced sections, where concrete crushes before the steel rebar yields.
42

43
For comparison with slab 7, sections RC7a and RC7b were designed to have the
same outer dimensions as slab 7. Sections RC7a and RC7b required 1.1 percent and 1.8
percent steel reinforcement ratios to match the flexural stiffness and strength of slab 7.
Figure 3-10(b) shows the moment-curvature responses of these slabs. In this case both
RC7a and RC7b achieved a ductile failure, where the steel has yielded before the concrete
crushed.
It is clear from Figure 3-10 that a relatively large steel reinforcement ratio could
be necessary to match the flexural stiffness and strength of the GFRP-reinforced slabs,
particularly slab 7. Also, the RC sections that have a similar strength have higher
stiffness, whereas those having similar stiffness have lower strength than the GFRP-
reinforced slabs. It is interesting to note that, due to the required concrete cover for steel
reinforcement, the effective depths of slabs 5 and 7 are considerably greater than the
effective depths of their conventional RC counterparts. This is a testament to the
efficiency gained by using FRP structural forms.

Table 3-1. Summary of test matrix
Spec. ID Length Span Shear
span Width GFRP plate
thickness
Total thickness (Rounded)
Effective depth
a / d Reinf.
ratio Bond
mechanism
(mm) L (mm) a (mm) B (mm) t (mm) h (mm) d (mm) ρ (%age) 1 Concrete cast on wet adhesive
2 1220 1000 375 160 157 2.4 5.7 Adhesively bonded coarse aggregate
3 GFRP shear connectors4 400 9.5 Steel shear connectors 5 110 106 9.2 8.5 6 2440 2200 975 160 157 6.2 5.7 Concrete cast on wet adhesive 7 210 208 4.7 4.3
8 160 157 6.2 5.7 Adhesively bonded coarse aggregate
44

Strain at peak load Spec. ID
Peak load
Peak moment Top Bottom
Load at first
slip
Slip at peak load
Failure mode
(kN) (kNm) (micro) (micro) (kN) (mm) 1 149 27.9 -834 1825 149 0 Concrete shear – bond failure 2 162 30.3 -907 2349 162 0 Concrete shear – bond failure 3 140 26.2 -4410 2036 43 3.6 Shear failure of GFRP studs 4 200 37.5 -2454 3313 66 2.2 Excessive slip of steel studs 5 67 32.5 -2908 3990 67 0 Bond failure 6 87 42.6 -1962 3520 87 0 Bond failure 7 145 70.8 -1585 4693 145 0 Bond failure 8 109 53.2 -2269 4236 109 0 Bond failure
Predicted moments (kNm) Spec. ID
Ultimate moment Mr (kNm)
Mr (flexure) Mr (shear) Mr (bond)
1 66 28 21a, 29b 28 (shear) 2 66 28 21, 29 28 (shear) 5 34 48 34, 22 34 (bond) 6 66 72 53, 39 53 (bond) 7 104 96 72, 59 72 (bond)
a First bond failure b Ultimate bond failure
Table 3-3. Summary of model predictions
Table 3-2. Summary of test results
45

Figure 3-1. GFRP plate bending test
Figure 3-2. Fabrication of slab test specimens
wet epoxy GFRP dowels
steel dowels
coarse aggregates
Figure 3-3. Test setup
2200250
210,160,
or110
Specimens 5 to 8
9.5 mm GFRP plate
76x76x3 mm steel mesh
1000250
160
Specimens 1 to 4
9.5 mm GFRP plate
76x76x3 mm steel mesh
46

Figure 3-4. Test results of slabs 1 to 4
0
50
100
150
200
250
0 2 4 6 8 10 12 14 16 18
0
50
100
150
200
250
-5000 -4000 -3000 -2000 -1000 0 1000 2000 3000 4000
0
50
100
150
200
250
-0.5 0 0.5 1 1.5 2 2.5 3 3.5 4
Deflection (mm)
Load
(kN
)Lo
ad (k
N)
Load
(kN
)
Strains (micro)
Slip (mm)
(a) Load-deflection responses
(b) Load-strain responses
(c) Load-slip responses
2
1
4
3
3
4
1,2 1,2
4
3
3
4
2
TensionCompression
1Side 1
Side 2
Side 2Side 1
47

Figure 3-5. Test results of slabs 5 to 8
0
20
40
60
80
100
120
140
160
180
0 5 10 15 20 25 30
020
406080
100120140
160180
-3000 -2000 -1000 0 1000 2000 3000 4000 5000
0
1
2
3
4
5
6
7
8
0 2 4 6 8
020406080
100120140160180
-0.05 0 0.05 0.1 0.15 0.2 0.25 0.3
Deflection (mm)
Load
(kN
)Lo
ad (k
N)
Load
(kN
)
Strains (micro)
Slip (mm)
(a) Load-deflection responses
(b) Load-strain responses
(d) Load-slip responses
8
7
56
TensionCompression
5
68
77
86
5
5
6 7
Nor
mal
ized
mom
ent
(M
Pa)
Normalized curvature (Ψ.d)
5 to 8
(c) Normalized moment-curvature responses2
bdM
48

(a) Slabs 1 to 4
Bond slip
Early flexural cracking
1
2
3
4
Shear (diagonal tension)
1 2
(c) Interface surface texture after failure of slabs 1 and 2
5 6
87
(b) Slabs 5 to 8
Figure 3-6. Failure modes
49

Figure 3-7. Progression of interface bond stress distribution as load increases in four-point bending
V
M
Ixx
ττmax
<
τmax
MCR MCR
εFRP
τult
τult
τmax
=
τmax
τult
τult
τmax
= τult Debonded length
τmax
= τultDebonded length
τult
τult
(a) Determination of interfacial
bond stress distribution before debonding
(b) Bond stress distribution
at first debonding
(c) Bond stress distribution
as debonding progresses
within cracked region
(d) Bond stress distribution
as debonding reaches
uncracked region
P1
P2 > P1
P3 > P2
P4 > P3
τult
τult
τult
τult
τ
τ
τ
50

Figure 3-9. Progression of interface bond stress distribution under uniform load
Figure 3-8. Experimental versus predicted moment-curvature responses
0
10
20
30
40
50
60
70
80
0 0.01 0.02 0.03 0.04 0.05 0.06 0.07 0.08
56
7
8
Curvature (1/m)
Mom
ent (
kNm
)
model
(b) Specimens 5 to 8
0
5
10
15
20
25
30
35
0 0.005 0.01 0.015 0.02
Curvature (1/m)
Mom
ent (
kNm
)
12model
(a) Specimens 1 and 2
V
M
Ixx
τ
τmax 1
MCR MCR
τmax 2
51

Figure 3-10. Comparison between slabs 5 and 7 and conventional RC slabs
208Specimen 7
ρ
= 4.3%
ρ
= 1.8%
RC7
Curvature (1/m)
Ben
ding
Mom
ent (
kNm
)
212 212 164
RC7a
RC7b
ρ
= 1.1%
Specimen 7
(b) Under-reinforced sections
RC5b
Curvature (1/m)
Ben
ding
Mom
ent (
kNm
)
106Specimen 5 RC5b111 129 81
68RC5a116
Specimen 5ρ
= 8.5%
RC5aρ
= 7.1%
ρ
= 6%
(a) Over-reinforced sections
52

CHAPTER 4: EXPERIMENTAL INVESTIGATION OF GFRP STAY-IN-PLACE
SYSTEM FOR CONCRETE GIRDERS
4.1 Introduction
This chapter provides an experimental investigation into concrete girders
fabricated using commercially available pultruded GFRP sections originally used as sheet
piles. The GFRP sections are used as formwork, while being the sole tension
reinforcement for the girders. Similar to the slabs discussed in Chapter 3, various
adhesive and mechanical bond systems are investigated. The effect of implementing a
void within the tension region of the concrete is explored. Another configuration
composed of an all-GFRP trapezoidal box girder, in which concrete is only used as a
compression flange, is developed. The aforementioned systems are studied for
applications in positive and negative bending, to simulate continuous beams.
4.2 Experimental Program
4.2.1 Test Specimens
Nine girders, referred to as girders 1 to 9, were fabricated using trapezoidal
pultruded GFRP sheet pile sections as stay-in-place structural open formwork. The cross-
sectional configuration of the sheet pile, which was fabricated by Creative Pultrusions
Inc, is shown in Figure 4-1(a and b) and Figure 4-2(a). The specific section used was
SuperLoc 1610. All girders had a total length of 3350mm.
53

4.2.1.1 Geometric Configurations
Table 4-1 provides a summary of the test specimens. The specimens were divided
into three geometric types. The first type (Type 1) included girders 1, 2, and 3 which
were cast with a void in the tension region of the concrete, as shown in Figure 4-3, and
had a 70mm thick concrete slab above the upper flanges of the sheet pile section. The
void size was 245x150mm such that the ceiling of the void was at the same level as the
upper flange of the sheet pile, and concrete webs were still provided for shear resistance.
This design was selected since the neutral axis of the section is located slightly above the
void; therefore, the void only displaced concrete within the tension region. A 250mm
thick diaphragm of a solid concrete fill was provided at both ends of the girders in order
to prevent web crippling over the supports. All three specimens were tested in positive
bending. The main parameter studied using these specimens was the bond mechanism,
where three different bond systems were compared, as discussed later.
The second type of specimens (Type 2) included girders 4 and 5 which were
completely filled with concrete, as shown in Figures 4-4 and 4-5. These specimens
consisted of the pultruded GFRP sheet pile sections overlain with concrete. Similar to
girders 1 to 3, the concrete depth was controlled such that a 70mm thick concrete slab
was provided above the upper flanges of the sheet pile section. Girders 4 and 5 were
identical; however, girder 4 was tested in positive bending while girder 5 was tested in
negative bending to simulate the behaviour at an internal support of a continuous beam.
Figure 4-6 shows a photograph of girder 4.
The third type of specimens (Type 3) were unique in that they were composed of
built up all-GFRP box sections. These box section girders 6, 7, 8, and 9 were created by
bonding flat 9.5mm thick pultruded GFRP sheets, similar to those used for the slabs in
54

Chapter 3 (information is given in Figure 4-1(c)), across the upper flanges of the sheet
pile sections, resulting in a trapezoidal hollow box section, as shown in Figures 4-7 to 4-
10). Girders 6 to 8 incorporated a concrete slab on top of the flat upper sheet of the box
section. These slabs were 60mm thick so that the overall depth of these specimens was
equal to that of the Type 1 and Type 2 specimens. Figure 4-11 is a photograph showing
the cross-section of girders 6, 7, and 8. Girder 9 did not have a slab and was tested to
establish the flexural stiffness and strength of the stay-in-place box section. Girder 9 was
first tested in negative bending (9b) up to a relatively small load and then unloaded to
establish the stiffness. It was then tested again to failure in positive bending (9a). Girders
6 and 7 were both tested in positive bending to compare two different bond systems
(discussed later). Therefore, these specimens incorporated a 250mm thick diaphragm of
solid grout within the box section over each of the supports. Girder 8 was tested in
negative bending. Therefore, it incorporated a 500mm thick diaphragm of solid grout
within the box section between the loading points. Girder 9, which was tested in both
positive and negative bending, incorporated a 250mm thick diaphragm of solid grout
within the box section over each of the supports.
4.2.1.2 Bond Mechanisms
Prior to pouring concrete into the forms, each of the GFRP sections was fitted
with a mechanism designed to resist horizontal shear-slip between the concrete and the
GFRP section. Four discrete bond systems were investigated, most of which are similar to
the slabs in Chapter 3. Mechanism M1 involves a liquid epoxy adhesive applied directly
to the surface of the GFRP form immediately prior to pouring the concrete. Mechanism
M2 involved applying a rough layer to the surface of the GFRP sections in order to create
55

mechanical interlock between the concrete and the GFRP. This was accomplished by
applying a thick mortar-like adhesive to the surface of the GFRP sections, and then
applying a layer of 4 to 9mm diameter silica pebble aggregates onto the adhesive.
Mechanism M3 utilized shear studs. These studs were created by drilling holes through
the upper flat surfaces (flanges) of the GFRP sections, passing threaded steel rods through
these holes, and then fastening the rods in place with a nut on either side of the GFRP
section. Mechanism M4 was similar to mechanism M3 with the addition of heads on the
studs. These heads were created by screwing a nut onto the top of each stud, and then
jamming these nuts in place by distorting the threads with a hammer and punch. As
shown in Table 4-1, girders 1, 2, and 3 were fitted with bond systems (M1), (M2), and
(M3 combined with M1), respectively. Girders 4, 5, and 6 were fitted with the (M1) bond
system. Girders 7 and 8 were fitted with (M4) combined with M1. Girder 9 was fitted
with the (M3) studs. In girders 6, 7, 8, and 9, the same thick mortar-like adhesive used in
bond system (M2) was also used to bond the flat GFRP plate to the sheet pile section in
order to create the box section.
4.2.1.3 Parameters Studied
Girders 1, 2, and 3 were compared and girders 6 and 7 were compared in order to
study the different bond mechanisms used at the concrete/GFRP interface. Girders 1, 4,
and 6 were compared and girders 3 and 7 were compared in order to study different cross-
sectional configurations. Girders 4 and 5 were compared and girders 7 and 8 were
compared in order to assess the performance of the system under negative bending
conditions and to compare this performance with its performance in positive bending.
Girder 9 was tested in order to assess the performance of the box girder in the absence of
56

concrete, and was compared with girders 7 and 8 in order to quantify the contribution of
the concrete slab to the behaviour of the composite system in both positive and negative
bending.
4.2.2 Materials
4.2.2.1 Concrete – All concrete batches were ordered to have a compressive strength of
35MPa at 7 days, using high-early strength cement. The maximum aggregate size was
14mm and slump was 152mm. Concrete cylinders, 102 x 203mm, were made from the
same batch of concrete. For girders 1 to 3, the concrete compressive strength ranged from
33MPa to 39MPa with an average of 36MPa, based on testing cylinders in accordance
with ASTM C39. For girders 4 and 5, the concrete compressive strength ranged from
33MPa to 40MPa with an average of 37MPa, based on testing cylinders. For girders 6
through 8, the concrete strength ranged from 44MPa to 58MPa with an average of 52MPa
based on cylinder tests. More detailed statistical data on the concrete strength can be
found in Table A1 of Appendix 1.
4.2.2.2 Grout – Each of the four Type 3 girders 6 to 9 incorporated diaphragms of solid
grout within their hollow GFRP box sections. The grout used was made by the Sika
Corporation and is called SikaGrout 212. Grout cylinders, 102 x 203mm, were made
from the same batch of grout used in the specimens. The average compressive strength
was found to be 36MPa in accordance with ASTM C39. More detailed statistical data on
the grout strength can be found in Table A2 of Appendix 1.
57

4.2.2.3 GFRP Sheet Pile Sections – Commercially available sheet pile sections were
fabricated by Creative Pultrusions Inc. These sections, known as SuperLoc 1610 (Figure
4-1(a and b)), have a trapezoidal shape with a depth of 254mm and a width of 609.6mm;
the sections also incorporate pin and eye connection details along their longitudinal edges
so that multiple sections can be joined side-by-side, resulting in a wide corrugated
section. For the purposes of this investigation, each girder specimen incorporated a single
SuperLoc 1610 section oriented longitudinally. The upper and lower flanges of these
sections are 8.89mm thick. The webs, which are inclined 20 degrees from the vertical,
are 7.62mm thick. The sheet pile sections are mass produced with a proprietary pultruded
GFRP layup. The material properties of this layup, however, are available from a
manufacturer’s data sheet (Figure 4-1(a and b)). It should be noted that Types 1 and 2
specimens (girders 1 through 5) were fabricated using sections comprising a slightly
different resin matrix (polyester) from the Type 3 specimens (polyurethane). For the
sheet piles used in Type 1 and 2 specimens (girders 1 to 5) polyester resin was used, and
the manufacturer reported data indicates longitudinal tensile strength and modulus of
276MPa and 26.2GPa, respectively, and longitudinal compressive strength and modulus
of 241MPa and 26.2GPa respectively (Figure 4-1(a)). For the sheet piles used in Type 3
specimens (girders 6 to 9) polyurethane resin was used, and the manufacturer reported
data indicates longitudinal tensile strength and modulus of 517MPa and 26.2GPa,
respectively, and longitudinal compression strength and modulus of 345MPa and
26.2GPa respectively (Figure 4-1(b)).
The sections were each cut down to a length of 3350mm, which was the total
length of the girder specimens. Coupons were cut from the flanges of these sections as
shown in Figure 4-12. The central region of the coupons where strains were measured
58

was 10mm wide and 50mm long. At either end of this central region, the coupons
widened to 30mm in order to accommodate the grips of the loading machine and ensure
that failure occurred within the central region. The total length of each coupon including
the widened tabs and the narrower central region was 340mm. The coupons were tested
in accordance with ASTM D3039/D3039M. Figures 4-13(a and b) show the stress-strain
curves of the coupons in tension for the material used in girders 1 through 5, and girders 6
though 9, respectively. It should be noted that some of the strain gauges on these coupons
failed prior to the coupons reaching their ultimate tension failures. As such, these figures
have been labeled with the stress at ultimate failure for each coupon. The elastic modulus
obtained experimentally using these coupon tests was quite consistent with the
manufacturer’s specified elastic modulus of 26.2GPa; however, tensile strengths from the
manufacturer were underestimated. More detailed statistical data on the results of the
coupon tests for these GFRP sections can be found in Table A3 of Appendix 1.
4.2.2.4 GFRP plates – Commercially available 9.5mm thick GFRP flat plates, similar to
those used in the slabs of Chapter 3, were received in a standard size of 1220 x 2440mm.
The plates were fabricated by Creative Pultrusions Inc., and the sections used were
entitled Pultex 1500 Flat Sheet (Figure 4-1(c)). These plates were to be used as the upper
flanges of the box girders for girders 6 through 9 (Type 3 specimens). The plates
consisted of alternating layers of unidirectional E-glass roving and random mats,
impregnated with polyester resin. Based on the manufacturer reported data, the tensile
strength and modulus in the longitudinal direction were 138MPa and 12.4GPa,
respectively, and in the transverse direction were 69MPa and 6.9GPa, respectively. As
discussed in Chapter 3, three plate bending tests were carried out on 340 x 102mm
59

coupons, to establish the longitudinal elastic modulus. The coupons were tested in four-
point bending, with a span of 300mm and a distance between loads of 50mm as shown in
Figure 3-1. Strains were measured on the tension and compression sides at mid-span.
Based on these tests, the average longitudinal flexural modulus was 18GPa, which is
higher than the manufacturer’s specified elastic modulus value by 45 percent. These
flexural coupons failed by rupture of the outer most random mats of GFRP. To confirm
these results, coupons for direct tension tests were also cut from these sections as shown
in Figure 4-12, following the same procedures as used for the coupons from the sheet pile
sections. Figure 4-14 shows the stress-strain curves of the coupons in tension. The
results of these coupon tests showed a similar elastic modulus to the flexural modulus
determined from the aforementioned plate bending tests. In the absence of the tension
coupon data at the time analysis was carried out, the modulus established from plate
bending was assumed to be accurate, as with the slabs. More detailed statistical data on
the results of the coupon tests for these GFRP sections can be found in Table A3 of
Appendix 1.
4.2.2.5 Epoxy adhesives – Two types of epoxy adhesives were used. The first is used to
bond freshly cast concrete to the GFRP sections. It has low viscosity and hence can be
applied like a paint as discussed in Chapter 3. The second type was used to bond coarse
silica aggregates to the GFRP plate surface prior to casting the concrete, as well as to
bond the GFRP plate to the sheet pile section in order to create box sections for girders 6
to 9. It has a mortar-like texture with high viscosity, which made it ideal for bonding the
coarse aggregates to the flat surface of the GFRP sections, also discussed in Chapter 3.
60

4.2.2.6 Coarse aggregates – The silica stones used in bond system M2 were 4 to 9mm
(0.16 to 0.35 in.) in diameter, the same as used in the slabs of Chapter 3.
4.2.2.7 Mechanical shear stud connectors – The steel threaded rod used was 12.7mm
diameter B7 steel with yield and ultimate tensile strengths of 685MPa and 883MPa,
respectively.
4.2.3 Fabrication of Test Specimens
GFRP plates and sheet pile sections were cut to size and their surfaces were
cleaned thoroughly using acetone. For Type 3 girders 6 to 9, the first step in the
construction process was to fabricate the box girder sections by adhering the flat GFRP
sheets to the top of the sheet pile sections. This was done by applying a layer of the
Sikadur30 mortar-like adhesive to the bond surfaces and lightly clamping the two units
together. All sections (sheet pile sections, or built up box girders) were then fitted with
the designated bond system. For the wet adhesive bond, the surface was coated with a
thin layer of epoxy resin using a conventional paint brush (Figure 4-15), no more than 45
minutes prior to casting the concrete on the GFRP section while the epoxy was still wet.
For the bonded coarse aggregates, a thick layer of the mortar-like adhesive was applied to
the surface of the GFRP plates with a carefully controlled thickness, and then a layer of
the silica aggregates was applied and pressed into the adhesive (Figure 4-16). Once the
adhesive was fully hardened, any loose aggregates were brushed off. This left a rough
surface that could interlock with the wet concrete. For the specimens fitted with
mechanical shear connectors, holes were drilled through the GFRP sections. Shear studs
were created by inserting the threaded steel rods into the holes, which were then fastened
61

to the section using jam nuts and large washers on both sides of the plate. The nuts were
then tightened to the manufacturer’s specified allowable torque (60Nm), in order to
maximize friction between the nuts and the GFRP plates. The studs were arranged along
two rows (one on each upper flange of the sheet pile sections) with a 100mm longitudinal
spacing. This spacing was designed such that flexural failure could be achieved prior to
bearing failure at the stud/GFRP interface. Unfortunately, in girder 3 this flexural failure
was preceded by a vertical pullout of these non-headed studs (Figure 4-17(a)) as will be
discussed later. Therefore, headed studs were used in the rest of the specimens (Figure 4-
17(b)). All studs were installed such that they protruded 50mm from the upper surface of
the GFRP section (Figure 4-17). It should be noted that, although girder 9 did not feature
any concrete, it was still fitted with shear studs (M3) in order to enhance the connection
between the sheet pile and the flat GFRP sheet.
After preparation of the GFRP sections, simple wooden wall systems (Figures 4-
18) were erected around the perimeter of each girder in order to retain the concrete on top
of the GFRP stay-in-place forms, and to form the sides of the concrete slabs. The void in
girders 1 to 3 was created by adhering foam blocks to the GFRP formwork prior to
pouring the concrete (Figure 4-18). A steel welded wire mesh with 3mm diameter wires
spaced at 76mm was installed near the upper surface of the slab of each specimen, mainly
for shrinkage crack control. Concrete was then cast (Figure 4-19) and the surface was
finished and moist-cured for at least 7 days.
4.2.4 Test Setup and Instrumentation
Each specimen was tested using a symmetric 4-point bending setup with a span of
3100mm, and a 400mm long constant moment zone between the two loading points. A
62

schematic of this setup is shown in Figures 4-3 to 4-5 and 4-7 to 4-10, and photographs of
the setup are shown in Figures 4-20 and 4-21. Load was applied at a rate of 1mm per
minute using a 1000kN Reihle machine with an integrated load cell. Strains were
monitored using electrical resistance strain gages and 100mm displacement-type strain
transducers located within the constant moment zone of each specimen. Linear
potentiometers (LPs) were used to monitor midspan deflections, as well as horizontal slip
between the concrete and the GFRP forms. Full dimensioned schematics of all of the
instrumentation used are shown in Figures 4-22 through 4-27. It should be noted,
however, that not all of the data collected from these instruments is presented or
discussed, as much of the instrumentation was used merely for redundancy, to validate
data, and to insure linearity of strain profiles along the depth. Girders 3 and 9
incorporated 45 degree strain rosettes within one of their shear spans at the mid-height of
one of their webs. This rosette was located at a distance from the nearest applied loading
point equal to half of the section’s depth. Girder 8 incorporated additional strain gauges
at the extreme compression fiber and a 100mm displacement-type strain transducer at the
extreme tension fiber within one of the shear spans, 150mm from the nearest loading
point. At this location, there were both longitudinal and transverse strain gages on the
compression flange of the sheet pile section. The purpose of this additional
instrumentation was to capture the strains, local buckling behaviour, and strain profile in
girder 8 near the location of maximum bending moments without being affected by the
solid grout diaphragm that was located beneath the loading points and within the constant
moment zone of this particular specimen.
63

4.3 Results of the Experimental Program
A summary of test results from all specimens, including ultimate load, load at first
slip, and failure modes, is provided in Table 4-2. The load-deflection plots for all
specimens are compared in Figure 4-28. Figures 4-29 to 4-34 show the load-deflection
responses for different groups to examine the effects of each parameter. Similarly,
Figures 4-37 to 4-44 show the moment-curvature responses, Figures 4-47 to 4-49 show
the load-slip responses, and Figures 4-50 to 4-54 show the load-axial strain responses.
Failure modes are shown in Figures 4-57 to 4-61.
4.3.1 Effect of Bond Mechanism
4.3.1.1 Effect on Stiffness
Figure 4-29 shows the load-deflection curves for girders 1, 2, and 3 with wet
concrete to wet epoxy bond (M1), bonded aggregates (M2), and non-headed steel studs
combined with wet epoxy (M1 and M3), respectively. Also, figure 4-37 shows the
bending moment-curvature response of the same specimens. It is evident from these plots
that, prior to failure, the stiffness of all specimens is quite similar. This is logical
because, as shown in Figure 4-47, none of these specimens exhibited any horizontal bond
slip at the interface between the concrete and the GFRP sheet pile prior to failure;
therefore, these specimens behaved monolithically prior to the sudden failure of their
bond mechanisms. The specimens have the same cross-sectional configurations, and
therefore behaved similarly. Although girder 3 utilized bond mechanism M3, which is a
mechanical connection with discretely spaced interlocking elements, it also incorporated
bond mechanism M1. Therefore, all three of these specimens incorporated bond
mechanisms that generate a uniformly distributed shear connection between the concrete
64

and the GFRP section. As a result of this uniform shear connection, tension stiffening
behaviour after cracking of the concrete is exceptional in all three specimens. This is
evident by the smooth curved transition between the pre-cracked stiffness and post-
cracked stiffness of these specimens, as seen in Figure 4-37. However, it should be noted
that the presence of a void in the tension region of the concrete diminishes the effects of
tension stiffening and reduces the cracking load, which is in any case small relative to the
ultimate load. This will be discussed in more detail later. Although girder 3 incorporated
both bond mechanisms M1 and M3, it is clear from Figure 4-29 that the behaviour of
girders 1 and 3 was nearly identical below the failure load of girder 1. Beyond this load,
girder 3 exhibited a slight reduction in stiffness. This was likely caused by a failure of its
M1 bond mechanism first (the failure mode of girder 1), leaving only mechanism M3
responsible for resisting horizontal shear at the concrete / GFRP interface. It is logical
that mechanism M3 alone would result in a slightly reduced stiffness because it is
dependent upon mechanical interlocking shear studs. Between these studs, it is possible
for horizontal shear slip to occur, which means that composite action is compromised and
shear-induced deflections can occur. In fact, it is likely that the majority of the reduced
stiffness occurred as a result of shear deflection since the reduced stiffness of girder 3 is
only evident in its load-deflection plot (Figure 4-29) but not in the moment-curvature plot
(Figure 4-37).
Figure 4-30 shows the load-deflection curves for girders 6 and 7, which have bond
mechanisms (M1) and (M1 combined with M4), respectively. Figure 4-49 shows load
versus slip at the interface between the concrete and the GFRP box girder for the two
specimens, and Figure 4-38 shows their bending moment-curvature plots. It is evident
from these plots that, prior to failure, the stiffnesses of girders 6 and 7 were quite similar,
65

which is similar to girders 1, 2, and 3. Again, this is logical since girders 6 and 7 both
incorporated bond mechanism M1, and neither of these specimens exhibited significant
slip at the interface between the concrete and the GFRP sheet pile prior to failure. It
should be mentioned that girder 7 did exhibit some slip after failure of its M1 bond
mechanism, thus mobilizing its M4 bond mechanism throughout the remainder of the test.
This small amount of slip was punctuated by a very minor reduction in stiffness. It is
apparent that in girders 3 and 7, their respective mechanical interlock bond mechanisms
(M3 and M4, respectively) were not mobilized until failure of their adhesive bond
mechanisms (M1) occurred. This can be explained by the fact that some slip must occur
to mobilize mechanical shear connectors. If girders 3 and 7 did not incorporate bond
mechanism M1, then it would have been likely that significant slip, and hence reduced
stiffness, would take place. This was shown in slab girders 3 and 4 in Chapter 3.
4.3.1.2 Effect on Strength and Failure Mode
The ultimate strength of concrete members having FRP structural forms is highly
dependent on the quality of bond between the two materials. It can be seen in Figures 4-
29 and 4-30 that the ultimate strength of girders 1, 2, and 3, as well as girders 6 and 7
differed substantially. By carefully examining the interface surfaces of girders 1, 2, and 6
after failure, it was concluded that bond failure occurred within a very thin layer of the
cement mortar, as in the slabs of Chapter 3. This was made evident by a visible layer of
cement paste bonded to the GFRP sections (Figure 3-6(c)). Therefore, it can be said that
the shear strength of bond mechanisms M1 and M2 are both dependent upon the shear
strength of the cement paste. A typical value reported in literature for the shear strength
of unconfined conventional cement mortar is 1MPa (Hegemier et al, 1978, and Pluijm,
66

1993). It has also been shown in Chapter 3 that this value may be used to accurately
model the performance of bond mechanism M1.
It is clear from Figure 4-29 that specimens incorporating mechanisms M1 and M2
behaved quite similarly. Figure 4-57 shows the typical bond failure of these specimens.
Girder 3 exhibited a progressive failure that was punctuated by an initial debonding
failure of mechanism M1, which appeared to occur at a similar load to the failure of
girder 1. This initial failure is made evident by the reduction in stiffness discussed
earlier. The ultimate failure of girder 3 occurred at a slightly higher load when
mechanism M3 failed by pullout of the studs from the concrete slab near one of the
supports (Figure 4-58). This was due to the absence of heads on the shear studs in
mechanism M3. Therefore, the failure load of girder 3, although higher than those of
girders 1 and 2, is considered somewhat premature. Girder 6 failed by debonding in a
similar manner to girders 1 and 2, as shown in Figure 4-59. It was also noted that bond
failure occurred between the GFRP flat plate and the sheet pile section. The adhesive at
this interface has higher tensile and shear strengths than that used above the plate to bond
to the concrete, yet a bond failure also occurred at this level. This may have been a
secondary failure after debonding at the concrete/GFRP interface. Unlike girder 6, girder
7, which incorporated bond mechanisms M1 and M4 with headed studs, did not
ultimately fail by pullout of the shear studs. It exhibited a slight reduction in stiffness
(Figures 4-30 and 4-38) and slight horizontal shear slip (Figure 4-49) at a load similar to
the failure load of girders 1 and 6, which indicates that mechanism M1 probably failed at
this load. Its mechanism M4, however, did not fail at all. At approximately 430kN, a
thin flat layer of concrete within one of the shear spans of girder 7 delaminated along a
horizontal plane that intersects the top surfaces of the shear studs. It is noted that the
67

shear studs displace concrete, thereby creating a plane of weakness. This delamination
caused a drop in load (Figure 4-30). The load then climbed back up to approximately
430kN, at which point the concrete slab crushed adjacent to one of the loading points.
This crushing was immediately followed by buckling of the upper flange of the GFRP
box section. Figure 4-60 shows the failure of girder 7.
By examining the load-longitudinal strain responses of girders 1, 2, and 3 in
Figure 4-50 and girders 6 and 7 in Figure 4-51, it can be seen that the maximum measured
longitudinal tensile strains in the GFRP sheet pile section at failure were well below the
manufacturer’s specified ultimate tensile failure strain (εfr) from coupons of 0.0134 for
girders 1, 2, and 3, and 0.0206 for girders 6 and 7. As such, tension failure was never
immanent in any of these specimens. At the compression side, except for girder 7, the
longitudinal compressive strain was well below 0.0035, specified by CAN/CSA-A23.3-94
for concrete crushing (εcc). Clearly girder 7 has exceeded this strain, and indeed
compression failure has occurred.
4.3.2 Effect of Geometric Configuration
4.3.2.1 Effect on Stiffness
Figures 4-31 and 4-39 compare the load-deflection and moment-curvature
responses of girders 1, 4, and 6 of three different cross-sectional configurations, but
similar bond systems. It should be noted, however, that the total depth of all sections was
identical; the area of concrete in compression for all specimens was quite similar; and the
flat GFRP sheet that made up the top flange of the box girder of girder 6 was in close
proximity to the neutral axis of the section. It is evident from these plots that the post-
cracking stiffness of these specimens was nearly identical. However, the initial parts of
68

the curves near cracking were different. Because girder 4 incorporated far more concrete
in its tension region than either of the other two specimens, it had the greatest cracking
moment and exhibited a relatively abrupt change in stiffness after cracking (Figure 4-39).
Girder 6 had no concrete in its tension region; hence it did not exhibit any cracking or
pronounced changes in flexural stiffness. Although girders 1 and 4 incorporated the same
bond mechanism, the flexural response of girder 4 is indicative of a lower tension
stiffening coefficient (α1) than girder 1 (Figure 4-39). Since the tension stiffening
coefficient of a reinforced concrete member is only dependent upon the quality of the
bond between the concrete and the reinforcement, it is clear that not all of the concrete in
the tension region of girder 4 contributed to tension stiffening. Girder 4 had a relatively
large volume of concrete in its tension region that was not adjacent to its GFRP form
reinforcement when compared with girder 1. This geometry was likely responsible for
the discrepancy in their tension stiffening behaviours. For conventional steel reinforced
concrete members, it has been shown that tension stiffening is only effective within a
limited distance (dTS) from the centroid of the reinforcing bars. This distance is generally
accepted as fluctuating between 0 and 7.5 times the diameter of the reinforcing bars, thus
having an average value of approximately 3.75 times the diameter of the reinforcing bars
(Collins and Mitchell, 1997). The value of dTS is likely to differ for GFRP reinforcement
due to its lower elastic modulus; however, it is clear from comparing the flexural
responses of girders 1 and 4 that tension stiffening in concrete members reinforced by
GFRP formwork is undoubtedly effective only within a limited distance from the form.
While girder 4 had a higher cracking moment than girder 1 due to its greater cross-
sectional area of concrete, girder 4 exhibited a more abrupt drop in stiffness after cracking
occurred because a relatively small percentage of its concrete was able to contribute to
69

tension stiffening. This phenomenon generated the appearance of inferior tension
stiffening behaviour in girder 4.
Figure 4-40 compares the moment-curvature responses of girders 3 and 7 of two
different cross-sectional configurations, but with similar bond systems. The flexural
response of these specimens compare in a manner that is similar to the comparison of
girders 1 and 6. In general, the primary difference in behaviour between the slab-on-box
sections (6 and 7) and all the other specimens is their lack of a pronounced cracking
moment when loaded in positive bending.
Figures 4-35 and 4-45 compares the load-deflection and moment-curvature
responses of girders 7 and 9 in positive bending. It is important to note that, due to local
warping and buckling of the upper compression flange of girder 9, non-linear reversing
strains were recorded by SG8 at the extreme compression fibre (Figure 4-55). Therefore,
the moment-curvature plot for girder 9 can only be used to assess stiffness at bending
moments below approximately 65kNm. Within this range, it was found that the flexural
stiffness (EI) of girder 7 was approximately 75% greater than that of girder 9. This
discrepancy can be attributed to the presence of a concrete slab on girder 7, which serves
to increase the effective depth of the section, thus increasing its moment of inertia
considerably. In fact, girder 9 began to soften considerably as local buckling of the upper
flange began, as shown in the load-deflection response of the specimen (Figure 4-35)
where the curve begins to flatten above approximately 190kN.
4.3.2.2 Effect on Strength
Although girders 1, 4, and 6 all exhibited failure by debonding of their M1 bond
mechanisms, girders 4 and 6 resisted relatively higher loads than girder 1. This can likely
70

be attributed to the differences in bond surface area and configuration between the
concrete and the GFRP form of girders 4 and 6, when compared with girder 1. The bond
area of girder 1 was compromised by the presence of a void within the tension region of
the concrete. Bond failure in girders 1 and 4 was likely initiated along the plane of the
upper surface of the upper flange of the sheet pile section since this is the region in
closest proximity to the neutral axis of the section, and hence the maximum shear region.
It is clear that the total shear flow necessary to ensure composite action between this sheet
pile and the concrete overlay is distributed over a larger bond area in girder 4 than in
girder 1. Girder 6 also had a slightly smaller bond area than girder 4, but its bond area
was relatively flat and regular. It is clear from Figure 4-52 that longitudinal tensile and
compressive strains at failure were well below the expected ultimate failure values of the
materials.
It is worth noting that the webs of the GFRP sections in girders 1 and 4 essentially
behaved as stirrups, helping the composite hybrid sections to resist shear by resisting
tension while the concrete located between the webs resisted diagonal compression.
Therefore, the bond areas located on the diagonal GFRP webs of girders 1 and 4 were
burdened with vertical shear stresses and tensile stresses in addition to horizontal shear
stresses. This helps to explain why girder 6 was able to out-perform girder 1 despite their
somewhat similar bond areas. From a strength-to-weight ratio stand point, it is quite clear
that girder 6 out-performed girders 1 and 4 by 130% and 200%, respectively, while girder
1 outperformed girder 4 by 30%.
As of girders 7 and 9 in positive bending, it is clear from Figure 4-35 that the
ultimate strength of girder 7 was approximately 86% higher than that of girder 9. This,
once again, can be attributed to the presence of a concrete slab on girder 7, which served
71

to restrain the upper flange of the GFRP box section in order to prevent local buckling
and at the same time resist higher compression forces. The slab also increased the
effective depth and moment of inertia of the section. It is interesting to note that girder 9
failed in a manner that is reminiscent of a secondary failure mode evident in girder 7. In
girder 9, the flange buckled in a vertical plane along one of the edges of the sheet pile
section (Figure 4-63). This vertical displacement of the upper flange, in turn, caused
severe deformation of the web. Similarly, once the concrete slab on girder 7 crushed, the
upper flange of the GFRP box section was no longer restrained; therefore, immediately
after this crushing occurred, the upper GFRP flange buckled in a manner that was nearly
identical to the failure observed in girder 9 (Figure 4-60).
4.3.3 Performance under Negative Bending Conditions
4.3.3.1 General Behaviour
In continuous beams, the magnitude of negative bending moments often equals or
exceeds that of positive bending moments. In this section, the configurations of girders 4
and 7, which were studied in positive bending, are also assessed in negative bending
through girders 5 and 8, respectively. Figures 4-32 and 4-41 show the load-deflection and
moment-curvature responses of these two girders. It is important to note that girder 8 had
a 500mm long solid diaphragm within the constant moment zone, which would be a
necessary detail over the interior supports of a continuous beam in order to prevent local
crippling of the webs. For this reason, the mid-span flexural response of girder 8 was
measured both within the constant moment zone and within one of the shear spans where
the box section was left hollow, as shown in Figure 4-42. The flexural stiffness of girder
8 in its hollow shear span region was slightly lower than that of girder 5, which was likely
72

due to the presence of concrete in the compression region of girder 5 (Figures 4-32 and 4-
41).
The failure mode of girder 5 was by lateral opening of the GFRP sheet pile section
(Figure 4-61). This occurred as a result of large curvature in the specimen, which
generated a net upward force component in the bottom flange and a net downward force
component in the upper flange. This in turn caused the angled webs to flatten, thus
laterally thrusting the tension flanges out to the sides and peeling the webs away from the
concrete core. This phenomenon is similar in concept to ovalization exhibited by hollow
round tubes (Ibrahim, 2000). Girder 8 was restrained from opening in this fashion due to
the presence of the flat GFRP sheet acting as a tie between the two tension flanges of the
sheet pile section. However, despite the resistance of girder 8 to this lateral opening of
the GFRP section, its performance was not significantly better than that of girder 5. This
was due to the fact that the GFRP box section was hollow outside of the constant moment
zone, which allowed local buckling to occur in the webs and compression flanges of the
GFRP box section (Figure 4-62), and ultimately lead to a compression failure of the
GFRP section by a combination of crushing and local buckling. This buckling is evident
by the abrupt shift in strains near failure as shown in Figures 4-53 and 4-54. The
compressive strain at which this local buckling occurred was far below the
manufacturer’s specified compressive failure strain of 0.0132. It is evident from Figure
4-42 that the flexural stiffness of girder 8 was significantly greater in the constant
moment region where it incorporated a grout diaphragm within the compression zone,
than within the shear span (just outside of the constant moment zone) where the box
section was left hollow.
73

Figure 4-36 compares the load-deflection responses of girders 8 and 9 in negative
bending. It is evident from this plot that the stiffness of these two specimens is quite
similar; however, girder 8 is slightly stiffer. This may be partially attributed to the
contribution of the concrete slab in tension prior to cracking, as well as the presence of a
steel wire mesh within the concrete slab which acted as tensile reinforcement. Another
reason for the slight discrepancy in the stiffness of these two specimens may have been
the presence of a grout diaphragm in the constant moment zone of girder 8. It was
mentioned earlier that this diaphragm caused a slight increase in flexural stiffness within
the constant moment zone. Although girder 9 was only loaded to 80kN in negative
bending, it is clear from its load-strain response (Figure 4-56) that local buckling had
already begun in the compression flange of the sheet pile section. This was made evident
by the abrupt change in the curve of the compression strain readings from SG1 just prior
to terminating the test.
4.3.3.2 Comparison of Behaviour in Negative and Positive Moments
Figures 4-33 and 4-43 compare the load-deflection and moment-curvature plots of
girders 4 and 5. It is evident from these plots that the flexural strength and stiffness (EIxx)
of the completely concrete filled section are approximately 45% and 175% higher in
positive bending than in negative bending. Similarly, Figures 4-34 and 4-44 compare the
load-deflection and moment-curvature plots of girders 7 and 8, respectively. The flexural
strength and stiffness of this box configuration are approximately 90% and 225% higher
in positive bending than in negative bending.
When a uniformly distributed load is applied to multi-span continuous beams of
constant flexural stiffness, negative bending moments over the interior supports can often
74

equal or exceed the maximum positive bending moments found between supports. If
flexural stiffness in negative bending is lower than in positive bending, however, the
inflection points tend to be located closer to the supports than they would be in a beam of
constant stiffness. This, in turn, reduces negative bending moments over the supports and
increases positive bending moments between supports. Therefore, while the negative
bending strength of girders 5 and 8 are substantially lower than their positive bending
counterparts (girders 4 and 7, respectively), the fact that their negative bending flexural
stiffness are also lower dictates that these sections could potentially be designed and
optimized for continuous beam applications such that negative and positive flexural
failures would occur almost simultaneously. This simultaneous failure mode would be
ideal because it means that the section is fully utilized in all regions (mid-span and over
supports) of the continuous beam, but not having much allowance for moment
redistribution.
4.4 Comparison with Conventional Reinforced Concrete and Prestressed Sections
In this section, the moment-curvature responses of two girders studied in this
chapter, namely girders 6 and 7, are compared with convention steel-reinforced concrete
(RC) and steel-prestressed girders of the same concrete strength, geometry, and outer
dimensions. Girder 6 failed in bond while girder 7 failed in flexure. The objectives were
to establish the quantity and placement of reinforcing steel or prestressing tendons
necessary to achieve the same moment at ultimate, and the same flexural stiffness as
girders 6 and 7. Conventional cracked section analysis has been used to obtain the
moment-curvature responses of the RC girders and the prestressed girders. This analysis
was performed using computer software called Response2000, which was developed by
75

Evan Bentz and Professor Michael P. Collins at the University of Toronto. In RC
sections, Steel rebar of 400MPa and 600MPa yield and ultimate strengths, respectively,
has been used in this analysis. In prestressed members, low-relaxation grade 1860MPa
steel 7-wire strands were used for the prestressing steel. For consistency, all prestressing
steel was assumed to have an effective prestress force such that the stress in the strands
was equal to 0.6fu (1116MPa), which corresponds to a prestrain of 0.00558. Provisions of
CAN/CSA-A23.3-94 regarding concrete cover and limitations on rebar and tendon
spacing have been satisfied. As such, a minimum of 40mm clear cover was used over all
bars and strands.
4.4.1 Comparison with Girder 6
For comparison with the bending moment at failure in girder 6 that failed in bond,
a hypothetical RC section called RC6a was created. In order to achieve the same flexural
strength as girder 6, it was necessary to use a row of 3-25M bars located 58mm (on
centre) above the bottom of the member, and another row of 2-10M bars located 111mm
(on centre) above the bottom of the member. The resultant member had a reinforcement
ratio of 1.07%. Similarly, to achieve similar flexural stiffness of girder 6, hypothetical
RC section RC6b required the use of a row of 3-15M bars located 48mm (on centre)
above the bottom of the member. The resultant member had a reinforcement ratio of
0.36%. Figure 4-64(a and b) illustrates the design and geometry of these hypothetical
sections, and Figure 4-66 compares the moment-curvature responses of RC6a and RC6b
with the response of girder 6. It is evident from this plot that the RC member matching
the strength of girder 6 had a stiffness that was approximately 90% higher than girder 6,
76

while the RC member matching the stiffness of girder 6 had a strength that was less than
half that of girder 6.
Also, for comparison with the bending moment at failure in girder 6, a
hypothetical prestressed section called PS6a was created. In order to achieve the same
flexural strength as girder 6, it was necessary to use a row of 4-S13 strands located 47mm
(on centre) above the bottom of the member. The design and geometry of this section is
shown in Figure 4-65(a). The moment-curvature response of this section is compared
with that of girder 6 in Figure 4-67. It is evident from this figure that section PS6a was
considerably stiffer than girder 6 because of the very high cracking moment. In fact, the
flexural stiffness of section PS6a was approximately 300% higher than that of girder 6. It
was not possible to design a prestressed member with a comparable flexural stiffness to
that of girder 6. This is because in a prestressed member cracking occurs at a relatively
high load, and all or most of the concrete section contributes to flexural stiffness prior to
cracking. The absence of concrete in the tension region of girder 6 dictates that it is softer
than any prestressed section that can be designed using the assumed cross sectional
geometry discussed earlier and shown in Figure 4-65(a). Therefore, unless an extremely
low prestressing force is employed, which would essentially render the section as a non-
prestressed reinforced concrete section anyway, a prestressed section with comparable
external dimensions (non-voided) and comparable stiffness to girder 6 cannot be created.
4.4.2 Comparison with Girder 7
For comparison with the bending moment at failure in girder 7 that failed in
flexure, a hypothetical RC section called RC7a was created. To achieve the same flexural
strength, it was necessary to use a row of 3-30M located 65mm (on centre) above the
77

bottom of the member, and another row of 2-30M bars located 137mm (on centre) above
the bottom of the member. The resultant member had a heavy reinforcement ratio of
2.49%. Similarly, for comparison with the flexural stiffness, hypothetical RC section
RC7b required a row of 2-15M bars located 48mm (on centre) above the bottom of the
member, and another row of 2-10M bars located 84mm (on centre) above the bottom of
the member, to achieve the same stiffness. The resultant member had a reinforcement
ratio of 0.37%. Figure 4-64(c and d) illustrates the design and geometry of these
hypothetical sections. Figure 4-68 compares the moment-curvature response of RC7a and
RC7b with the response of girder 7. It is evident from this plot that the RC member
matching the strength of girder 7 had a stiffness that was approximately 185% higher than
that of girder 7, while the RC member matching the stiffness of girder 7 had a flexural
strength equal to less than a third of the strength of girder 6.
Also, for comparison with the bending moment at failure in girder 7, hypothetical
prestressed section PS7a required the use of a row of 3-S15 strands located 48mm (on
centre) above the bottom of the member, and a row of 2-S15 strains located 109mm (on
centre) above the bottom of the member as shown in Figure 4-65(b). The moment-
curvature response of this section is compared with that of girder 7 in Figure 4-69. It is
evident from this figure that section PS7a was considerably stiffer than girder 7. In fact,
the flexural stiffness of section PS7a was approximately 380% higher than that of girder
7. Again, it was not possible to design a prestressed member with comparable flexural
stiffness to that of girder 7. The reason for this was discussed earlier.
78

79
Table 4-1. Girder specimen descriptions Girder # Type Bond Mechanisms Concrete Fill Bending Orientation 1 1 M1 Voided Concrete Positive 2 1 M2 Voided Concrete Positive 3 1 M1 & M3 Voided Concrete Positive 4 2 M1 Completely Filled Positive 5 2 M1 Completely Filled Negative 6 3 M1 Slab on Box Girder Positive 7 3 M1 & M4 Slab on Box Girder Positive 8 3 M1 & M4 Slab on Box Girder Negative 9 3 M3 None Positive (a) & Negative (b) Table 4-2. Summary of girder test results Girder # Peak Load
(kN) Load at Initial
Bond Slip (kN) Mode of Failure
1 250.0 250.0 Bond failure at concrete/GFRP interface 2 269.5 269.5 Bond failure at concrete/GFRP interface 3 317.0 317.0 Vertical pull-out of non-headed steel shear studs 4 294.0 294.0 Bond failure at concrete/GFRP interface 5 204.2 204.2 Lateral opening of GFRP sheet pile section 6 285.0 244.7 Bond failure at concrete/GFRP interface 7 430.0 230.5 Delamination and crushing of concrete slab 8 227.0 47.0 Local buckling and crushing of GFRP section 9a 230.7 NA Buckling of upper compression flange of GFRP box section

Figure 4-1(a). Data pertaining to GFRP sheet pile section used to fabricate girder specimens 1 to 5 (adapted from Creative
Pultrusions Inc web site www.creativepultrusions.com)
609.6mm
254mm
101.6mm
208.28mm 8.89mm
7.62mm
101.6mm
110°
80

Figure 4-1(b). Data pertaining to GFRP sheet pile section used to fabricate girder specimens 6 to 9 (adapted from Creative
Pultrusions Inc web site www.creativepultrusions.com)
609.6mm
254mm
101.6mm
208.28mm 8.89mm
7.62mm
101.6mm
110°
81

Figure 4-1(c). Data pertaining to GFRP flat sheet section used to fabricate box girders (adapted from Creative
Pultrusions Inc web site www.creativepultrusions.com)
82

(a) GFRP Sheet pile sections
(b) GFRP plates
Figure 4-2. GFRP sections used to fabricate test specimens
83

70mm
Creative Pultrusions SuperLoc 1610
Figure 4-3. Dimensions and test setup for girders 1 to 3
610mm
150mm
245mm
3
2
Silica pebble aggregates bonded to horizontal surfaces of concrete/GFRP interface using Sika Sikadur30
EpoxySystems 7SC adhesive for bonding to wet concrete on all surfaces of concrete/GFRP interface
EpoxySystems 7SC adhesive for bonding to wet concrete on all surfaces of concrete/GFRP interface, and non-headed shear studs on upper flanges
1
3100mm
400mm76x76x3 mm
steel mesh
P
250mm 250mm
Symmetric 4-point uniaxial bending
voiddiaphragm diaphragm
Geometry Construction
76x76x3 mm steel mesh
84

70mm
Creative Pultrusions SuperLoc 1610
Figure 4-4. Dimensions and test setup for girder 4
610mmEpoxySystems 7SC adhesive for bonding to wet concrete on all surfaces of concrete/GFRP interface
3100mm
400mm76x76x3 mm
steel mesh
P
Symmetric 4-point uniaxial bending
4
Geometry Construction
76x76x3 mm steel mesh
85

70mm
Creative Pultrusions SuperLoc 1610
Figure 4-5. Dimensions and test setup for girder 5
610mm
EpoxySystems 7SC adhesive for bonding to wet concrete on all surfaces of concrete/GFRP interface5
3100mm
400mm
P
Symmetric 4-point uniaxial bending
76x76x3 mm steel mesh
Geometry Construction
76x76x3 mm steel mesh
Simulates region over interior support of continuous beam
86

Figure 4-6. Picture of girder 4
87

60mm
Creative Pultrusions SuperLoc 1610
Figure 4-7. Dimensions and test setup for girders 6 and 7
610mm EpoxySystems 7SC adhesive for bonding to wet concrete on all surfaces of concrete/GFRP interface
EpoxySystems 7SC adhesive for bonding to wet concrete on all surfaces of concrete/GFRP interface, and headed shear studs on upper flanges
6 Sika Sikadur30 Epoxy at interface between sheet pile section and flat GFRP sheet
Sika Sikadur30 Epoxy at interface between sheet pile section and flat GFRP sheet
Creative Pultrusions Pultex 1500 flat sheet
(9.5mm thick)
7
3100mm
400mm76x76x3 mm
steel mesh
P
250mm 250mm
Symmetric 4-point uniaxial bending
hollow boxdiaphragm diaphragm
Geometry Construction
76x76x3 mm steel mesh
88

60mm
Creative Pultrusions SuperLoc 1610
Figure 4-8. Dimensions and test setup for girder 8
610mm
EpoxySystems 7SC adhesive for bonding to wet concrete on all surfaces of concrete/GFRP interface, and headed shear studs on upper flanges
Sika Sikadur30 Epoxy at interface between sheet pile section and flat GFRP sheet
Creative Pultrusions Pultex 1500 flat sheet
(9.5mm thick)8
3100mm
400mm
76x76x3 mm steel mesh
P
Symmetric 4-point uniaxial bending
500mmhollow boxdiaphragm
hollow box
Geometry Construction
76x76x3 mm steel mesh
Simulates region over interior support of continuous beam
89

Creative Pultrusions SuperLoc 1610
Figure 4-9. Dimensions and test setup for positive bending of girder 9
Steel threaded rod used to bolt flat sheet to sheet pile section
Sika Sikadur30 Epoxy at interface between sheet pile section and flat GFRP sheet
Creative Pultrusions Pultex 1500 flat sheet
(9.5mm thick)9a
3100mm
400mm
P
250mm 250mm
Symmetric 4-point uniaxial bending
hollow boxdiaphragm diaphragm
Geometry Construction
90

Creative Pultrusions SuperLoc 1610
Figure 4-10. Dimensions and test setup for negative bending of girder 9
Steel threaded rod used to bolt flat sheet to sheet pile section
Sika Sikadur30 Epoxy at interface between sheet pile section and flat GFRP sheet
Creative Pultrusions Pultex 1500 flat sheet
(9.5mm thick) 9b
3100mm
400mm
P
250mm 250mm
Symmetric 4-point uniaxial bending
hollow boxdiaphragm diaphragm
Geometry Construction
Simulates region over interior support of continuous beam
91

Figure 4-11. Cross-section of girders 6, 7, and 8
Figure 4-12. Coupons used for assessing material properties of GFRP sections
10mm
30mm
340mm50mm
92

Figure 4-13. Stress-strain curves from coupon tension tests used to assess material properties of GFRP sheet piles
(b) GFRP sheet pile sections from girders 6, 7, 8, and 9
(a) GFRP sheet pile sections from girders 1, 2, 3, 4, and 5
0
50
100
150
200
250
300
350
400
450
500
0 2000 4000 6000 8000 10000 12000 14000 16000 18000
fu = 465MPafu = 561MPafu = 574MPa
Strain (μe)
Stre
ss (M
Pa)
0
50
100
150
200
250
300
350
0 2000 4000 6000 8000 10000 12000 14000
fu = 398.3MPafu = 336.6MPa
Strain (μe)
Stre
ss (M
Pa)
93

Figure 4-15. Application of M1 adhesive bond mechanism
94
Figure 4-14. Stress-strain curves from coupon tension tests used to assess material properties of GFRP plates
0
50
100
150
200
250
300
0 2000 4000 6000 8000 10000 12000 14000 16000
fu = 263MPafu = 270MPafu = 271MPa
Strain (μe)
Stre
ss (M
Pa)

Figure 4-17.Headed and non-headed studs (bond mechanisms M3 and M4)
M3 M4
Figure 4-16. M2 silica pebble aggregate bond mechanism
95
(a) (b)

Figure 4-19. Concrete pour and vibration
Figure 4-18. Foam used to create void within Type 1 girder specimens
96

Figure 4-21. Negative bending test setup
Figure 4-20. Positive bending test setup
97

SG1 SG2
P/2 P/2
Constant moment zone
SectionSG5
SG4
SG3245mm
165mm
Constant moment zone
Top
Side
BottomSG1
SG3
SG3 & SG4
SG5
SG1 & SG2
SG4
SG5
SG2
50mm
All gauges mounted at mid-span (centre of constant moment zone)
SG1 SG2 SG3 SG4 SG5 SG8 SG9
1
2
3
4
5
6
7
8
9
Figure 4-22. Strain gauges at mid-span
Shaded boxes indicate inclusion of instrument
SG8 SG9 SG8 & SG9
SG9
SG8
254.5mm
98

Figure 4-23. Strain gauges and rosettes within shear span
P/2 P/2
Shear span
Section
SG6 SG7
SR1
SG6 SG7 SR1
1
2
3
456
7
8
9
127mm
Top
Side
Bottom
1200mm
SG6
SG6 & SG7
SG7
SR1
1223mm
45°
Shear Span
Support
Shaded boxes indicate inclusion of instrument
99

Figure 4-24. PI gauges at mid-span
P/2 P/2
Constant moment zone
Section264mm
114mm
All gauges mounted at mid-span (centre of constant moment zone)
15mm
15mm
PG1
PG2
PG3
PG4
Constant moment zone
Top
Side
Bottom
PG1
PG1
PG2
PG2
PG3
PG3
PG4
PG4
PG5
PG5PG5
PG1 PG2 PG3 PG4 PG5
1
2
3
456
7
8
9
Shaded boxes indicate inclusion of instrument
PG4100

Figure 4-25. PI gauges within shear span
P/2 P/2
Shear span
Section
15mmPG6
PG6
1
2
3
456
7
8
9
Shear Span
Top
Side
Bottom
1200mm
PG6
PG6
Support
Shaded boxes indicate inclusion of instrument
101

P/2 P/2
Constant moment zone
Section
Constant moment zone
Side
Bottom
All gauges mounted at mid-span (centre of constant moment zone)
LP1 LP2
1
2
3
4
5
6
7
8
9
Figure 4-26. Linear Potentiometers (LPs) at mid-span
Shaded boxes indicate inclusion of instrument
LP1 & LP2LP1 LP2
102

Shear Span
Support
Figure 4-27. Linear Potentiometers (LPs) at ends of girder
P/2 P/2
Shear span
Section
LP3 LP4
1
2
3
456
7
8
9
Shaded boxes indicate inclusion of instrument
Top
Side
Bottom
LP3
LP3
LP3
LP4
LP4
LP4
An identical setup was used to measure bond slip at the concrete/GFRP interface
at both ends of each girder
LP3
LP4
103

0
50
100
150
200
250
300
350
400
450
500
0 10 20 30 40 50 60 70 80 90
Figure 4-28. Load-deflection responses of all girder specimens
Deflection (mm)
Load
(kN
)
1 2
34
5
6
7
8
1 2 3
4 6 7
5 8
P/2 P/2
P/2 P/2
9a
9b
9a
9b
104

Figure 4-29. Load-deflection responses of girder specimens 1, 2, and 3
0
50
100
150
200
250
300
350
0 5 10 15 20 25 30 35 40
1 2
3
Deflection (mm)
Load
(kN
)
P/2 P/2
1 2 3
0
50
100
150
200
250
300
350
400
450
500
0 10 20 30 40 50 60 70 80 90
Figure 4-30. Load-deflection responses of girder specimens 6 and 7
6
7
Deflection (mm)
Load
(kN
)
P/2 P/2
6 7
M1 Bond M2 Bond M1 & M3 Bond
M1 Bond M1 & M4 Bond
105

0
50
100
150
200
250
0 10 20 30 40 50 60
Figure 4-32. Load-deflection responses of girder specimens 5 and 8
58
Deflection (mm)
Load
(kN
)
P/2 P/2
5 8
0
50
100
150
200
250
300
350
0 5 10 15 20 25 30 35
Figure 4-31. Load-deflection responses of girder specimens 1, 4, and 6
4
Deflection (mm)
Load
(kN
)1
P/2 P/2
6
1 4 6
M1 Bond M1 Bond M1 Bond
M1 Bond M1 & M4 Bond
106

0
50
100
150
200
250
300
350
0 5 10 15 20 25 30 35 40 45
0
50
100
150
200
250
300
350
400
450
500
0 10 20 30 40 50 60 70 80 90
Figure 4-33. Load-deflection responses of girder specimens 4 and 5
4
Deflection (mm)
Load
(kN
)
P/2 P/2
5
P/2 P/2
Figure 4-34. Load-deflection responses of girder specimens 7 and 8
Deflection (mm)
Load
(kN
)
7
8
P/2 P/2
P/2 P/2
5
8
7
4
M1 Bond
M1 Bond
M1 & M4 Bond
M1 & M4 Bond
107

0
50
100
150
200
250
300
350
400
450
500
0 10 20 30 40 50 60 70 80 90
7P/2 P/2
7
M1 & M4 Bond
9a
Load
(kN
)
Deflection (mm)
9a
0
50
100
150
200
250
0 10 20 30 40 50 60
9b
Deflection (mm)
Load
(kN
)
8P/2 P/2
8
M1 & M4 Bond
9b
Figure 4-36. Load-deflection responses of girder specimens 8 and 9b in negative bending
Figure 4-35. Load-deflection responses of girder specimens 7 and 9a in positive bending
108

0
50
100
150
200
250
0 0.005 0.01 0.015 0.02 0.025 0.03 0.035
Figure 4-37. Moment-curvature response of girder specimens 1, 2, and 3
1
2
3
Curvature (1/m)
Ben
ding
Mom
ent (
kNm
)
1 2 3
P/2 P/2
M1 Bond
0
50
100
150
200
250
300
350
0 0.01 0.02 0.03 0.04 0.05 0.06
6
7
Figure 4-38. Moment-curvature response of girder specimens 6 and 7
Curvature (1/m)
Ben
ding
Mom
ent (
kNm
)
6 7
P/2 P/2
M1 Bond
M2 Bond M1 & M3 Bond
M1 & M4 Bond
109
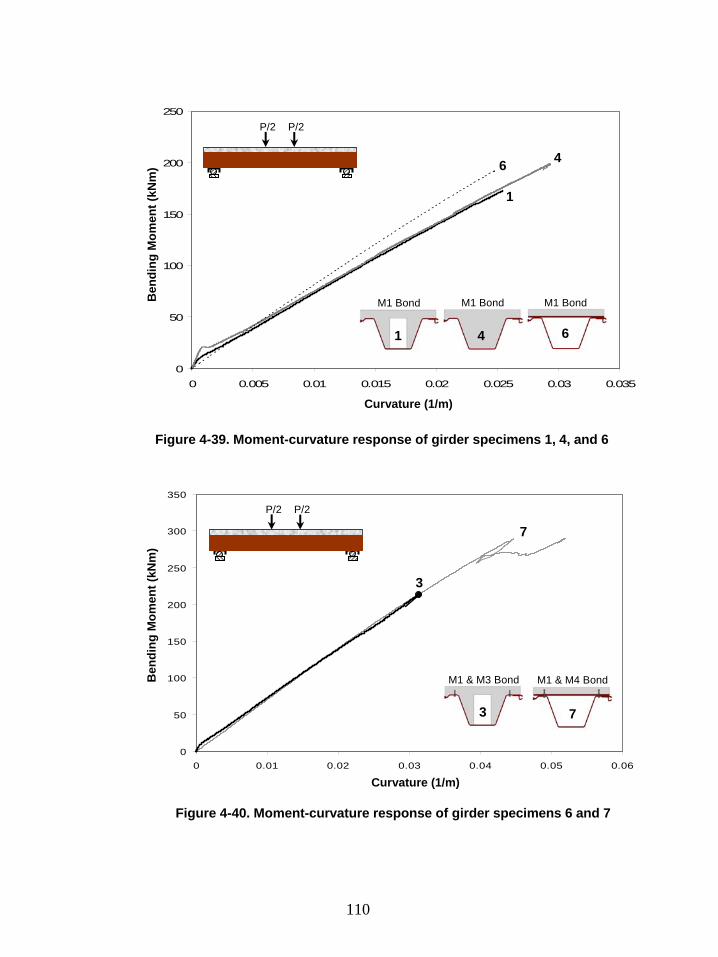
0
50
100
150
200
250
300
350
0 0.01 0.02 0.03 0.04 0.05 0.06
7
3
3 7
Figure 4-40. Moment-curvature response of girder specimens 6 and 7
Curvature (1/m)
Ben
ding
Mom
ent (
kNm
)
P/2 P/2
0
50
100
150
200
250
0 0.005 0.01 0.015 0.02 0.025 0.03 0.035
Figure 4-39. Moment-curvature response of girder specimens 1, 4, and 6
Curvature (1/m)
Ben
ding
Mom
ent (
kNm
) 6 4
1
1 4 6
P/2 P/2
M1 Bond M1 Bond M1 Bond
M1 & M3 Bond M1 & M4 Bond
110

Figure 4-41. Moment-curvature response of girder specimens 5 and 8
Curvature (1/m)
Ben
ding
Mom
ent (
kNm
)
0
20
40
60
80
100
120
140
160
0 0.01 0.02 0.03 0.04 0.05 0.06 0.07
8 5
5 8
P/2 P/2
Note: Response for specimen 8 was taken within hollow box
region of the girder (shear span)
0
20
40
60
80
100
120
140
160
180
0 0.01 0.02 0.03 0.04 0.05 0.06
Ben
dnig
Mom
ent (
kNm
)
Figure 4-42. Moment-curvature response of girder specimen 8 within diaphragm region (constant moment zone), and within hollow box
region (shear span)
Curvature (1/m)
diaphragm region (constant moment zone)
hollow box region(shear span)
P/2 P/2
8
M1 Bond
M1 & M4 Bond
M1 & M4 Bond
111

0
50
100
150
200
250
0 0.01 0.02 0.03 0.04 0.05 0.06 0.07
Figure 4-43. Moment-curvature responses of girder specimens 4 and 5
4
Curvature (1/m)
Ben
ding
Mom
ent (
kNm
)
P/2 P/2
5
P/2 P/2
5
4
0
50
100
150
200
250
300
350
0 0.01 0.02 0.03 0.04 0.05 0.06
Figure 4-44. Moment-curvature responses of girder specimens 7 and 8
Curvature (1/m)
Ben
dnig
Mom
ent (
kNm
)
7
8
P/2 P/2
P/2 P/2
8
7
Note: Response for specimen 8 was taken within hollow box
region of the girder (shear span)
M1 Bond
M1 Bond
M1 & M4 Bond
M1 & M4 Bond
112

0
20
40
60
80
100
120
140
160
0 0.01 0.02 0.03 0.04 0.05 0.06
0
50
100
150
200
250
300
350
0 0.01 0.02 0.03 0.04 0.05 0.06
Figure 4-45. Moment-curvature responses of girder specimens 9a and 7
7
M1 & M4 Bond
9a
Ben
ding
Mom
ent (
kNm
)
Curvature (1/m)
P/2 P/2
7
9a
Figure 4-46. Moment-curvature responses of girder specimens 9b and 8
8
M1 & M4 Bond
9b
Ben
ding
Mom
ent (
kNm
)
Curvature (1/m)
P/2 P/2
P/2 P/2
P/2 P/2
Note: Response for specimen 8 was taken within hollow box
region of the girder (shear span)
9b
8
113

Figure 4-47. Load versus bond slip of girder specimens 1, 2, and 3
0
50
100
150
200
250
300
350
-0.2 -0.1 0 0.1 0.2
1
2
3
Slip (mm)
Load
(kN
)
Figure 4-48. Load versus bond slip of girder specimen 4
0
50
100
150
200
250
300
350
-0.05 0 0.05 0.1 0.15 0.2 0.25
4
Slip (mm)
Load
(kN
)
114

Figure 4-49. Load versus bond slip of girder specimens 6 and 7
0
50
100
150
200
250
300
350
400
450
500
-0.1 -0.05 0 0.05 0.1
6
Slip (mm)
Load
(kN
)7
115
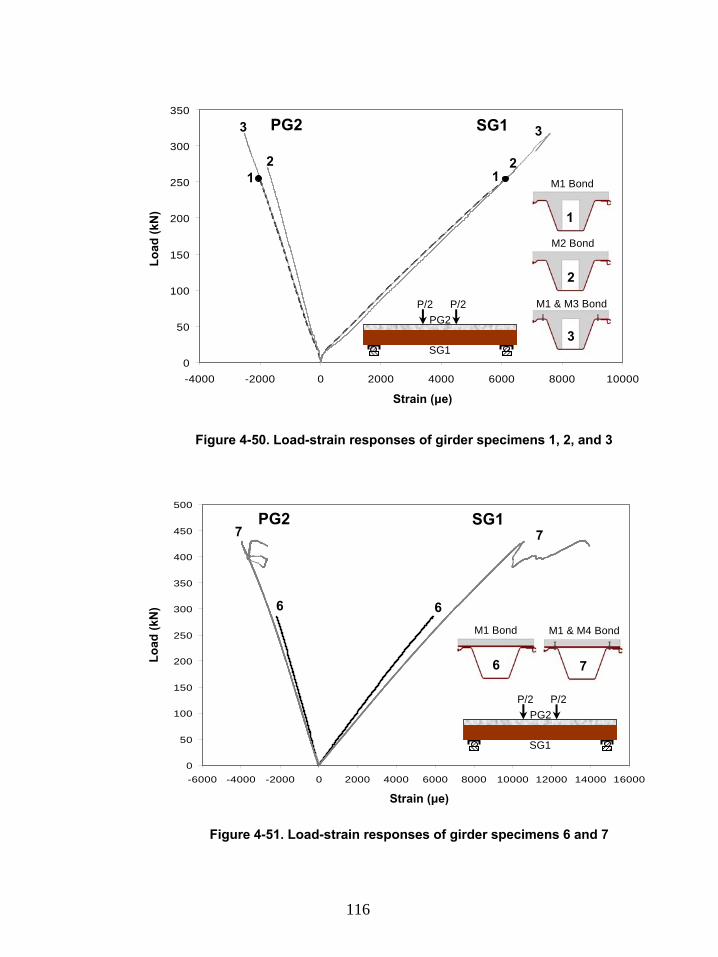
Figure 4-50. Load-strain responses of girder specimens 1, 2, and 3
0
50
100
150
200
250
300
350
-4000 -2000 0 2000 4000 6000 8000 10000
12
3Lo
ad (k
N)
12
3 SG1PG2
P/2 P/2PG2
SG13
2
1
0
50
100
150
200
250
300
350
400
450
500
-6000 -4000 -2000 0 2000 4000 6000 8000 10000 12000 14000 16000
Figure 4-51. Load-strain responses of girder specimens 6 and 7
Load
(kN
)
7 7
6 6
SG1PG2
P/2 P/2PG2
SG1
6 7
M1 Bond
M1 Bond
M2 Bond
M1 & M3 Bond
M1 & M4 Bond
Strain (μe)
Strain (μe)
116

0
50
100
150
200
250
-10000 -5000 0 5000 10000 15000 20000
Figure 4-53. Load-strain responses of girder specimens 5 and 8
Load
(kN
)
8 (SG6)
8 (PG6)
5 (SG1)
5 (PG2)
Note: Strains for specimen 8 were taken from slightly outside of
constant moment zone
P/2 P/2SG1 SG6
PG2 PG6
8
5
0
50
100
150
200
250
300
350
-4000 -2000 0 2000 4000 6000 8000
Figure 4-52. Load-strain responses of girder specimens 1, 4, and 6
Strain (μe)
Load
(kN
)4 4
11
6 6
SG1PG2
P/2 P/2PG2
SG1
1
4
6
M1 Bond
M1 Bond
M1 Bond
M1 Bond
M1 & M4 Bond
Strain (μe)
117
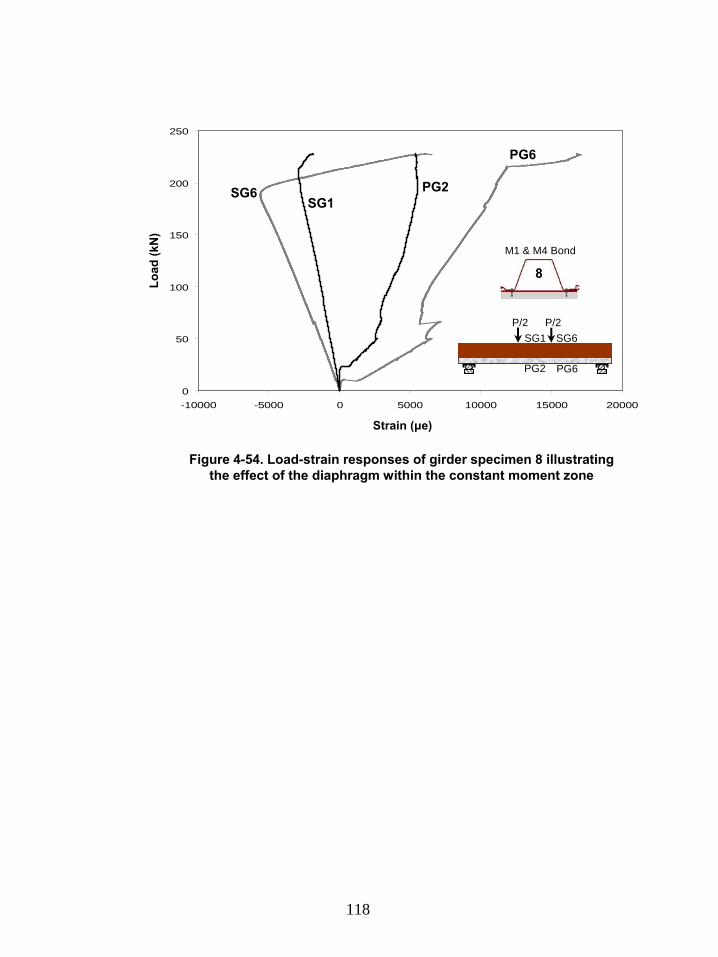
0
50
100
150
200
250
-10000 -5000 0 5000 10000 15000 20000
Figure 4-54. Load-strain responses of girder specimen 8 illustrating the effect of the diaphragm within the constant moment zone
Load
(kN
)
SG1PG2
PG6
SG6
P/2 P/2SG1 SG6
PG2 PG6
8
M1 & M4 Bond
Strain (μe)
118

0
50
100
150
200
250
-10000 -5000 0 5000 10000 15000 20000
0
50
100
150
200
250
300
350
400
450
500
-5000 0 5000 10000 15000
Figure 4-56. Load-strain responses of girder specimens 9b and 8
Figure 4-55. Load-strain responses of girder specimens 9a and 7
7
M1 & M4 Bond
8
M1 & M4 Bond
9a
9b
Strain (μe)
Load
(kN
)
8 (SG6)8 (PG6)
Note: Strains for specimen 8 were taken from slightly outside of
constant moment zone
P/2 P/2SG1 SG6
PG2 PG6
P/2 P/2SG1
SG8
9(SG1)
9(SG8)
P/2 P/2
SG1
SG8
9 (SG8)9 (SG1)
P/2 P/2PG2
SG1
7 (SG1)7 (PG2)
Strain (μe)
Load
(kN
)
119

Figure 4-58. Pull-out of mechanism M3 studs in girder 3
Figure 4-57. Bond failure in girders 1, 2, and 4
120

Figure 4-59. Bond failure in girder 6
Figure 4-60. Delamination and crushing of concrete in girder 7
121

Figure 4-62. Buckling and crushing of webs and compression flange of girder 8
Figure 4-61. Lateral opening of sheet pile in girder 5
122

Figure 4-63. Warping and local buckling of upper flange of girder 9 in positive bending (9a)
123

Figure 4-64. Hypothetical conventional RC sections designed to match strength and stiffness of girders 6 and 7
(a) RC6a designed to match strength of girder 6 (b) RC6b designed to match stiffness of girder 6
(c) RC7a designed to match strength of girder 7 (d) RC7b designed to match stiffness of girder 7
58mm3-25M
2-10M
111mm48mm
3-15M
65mm3-30M
2-30M
137mm48mm
2-15M
2-10M
84mm
386mm
208mm
245mm
79mm610mm
386mm
208mm
245mm
79mm610mm
386mm
208mm
245mm
79mm610mm
386mm
208mm
245mm
79mm610mm
ρ
= 1.07% ρ
= 0.36%
ρ
= 2.49% ρ
= 0.37%
124

Figure 4-65. Hypothetical conventional prestressed concrete sections designed to match the strength of girders 6 and 7
(a) PS6a designed to match strength of girder 6 (b) PS7a designed to match strength of girder 7
386mm
208mm
245mm
79mm610mm
386mm
208mm
245mm
79mm610mm
48mm3-S15
2-S15109mm
47mm4-S13
fe
= 0.6fu fe
= 0.6fu
125

0
20
40
60
80
100
120
140
160
180
200
0 0.05 0.1 0.15 0.2
6
Figure 4-66. Moment-curvature response of RC6a, RC6b, and girder 6
Curvature (1/m)
Ben
ding
Mom
ent (
kNm
)
6
M1 Bond
RC6a
RC6b
58mm3-25M
2-10M111mm
ρ
= 1.07%
RC6a
48mm3-15M
ρ
= 0.36%
RC6b
Figure 4-67. Moment-curvature response of PS6a and girder 6
0
20
40
60
80
100
120
140
160
180
200
-0.01 0.01 0.03 0.05 0.07 0.09 0.11 0.13
Curvature (1/m)
Ben
ding
Mom
ent (
kNm
)
6
6
M1 Bond
PS6a
47mm4-S13fe
= 0.6fu
PS6a
126

0
50
100
150
200
250
300
350
0 0.05 0.1 0.15 0.2
7
M1 & M4 Bond
Figure 4-68. Moment-curvature response of RC7a, RC7b, and girder 7
Figure 4-69. Moment-curvature response of PS7a and girder 7
Curvature (1/m)
Ben
ding
Mom
ent (
kNm
)
7
RC7a
RC7b
65mm3-30M
2-30M137mm
ρ
= 2.49%
RC7a
48mm2-15M
2-10M84mm
ρ
= 0.37%
RC7b
0
50
100
150
200
250
300
350
-0.005 0.005 0.015 0.025 0.035 0.045 0.055 0.065
Curvature (1/m)
Ben
ding
Mom
ent (
kNm
)
7
M1 & M4 Bond
7
PS7a
48mm3-S15
2-S15109mm
fe
= 0.6fu
PS7a
127

CHAPTER 5: ANALYTICAL MODEL OF GFRP STAY-IN-PLACE SYSTEM
FOR CONCRETE GIRDERS
5.1 Introduction
Chapter 4 has introduced the experimental program in which nine girders, referred
to as 1 to 9, were fabricated using trapezoidal pultruded GFRP sheet pile sections as stay-
in-place structural formwork for concrete. All girders had a total length of 3350mm, and
incorporated the GFRP sheet pile section shown in Figure 4-1(a and b). Girders of three
unique configurations were tested, namely, sections completely filled with concrete,
sections with a voided concrete core, and an all-GFRP box girders with a top concrete
slab. Four different bond mechanisms between the concrete and the GFRP section were
investigated.
In this chapter, an analytical model has been developed to predict the complete
flexural behavior of the specimens. The model is intended for modeling specimens tested
in positive bending only (i.e. girders 1, 2, 3, 4, 6, and 7). The model is somewhat similar
to that described for the slabs in Chapter 3 in that it establishes the moment-curvature
response of the section, which is then terminated at a point governed either by flexure or
bond failure. Conventional cracked section analysis based on equilibrium of forces and
strain compatibility is carried out, assuming full bond between the concrete and the GFRP
section prior to failure. A layer-by-layer technique is adopted in order to integrate
stresses in the concrete and the GFRP throughout the depth of the member.
128

5.2 Description of the Analytical Model
5.2.1 Constitutive Relationships
The analytical model was based upon the following constitutive relationships for
concrete and GFRP:
5.2.1.1 Concrete in Compression:
For concrete in compression, the widely accepted stress-strain model presented by
Collins and Mitchell (1997) was adopted. As shown in Figure 5-1, the stress (fc) relates
to strain (εc) in accordance with the following equations:
⎟⎟⎟⎟
⎠
⎞
⎜⎜⎜⎜
⎝
⎛
⎟⎠⎞⎜
⎝⎛+−
⎟⎠⎞⎜
⎝⎛
= nk
c
c
c
c
cc
n
nff
'1
''
εε
εε
17'
8.0 Cfn +=
62'
67.0 Cfk += (5-1)
where, fc’ is the compressive strength of concrete, and εc’ is the strain in concrete at a
stress of fc’. When the strain εc exceeds 0.0035 (CAN/CSA-A23.3-94) it is assumed that
concrete has crushed and therefore adopts a zero stress.
5.2.1.2 Concrete in Tension:
For concrete in tension, a linear stress-strain relationship was assumed prior to
cracking.
ccc Ef ε= (for rc ff ≤ ) (5-2)
129

Initial modulus of elasticity for concrete Ec was approximated in accordance with a
suggested formula in CAN/CSA-A23.3-94 as follows.
( )5.1
23006900'3300 ⎟
⎠⎞
⎜⎝⎛+= c
cc fEγ
(5-3)
where γc is the density of concrete. It should be noted that the equation used to calculate
Ec represents the secant modulus at 0.4fc’ stress, and therefore is not representative of the
initial tangent modulus at zero strain, Eco; however, for most cases, the difference
between these values is negligible (Collins and Mitchell, 1997). Therefore, for the
purposes of this model, Eco was approximated using the aforementioned equation for Ec.
Modulus of rupture was taken as '6.0 cr ff = (CAN/CSA-A23.3-94). When the rupture
strain of concrete is exceeded, an average tensile stress in the concrete was assumed to be
smeared throughout the cracked region using a tension stiffening function posed by
Vecchio and Collins (Collins and Mitchell, 1997). This tension stiffening relationship is
illustrated in Figure 5-1, and describes the stress versus strain relationship as follows:
( )rc
rc
ff
εεαα
−+=
500121 (for )
where εr is the strain
rc ff > (5-4)
at cracking. α1 is a factor accounting for the bond characteristics of
nal steel-reinforced concrete members, it has been shown that
tension
the reinforcement and is taken as 1.0 to model the zero-slip characteristics of adhesively
bonded reinforcement as observed in the experiments (Chapter 4). α2 is a factor
accounting for sustained or repeated loading, taken as 1.0 for short term quasi-static
monotonic loading.
For conventio
stiffening is only effective within a limited distance (dTS) from the centroid of the
reinforcing bars. This distance is generally accepted as fluctuating between 0 and 7.5
130

times the diameter of the reinforcing bars, thus having an average value of approximately
3.75 times the diameter of the reinforcing bars. The value of dTS is likely to differ for
GFRP reinforcement due to its lower elastic modulus. In lieu of more extensive studies
of tension stiffening behaviour of FRP-reinforced concrete, the model discussed in this
investigation assumed the value of dTS to be equal to 3.75 times the thickness of the
GFRP form. Figure 5-2 illustrates how this concept applies to Type 2 specimens (girder
4) in positive bending. Type 1 specimens (girders 1, 2, and 3) would have the same dTS
value as Type 2 specimens, except that much of the cracked zero stress region shown in
Figure 5-2 would be displaced by the void present in Type 1 specimens, thus altering the
post-cracking behaviour of these specimens.
5.2.1.3 GFRP Sections in Tension or Compression:
, and stacking sequences for the
ltrud
The resin matrix properties, fibre properties
pu ed GFRP sections used in this investigation are proprietary data. However, the
manufacturer has published some data pertaining to the mechanical behaviour of these
sections (Figure 4-1). Also, tension coupon tests were conducted by the author (Figures
4-12 to 4-14). A linear stress-strain relationship was assumed in both tension and
compression. The elastic modulus, tensile strength, and compression strength of the
GFRP sheet pile sections were taken as 26.2GPa, 276MPa, and 241MPa, respectively,
when simulating Types 1 and 2 specimens (girders 1 to 5). The elastic modulus, tensile
strength, and compression strength of the GFRP sheet pile sections were taken as
26.2MPa, 517MPa, and 345MPa, respectively, when simulating Type 3 specimens
(girders 6 to 9). Although manufacturer’s data were used, Young’s modulus agreed well
with coupon test results for the sheet pile sections. Since no tension or compression
131

failure occurred in the GFRP sections, the use of strengths reported by the manufacturer,
which were lower than those from the coupons, should not matter. For the GFRP flat
sheet sections, there was some discrepancy between the manufacturer’s published data
and the data obtained from coupon tests performed by the author. An elastic modulus of
18GPa was ultimately selected in accordance with the author’s experimental flexural
coupon tests. In general, the material properties of the flat GFRP sections are less
important due to the close proximity of this material to the neutral axis of the section.
5.2.2 Section Geometry
In order to reduce the complexity of the model, the geometry of the GFRP sheet
pile section was simplified to the form illustrated in Figure 5-3(a), from the actual section
used experimentally, shown in Figure 4-1. The primary difference is the omission of the
pin-and-eye joint details along the edges of the upper flanges. It was decided that this
omission would have a negligible effect on the flexural response of the member due to the
close proximity of this detail to the neutral axis of the section. All other aspects of the
sections were modeled in a manner that precisely mimics the geometry of the actual
sections. The assumed geometry of each of the specimen types is shown in Figures 5-3(b
to d). Despite the simplified geometry, integrating stresses over the section remained
quite complex. As mentioned earlier, the section was divided into several horizontal
layers in order to account for the non-linear stress distribution. As such, it was necessary
to calculate the average width of each material (concrete or GFRP) within each horizontal
layer in the section, and subsequently multiply this width by the thickness of the layer in
order to obtain the cross-sectional area of each material present in a layer. In order to do
132

so, the section was divided into 5 general regions (Figure 5-4), and each region was
assessed in a unique fashion as follows:
Region 1:
Region 1 comprised all layers within the lower flange of the GFRP sheet pile
section. In this region, only GFRP is present, and the width of the GFRP present in a
layer within this region (WGFRP) was calculated as follows:
( )( )θtan5.02 ++= itBW lfGFRP (5-5)
where t is the thickness of one discrete layer within the flange, i is the summation of all
layers from the bottom of the flange to the layer of interest, Blf is the width of the lower
flange taken at the bottom of the section, and θ is the angle of the webs of the sheet pile
section measured with respect to the vertical. In lieu of this rigorous approach, one can
possibly use a constant width, Blf, for all layers within this region.
Region 2:
Region 2 was defined as any layer at an elevation between the upper and lower
flanges of the sheet pile section. In this region, the width of GFRP present in a given
layer was calculated as follows:
θcos2 web
GFRPt
W = (5-6)
where tweb is the thickness of the web of the sheet pile section. The width of concrete
present in a given layer in this region varied depending upon whether the section being
modeled was of Type 1, 2, or 3. For Type 2 specimens (girders 4 and 5), the web was
133

totally filled with concrete. Therefore, for these specimens, the width of concrete present
in a given layer (Wconcrete) was calculated as follows:
( )( θθ
tan5.02cos2
++⎟⎠⎞
⎜⎝⎛ −= it
tBW web
lfconcrete ) (5-7)
In Type 1 specimens (girders 1, 2, and 3), the width of a concrete layer could be
calculated in an identical manner as described for Type 2 specimens (Equation 5-7) with
the exception that the width of the void (Bvoid) had to be subtracted from the resultant
value. In Type 3 specimens (girders 6, 7, and 8), there is no concrete within Region 2.
Region 3:
Region 3 comprised all layers at an elevation that passes through the upper flange
of the GFRP sheet pile section. In this region, the width of GFRP present in a given layer
was calculated as follows:
( )(( )θθ
tan5.02cos2
flangepileweb
wtGFRP tHitt
BBW −−+−⎟⎠⎞
⎜⎝⎛ +−= ) (5-8)
where B is the total width of the sheet pile section, Hpile is the total depth of the sheet pile
section, tflange is the thickness of the flanges of the sheet pile section (the same value for
both upper and lower flanges), and Bwt is the distance between the outer surfaces of the
webs of the sheet pile section at the elevation where the webs meet the bottom surface of
the upper flange. One could also simplify this by assuming a constant width (B - Bwt) for
all layers in this region. The width of concrete present in a given layer in this region was
calculated as follows:
( )( θθ
tan5.02cos2
++⎟⎠⎞
⎜⎝⎛ −= it
tBW web
lfconcrete ) (5-9)
134

Again, this could have been simplified as Wconcrete = Bwt.
Region 4:
Region 4 comprised all layers at an elevation within the thickness of the flat
GFRP plate that makes up the upper flange of the GFRP box section in Type 3 specimens
(girders 6, 7, and 8). The width of GFRP in each layer in this region is simply equal to
the total width of the section, B. In all other specimens (girders 1 though 5), there is no
GFRP present in a layer within this region, and the width of concrete in each layer in this
region is equal to the total width of the section, B.
Region 5:
Region 5 comprised all layers at an elevation above Region 4. In this region, all
layers are composed entirely of concrete, and have a width equal to the total width of the
section, B.
5.2.3 Algorithm for Moment-Curvature Response
Utilizing the aforementioned constitutive relationships for the materials and
geometric relationships for the cross-section, a computer algorithm was written in
FORTRAN90 to establish the moment-curvature response of the member, in a similar
manner to that used for the slabs in Chapter 3, as follows:
Step 1: An initial strain is assumed at the extreme compression fiber of the section.
135

Step 2: The location of the neutral axis is then assumed in order to establish a complete
strain profile assuming a linear strain distribution.
Step 3: The stresses in the concrete and the GFRP are then determined within a finite
number (1000) of layers throughout the depth of the cross section using the
aforementioned stress-strain relationships for concrete and GFRP (Figure 5-2).
Step 4: The stresses are integrated with the areas of their respective layers and summed in
tension and compression. If the sum is not equal to approximately zero, then a new value
of the neutral axis depth is assumed in step 2 and the process is repeated until equilibrium
is satisfied.
Step 5: The sum of the moments generated by all forces from each layer (M) is calculated
and the corresponding curvature (ψ) is also calculated as the slope of the strain profile for
the particular compressive strain assumed at step 1. This provides one point on the M-ψ
response. The strain at the extreme tension fiber is then increased slightly in step 1 and
the process is repeated, to establish the full M-ψ response.
A simplified flowchart illustrating the procedure for establishing the moment-curvature
response is provided in Figure 5-5.
5.2.4 Failure Criteria
Two failure criteria were considered in order to account for the possibility of
flexural (tension or compression) failure, or bond failure. Concrete shear (diagonal
136

tension) failure was not considered to occur, given the relatively long span of this type of
girder. In order to model these failure criteria, the aforementioned moment-curvature
algorithm was repeated with the exclusion of tension stiffening in concrete to establish
the termination (failure) point. The purpose of this omission was to account for the fact
that both flexure and bond failure are likely to occur at the location of a crack. Therefore,
the flexural response of each member is established first by an algorithm incorporating
tension stiffening, but the termination point was established by a second algorithm at a
crack location that assumes no tension stiffening. This second algorithm included a few
additional elements necessary to check for the various failure criteria as discussed next.
Throughout the formulation of the moment-curvature plot, the maximum values of
compression and tension strains are constantly monitored. A flexural failure is defined by
an event in which either of these strains exceeds the failure strain of the concrete or the
GFRP, respectively.
To check for bond failure, the horizontal shear stress (τ) at any level in the section
can be calculated using the following fundamental equation of mechanics:
ixx
i
BIVQ
=τ (5-10)
where V is the vertical shear force experienced by the girder at a given cross section
(bending moment divided by shear span), Ixx is the second moment of area of the section
about its neutral axis, and Bi is the width of the section at the elevation of interest. Qi is
the first moment of area of the region above or below the elevation of interest, taken
about the neutral axis of the cross-section of the hybrid section. It should be noted that
137

both Ixx and Qi were transformed in accordance with the relative elastic moduli of the
materials present in the sections (Figure 5-6), which will later be discussed in detail. In
most cases, the maximum horizontal shear stress occurs at or near the neutral axis of a
section. Since the neutral axis of these hybrid sections tends to be located slightly above
the upper flange of the GFRP sheet pile section, it can be assumed that bond failure
between the concrete and the GFRP section is initiated at the elevation of the upper
surface of the top flange of the GFRP section. Prior to cracking, this is a fairly simplistic
calculation. However, once flexural cracking occurs, the moment of inertia of the section
is reduced and the neutral axis of the section begins to shift. Therefore, at any given load,
the values of Ixx and Qi are only constant within the uncracked region, where bending
moment (M) is less than the cracking moment (Mcr); however, they vary substantially in
the cracked zone. Within the cracked regions, Ixx and Qi are calculated on the basis of a
cracked section; hence, tension stiffening was not employed when checking for this
failure criteria. This is to account for the fact that debonding (i.e. when τmax is reached) is
typically initiated at the location of a crack. Ixx is calculated by summing the second
moment of area of every intact layer within the section about the neutral axis of the
section, and Qi is calculated by summing the first moment of are of every intact layer
within the section about the neutral axis of the section.
It should be noted that, when calculating Ixx, and Qi, and to account for the
concrete non-linearity, the width of each layer in the section is transformed by the secant
elastic modular ratio of the material present in that layer, which depends on the strain
level in that layer, relative to the elastic modulus of unstrained concrete Eco, as shown in
Figure 5-6. This is important since the elastic modulus of concrete effectively decreases
138

as strain is increased. For layers composed of GFRP, the elastic modulus ratio is simply
calculated by dividing the elastic modulus of the GFRP section by Eco.
For each value of M in the cracked section analysis, the values of Ixx, V, Qi, and Bi
were used to calculate τ at the elevation of the upper surface of the top flange of the
GFRP section, using Equation 5-10. This calculation was executed at the location of
maximum shear and bending moment (immediately adjacent to a loading point). This is
because shear is constant within the shear spans, and the location of maximum bending
moment would have the lowest value of Ixx, and thus the highest bond shear stress.
Debonding is assumed to have been initiated when the maximum τ value reaches the
ultimate bond shear strength τult. After carefully examining the interface surfaces of
girders 1, 2, and 6 after failure, it was concluded that bond failure occurred within a very
thin layer of the cement mortar, and not within the adhesive bond line. This was made
evident by a visible layer of cement paste bonded to the GFRP sections, which confirms
the observation reported in Chapter 3. Therefore, it can be said that the shear strength of
bond mechanisms M1 and M2 are both dependent upon the shear strength of the cement
paste. A typical value reported in literature for the shear strength of unconfined
conventional cement mortar is 1MPa (Hegemier et al, 1987, and Pluijm, 1993).
Therefore, for the purposes of this model, it was assumed that the ultimate bond shear
strength τult may be taken as 1MPa. It should be noted that the progressive debonding
(i.e. analysis beyond first debonding) discussed in Chapter 3 was ignored. It was shown
in Chapter 3 that this progressive failure was only evident in relatively slender members.
The relatively low shear-span to depth ratios used for the girders in this study dictated
that failure by complete debonding occurred immediately after the bond shear stress
139

reached the value of τult at the location of maximum bending moment, thus mitigating the
need to employ the complex progressive debonding analysis discussed in Chapter 3.
In members incorporating headed studs (M4), it was assumed that flexural failure
would precede bond failure. As such, for these specimens, bond failure criterion was
ignored and the model was allowed to continue until it was terminated by a flexural
failure.
5.2.5 Load-Deflection Predictions
Once the moment-curvature response of a section is determined, it can then be
used to establish the load-deflection relationship using basic mechanis. In order to do so,
an initial load is assumed, half of the span is divided into several segments (Figure 5-7),
each with a length of dx, and the average bending moment experienced within each of
these regions (Mi) is calculated in accordance with the loading scheme being used (4-
point bending in this case). The data from the previously established moment-curvature
response is then employed in order to determine the average curvature in the member
within each region (ψi). The product of the length of each region and the curvature value
within that region (ψi × dx) gives the change in slope (Δθi) of the member within that
region. If it is assumed that the slope of the member at mid-span is zero, then the slope of
the member at midpoint of each region (θi) is equal to the summation of the values of Δθi
for all regions between the mid-span and the point of interest. The product of the length
of each region and the average slope within that region (θi × dx) gives the change in
elevation (Δvi) of the member within that region. The summation of all of the Δvi values
for each region between the mid-span and the support gives the total mid-span deflection
140

of the member (δ). This entire process is repeated at various load levels in order to
establish the complete load-deflection response of the member.
5.3 Validation of Analytical Model
The aforementioned model was primarily aimed at predicting the behaviour of
specimens incorporating either the M1 bond mechanism, or a combination of the M1 and
M4 bond mechanisms. As such, the model was validated using the experimental results
from girders 1, 4, 6, and 7. The experimental and analytical moment-curvature, load-
deflection, and moment-strain responses of each of these specimens are compared in
Figures 5-8 to 5-11, 5-12 to 5-15, and 5-16 to 5-19, respectively. In general, it was found
that the moment-curvature responses and failure loads generated by the model had
excellent agreement with the experimental results. The moment-curvature response is
very sensitive to tension stiffening effects in the vicinity of the cracking moment;
however, the parameters used (α1 = 1, and dTS = 3.75 times the thickness of the GFRP
form) appear to have resulted in a response that is quite consistent with the experimental
results. The model accurately predicts that all specimens incorporating adhesive bond
mechanisms (M1 and M2) fail by debonding at the concrete/GFRP interface, and
provides a good estimate of their failure loads, although it underestimated the failure load
of girders 1 and 2 by 12.5 percent and 16.9 percent, respectively. It is clear from the plots
that the load-deflection responses generated by the model tended to underestimate
deflection by approximately 14 to 20 percent. This can likely be attributed to factors not
accounted for in the model such as shear deflection.
141

5.4 Parametric Study
The analytical model was used to study the effects of five parameters on the
performance of the girders being investigated. These parameters are: (a) compressive
strength of the concrete used, (b) bond strength of the cement paste at the concrete/GFRP
interface together with shear span-to-depth ratio, (c) angle of the webs of the GFRP sheet
pile section, (d) thickness of the flanges of the GFRP sheet pile section, and (e) width of
the concrete slab.
In order to properly assess each of these parameters, it was important that certain
aspects of the section were set as constants. As such, all sections studied were similar to
girder 4 in that they were simply composed of a single trapezoidal sheet pile section with
a solid concrete fill, and an adhesive bond mechanism at the GFRP/concrete interface.
The total depth of the sheet pile section was 254mm, the width of its lower flange was
208mm, the webs were 7.62mm thick, and the flanges were 8.89mm thick. The depth of
concrete was set such that a 70mm thick concrete slab existed above the upper flange of
the sheet pile section. The shear span of all specimens was assumed to be 1350mm,
similar to experimental testing. All mechanical properties of the sheet pile section were
assumed to be consistent with the Creative Pultrusions SuperLoc 1610 sections used in
the experimental testing.
While each of the parameters was studied, all other parameters were kept constant.
Therefore, each parameter was given a default value to be used when that parameter was
not being studied. These default values were set as follows: compressive strength of
concrete fc’ was 35MPa, bond strength was 1MPa, webs were at an angle of 20 degrees
from the vertical, the flanges of the sheet pile sections were 8.89mm thick, and the total
142

width of the section was 610mm. These values were essentially the same as those of the
specimens that were experimentally tested.
5.4.1 Effect of Concrete Strength, fc’
Concrete strength can sometimes be quite variable depending upon the quality
control that is exercised. Therefore, it was important to quantify the sensitivity of this
system to changing values of concrete compressive strength fc’. Four concrete strengths
were studied: 25MPa, 35MPa, 45MPa, and 55MPa. Figure 5-20(a) shows the moment-
curvature plots for all cases, as well as the point at which each girder would exhibit
debonding failure given the shear span used. As would be expected, flexural strength and
stiffness both increase slightly as concrete strength is increased. This effect is most
pronounced just prior to flexural failure. All four girders exhibited bond failure at
approximately the same load, which occurred prior to flexural failure that would have
otherwise occurred by crushing of concrete. Therefore, it can be said that, for the shear
span and bond strength used, there exists a concrete strength that will allow flexural
failure to occur prior to bond failure; however, as shown in Figure 5-20(b), this concrete
strength would be quite low at approximately 18.5MPa.
5.4.2 Effect of Bond Strength and Shear Span-to-Depth Ratio
Perhaps one of the most critical parameters that should be studied for this
structural system is the bond strength at the concrete/GFRP interface. The ability to
precisely adjust such a parameter experimentally would be extremely difficult and
impractical since bond failure tends to occur within a thin layer of cement mortar adjacent
to the bond line, and not at the bond line itself. However, the analytical model described
143

in this report makes it possible to study this parameter so that the sensitivity of this
structural system to bond strength can be quantified. Using the specified shear span of
1350mm, a series of specimens were analyzed with bond strength (τult) values ranging
between 0.25MPa and 2.5MPa. This range covers the scatter of values of bond strength
of mortar shown in Figure 2-7 in the literature.
The relationship between bond strength and bending moment at failure is plotted
in Figure 5-21(a), while the relationship between bond strength and failure load is plotted
in Figure 5-21(b). For a shear span of 1350mm, the plot shows a constant failure load of
320kN when bond strengths lower than approximately 1.1MPa are used. Within this
range, the strength of the member is governed by the flexural strength of the GFRP sheet
pile section alone assuming no composite action with the concrete core and ignoring local
buckling. When bond strength exceeds 1.1MPa, a linear trend of increasing failure load
results until bond strength reaches approximately 1.35MPa. Within this range, bond
failure is the governing mode of failure. When bond strength is further increased beyond
1.35MPa, flexural failure of the hybrid member (i.e. concrete and GFRP with full
composite action) precedes bond failure; hence, failure load is constant within this region
of the plot as well. It is interesting to note that during experimental testing, girder 4 (the
specimen that most closely resembles the girder currently being discussed) had a bond
strength of 1MPa and a shear span of 1350mm, and yet it did not reach the 320kN load
stipulated by Figure 5-21(b). This was because the experimental test was terminated
immediately following bond failure; however, it should be noted that the 320kN failure
load estimate is based upon flexural tension and compression failure, and not local
buckling which is likely to occur first.
144

Because this plot was only applicable to specimens with the specific geometry and
loading configuration used for the specimens analyzed, some addition plots were made
using specimens with different shear spans ranging from 1350mm to 2000mm (i.e. shear
span-to-total depth ratio of 4.17 to 6.17). It is clear that, as shear span is increased, it is
possible to induce a flexural failure with lower bond strength values. Likewise, for the
default 1MPa bond strength used in this study, there exists a minimum shear span of
slightly less than 2000mm that would enable flexural failure to precede bond failure. In
Figure 5-21(a), it is evident that, regardless of their shear spans, all specimens are limited
to a maximum possible bending moment at failure that is a property of the cross sectional
geometry. As shear span is increased, the bond strength necessary to achieve this
maximum bending moment is reduced; hence, flexural failure of the composite member
tends to govern more in cases of longer shear spans.
5.4.3 Effect of Angle of Webs of Sheet Pile Section
Although the pultruded sheet pile sections used in this investigation are mass
produced with specific dimensions, the pultrusion process enables the production of
sections with a wide range of geometries and dimensions. As such, the effects of
changing the cross-sectional geometry of the sheet pile section have been studied. One of
the manners in which this geometry could be varied would be by varying the angle of the
webs of the sheet pile section measured with respect to the vertical. This angle was
varied while maintaining the width of the bottom flange constant at 208mm. The
standard SuperLoc 1610 section used in the experimental investigation had webs that
were at an angle of 20 degrees from the vertical. In this parametric study, four web
angles were studied, namely, zero degrees (vertical), 10 degrees, 20 degrees, and 30
145

degrees. Figure 5-22(a) shows the moment-curvature plots and the point at which
debonding would occur for each of these specimens. This plot illustrates that altering the
angle of the webs has a negligible effect on the flexural response of these specimens,
including both bond failure and flexural failure moments (Figure 5-22(b)). There is a
very slight increase in stiffness as the angle of the webs is increased. It is logical that,
with the relatively small angles used in this study, a negligible effect was found since the
width of the bottom flange was kept constant. Greater angles could not be employed in
this parametric study due to the limited width of the top flange of the sheet pile section.
5.4.4 Effect of Thickness of Flanges of Sheet Pile Section
Another manner in which the geometry of the sheet pile section could be altered is
by changing the thickness of the flanges of the section. Four flange thicknesses were
studied, namely, 4mm, 10mm, 16mm, and 22mm. Figure 5-23(a) shows the moment-
curvature plots, as well as the point at which debonding would occur for each of these
specimens. As expected, it is clear from this plot that the flexural strength and stiffness of
the specimens improve significantly as the thickness of the flanges is increased. It is also
evident that, regardless of flange thickness, all specimens exhibited debonding at similar
loads. As illustrated in Figure 5-23(b), with the given shear span (1350mm) and bond
strength (1MPa), it would not be possible to adjust the thickness of the flanges such that
flexural failure occurs prior to debonding at the concrete/GFRP interface.
It is interesting to note that the tension stiffening behaviour of these specimens in
the vicinity of cracking moment differ substantially from one another. While specimens
with thin flanges showed an abrupt drop in bending moment immediately after cracking,
specimens with relatively thick flanges exhibited a smooth transition between pre-
146

cracking stiffness and post-cracking stiffness. This is indicative of the fact that the effects
of tension stiffening are only pronounced in regions that are in close proximity to
reinforcement (the sheet pile section). As discussed earlier, tension stiffening occurs
within a limited distance (dTS), which is a function of the thickness of the GFRP flange,
from the reinforcement or formwork. Therefore, as the thickness of the lower flange of
the sheet pile section was increased, the proportion of the concrete below the neutral axis
that was affected by tension stiffening was increased; hence, the specimen with the
greatest flange thickness (22mm) showed the strongest tension stiffening performance. It
is also worth noting that the pre-cracking stiffness of all specimens was nearly identical.
This is due to the fact that the GFRP in the sheet pile section has a very similar modulus
of elasticity to concrete. Therefore, although more GFRP was present in the flanges of
some specimens than others, this GFRP merely displaced concrete of similar stiffness.
5.4.5 Effect of Width of Concrete Slab
The idea of varying the width of the concrete slab implies that the total width of
the GFRP sheet pile section should also be varied. Therefore, while studying this
parameter, it was assumed that the geometry of the lower flange and webs of the sheet
pile sections were maintained at their default dimensions, while only the breadth of the
upper flanges was varied. One of the implications of such an assumption is that the
bonded area between concrete and the sheet pile section increases as the width of the slab
increases. Four slab widths were studied, namely, 500mm, 600mm, 700mm, and 800mm.
Figure 5-24(a) shows the moment-curvature responses and the point at which debonding
occurs for each of the girders. Since the flexural strength and stiffness of these specimens
increased as the width of slab was increased, an additional plot (Figure 5-24(b)) was
147

148
made in which the moments were normalized by dividing by slab widths. Since these
hybrid sections are intended to be placed adjacent to each other as a broad one-way deck,
this normalization serves to provide a flexural response per unit width of decking. In
general, the flexural strength and stiffness of these specimens was found to be inversely
proportional to the width of the concrete slab. Conversely, for a given shear span
(1350mm in this case), the load at which bond failure occurred in these specimens
increased as the width of the slabs was increased. Therefore, it can be said that, for a
given shear span and bond strength (1MPa in this case), there exists an optimum width of
section that will enable a flexural failure prior to debonding at the concrete/GFRP
interface. As shown in Figure 5-24(c), for the 1350mm shear spans used in this
investigation, this optimum width would be slightly greater than 1500mm. It should be
noted that in creating Figure 5-24(c), three additional data points (1300mm, 1400mm, and
1500mm) were used in order to ensure the accuracy of the trend-line used to extrapolate
out to the optimum slab width.

Figure 5-1. Stress-strain relationship for concrete in uniaxial compression and tension
0.4fc
’
fc
’
εc
’
EC
EC0
Stress, fc
Strain, εc
Uniaxial Compression
Uniaxial Tension
εcc = 0.0035
Collins and Mitchell (1997)
εr
fr
Tension stiffening
Collins and Mitchell (1997)
149

Figure 5-2. Stress distribution in Type 2 specimens in positive bending (girder 4)
Fully intact concrete in compression and uncracked tension zone
Cracked concrete with zero stress
Cracked concrete with stress due to tension stiffening
εr
NAHeight of crack propagation
dTS
dTS
Strain Profile Concrete Stress within uncracked regions and
dTS region
GFRP Stressfr fc
’
Tension stiffening
150

(a) GFRP sheet pile section
B = 609.6mm
tflange = 8.89mm
tflange = 8.89mm
tweb = 7.62mm
Blf = 208.3mm
θ
= 20°
Hpile = 254mm
Bwt = 386.7mm
250mm
245mm
70mm
(b) Type 1 specimens (girders 1, 2, and 3)
70mm
(c) Type 2 specimens (girders 4 and 5)
60mm
9.5mm
(d) Type 3 specimens (girders 6, 7, and 8)
Figure 5-3 Assumed geometry of different sections
151

Figure 5-4. Discrete regions in cross-sectional geometry
60mm 9.5mm
Region 1
Region 2
Region 3
Region 4
Region 5
B
tflange
tflange
tweb
Blf
θ
Hpile
Bwt
θtweb
WGFRP /2
152

Input initial section geometry
and material properties
Assume initial εc
at extreme compression fibre
Assume elevation of NA
Calculate value of ε
at extreme tension fibre, and calculate ψ
Do while i = 0 to 1000
Calculate area of GFRP and concrete in layer i
Calculate stress in GFRP and concrete in layer i
Calculate force in GFRP and concrete in layer i
Set moment M and sum of forces Fnet
equal to 0
Multiply force in layer i by distance to NA and add to M
Add force in GFRP and concrete in layer i to Fnet
End of Do loop
If Fnet
is approximately equal to 0
NO
YES
Output values of ψ
and M
Increase value of εc
by a small increment
Figure 5-5. Flow chart illustrating algorithm used for determining moment-curvature response
153

NA
Concrete stress within uncracked regions and dTS
region
fci
GFRP Stress
dTS
dTS
Concrete with zero stress
when cracked (Figure 5-2)
Actual geometry of cross-section
Transformed geometry of cross-
section
Layer i
Layer k
fck
Transformed width in i
= Actual width in ic
ic
EE
×
Transformed width in k
= Actual width in kc
kc
EE
×
For Concrete:
For FRP:Transformed width in any layer = Actual width in layer
c
f
EE
×
Figure 5-6. Section transformation accounting for variable elastic modulus in concrete
154
Concrete in Uniaxial Compression
Stress, fc
Strain, εc
Ec
fci
Eci
fckEck
Concrete in Uniaxial Tension
εci
εck

aP/2 aP/2
P/2 P/2Mid-spanSupport
dx
a
Loading Scheme
Actual Bending Moments
aP/2 aP/2Approximated Bending Moments
Approximated Curvature
Mi
ψi
Δθi
Approximated Slope
θi
Approximated deflection Δvi δ
Figure 5-7. Schematic of the process for determining load-defection response
155

0
20
40
60
80
100
120
140
160
180
200
0 0.005 0.01 0.015 0.02 0.025 0.03
Figure 5-8. Experimental versus predicted moment-curvature responses of girder specimen 1
Figure 5-9. Experimental versus predicted moment-curvature responses of girder specimen 4
analytical model1
Ben
ding
Mom
ent (
kNm
)
Curvature (1/m)
1
P/2 P/2
0
50
100
150
200
250
0 0.005 0.01 0.015 0.02 0.025 0.03 0.035
analytical model4
Ben
ding
Mom
ent (
kNm
)
Curvature (1/m)
4
P/2 P/2
M1 Bond
M1 Bond
156

Figure 5-11. Experimental versus predicted moment-curvature responses of girder specimen 7
Figure 5-10. Experimental versus predicted moment-curvature responses of girder specimen 6
0
50
100
150
200
250
0 0.005 0.01 0.015 0.02 0.025 0.03
analytical model
6B
endi
ng M
omen
t (kN
m)
Curvature (1/m)
6
P/2 P/2
0
50
100
150
200
250
300
350
0 0.01 0.02 0.03 0.04 0.05 0.06
analytical model7
Ben
ding
Mom
ent (
kNm
)
Curvature (1/m)
7
P/2 P/2
M1 Bond
M1 & M4 Bond
157

0
50
100
150
200
250
300
0 5 10 15 20 25 30
analytical model
P/2 P/2
1
Load
(kN
)
Deflection (mm)
0
50
100
150
200
250
300
350
0 5 10 15 20 25 30 35
Deflection (mm)
Load
(kN
)
4
analytical model
P/2 P/2
Figure 5-12. Experimental versus predicted load-deflection responses of girder specimen 1
Figure 5-13. Experimental versus predicted load-deflection responses of girder specimen 4
4
1
M1 Bond
M1 Bond
158

0
50
100
150
200
250
300
350
400
450
500
0 10 20 30 40 50 60 70 80 90
0
50
100
150
200
250
300
350
0 5 10 15 20 25 30 35
6
7
analytical model
P/2 P/2Lo
ad (k
N)
Deflection (mm)
analytical model
P/2 P/2
Deflection (mm)
Load
(kN
)
Figure 5-14. Experimental versus predicted load-deflection responses of girder specimen 6
Figure 5-15. Experimental versus predicted load-deflection responses of girder specimen 7
7
6
M1 Bond
M1 & M4 Bond
159

Figure 5-16. Moment-strain response of girder specimen 1
Figure 5-17. Moment-strain response of girder specimen 4
Strain (μe)
Ben
ding
Mom
ent (
kNm
)
P/2 P/2PG2
SG1
1 (SG1)1 (PG2)
1
M1 Bond
0
20
40
60
80
100
120
140
160
180
200
-4000 -2000 0 2000 4000 6000 8000 10000 12000 14000
ε cc =
3500μe
ε fr=
1050
0μe
(man
ufac
ture
r’s d
ata)
ε fr=
1340
0μe
(cou
pon
test
dat
a)
analytical model
Strain (μe)
Ben
ding
Mom
ent (
kNm
)
4 (SG1)4 (PG2)
P/2 P/2PG2
SG1
4
M1 Bond
0
50
100
150
200
250
-4000 -2000 0 2000 4000 6000 8000 10000 12000 14000
ε cc =
3500μe
ε fr=
1050
0μe
(man
ufac
ture
r’s d
ata)
ε fr=
1340
0μe
(cou
pon
test
dat
a)
analytical model
160

Figure 5-18. Moment-strain response of girder specimen 6
Strain (μe)
Figure 5-19. Moment-strain response of girder specimen 7
Strain (μe)
Ben
ding
Mom
ent (
kNm
)B
endi
ng M
omen
t (kN
m)
P/2 P/2PG2
SG1
6 (SG1)6 (PG2)
6
M1 Bond
0
50
100
150
200
250
-5000 0 5000 10000 15000 20000
ε cc =
3500μe
ε fr=
1970
0μe
(man
ufac
ture
r’s d
ata)
ε fr=
2060
0μe
(cou
pon
test
dat
a)
7
M1 & M4 Bond
7 (SG1)7 (PG2)
P/2 P/2PG2
SG10
50
100
150
200
250
300
350
-5000 0 5000 10000 15000 20000
ε cc =
3500μe
ε fr=
1970
0μe
(man
ufac
ture
r’s d
ata)
ε fr=
2060
0μe
(cou
pon
test
dat
a)
analytical model
analytical model
161
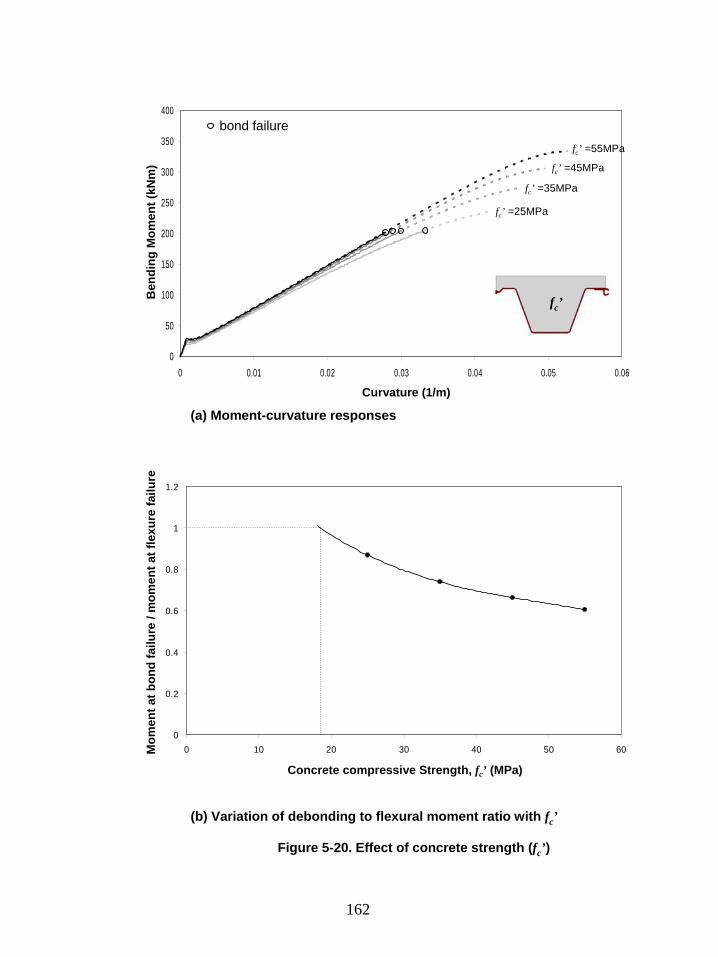
0
50
100
150
200
250
300
350
400
0 0.01 0.02 0.03 0.04 0.05 0.06
fc ’
bond failure
fc ’ =25MPa
Curvature (1/m)
Ben
ding
Mom
ent (
kNm
)
Figure 5-20. Effect of concrete strength (fc ’)
fc ’ =35MPa
fc ’ =45MPa
fc ’ =55MPa
(a) Moment-curvature responses
(b) Variation of debonding to flexural moment ratio with fc ’
0
0.2
0.4
0.6
0.8
1
1.2
0 10 20 30 40 50 60
Concrete compressive Strength, fc ’ (MPa)
Mom
ent a
t bon
d fa
ilure
/ m
omen
t at f
lexu
re fa
ilure
162

0
50
100
150
200
250
300
0 0.5 1 1.5 2 2.5
(a) Variation of ultimate bending moment and bond strength
Bond f
ailure
Bond Strength (MPa)
Ben
ding
Mom
ent a
t Fai
lure
(kN
m)
a = 1350mma = 1500mma = 1750mm
Shear span = a
P/2 P/2
Flexure failure of composite girder
Bond
failu
re
a = 2000mm
0
50
100
150
200
250
300
350
400
450
0 0.5 1 1.5 2 2.5
Figure 5-21. Effect of bond strength (τult
) when various shear spans are used
Bond f
ailure
Flexure failure of composite girder
Bond Strength (MPa)
Failu
re L
oad
(kN
)
a = 1350mm
a = 1500mm
a = 1750mm
a = 2000mm
Shear span = a
P/2 P/2
Bond f
ailure
Flexure failure of sheet pile
(b) Variation of failure load and bond strength
163
Flexure failure of sheet pile

0
50
100
150
200
250
300
0 0.005 0.01 0.015 0.02 0.025 0.03 0.035 0.04 0.045 0.05
bond failure
θ=0oθ=10oθ=20oθ=30o
θ
Curvature (1/m)
Ben
ding
Mom
ent (
kNm
)
Figure 5-22. Effect of web angle (θ)
θ
= 0°
θ
= 10°
θ
= 20°
θ
= 30°
B = 609.6mm
Blf = 208.3
(a) Moment-curvature response
(b) Variation of debonding to flexural moment ratio with web angle
0
0.2
0.4
0.6
0.8
1
1.2
0 5 10 15 20 25 30 35Mom
ent a
t bon
d fa
ilure
/ m
omen
t at f
lexu
re fa
ilure
Web Angle, θ
(degrees from vertical)
164

0
50
100
150
200
250
300
350
400
0 0.01 0.02 0.03 0.04 0.05 0.06
bond failure
Ben
ding
Mom
ent (
kNm
)
Curvature (1/m)
t=4mm
t=10mm
t=16mm
t=22mm
t
tt
Figure 5-23. Effect of flange thickness (t)
(a) Moment-curvature response
(b) Affect of flange thickness on moment ratio
0
0.2
0.4
0.6
0.8
1
1.2
0 5 10 15 20 25Mom
ent a
t bon
d fa
ilure
/ m
omen
t at f
lexu
re fa
ilure
Flange thickness, t (mm)
165

0
50
100
150
200
250
300
350
0 0.01 0.02 0.03 0.04 0.05 0.06
0
100
200
300
400
500
600
0 0.01 0.02 0.03 0.04 0.05 0.06
bond failureB =500mm
B =600mmB =700mm
B =800mm
B
Curvature (1/m)
Ben
ding
Mom
ent p
er u
nit w
idth
(kN
m/m
)
Figure 5-24. Effect of slab width (B)
(b) Moment-curvature response normalized for slab width
bond failure
B =500mm
B =600mm
B =700mmB =800mm
B
Curvature (1/m)
Ben
ding
Mom
ent (
kNm
)
(a) Moment-curvature response raw data
166

Figure 5-24. Effect of slab width (B) (continued)
(c) Variation of moment ratio with slab width
Mom
ent a
t bon
d fa
ilure
/ m
omen
t at f
lexu
re fa
ilure
Slab Width, B (mm)
0
0.2
0.4
0.6
0.8
1
1.2
400 600 800 1000 1200 1400 1600 1800
167

CHAPTER 6: SUMMARY AND CONCLUSIONS
6.1 Introduction
The concept of stay-in-place structural forms simplifies and accelerates
construction to a great extent. Indeed, it promises reduced road closures and traffic
delays, in the case of bridge applications, which is a serious problem for the economy and
a major inconvenience for the public. Commercially available pultruded GFRP sections
have excellent potential as stay-in-place structural open formwork for concrete flexural
members. The GFRP forms can fully or partially replace internal steel rebar, thereby
mitigating the corrosion problems that threaten most conventional steel reinforced
concrete structures. The inherent location of GFRP open forms, at the bottom of the
member, makes these members well suited to applications in which positive bending is
the predominant mechanism engaging the structure. Nevertheless, with some
modifications, continuity in girders can also be achieved.
6.2 Summary and Conclusions
6.2.1 One-Way Slabs with Flat Pultruded GFRP Sheets
Eight concrete slabs were fabricated using pultruded flat GFRP sheets, and were
tested in four-point uniaxial monotonic bending. Three bond mechanisms were explored
in order to achieve composite action between the concrete and the GFRP plates. The
effect of varying the GFRP reinforcement ratio was assessed using specimens of various
concrete thicknesses. An analytical model was developed to predict the full behavior and
strength of these hybrid slabs. A key feature of the model is its capability to detect
flexural, shear or bond failures. Also, the performance of the hybrid slabs was assessed by
168

comparing them to conventional steel-reinforced concrete slabs of comparable external
dimensions. The following conclusions were drawn:
1. Using readily available GFRP plates as structural forms for concrete slabs is quite
feasible. The most effective bond system, in terms of structural performance and
ease and speed of fabrication, was the wet adhesive bonding of fresh concrete to
the GFRP plate.
2. The adhesive bonding methods led to a significantly higher stiffness, than that of
the mechanically bonded slabs using shear connectors. This is attributed to a
complete bond throughout loading in the former, until failure occurred suddenly
by debonding; whereas in the latter, progressive slip between the GFRP plate and
concrete occurred.
3. Failure was typically due to debonding of the GFRP plate, after flexural or shear
cracking in the concrete. The measured low longitudinal strains at mid span
suggest that tension failure of the GFRP plate is very unlikely in this system.
Compression failure of concrete was imminent in some of the slabs.
4. While flexural stiffness of the slabs increased as their reinforcement ratio was
increased, the effect of reinforcement ratio on ultimate moment could not be
assessed because of the consistent bond failure, rather than the flexural failure.
5. Conventional steel-reinforced concrete slabs of comparable external dimensions
are severely hindered by the requirements to satisfy the limitations of concrete
cover. As a result, the concrete-GFRP hybrid system is superior in that the
reinforcement is located at the extreme tension fibre. Also, substantial amounts of
169

steel reinforcement are required to match the flexural strength and stiffness of the
hybrid sections.
6. Steel-reinforced concrete slabs of comparable flexural strength were considerably
stiffer than their concrete-GFRP hybrid counterparts, whereas steel-reinforced
concrete slabs of comparable stiffness had considerably lower flexural strength.
7. The behaviour of the concrete-GFRP hybrid slabs studied in this investigation can
be modeled quite accurately using conventional cracked-section analysis
techniques, in conjunction with a multi-stepped failure criterion approach that
covers flexural, shear and bond failures.
8. Adhesive bond failure consistently occurred within a very thin layer of cement
mortar of the concrete slab. Therefore, the use of the typical shear strength of
1MPa for cement mortar, established from research on masonry, to model bond
failure was quite successful.
6.2.2 Girders using Trapezoidal GFRP Sheet Pile Sections: Experimental
Investigation
Nine girders were fabricated using pultruded trapezoidal GFRP sheet pile sections
and tested in four-point monotonic bending. Four bond mechanisms were explored in
order to examine composite action. Three different cross-section configurations were
explored, including the effect of implementing a void within the concrete fill, and the use
of a built-up all-GFRP box girder system with a thin concrete compression flange. The
system was tested in both positive and negative bending to simulate continuity. The
following conclusions were drawn:
170

1. Similar to the slabs, girders incorporating either adhesive to wet concrete bond or
bonded aggregates systems failed by debonding at the concrete/GFRP interface,
within a thin layer of cement paste. A thin layer of mortar remained adhered to
the GFRP section after failure. The concrete compressive strain and GFRP tensile
strain were well below their ultimate values.
2. The specimen incorporating headed shear studs combined with the adhesive bond
system was able to achieve flexural failure by concrete crushing, which occurred
at a 45% higher load than that reached by specimens incorporating only the
adhesive bond system.
3. The specimen incorporating non-headed studs in addition to the adhesive bond
system achieved only a modest increase, 24% in strength, over the specimens
incorporating only the adhesive bond system. In this case, failure occurred when
the studs pulled out prematurely from the concrete slab.
4. Similar to the slabs, in all adhesively bonded and bonded aggregate girders,
excellent monolithic composite action was observed prior to the sudden
debonding failure. This was evident by the consistent lack of slip between the
concrete and the GFRP throughout the loading history.
5. Including a void in the tension region of the concrete allowed for reduced self
weight, without a significant reduction in stiffness. However, the reduced bonded
area at the interface due to the void being extended to the GFRP bottom flange
resulted in a small reduction, 13%, in failure load.
6. The built-up all-GFRP box section with a concrete slab showed superior
performance. When it included headed studs in addition to adhesive bonding, it
showed 35% to 70% higher strength than any other specimen. This also occurred
171

in conjunction with a 50% and 65% reduction in weight relative to the voided core
and the totally filled specimens, respectively. When the box girder included
adhesive bonding only, it showed similar strength to the adhesively bonded totally
filled specimen, and 15% higher strength than the adhesively bonded voided core
specimen.
7. The flexural strength of the girders is higher in positive bending than in negative
bending by 45% to 90%, depending on cross-sectional configuration. However,
since the stiffness is also higher in positive bending by 175% to 225%, the system
lends itself to an efficient use in continuous beams, where it can be fully utilized
in both positive and negative bending regions.
8. In negative bending, premature failure of the totally filled section occurred by
lateral opening of the GFRP sheet pile. In actual applications, however, the
sections would be placed side-by-side so that they restrain each other laterally. In
the built-up box sections, the flat plate served as a tie restraining this opening
action. In this case, local buckling of the GFRP sheet pile occurred just outside of
the grout-filled diaphragm under the load.
6.2.3 Girders Using Trapezoidal GFRP Sheet Pile Sections: Analytical Investigation
An analytical model was developed to predict the flexural responses and failure
loads of the girders reported in Chapter 4 of this investigation. The model employed
conventional cracked section analysis in conjunction with a multi-stepped failure criteria
check that accounted for flexural and bond failures. The model showed very good
agreement with test results. It was then used in a parametric study to investigate the
effects of compressive strength of concrete, bond strength at the interface, angle of the
172

webs of the sheet pile section, thickness of the flanges, and width of the concrete slab, on
the flexural stiffness, strength, and failure modes. The following conclusions were
drawn:
1. The flexural behaviour and strength of the concrete/GFRP hybrid girders studied
in this investigation can be modeled quite accurately using conventional cracked-
section analysis techniques in conjunction with a multi-stepped failure criterion
approach that covers flexural and bond failures. Bond failure criteria based on the
typical shear strength of 1MPa of masonry mortar joints is reasonably accurate.
2. For concrete flexural members reinforced by GFRP stay-in-place open structural
forms and employing a strong adhesive bonding mechanism at the concrete/GFRP
interface, it is reasonable to assume a tension stiffening coefficient (α1) of 1; and
an effective tension stiffening zone thickness (dTS) of 3.75 times the thickness of
the form.
3. In most practical applications where shear span-to-depth ratios are far greater than
the 4.17 used in this investigation, flexural failure will likely precede bond failure
despite the bond strength being limited to 1MPa.
4. Increasing the compressive strength of concrete increases flexural strength and
stiffness slightly, but does not have a significant effect on the load at which bond
failure occurs.
5. Debonding failure load is quite sensitive to the value of bond strength. Using
shear strength values of cement mortar ranging from 0.25 to 2.5MPa resulted in
failure loads that varied by over 25%. It is important to note, however, that the
173

conventional value established for masonry mortar joints of 1MPa is quite
reasonable for design purposes.
6. Increasing the thickness of the flanges of the sheet pile section has a significant
effect on increasing flexural strength and stiffness, as well as improving tension
stiffening behaviour. However, it has a negligible effect on the debonding failure
load.
7. For a given shear span and bond strength, there exists an optimum width of
concrete slab that would enable flexural failure to precede bond failure. However,
the flexural stiffness per unit width of deck tends to be highest when considerably
narrower concrete slabs are used.
8. Adjusting the angle of the webs of the sheet pile section, while maintaining a
constant width of tension flange, has an insignificant effect on flexural behaviour.
6.3 Recommendations for Future Work
This study has illustrated that the use of GFRP sections as stay-in-place structural
open formwork for concrete flexural members is quite promising, and indeed this
technology should be researched further. It is important that the following aspects are
studied prior to implementation of the technologies discussed in this report:
1. The fatigue performance of concrete/GFRP hybrid members should be assessed
under both high cycle and low cycle loading conditions. Special attention should
be given to the fatigue life of the bond at the concrete/GFRP interface.
2. Environmental effects should be thoroughly studied for structures employing the
aforementioned technologies. It is possible that differential thermal expansion
could affect bond at the concrete/GFRP interface. Freeze-thaw effects should be
174

studied as the bond may be susceptible to icing and subsequent frost heave of
moisture within cracks in the concrete near the concrete/GFRP interface.
3. In order to more accurately model the stiffness of large concrete/GFRP hybrid
members of this type, it will be necessary to conduct further research on the
tension stiffening behaviour of concrete members reinforced with externally
bonded GFRP sections.
While this work has shown that the aforementioned structural systems perform
quite well, the study also highlighted some aspects of the technology that require further
refinement, as well as some other potential applications of the technology that may be
developed. Key topics requiring further work are listed below:
1. Currently, all adhesive based bond mechanisms between the concrete and the
GFRP were limited by the shear strength of the cement mortar (1.0MPa) layer in
contact with the bond line. It may be advantageous to develop an adhesive based
bond system that is somehow capable of generating a shear connection between
the concrete and GFRP that exceeds the shear strength of cement mortar. Perhaps
a more hydrophilic adhesive system could be used such that it can better infiltrate
the cement mortar, thus potentially engaging the aggregate interlock.
2. This study was focused only on concrete/GFRP hybrid members in uniaxial
bending. It is recommended that this technology be further developed for
applications that generate biaxial bending conditions. Two-way concrete slabs or
bridge decks reinforced with GFRP forms may prove to better utilize the
membrane characteristics of the GFRP sheets.
175

176
6.4 Practical Applications
Assuming bond strength of 1MPa, dictated by the shear strength of cement mortar,
it was shown that any completely filled (Type 2) hybrid girder with a shear span greater
than 1750mm will be governed by flexural capacity and not by bond strength or diagonal
tension shear strength. As such, there are two primary aspects of design that must be
considered when employing Type 2 girders in actual structural applications: flexural
strength, and deflection requirements. Designing for ultimate limit states would simply
be a matter of assessing the factored load requirements in accordance with the appropriate
building code, and limiting the span such that the highest factored bending moment in the
span does not exceed the ultimate flexural capacity of the member stipulated by the
analytical model described in Chapter 5. In order to design for serviceability limit states,
it would be necessary to establish the flexural stiffness of the member (EIxx). This value
can be taken as the slope of the moment-curvature response of the Type 2 girder section
as determined experimentally (Chapter 4) or analytically (Chapter 5). The value of EIxx
can then be used to calculate the maximum possible span that can be used such that,
under the required service loads, deflections do not exceed the allowable deflections
stipulated by the appropriate building code.

REFERENCES
1. ACI Committee 318. (2005) “Building Code Requirements for Reinforced
Concrete and Commentary”, ACI 318M-05/ACI 318RM-05, American Concrete
Institute, Detroit.
2. ACI Committee 440. (2002) “Guide for the Design and Construction of Externally
Bonded FRP Systems for Strengthening Concrete Structures”, ACI 440.2R-02,
American Concrete Institute, Detroit.
3. ACI Committee 440. (2004) “Guide Test Methods for Fiber-Reinforced Polymers
(FRPs) for Reinforcing or Strengthening Concrete Structures”, ACI 440.3R-04,
American Concrete Institute, Detroit.
4. ACI Committee 440. (2006) “Guide for the Design and Construction of Structural
Concrete Reinforced with FRP Bars”, ACI 440.1R-06, American Concrete
Institute, Detroit.
5. Al-Sunna R, Pilakoutas K, Waldron P, and Al-Hadeed T “Deflection of FRP
Reinforced Concrete Beams”,
6. ASTM C39/C39M-05E1. “Standard test method for compressive strength of
cylindrical concrete specimens.”
7. ASTM C882-05. “Standard Test Method for Bond Strength of Epoxy-Resin
Systems Used With Concrete by Slant Shear.”
8. ASTM D3039/D3039M. “Standard test method for tensile properties of polymer
matrix composite materials.”
9. Badie S, Baishya M, and Tadros M (1998) “NUDECK - A New Prestressed Stay-
In-Place Concrete Panel for Bridge Decks”, 1998 Transportation Conference
Proceedings, Iowa State University, Iowa, USA
177

10. Bank LC (2006) “Application of FRP Composites to Bridges in the USA,” Japan
Society of Civil Engineers (JSCE), Proceedings of the International Colloquium
on Application of FRP to Bridges, January 20, 2006, Tokyo, Japan, 9-16.
11. Bank LC, Oliva MG, Bae HU, Barker JW, and Yoo SW (2007) “Pultruded FRP
Plank as Formwork and Reinforcement for Concrete Members”. Advances in
Structural Engineering, 10(5): 525-535
12. Benmokrane B, Masmoudi R, Chekired M, Rahman H, Debbache Z, and Tadros
G (1999) “Design, construction, and monitoring of FRP reinforced concrete
bridge deck”, Proceedings, 4th Int. Symp. on FRP Reinforcement for Concrete
Structures, ACI, Detroit, pp. 87-102.
13. Berg, AC, Bank, LC, Oliva, MG, and Russell JS (2004) “Construction of a FRP
reinforced bridge deck on US Highway 151 in Wisconsin”, Proceedings of the
83rd Annual Transportation Research Board Meeting, CD-ROM, Washington,
DC, 11-14 January, pp. 25.
14. Bischoff PH, and Paixao R (2004) “Tension Stiffening and Cracking of Concrete
Reinforced With Glass Fiber Reinforced Polymer (GFRP) Bars”, NRC Canada,
Can. J. Civ. Eng., 31: 579-588.
15. CAN/CSA-S806-02. (2002) “Design and construction of building components
with fibre-reinforced polymers”. Canadian Standard Association, Toronto,
Ontario, 210p.
16. Canadian Standards Association. (1994) “Design of Concrete Structures,” CSA
Standard A23.3-94, Toronto.
178

17. Cheng L, and Karbhari VM (2006) “New bridge systems using FRP composites
and concrete: A state-of-the-art review” Progress in Structural Engineering
Materials, 8: 143-154.
18. Cho K, Cho KR, Chin WJ, and Kim BS (2005) “Bond-Slip Model for Coarse
Sand Coated Interface Between FRP and Concrete from optimization Technique”,
Computers and Structures, 84: 439-449.
19. Collins M, and Mitchell D (1987) “Prestressed Concrete Basics” Canadian
Prestressed Concrete Institute, Ottawa, Ontario, Canada
20. Collins, MP, and Mitchell, D (1997) Prestressed Concrete Structures, Response
Publications, Canada.
21. Deskovic N, Triantafillou TC, and Meier U (1995) “Innovative Design of FRP
Combined with Concrete: Short-Term Behavior”, Journal of Structural
Engineering, July 1995, 1069-1078.
22. Dieter DA, Dietsche JS, Bank LC, Olivia MG, and Russel JS (2002) “Concrete
Bridge Decks Constructed with Fibre-Reinforced Polymer Stay-in-Place Forms
and Grid Reinforcing”, Transportation Research Record 1814, 219-226.
23. Evernden MC, and Mottram JT (2007) “Theoretical and Experimental Analysis of
a Modular PFRP Box Beam Concept Constructed of Separate Plate Elements and
Mechanical Fasteners”, Proceedings of Conference for Advanced Composites in
Construction (ACIC), April 2-4, 2007, University of Bath, Bath, UK, 379-388.
24. Fam AZ, Schnerch D, and Rizkalla SH (2003) “Innovative FRP/Concrete Hybrid
Rectangular Beams”, 6th International Symposium on FRP Reinforcement for
Concrete Structures (FRPRCS-6), Singapore, July 8-10, 685-694.
179

25. Fam A, and Rizkalla S (2001) “Behavior of axially loaded concrete-filled circular
fiber reinforced polymer tubes.” ACI Structural Journal, 98(3):280-289.
26. Fardis MN, and Khalili H (1981) “Concrete Encased in Fiberglass-Reinforced
Plastic”, ACI Journal, Proceedings, 78(6), November – December, 1981, 440-
446.
27. GangaRao VSH, and Siva RVH (2002) “Advances in fibre-reinforced polymer
composite bridge decks”, Progress in Structural Engineering and Materials,
4(2):161-168.
28. Gardner N, and Jacobson E (1967) “Structural behavior of concrete filled steel
tubes” ACI Structural Journal, 64(3):404-416.
29. Girdzius R, Kaklauskas G, and Zamblauskaite R (2007) “Stress-Strain Response
of Reinforced Concrete Member Subjected to Axial Tension”, Technological and
Economic Development of Economy, 12(2): 109-113.
30. Hall JE, and Mottram JT (1998) “Combined FRP Reinforcement and Permanent
Formwork for Concrete Members” ASCE Journal of Composites for Construction,
2(2): 78-86.
31. Harik I, Alagusundaramoorthy P, Siddiqui R, Lopez-Anido R, Morton S, Dutta P,
and Shahrooz B (1999) “Testing of concrete/FRP composite deck panels”,.5th
Construction Materials Congress, ASCE Materials Engineering Division, pp:351-
358
32. Hegemier G, Arya S, Krishnamoorthy G, Nachbar W, and Furgeson R, (1978)
“On the Behavior of Joints in Concrete Masonry”, Proceedings of the North
American Masonry Conference, Boulder, Colorodo, USA, 4/1-4/21.
180

33. Ibell TJ, Darby AP, and Bailiss JA (2007) “Fabric-Formed Concrete Beams”,
Proceedings of Conference for Advanced Composites in Construction (ACIC),
April 2-4, 2007, University of Bath, Bath, UK, 223-231.
34. Ibrahim S (2000). "Performance evaluation of fiber-reinforced polymer poles for
transmission lines." PhD thesis, Univ. of Manitoba, Winnipeg, Canada.
35. ISIS Canada Corporation. (2006) “Reinforcing Concrete Structures with Fibre
Reinforced Polymers”, Intelligent Sensing for Innovative Structures (ISIS
Canada), Design Manual No. 3, Version 2, Winnipeg, Manitoba, Canada
36. Keller T, Schaumann E, and Valee T (2006) “Hybrid FRP-Concrete Sandwich
Bridge Deck” Third International Conference on FRP Composites in Civil
Engineering (CICE 2006) December 13-15 2006, Miami, Florida, USA, 351-354.
37. Kluge RW, and Sawyer HA (1975) “Interacting pretensioned concrete form
panels for bridge decks”, PCI Journal, 20(3):34-61.
38. Kuennen T (2006) “Transportation officials weigh SIP bridge forms, laud FRP
design”, Transportation Research Board, May 1, 2006
39. Li T, Feng P, and Ye L (2006) “Experimental Study on FRP-Concrete Hybrid
Beams” Third International Conference on FRP Composites in Civil Engineering
(CICE 2006) December 13-15 2006, Miami, Florida, USA, 343-346.
40. Lourenco PB, and Rots JG (1997) “Multisurface Interface Model for Analysis of
Masonry Structures”, Journal of Engineering Mechanics, July 1997, 660-668.
41. Matta F, Galati N, and Nanni A (2005) “Pultruded Grid and Stay-in-Place Form
Panels for the Rapid Construction of Bridge Decks”, Composites 2005,
Proceedings from the American Composites Manufacturers Association
Convention and Trade Show, September 28-30, 2005, Columbus, Ohio, USA
181

182
42. Mirmiran A, and Shahawy M (1997) “Behavior of concrete columns confined by
fiber composites.” Journal of Structural Engineering, 123(5):583-590.
43. Nayal R, and Rasheed H (2006) “Tension Stiffening Model for Concrete Beams
Reinforced with Steel and FRP Bars”, Journal of Materials in Civil Engineering,
ASCE, November – December, 2006, 831-841.
44. Pluijm Rvd (1993) “Shear behaviour of bed joints”, Proceedings of the North
American Masonry Conference, Philadelphia, USA, 125-136
45. Prestressed Concrete Institute (2001) “PCI Bridge Design Manual, Chapter 16.2:
Stay-in-Place Deck Panels”
46. Shao Y (2006) “Characterization of a Pultruded FRP Sheet Pile for Waterfront
Retaining Structures”, ASCE Journal of Materials in Civil Engineering, 18(5):
626-633.
47. Sooriyaarachchi H, Pilakoutas K, and Byars E (2005) “Tension Stiffening
Behavior of GFRP-Reinforced Concrete”, American Concrete Institute, Special
Publication, 230: 975-990.
48. Triantafillou TC, and Meier U (1992) “Innovative Design of FRP Combined with
Concrete”, Advanced Composite Materials in Bridges and Structures, Canadian
Society of Civil Engineering, 1992, 491-500.

APPENDIX 1: DETAILED DESCRIPTION OF SCIENTIFIC METHOD
Instrumentation and Precision of Measurements
1. Data Acquisition: All data channels were monitored and recorded using a
personal computer based digital data acquisition system (Vishay StrainSmart
System 5000).
2. Strain Gauges: All strain measurements applicable to GFRP surfaces in this
investigation were made using electrical resistance foil gauges with a 5mm gauge
length (Showa, type N11-FA-5-120-11).
3. Linear Potentiometers (LPs): All linear displacement measurements in this
investigation were made using linear potentiometers with a 100mm stroke
(NovoTechnik, type TRS 100).
4. Displacement-Type Strain Transducers (PI Gauges): All strain measurements
applicable to concrete surface in this investigation were made using displacement-
type strain transducers (PI gauges) with a 100mm gauge length and a maximum
range of ±5mm (Tokyo Sokki Kenkyujo Co., type PI-5-100).
5. Application and Measurement of Loads: Loads were applied to specimens using
a Reihle screw-driven loading machine. Loads were applied using stroke control
at a constant rate of 1mm per minute in order to ensure quasi-static loading
conditions. The loading machine incorporated an integrated load cell with an
assignable load range of up to ±900kN. For the purposes of this investigation, a
load range of ±500kN was employed in order to maximize measurement precision
183

while ensuring that the load ranged enveloped the maximum expected load
resisted by the specimens.
Comments on Precision of Specimen Fabrication
1. Dimensions: All specimens were constructed using pultruded GFRP sections as
stay-in-place structural open formwork. As such, the dimensions of these GFRP
sections may be considered to be accurate to within 0.01mm as per the
manufacturer’s published data sheets. In the case of the flat GFRP plates, the
width of the plates was cut using a hand-held circular saw; therefore, the width of
these sheets is accurate to within approximately 3mm (thickness of the saw
blade). Measurements for all additional wooden wall forms were made using a
conventional retractable measuring tape with 1mm graduations, and markings
were made using a permanent marker with a line thickness of approximately
3mm. Unfortunately, uncontrollable factors such as warping of the wooden forms
caused imprecision in the dimensions of the formwork. For the most part, the
resulting dimensional discrepancies were no greater than 5mm; however, it was
found that the width of the members sometimes varied by as much as 10mm near
mid-span. The depth of concrete in the members was very well controlled to
within approximately 4mm of the design depth; as such the total depth of all
specimens was fairly consistent with the specified dimensions discussed in
chapters 3 and 4.
2. Materials: For each specimen fabricated, three concrete cylinders were fabricated
using the same batch of concrete with a diameter of 4” and a height of 8”.
184

Similarly, 3 grout cylinders were fabricated for each specimen incorporating grout
diaphragms. At the time of testing each specimen, its cylinders were tested in
uniaxial compression in accordance with ASTM C39. The slab specimens shared
the same batch of concrete as used for Type 1 girder specimens (specimens 1, 2,
and 3). The results of the concrete tests are summarized in Tables A1 and A2.
For each type of GFRP section, 3 dog-bone style coupons were fabricated and
tested in accordance with ASTM D3039/D3039M. The results of these coupon
tests are summarized in Table A3. The stress-strain responses of these coupons
are shown in Figure 4-13.
Table A1. Concrete cylinder strength data
Girder Specimens Cylinder 1 Cylinder 2 Cylinder 3 Average Standard Deviation
Specimen # MPa MPa MPa MPa MPa 1 35.8 37.2 36.7 36.6 0.709 2 39.1 36.6 33.0 36.2 3.066 3 34.6 35.9 37.1 35.9 1.250
Slabs & Type 1 Summary 36.2 1.72 4 39.9 37.5 38.7 38.7 1.200 5 37.5 36.1 33.0 35.5 2.303
Type 2 Summary 37.1 2.4 6 47.2 52.1 50.5 50.0 2.499 7 44.17 53.1 53.0 50.1 5.127 8 55.6 55.5 58.2 56.5 1.531
Type 3 Summary 52.2 4.4
Table A2. Grout cylinder strength data
Girder Specimens Cylinder 1 Cylinder 2 Cylinder 3 Average Standard Deviation
Specimen # MPa MPa MPa MPa MPa 6, 7, 8, & 9 35.6 32.8 39.1 35.8 3.156
185

Table A3. GFRP coupon test data
Flat GFRP Sheets Tensile Strength (MPa) Elastic Modulus (GPa) Coupon 1 271.2 21.2 Coupon 2 270.4 19.0 Coupon 3 262.7 21.6 Average 268.1 20.6 Standard Deviation 4.7 1.4 Sheet Piles for specimens 1 to 5 Tensile Strength (MPa) Elastic Modulus (GPa) Coupon 1 359.7 NA Coupon 2 398.3 29.0 Coupon 3 336.6 25.5 Average 364.9 27.3 Standard Deviation 31.2 NA Sheet Piles for specimens 6 to 9 Tensile Strength (MPa) Elastic Modulus (GPa) Coupon 1 574.4 24.4 Coupon 2 561.1 26.8 Coupon 3 464.9 26.4 Average 533.5 25.9 Standard Deviation 59.8 1.3
Comments on Precision of Test Setup
1. Location of Supports and Loading Lines: Support locations and loading lines
were measured relative to the supports using a conventional retractable measuring
tape and marked using a permanent marker with a line thickness of approximately
3mm. As such, the size of the constant moment zone and the shear spans were
likely within approximately 3mm of their designed dimensions.
2. Normalization of Data Acquisition: Loading beams and the spreader beam were
assumed to have zero mass, and hence the data acquisition system was zeroed
after these items were put in place. This would likely have altered the load by
approximately 0.5kN, and would have added minute strains and deflections to the
system as well. Because the GFRP forms were treated as stay-in-place structural
formwork, the self weight of the concrete was resisted entirely by the GFRP
forms. As such, the forms had undergone some initial strains and deflections due
186

187
to self weight prior to the application of any super-imposed loads, whereas the
concrete had zero strain. This strain discontinuity would have a minor effect on
the accuracy of curvature calculations. Strain gauges were applied to the GFRP
after these strains occurred, and thus these initial strains were not recorded or
accounted for in any way. Due to the minute magnitude of these initial strains
relative to the strains that the sections later endured as superimposed loads were
applied, it was decided that the effect of these initial strains was negligible.

APPENDIX 2(a):
FORTRAN90 Code for Analytical Model of Slab Specimens in Positive Bending
PROGRAM BONDSLAB6 IMPLICIT NONE REAL :: TSTRAIN, CSTRAIN !Tensile and compressive strains at extreme fibres REAL :: STRAINY !Strain at a given height Y REAL :: YBAR, D1, D2 !Height of neutral axis, and two pointers used to find YBAR REAL :: H, B, TPLATE !Total depth of section, width of section, and thickness of FRP plate REAL :: BBOND !Total width of bonded area between concrete and FRP REAL :: XCRACK !Distance from each support to region where cracking moment is surpassed REAL :: FRPFORCECRACK !Total force in the FRP sheet at the location of the crack REAL :: NEWYBAR !Height of neutral axis prior to cracking REAL :: M, MR, CURV !Moment, maximum moment of resistance, and curvature REAL :: MCR !Cracking moment of section REAL :: MU !Ultimate moment at failure 188 REAL :: ERROR !Allowable error in the location of the neutral axis REAL :: SUMFORCE !Sum of all forces in the section REAL :: THICK !Thickness of each layer REAL :: RHO !Reinforcement ratio REAL :: FCPRIME, FC !Specified compression and tensile strength of concrete REAL :: EC, ECPRIME !Initial modulus of concrete and modulus at FCPRIME REAL :: ECN !Effective modulus of concrete for use in modulus ratio REAL :: NE !Modulus ratio REAL :: STRAINCPRIME !Strain in concrete at FCPRIME REAL :: CDENS !Density of concrete REAL :: FSCT, FSCC !Tension and compression failure strains for concrete REAL :: N, K !Coefficients for determining concrete properties REAL :: ALPHA1, ALPHA2 !Coefficients for tension stiffening REAL :: FFPRIME, FF !Specified compression and tensile strength of FRP REAL :: EFPRIME, EF !Specified compression and tensile modulus of FRP REAL :: FSFT, FSFC !Tension and compression failure strains for FRP REAL :: FRPFORCE !Total longitudinal force in FRP REAL :: FBOND, BONDSTRENGTH !Bond stress and strength between FRP and concrete REAL :: NEWFBOND !Bond stress in uncracked regions REAL :: VC !Shear strength of concrete REAL :: BONDFAILURE1, BONDFAILURE2, MLOAD, SHEARFAILURE, FAILURE !Loads at which bond failure, flexure failure, and shear failure occur REAL :: A, SPAN !Shear span and clear span of the beam REAL :: ENDLENGTH !Length of the overhangs beyond the support at each end of the beam REAL :: LOAD, V !Total applied load on the beam, and resultant vertical shear in each shear span REAL :: IXXT !Transformed second moment of inertia of section REAL :: NEWIXXT !Transformed second moment of inertia of new uncracked section REAL :: QFRP !First moment of area of FRP about neutral axis REAL :: NEWQFRP !First moment of area of FRP about neutral axis of new uncracked section REAL, PARAMETER :: PI = 3.141592654

REAL, PARAMETER :: NUMLAYER = 1000 !Total number of layers used in analysis INTEGER :: I,Q,L,CR REAL :: STRESSC, STRESSF !Stress in concrete and FRP layers respectively OPEN(1,FILE='BONDSLAB6.TXT') !File in which moment curvature plot is output H = 161.4 B = 400.0 BBOND = 380.0 A = 975 SPAN = 2200 ENDLENGTH = 110 XCRACK = SPAN/2 MCR = 0 CR = 1 IXXT = 0 QFRP = 0 NEWIXXT = 0 NEWQFRP = 0 FRPFORCE = 0 189 BONDFAILURE1 = 10**10 BONDFAILURE2 = 10**10 MLOAD = 0 SHEARFAILURE = 10**10 TPLATE = 9.525 FFPRIME = 137.5 FF = 137.5 EFPRIME = 18000.0 EF = 18000.0 RHO = TPLATE/H CDENS = 2400 FCPRIME = 37 VC = 0.2 * (FCPRIME**0.5) * B * (H-TPLATE) FC = 0.62 * (FCPRIME**0.5) EC = 4750*(FCPRIME**0.5) FSCC = 0.003 FSCT = FC / EC N = 0.8 + (FCPRIME / 17) K = 0.67 + (FCPRIME / 62) STRAINCPRIME = (FCPRIME / EC) * (N / (N - 1)) IF (K < 1) THEN K = 1 ENDIF ALPHA1 = 1 ALPHA2 = 1 FSFT = FF / EF FSFC = FFPRIME / EFPRIME BONDSTRENGTH = 1

ERROR = H / 50000 THICK = H / NUMLAYER CSTRAIN = 0 TSTRAIN = 0 MR = 0 WRITE (1,100) "MOMENT", "CURVATURE", "MAX TENSILE STRAIN", "MAX COMPRESSIVE STRAIN", "YBAR", "IXX", "BOND STRESS" !Places headings on the document 100 format (A6,",",A9, ",", A18, ",", A22, ",", A4, ",", A3, ",", A11) DO WHILE (TSTRAIN < FSFT .and. ABS(CSTRAIN) < 2*FSCC) !Iterates to find moment vs curvature relationship (tries many tensile strains) D1 = 0 D2 = H YBAR = (D1 + D2) / 2 DO WHILE (D2 - D1 > ERROR) !Iterates to determine neutral axis location for a given tensile strain TSTRAIN = YBAR * CSTRAIN / (YBAR - H) FRPFORCE = 0 SUMFORCE = 0 M = 0 IXXT = 0 190 QFRP = 0 DO I = 0, NUMLAYER - 1 !Sums forces and moments from each layer in the section STRAINY = TSTRAIN * (1 - (((I*THICK) + (THICK/2))/YBAR)) !Strain at height of layer IF ((I*THICK) + (THICK/2) >= YBAR) THEN !If we are looking above the neutral axis (compression) STRESSF = EFPRIME * STRAINY !Stress in FRP STRESSC = 0 - (FCPRIME * (N * (ABS(STRAINY)/STRAINCPRIME) / (N-1+(ABS(STRAINY)/STRAINCPRIME)**(N*K)))) !Stress in concrete IF (ABS(STRAINY) >= FSCC) THEN STRESSC = 0 ENDIF IF (ABS(STRAINY) >= FSFC) THEN STRESSF = 0 ENDIF ELSEIF ((I*THICK) + (THICK/2) < YBAR) THEN !If we are looking below the neutral axis (tension) STRESSF = EF * STRAINY !Stress in FRP STRESSC = STRAINY * EC !Stress in concrete IF (ABS(STRAINY) >= FSCT) THEN STRESSC = (ALPHA1*ALPHA2*FC) / (1 + (500*(STRAINY-FSCT))**0.5) !Tension stiffening stress curve for concrete ENDIF ENDIF IF ((I*THICK) + (THICK/2) < TPLATE) THEN !If we are looking at a layer within the FRP STRESSC = 0 NE = EF/EC IF (STRESSF == 0) THEN NE = 0 END IF QFRP = QFRP + (THICK*B*NE*(ABS((I*THICK)-YBAR))) FRPFORCE = FRPFORCE + (B * THICK)*STRESSF ELSEIF ((I*THICK) + (THICK/2) >= TPLATE) THEN !If we are looking at a layer within the concrete STRESSF = 0

ECN = ABS(STRESSC / STRAINY) NE = ECN/EC IF (STRESSC == 0) THEN NE = 0 END IF IF (STRAINY >= FSCT) THEN NE = 0 END IF ENDIF IXXT = IXXT + ABS(THICK*B*NE*(((I*THICK)-YBAR)**2)) SUMFORCE = SUMFORCE + (B * THICK)*(STRESSC + STRESSF) M = M - ((I*THICK) + (THICK/2))*(B * THICK)*(STRESSC + STRESSF) ENDDO CURV = TSTRAIN / YBAR IF (SUMFORCE < 0) THEN D1 = YBAR YBAR = (YBAR + D2) / 2 ELSEIF (SUMFORCE > 0) THEN D2 = YBAR YBAR = (YBAR + D1) / 2 ELSE EXIT ENDIF 191 ENDDO IF (NEWQFRP == 0) THEN NEWQFRP = QFRP ENDIF IF (NEWIXXT == 0) THEN NEWIXXT = IXXT ENDIF IF (IXXT <= 0.8*NEWIXXT .and. MCR == 0) THEN MCR = M NEWYBAR = YBAR ENDIF IF (IXXT <= 0.8*NEWIXXT) THEN XCRACK = A * MCR/M CR = CR + 1 !Counts iterations beyond the cracking moment ENDIF IF (M > MR) THEN MR = M ENDIF MLOAD = 2*MR/A LOAD = 2*M/A V = LOAD/2 FRPFORCECRACK = TPLATE*B*MCR*(NEWYBAR-(TPLATE/2))/NEWIXXT IF ((FRPFORCECRACK+FRPFORCE)/2 >= (BONDSTRENGTH * BBOND * (XCRACK + ENDLENGTH)) .and. BONDFAILURE2 == 10**10) THEN !!!!!!!!!!!!!!!! BONDFAILURE2 = LOAD ENDIF

WRITE (1,150) M, CURV, TSTRAIN, CSTRAIN, YBAR, IXXT 150 format (f25.13,",",f25.13, ",", f25.13, ",", f25.13, ",", f25.13, ",", f25.13) CSTRAIN = CSTRAIN - 0.00001 ENDDO CSTRAIN = 0 TSTRAIN = 0 NEWIXXT = 0 NEWQFRP = 0 CR = 1 MCR = 0 DO WHILE (TSTRAIN < FSFT .and. ABS(CSTRAIN) < 2*FSCC) !Iterates to find moment vs curvature relationship (tries many tensile strains) D1 = 0 D2 = H YBAR = (D1 + D2) / 2 DO WHILE (D2 - D1 > ERROR) !Iterates to determine neutral axis location for a given tensile strain TSTRAIN = YBAR * CSTRAIN / (YBAR - H) FRPFORCE = 0 SUMFORCE = 0 M = 0 192 IXXT = 0 QFRP = 0 DO I = 0, NUMLAYER - 1 !Sums forces and moments from each layer in the section STRAINY = TSTRAIN * (1 - (((I*THICK) + (THICK/2))/YBAR)) !Strain at height of layer IF ((I*THICK) + (THICK/2) >= YBAR) THEN !If we are looking above the neutral axis (compression) STRESSF = EFPRIME * STRAINY !Stress in FRP STRESSC = 0 - (FCPRIME * (N * (ABS(STRAINY)/STRAINCPRIME) / (N-1+(ABS(STRAINY)/STRAINCPRIME)**(N*K)))) !Stress in concrete IF (ABS(STRAINY) >= FSCC) THEN STRESSC = 0 ENDIF IF (ABS(STRAINY) >= FSFC) THEN STRESSF = 0 ENDIF ELSEIF ((I*THICK) + (THICK/2) < YBAR) THEN !If we are looking below the neutral axis (tension) STRESSF = EF * STRAINY !Stress in FRP STRESSC = STRAINY * EC !Stress in concrete IF (ABS(STRAINY) >= FSCT) THEN STRESSC = 0 ENDIF ENDIF IF ((I*THICK) + (THICK/2) < TPLATE) THEN !If we are looking at a layer within the FRP STRESSC = 0 NE = EF/EC IF (STRESSF == 0) THEN NE = 0 END IF QFRP = QFRP + (THICK*B*NE*(ABS((I*THICK)-YBAR))) FRPFORCE = FRPFORCE + (B * THICK)*STRESSF ELSEIF ((I*THICK) + (THICK/2) >= TPLATE) THEN !If we are looking at a layer within the concrete STRESSF = 0

ECN = ABS(STRESSC / STRAINY) NE = ECN/EC IF (STRESSC == 0) THEN NE = 0 END IF IF (STRAINY >= FSCT) THEN NE = 0 END IF ENDIF IXXT = IXXT + ABS(THICK*B*NE*(((I*THICK)-YBAR)**2)) SUMFORCE = SUMFORCE + (B * THICK)*(STRESSC + STRESSF) M = M - ((I*THICK) + (THICK/2))*(B * THICK)*(STRESSC + STRESSF) ENDDO CURV = TSTRAIN / YBAR IF (SUMFORCE < 0) THEN D1 = YBAR YBAR = (YBAR + D2) / 2 ELSEIF (SUMFORCE > 0) THEN D2 = YBAR YBAR = (YBAR + D1) / 2 ELSE EXIT ENDIF 193 ENDDO IF (NEWQFRP == 0) THEN NEWQFRP = QFRP ENDIF IF (NEWIXXT == 0) THEN NEWIXXT = IXXT NEWYBAR = YBAR ENDIF IF (IXXT <= 0.8*NEWIXXT .and. MCR == 0) THEN MCR = M NEWYBAR = YBAR ENDIF IF (IXXT <= 0.8*NEWIXXT) THEN XCRACK = A * MCR/M CR = CR + 1 !Counts iterations beyond the cracking moment ENDIF LOAD = 2*M/A V = LOAD/2 NEWFBOND = V*NEWQFRP/(NEWIXXT*BBOND) !VQ/It!!!!!!!!!!!!!!!! FBOND = V*QFRP/(IXXT*BBOND) !VQ/It!!!!!!!!!!!!!!!! IF (FBOND >= BONDSTRENGTH .and. BONDFAILURE1 == 10**10) THEN BONDFAILURE1 = LOAD ENDIF FRPFORCECRACK = TPLATE*B*MCR*(NEWYBAR-(TPLATE/2))/NEWIXXT

IF ((FRPFORCECRACK+FRPFORCE)/2 >= (BONDSTRENGTH * BBOND * (XCRACK + ENDLENGTH)) .and. BONDFAILURE2 == 10**10) THEN !!!!!!!!!!!!!!!! BONDFAILURE2 = LOAD ENDIF SHEARFAILURE = VC * 2 WRITE (1,165) M, CURV, TSTRAIN, CSTRAIN, YBAR, IXXT, FBOND, MCR 165 format (f25.13,",",f25.13, ",", f25.13, ",", f25.13, ",", f25.13, ",", f25.13, ",", f25.13, ",", f25.13) CSTRAIN = CSTRAIN - 0.00001 ENDDO IF (MLOAD <= BONDFAILURE1 .and. MLOAD <= SHEARFAILURE .and. MLOAD <= BONDFAILURE2) THEN FAILURE = MLOAD ELSEIF (MLOAD >= BONDFAILURE1 .and. MLOAD <= BONDFAILURE2 .and. MLOAD <= SHEARFAILURE) THEN FAILURE = MLOAD ELSEIF (SHEARFAILURE <= MLOAD .and. SHEARFAILURE <= BONDFAILURE1 .and. SHEARFAILURE <= BONDFAILURE2) THEN FAILURE = SHEARFAILURE ELSEIF (SHEARFAILURE <= MLOAD .and. SHEARFAILURE >= BONDFAILURE1 .and. SHEARFAILURE <= BONDFAILURE2) THEN FAILURE = SHEARFAILURE ELSEIF (BONDFAILURE1 <= MLOAD .and. BONDFAILURE1 >= BONDFAILURE2 .and. BONDFAILURE1 <= SHEARFAILURE) THEN FAILURE = BONDFAILURE1 ELSEIF (BONDFAILURE2 <= MLOAD .and. BONDFAILURE2 >= BONDFAILURE1 .and. BONDFAILURE2 <= SHEARFAILURE) THEN FAILURE = BONDFAILURE2 ENDIF
194 MU = A*(FAILURE/2) WRITE (1,175) "_____________________________________________" 175 format (A45) WRITE (1,200) "Failure Moment Mu", MU 200 format (A17,",", f21.4) WRITE (1,250) "Failure Load", FAILURE 250 format (A12,",", f26.4) WRITE (1,275) "_____________________________________________" 275 format (A45) WRITE (1,300) "Shear Failure Load", SHEARFAILURE 300 format (A18,",", f20.4) WRITE (1,350) "Initial Bond Failure Load", BONDFAILURE1 350 format (A25,",", f23.4) WRITE (1,400) "Ultimate Bond failure Load", BONDFAILURE2 400 format (A26,",", f22.4) WRITE (1,450) "Flexure Failure Load", MLOAD 450 format (A20,",", f18.4) WRITE (1,500) "Flexure Failure Moment", MR 500 format (A22,",", f16.4) ENDPROGRAM BONDSLAB6

APPENDIX 2(b):
FORTRAN90 Code for Analytical Model of Type 2 Girder Specimens in Positive Bending (specimen 4)
PROGRAM SHEETPILEHYBRIDZONE1 IMPLICIT NONE REAL :: TSTRAIN, CSTRAIN !Tensile and compressive strains at extreme fibres REAL :: STRAINY !Strain at a given height Y REAL :: YBAR, D1, D2 !Height of neutral axis, and two pointers used to find YBAR REAL :: MCR !Cracking moment of section REAL :: XCRACK !Distance from each support to region where cracking moment is surpassed REAL :: FRPFORCECRACK !Total force in the FRP sheet at the location of the crack REAL :: NEWYBAR !Height of neutral axis prior to cracking REAL :: H, BF !Total depth of section, and Total width of section (one T-Beam) REAL :: DSLAB !Thickness (depth) of concrete slab REAL :: BVOID !Width of void within concrete 195 REAL :: DPILE !Total depth of FRP sheetpile section REAL :: TFLANGEPILE, TWEBPILE !Thickness of the FRP sheetpile section in the flanges and the webs REAL :: BWB, BWT !Total outside width of the web of the T-beam section at the bottom and top of the web REAL :: WEBANGLE !Angle of the webs of the FRP sheetpile section (degrees from vertical) REAL :: PILEWIDTH !Total widh of FRP sheetpile section (centre-to-centre spacing of corrugations) REAL :: WLFINSIDE !inside width of lower flange REAL :: M, MR, CURV !Moment, maximum moment of resistance, and curvature REAL :: ERROR !Allowable error in the location of the neutral axis REAL :: SUMFORCE !Sum of all forces in the section REAL :: THICK !Thickness of each layer REAL :: WFRP !Width of FRP layer REAL :: WCONCRETE !Width of concrete layer REAL :: FCPRIME, FC !Specified compression and tensile strength of concrete REAL :: EC, ECPRIME !Initial modulus of concrete and modulus at FCPRIME REAL :: ECN !Effective modulus of concrete for use in modulus ratio REAL :: NEC !Modulus ratio for concrete REAL :: NEF !Modulus ratio for FRP REAL :: NEFLF !Specific modulus ratio for FRP at lower flange of section REAL :: STRAINCPRIME !Strain in concrete at FCPRIME REAL :: CDENS !Density of concrete REAL :: FSCT, FSCC !Tension and compression failure strains for concrete REAL :: N, K !Coefficients for determining concrete properties REAL :: ALPHA1, ALPHA2 !Coefficients for tension stiffening REAL :: RCZONETHICK !Thickness of concrete layer that experienves tension stiffening REAL :: WPLZONE !Width of zone that does not experience tension stiffening REAL :: FFPRIME, FF !Specified compression and tensile strength of FRP sheetpile section REAL :: EFPRIME, EF !Specified compression and tensile modulus of FRP sheetpile section REAL :: FSFT, FSFC !Tension and compression failure strains for FRP sheetpile section REAL :: FRPFORCE !Total longitudinal force in FRP REAL :: UFBOND !Percent of upper flange that is convered with bond mechanism

REAL :: LFBOND !Percent of lower flange that is convered with bond mechanism REAL :: WBOND !Percent of web that is convered with bond mechanism (must be either 0% or 100%) REAL :: TOTBOND !Total bond shear force between GFRP and concrete REAL :: BONDSTRENGTH !Bond strength between FRP and concrete REAL :: FBONDSLAB, FBONDWEB, FBONDBOTTOM, FBONDBOTTOMULT !Bond stress below concrete slab, at upper-most bonded region of web, and at lower flange REAL :: FBONDWEBAVG !Average bond stress in the web REAL :: NEWFBOND !Bond stress in uncracked regions REAL :: VC !Shear strength of concrete REAL :: BONDFAILURE1, BONDFAILURE2, BONDFAILURE3, MLOAD, SHEARFAILURE, FAILURE !Loads at which bond failure, flexure failure, and shear failure occur REAL :: A, SPAN !Shear span and clear span of the beam REAL :: ENDLENGTH !Length of the overhangs beyond the support at each end of the beam REAL :: LOAD, V !Total applied load on the beam, and resultant vertical shear in each shear span REAL :: IXXT !Transformed second moment of inertia of section REAL :: NEWIXXT !Transformed second moment of inertia of new uncracked section REAL :: QSLAB !First moment of area of concrete slab about neutral axis REAL :: QLFLANGE !First moment of area of lower flange of sheet pile about neutral axis REAL :: QFRP !First moment of area of sheet pile about neutral axis REAL :: NEWQSLAB !First moment of area of concrete slab about neutral axis of new uncracked section REAL, PARAMETER :: PI = 3.141592654 REAL, PARAMETER :: NUMLAYER = 1000 !Total number of layers used in analysis INTEGER :: I,Q,L,CR REAL :: STRESSC, STRESSF !Stress in concrete and FRP layers respectively OPEN(1,FILE='SHEETPILEHYBRIDZONE1.TXT') !File in which moment curvature plot is output 196 PILEWIDTH = 609.6 DPILE = 254 TFLANGEPILE = 8.89 TWEBPILE = 7.62 WEBANGLE = 20 WEBANGLE = 2*PI*WEBANGLE/360 BWB = 208.28 BWT = BWB + 2*(DPILE - TFLANGEPILE)*TAN(WEBANGLE) WLFINSIDE = (BWB - 2*TWEBPILE/COS(WEBANGLE)) + 2*TFLANGEPILE*TAN(WEBANGLE) A = 1350 SPAN = 3100 ENDLENGTH = 125 XCRACK = SPAN/2 MCR = 0 CR = 1 IXXT = 0 QSLAB = 0 QFRP = 0 QLFLANGE = 0 NEWIXXT = 0 NEWQSLAB = 0 FRPFORCE = 0 BONDFAILURE1 = 10**10 BONDFAILURE2 = 10**10 BONDFAILURE3 = 10**10 MLOAD = 0
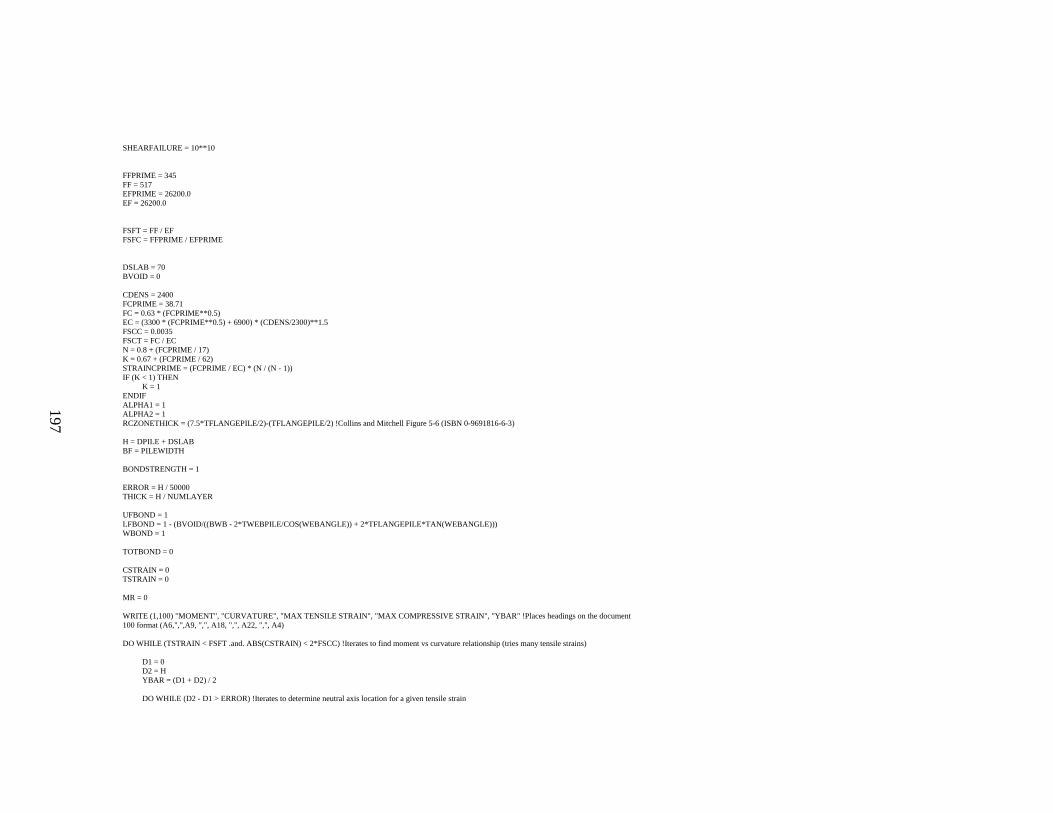
SHEARFAILURE = 10**10 FFPRIME = 345 FF = 517 EFPRIME = 26200.0 EF = 26200.0 FSFT = FF / EF FSFC = FFPRIME / EFPRIME DSLAB = 70 BVOID = 0 CDENS = 2400 FCPRIME = 38.71 FC = 0.63 * (FCPRIME**0.5) EC = (3300 * (FCPRIME**0.5) + 6900) * (CDENS/2300)**1.5 FSCC = 0.0035 FSCT = FC / EC N = 0.8 + (FCPRIME / 17) K = 0.67 + (FCPRIME / 62) STRAINCPRIME = (FCPRIME / EC) * (N / (N - 1)) IF (K < 1) THEN K = 1 ENDIF ALPHA1 = 1 ALPHA2 = 1
197 RCZONETHICK = (7.5*TFLANGEPILE/2)-(TFLANGEPILE/2) !Collins and Mitchell Figure 5-6 (ISBN 0-9691816-6-3) H = DPILE + DSLAB BF = PILEWIDTH BONDSTRENGTH = 1 ERROR = H / 50000 THICK = H / NUMLAYER UFBOND = 1 LFBOND = 1 - (BVOID/((BWB - 2*TWEBPILE/COS(WEBANGLE)) + 2*TFLANGEPILE*TAN(WEBANGLE))) WBOND = 1 TOTBOND = 0 CSTRAIN = 0 TSTRAIN = 0 MR = 0 WRITE (1,100) "MOMENT", "CURVATURE", "MAX TENSILE STRAIN", "MAX COMPRESSIVE STRAIN", "YBAR" !Places headings on the document 100 format (A6,",",A9, ",", A18, ",", A22, ",", A4) DO WHILE (TSTRAIN < FSFT .and. ABS(CSTRAIN) < 2*FSCC) !Iterates to find moment vs curvature relationship (tries many tensile strains) D1 = 0 D2 = H YBAR = (D1 + D2) / 2 DO WHILE (D2 - D1 > ERROR) !Iterates to determine neutral axis location for a given tensile strain

TSTRAIN = YBAR * CSTRAIN / (YBAR - H) FRPFORCE = 0 SUMFORCE = 0 M = 0 IXXT = 0 QSLAB = 0 QFRP = 0 QLFLANGE = 0 DO I = 0, NUMLAYER - 1 !Sums forces and moments from each layer in the section STRAINY = TSTRAIN * (1 - (((I*THICK) + (THICK/2))/YBAR)) !Strain at height of layer IF ((I*THICK) + (THICK/2) >= YBAR) THEN !If we are looking above the neutral axis (compression) STRESSF = EFPRIME * STRAINY !Stress in FRP STRESSC = 0 - (FCPRIME * (N * (ABS(STRAINY)/STRAINCPRIME) / (N-1+(ABS(STRAINY)/STRAINCPRIME)**(N*K)))) !Stress in concrete IF (ABS(STRAINY) >= FSCC) THEN STRESSC = 0 ENDIF IF (ABS(STRAINY) >= FSFC) THEN STRESSF = 0 ENDIF ELSEIF ((I*THICK) + (THICK/2) < YBAR) THEN !If we are looking below the neutral axis (tension) STRESSF = EF * STRAINY !Stress in FRP STRESSC = STRAINY * EC !Stress in concrete IF (ABS(STRAINY) >= FSCT) THEN STRESSC = (ALPHA1*ALPHA2*FC) / (1 + (500*(STRAINY-FSCT))**0.5) !Tension stiffening stress curve for concrete ENDIF 198 ENDIF NEF = EF/EC IF (STRESSF == 0) THEN NEF = 0 END IF IF (STRAINY >= FSFT) THEN NEF = 0 END IF ECN = ABS(STRESSC / STRAINY) NEC = ECN/EC IF (STRESSC == 0) THEN NEC = 0 END IF IF ((I*THICK) + (THICK/2) < TFLANGEPILE) THEN !If we are looking at a layer within the lower flange of the FRP sheetpile section WCONCRETE = 0 WFRP = BWB + 2*((I*THICK) + (THICK/2))*TAN(WEBANGLE) QLFLANGE = QLFLANGE + ABS(THICK*WFRP*NEF*((I*THICK)-YBAR)) NEFLF = NEF ELSEIF ((I*THICK) + (THICK/2) >= TFLANGEPILE .and. (I*THICK) + (THICK/2) < (DPILE - TFLANGEPILE)) THEN !If we are looking at a layer within the web WCONCRETE = (BWB - 2*TWEBPILE/COS(WEBANGLE)) + 2*((I*THICK) + (THICK/2))*TAN(WEBANGLE)-BVOID IF (WCONCRETE - (2*RCZONETHICK/COS(WEBANGLE)) > 0) THEN WPLZONE = WCONCRETE - (2*RCZONETHICK/COS(WEBANGLE)) ELSE WPLZONE = 0 ENDIF IF ((I*THICK) + (THICK/2) > RCZONETHICK + TFLANGEPILE .and. STRAINY >= FSCT) THEN WCONCRETE = WCONCRETE - WPLZONE ENDIF

WFRP = 2*TWEBPILE/COS(WEBANGLE) ELSEIF ((I*THICK) + (THICK/2) >= (DPILE - TFLANGEPILE) .and. (I*THICK) + (THICK/2) < DPILE) THEN !If we are looking at a layer within the upper flange of the FRP sheetpile section WCONCRETE = (BWB - 2*TWEBPILE/COS(WEBANGLE)) + 2*((I*THICK) + (THICK/2))*TAN(WEBANGLE)-BVOID WFRP = ((PILEWIDTH - BWT) + 2*TWEBPILE/COS(WEBANGLE)) - 2*((I*THICK) + (THICK/2) - (DPILE - TFLANGEPILE))*TAN(WEBANGLE) ELSEIF ((I*THICK) + (THICK/2) >= DPILE) THEN !If we are looking at a layer within the concrete slab WCONCRETE = BF WFRP = 0 QSLAB = QSLAB + ABS(THICK*WCONCRETE*NEC*((I*THICK)-YBAR)) ENDIF QFRP = QFRP + ABS(THICK*WFRP*NEF*((I*THICK)-YBAR)) IXXT = IXXT + ABS(THICK*WCONCRETE*NEC*(((I*THICK)-YBAR)**2)) + ABS(THICK*WFRP*NEF*(((I*THICK)-YBAR)**2)) SUMFORCE = SUMFORCE + THICK*((WCONCRETE*STRESSC) + (WFRP*STRESSF)) FRPFORCE = FRPFORCE + THICK*WFRP*STRESSF M = M - ((I*THICK) + (THICK/2))*THICK*((WCONCRETE*STRESSC) + (WFRP*STRESSF)) ENDDO CURV = TSTRAIN / YBAR IF (SUMFORCE < 0) THEN D1 = YBAR YBAR = (YBAR + D2) / 2 ELSEIF (SUMFORCE > 0) THEN D2 = YBAR YBAR = (YBAR + D1) / 2 ELSE EXIT 199 ENDIF ENDDO IF (M > MR) THEN MR = M ENDIF V = M/A LOAD = V*2 WRITE (1,150) M, CURV, TSTRAIN, CSTRAIN, YBAR, LOAD 150 format (f25.13,",",f25.13, ",", f25.13, ",", f25.13, ",", f25.13, ",", f25.13) CSTRAIN = CSTRAIN - 0.00001 ENDDO CSTRAIN = 0 TSTRAIN = 0 NEWIXXT = 0 NEWQSLAB = 0 CR = 1 MCR = 0 DO WHILE (TSTRAIN < FSFT .and. ABS(CSTRAIN) < 2*FSCC) !Iterates to find moment vs curvature relationship (tries many tensile strains) D1 = 0 D2 = H YBAR = (D1 + D2) / 2 DO WHILE (D2 - D1 > ERROR) !Iterates to determine neutral axis location for a given tensile strain TSTRAIN = YBAR * CSTRAIN / (YBAR - H) FRPFORCE = 0

SUMFORCE = 0 M = 0 IXXT = 0 QSLAB = 0 QFRP = 0 QLFLANGE = 0 DO I = 0, NUMLAYER - 1 !Sums forces and moments from each layer in the section STRAINY = TSTRAIN * (1 - (((I*THICK) + (THICK/2))/YBAR)) !Strain at height of layer IF ((I*THICK) + (THICK/2) >= YBAR) THEN !If we are looking above the neutral axis (compression) STRESSF = EFPRIME * STRAINY !Stress in FRP STRESSC = 0 - (FCPRIME * (N * (ABS(STRAINY)/STRAINCPRIME) / (N-1+(ABS(STRAINY)/STRAINCPRIME)**(N*K)))) !Stress in concrete IF (ABS(STRAINY) >= FSCC) THEN STRESSC = 0 ENDIF IF (ABS(STRAINY) >= FSFC) THEN STRESSF = 0 ENDIF ELSEIF ((I*THICK) + (THICK/2) < YBAR) THEN !If we are looking below the neutral axis (tension) STRESSF = EF * STRAINY !Stress in FRP STRESSC = STRAINY * EC !Stress in concrete IF (ABS(STRAINY) >= FSCT) THEN STRESSC = 0 ENDIF ENDIF 200 NEF = EF/EC IF (STRESSF == 0) THEN NEF = 0 END IF IF (STRAINY >= FSFT) THEN NEF = 0 END IF ECN = ABS(STRESSC / STRAINY) NEC = ECN/EC IF (STRESSC == 0) THEN NEC = 0 END IF IF ((I*THICK) + (THICK/2) < TFLANGEPILE) THEN !If we are looking at a layer within the lower flange of the FRP sheetpile section WCONCRETE = 0 WFRP = BWB + 2*((I*THICK) + (THICK/2))*TAN(WEBANGLE) QLFLANGE = QLFLANGE + ABS(THICK*WFRP*NEF*((I*THICK)-YBAR)) NEFLF = NEF ELSEIF ((I*THICK) + (THICK/2) >= TFLANGEPILE .and. (I*THICK) + (THICK/2) < (DPILE - TFLANGEPILE)) THEN !If we are looking at a layer within the web WCONCRETE = (BWB - 2*TWEBPILE/COS(WEBANGLE)) + 2*((I*THICK) + (THICK/2))*TAN(WEBANGLE)-BVOID WFRP = 2*TWEBPILE/COS(WEBANGLE) ELSEIF ((I*THICK) + (THICK/2) >= (DPILE - TFLANGEPILE) .and. (I*THICK) + (THICK/2) < DPILE) THEN !If we are looking at a layer within the upper flange of the FRP sheetpile section WCONCRETE = (BWB - 2*TWEBPILE/COS(WEBANGLE)) + 2*((I*THICK) + (THICK/2))*TAN(WEBANGLE)-BVOID WFRP = ((PILEWIDTH - BWT) + 2*TWEBPILE/COS(WEBANGLE)) - 2*((I*THICK) + (THICK/2) - (DPILE - TFLANGEPILE))*TAN(WEBANGLE) ELSEIF ((I*THICK) + (THICK/2) >= DPILE) THEN !If we are looking at a layer within the concrete slab WCONCRETE = BF WFRP = 0 QSLAB = QSLAB + ABS(THICK*WCONCRETE*NEC*((I*THICK)-YBAR)) ENDIF QFRP = QFRP + ABS(THICK*WFRP*NEF*((I*THICK)-YBAR)) IXXT = IXXT + ABS(THICK*WCONCRETE*NEC*(((I*THICK)-YBAR)**2)) + ABS(THICK*WFRP*NEF*(((I*THICK)-YBAR)**2)) SUMFORCE = SUMFORCE + THICK*((WCONCRETE*STRESSC) + (WFRP*STRESSF)) FRPFORCE = FRPFORCE + THICK*WFRP*STRESSF

M = M - ((I*THICK) + (THICK/2))*THICK*((WCONCRETE*STRESSC) + (WFRP*STRESSF)) ENDDO CURV = TSTRAIN / YBAR IF (SUMFORCE < 0) THEN D1 = YBAR YBAR = (YBAR + D2) / 2 ELSEIF (SUMFORCE > 0) THEN D2 = YBAR YBAR = (YBAR + D1) / 2 ELSE EXIT ENDIF ENDDO IF (M > MR) THEN MR = M ENDIF V = M/A LOAD = V*2 FBONDSLAB = V*QSLAB/(IXXT*PILEWIDTH) FBONDWEBAVG = (V*QFRP/IXXT - (WLFINSIDE - BVOID)*V*QLFLANGE/(IXXT*((2*TWEBPILE/COS(WEBANGLE)) + (WLFINSIDE - BVOID))))/((WLFINSIDE - BVOID) + 2*((DPILE - TFLANGEPILE)/COS(WEBANGLE))) FBONDBOTTOM = V*QLFLANGE/(IXXT*((2*TWEBPILE/COS(WEBANGLE)) + (WLFINSIDE - BVOID))) FBONDWEB = 2*FBONDWEBAVG - FBONDBOTTOM FBONDBOTTOMULT = V*QFRP/(IXXT*(WLFINSIDE - BVOID)) IF (FBONDSLAB >= BONDSTRENGTH .and. BONDFAILURE1 == 10**10) THEN BONDFAILURE1 = LOAD ENDIF IF (FBONDBOTTOM >= BONDSTRENGTH .and. BONDFAILURE3 == 10**10) THEN BONDFAILURE3 = LOAD ENDIF WRITE (1,175) M, CURV, TSTRAIN, CSTRAIN, YBAR, LOAD, FBONDSLAB, FBONDBOTTOM, FBONDBOTTOMULT 175 format (f25.13,",",f25.13, ",", f25.13, ",", f25.13, ",", f25.13, ",", f25.13, ",", f25.13, ",", f25.13, ",", f25.13) CSTRAIN = CSTRAIN - 0.00001 ENDDO WRITE (1,200) "Mr", MR 200 format (A2,",", f25.13) WRITE (1,250) "Bond Failure Load 1", BONDFAILURE1 250 format (A19,",", f25.13) ENDPROGRAM SHEETPILEHYBRIDZONE1
201