pulsed thz interrogation of sofi with knit … · pulsed thz interrogation of sofi with knit lines...
TRANSCRIPT
PULSED THZ INTERROGATION OF SOFI WITH KNITLINES IN 2D
H. T. Banks1, N. L. Gibson1, and W. P. Winfree2
1Center for Research and Scientific Computation, Box 8205,North Carolina State University, Raleigh, NC 27606-8205
2NASA Langley Research Center, MS 231, Hampton, VA23681-2199
ABSTRACT. This paper examines the scattering effect of knit lines and voids inSOFI through simulations of THz interrogation at normal and non-normal angles ofincidence and using focused and non-focused single-cycle plane waves. We modelthe electromagnetic field using the TE mode of the 2D Maxwell’s equations reducedto a wave equation, which are then solved with a finite-element time-domain method.The knit lines are modeled by changing the dielectric constant.
Keywords: THz interrogation, SOFI, knit lines, FEM, time domain.PACS: 41.20.Jb, 02.60.Cb, 02.70.Dh
INTRODUCTION
Pulsed THz frequency waves have been shown to be particularly useful forthe detection of voids in the Sprayed on Foam Insulation (SOFI) used on theSpace Shuttle’s Thermal Protection System (TPS) [1]. However, the mod-eling of the propagation of a THz pulse inside of a material which exhibitsheterogeneous micro-structures of sizes that are on the order of the wavelength of the interrogating field is not straight-forward. Additionally, dataon the dielectric properties of low density foam in the THz regime is rathersparse. Initial efforts to remedy this deficiency can be found in [2].
As discussed in [3], usual approaches to THz interrogation of SOFI gen-erally employ signal processing techniques (for example, see [4]), which donot take advantage of much of the information contained in the reflecteddata signal. A physics based model may be able to more accurately describedefects [5].
Previous efforts ([5, 6]) investigated the application of polarization mech-anisms to account for the attenuation of wave propagation in foam, but

matching the simulations to experimental data has yet to be completelysuccessful. While these models were expressed in only one spatial dimen-sion, the 2D formulation in [3] allowed for non-normally incident anglesand curved interfaces. Further, by allowing the dielectric constant to bepiecewise-constant, layers of differing densities can be modeled explicitly.
SOFI is applied in layers, producing interfaces between layers that haveincreased density (called “knit lines”) which scatter the interrogating wave-form. As the knit lines are generally on the order of .5 mm thick, they arefrequently ignored in simulations. But, as there may be as many as 20 knitlines in a typical 20cm block of foam, the aggregate effect on the interrogat-ing signal can be significant. This paper describes our efforts to understandand quantify the scattering mechanisms, as well as to minimize their effectsby the use of focusing and/or altering the angle of incidence. We considerthe scattering of a THz plane wave off of the knit lines, modeled as layersof increased density, and voids, modeled as pockets of no density, inside ablock of low density polyurethane foam.
An outline of the paper is as follows. First we present the particular formof Maxwell’s equations we use to model the 2D electromagnetic interro-gation problem for foam. Then an experimentally based approach for esti-mating the material parameters for use in the system is described. We nextbriefly report on our numerical techniques for solving the resulting system.Finally we present simulations for cases in which the angle of incidence isaltered, and the plane wave is focused to a point.
A SIMPLIFIED MATHEMATICAL MODEL
For the computational domain we take a rectangular region 0 ≤ x ≤ 0.1 mand 0 ≤ y ≤ 0.2 m. Figure 1 shows a schematic region containing a materialwith knit lines (represented by dashed lines) 1mm from each other, eachparallel to an approaching plane wave, and perpendicular to the directionof propagation. The regions between knit lines consist of a low densitymaterial, and the elliptical pocket (void) is modeled as having zero density.The far right boundary (y = 0.2) is assumed to be metallic, and thereforesupra-conducting, thus simulating the aluminum backing of the SOFI on theshuttle external tank. A vacuum is present to the left of the material in whichthe interrogating field will be generated.
2

FIGURE 1: Schematic of a plane wave approaching a domain containing knit lines and anelliptical void. Dashed lines represent knit lines, dot-dash is foam/air interface. Ellipticalpocket (5 mm wide) between knit lines is a void modeled by n = 1. “+” marks the signalreceiver. Back wall is perfect conductor.
We combine the TE mode of the two dimensional Maxwell’s equationsinto one equation
ε(~x)∂2E
∂t(t, ~x) + ∇ ·
(
1
µ(~x)∇E(t, ~x)
)
= −∂Js
∂t(t, ~x), (1)
where ε(~x) and µ(~x) are the spatially dependent dielectric permittivity andpermeability, respectively. The corresponding speed of propagation is
c(~x) =c0
n(~x)=
√
1
ε(~x)µ(~x),
where c0 is the speed in a vacuum.For our source current, Js, we want to simulate a windowed pulse, in this
case a pulse that is allowed to oscillate for one half of one period and thenis truncated. Although generators produce a curved, sometimes sphericalwave, we assume the target is sufficiently far from the generator (approxi-mately 6”) so that the wave is essentially planar when it reaches our domainof interest. Thus, we want the pulse to originate at x = 0, the beginning of
3

our computation domain, which we model as a delta distribution centered atx = 0. In order to have a smooth source we use a function of the form
Js(t, ~x) = δ(x)e−((t−t0)/t0)b
, (2)
where t0 = tf/4 when tf is the period of the interrogating pulse. For exam-ple, if the frequency is f = .2THz, then tf = 1/f = 1 × 10⁻¹¹s. A typicalvalue for the exponent is b = 4.
Boundary/Initial Conditions
To model a metallic backing behind the foam, we use reflecting (Dirichlet)boundary conditions
[E]x=0.1 = 0.
In order to have a finite computational domain, we impose first order ab-sorbing boundary conditions at x = 0, which are modeled as
∂E
∂t− c(~x)
∂E
∂x
∣
∣
∣
∣
x=0
= 0.
With these boundary conditions, ideally a normally incident signal passesout of the computational domain, and does not return, i.e., we force it tobe absorbed by the boundary. Note that for signals that are incident at anangle, some reflection occurs. Lastly, to allow for propagation along the topand bottom boundaries (y = 0 and y = 0.2), we use insulating boundaryconditions
[
∂E
∂y
]
y=0
= 0,
[
∂E
∂y
]
y=0.2
= 0.
Also we assume zero initial conditions, i.e.,
E(0, ~x) = 0, E(0, ~x) = 0.
Modeling Knit Lines
The speed of propagation in the domain is given by
c(~x) =c0
n(~x)=
√
1
ε(~x)µ0,
4

where c0 is the speed in a vacuum and n is the index of refraction. Wemodel knit lines by changing the index of refraction, thus effectively thespeed, in that region. In order to model the speed of wave propagationin the knit lines versus the material surrounding them, we need to be ableto distinguish between the respective indices of refraction, i.e., n1 in thelow density region, and n2 in the higher density knit line. Further, we cancurrently only measure the effective index of refraction of the compositematerial, ne, which is done by computing the “time of flight” in experiments.Thus we need to relate these three indices to each other in order to haveaccurate estimates for the propagation speed in each region, to use in thesimulations.
Experiments have suggested, via time-of-flight measurements, a valuefor the effective index of refraction as ne = 1.03225±0.001. To estimate theindex of refraction for foam in the absence of knit lines, blocks of 5cm×5cmblocks of foam with varying numbers of knit lines layers (between 3 and7, approximated to the nearest .25) were produced and interrogated. Bycalculating the velocity of the pulse in these blocks we may extrapolate thedata to the case of zero knit line layers. Figure 2 displays the data collectedin the experiment.
A line of best fit, computed using linear regression, is plotted in Figure 2with error bars of two standard deviations. The range of values correspond-ing to zero knit lines is the estimate for the velocity of the pulse in a region offoam without knit lines. The mean value in this region is 2.94638× 10⁸m/sresulting in an index of refraction for the low density region of n1 = 1.0172.Using ne = (1 − ν)n1 + νn2, where ν is the volume fraction of the knitline region in the foam block. The volume fraction ν can be estimated bynoting the thickness of each knit line divided by the period in which the knitlines occur. Assuming 0.5mm knit lines in each 1cm of foam correspondsto ν = .05. This gives the index in the knit line as n2 = 1.1869.
In [3], the effective index of refraction ne was approximated via the clas-sical Claussius-Mossotti equation (for instance, see [7] and [8]), by assum-ing the total polarizability is the sum of the two polarizabilities in each partof the material. The index of refraction in each part of the foam was esti-
5

0 1 2 3 4 5 6 72.9
2.91
2.92
2.93
2.94
2.95
2.96x 10⁸
Number of knit lines
Velo
city
(m/s
)
FIGURE 2: Experimental data for the velocity of a THz pulse versus the number of knitlines, with the line of best fit from applying linear regression. The error bars represent twostandard deviations; the “X” denotes the Claussius-Mossotti estimate.
mated to be
n1 = 1.01398, (3)n2 = 1.03507. (4)
This value is plotted as an “X” in Figure 2, and is within the range of theerror bars of the linear regression estimate.
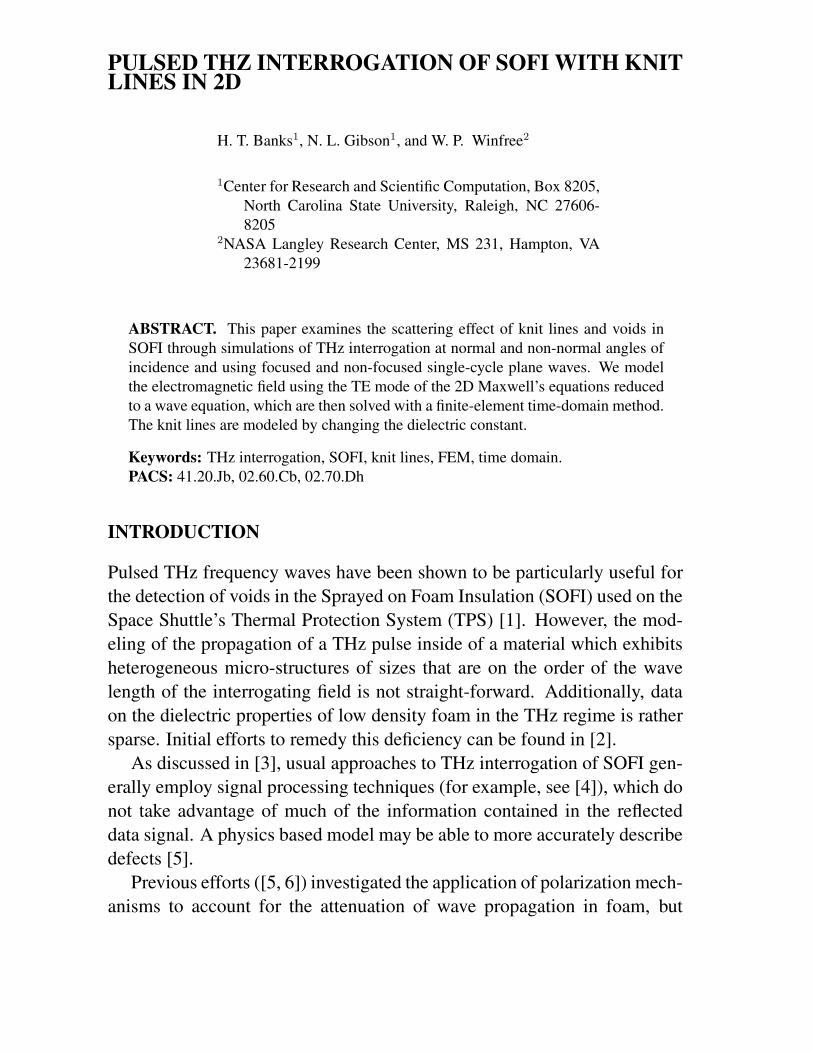
Although the experimental result agrees well with the theoretical esti-mate, it is clear from the scattered nature of the data points in Figure 2 thatthe correlation between the number of knit lines and the velocity is not per-fectly linear. The plot in Figure 3 shows that this is mainly due to the ratherimprecise relationship between the density and the number of knit lines.The symbol in the plot denotes the frequency (number of occurrences) ofdata point. The solid line again represents a line of best fit. Only one mea-surement of the density is beyond two standard deviations from the mean,but many are outside of one standard deviation. Better techniques in esti-mating the number of knit lines in a block of foam may result in densitydata more closely linearly related to the number of knit lines, and thereforea more precise estimate of the density for foam in the limit of zero knit lines.
6
0 1 2 3 4 5 6 70.025
0.03
0.035
0.04
0.045
0.05
0.055
0.06
Number of knit lines
Dens
ity (g
/cm
3 )
12345678
FIGURE 3: Experimental data for the density of a 5cm× 5cm block versus the number ofknit lines, with the line of best fit from applying linear regression. The error bars representtwo standard deviations; the symbol denotes the frequency (occurrence) of each data pointpresent.
NUMERICAL METHOD
We employ a (second order) Finite Element method using standard lineartwo dimensional (Q1) basis elements to spatially discretize the model de-scribed by (1). This results in nine-banded mass and stiffness matrices, Mand S. We also have a contribution from absorbing boundaries which wedenote with B. Thus our semi-discrete system for the vector of electric fieldvalues e is
Me + Be + Se = f.
Here we have absorbed coefficients 1c2 and 1
c into the definitions of M andB, respectively.
For the time derivatives we use second order discretizations (centereddifferences) for both the first and second derivatives. After collecting allterms involving the updated time step into the left hand side of the equation
7

we have the following linear system
Aen+1 = b, (5)
where A contains multiples of M and B, and b depends on en and en−1, aswell as S and f .
As discussed in [3], a mass-lumping approach, using a quadrature ruleapplied to the basis functions, is most efficient for solving the linear sys-tem (5) on each time step considering the length of time span required forpropagation problems of this type. LU factorization is limited by memoryconstraints for large problems, and iterative methods are restricted by com-putational time.
SIMULATIONS
We compute numerical simulations of an electromagnetic wave propagatingthrough a material described by its index of refraction, which determines thespeed of propagation. We consider the presence of a void similar to what isseen in SOFI when a layer does not completely fill a recess formed in theprevious layer. As the foam cures, an elliptical pocket of air is formed. Thevoid is modeled by taking its index of refraction to be that of free space,i.e., n0 = 1. The knit lines are modeled with index of refraction, n2, andthe surrounding low density regions are described by n1. Throughout thefollowing, the knit lines are described using the values estimated above bythe use of experimental data.
Plane Wave
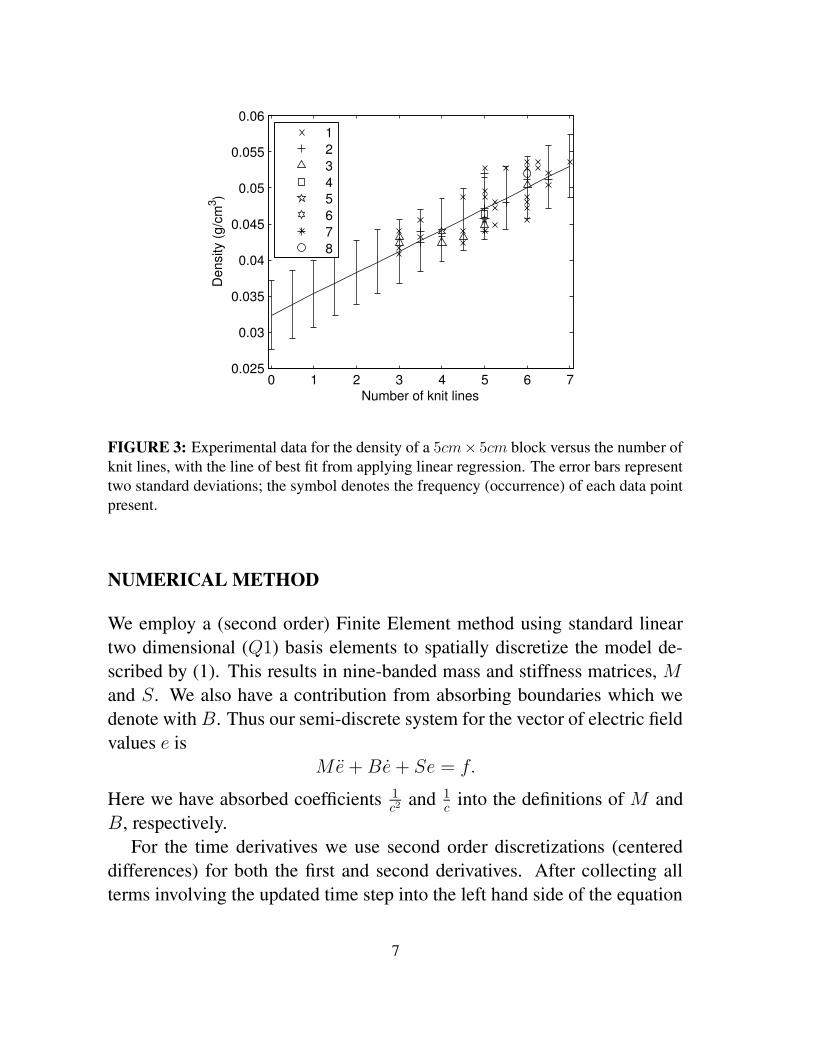
Figure 4 depicts snapshots in time of the propagation of a plane wave inci-dent on a void in the material. The cross denotes the location of the receiverto collect data. The reflection from the void is clearly seen in the thirdframe. This reflection expands out to form an oblong elliptical wave whicheventually returns to the receiver where the signal is recorded.
As the actual transceiver in the experimental setup is devised of a trans-mitter and receiver which do not occupy the same space (see Figure 5), thedirection of pulse propagation is at some non-normal angle to the plane ofthe foam and the metallic backing. The simulations of the scenario where
8
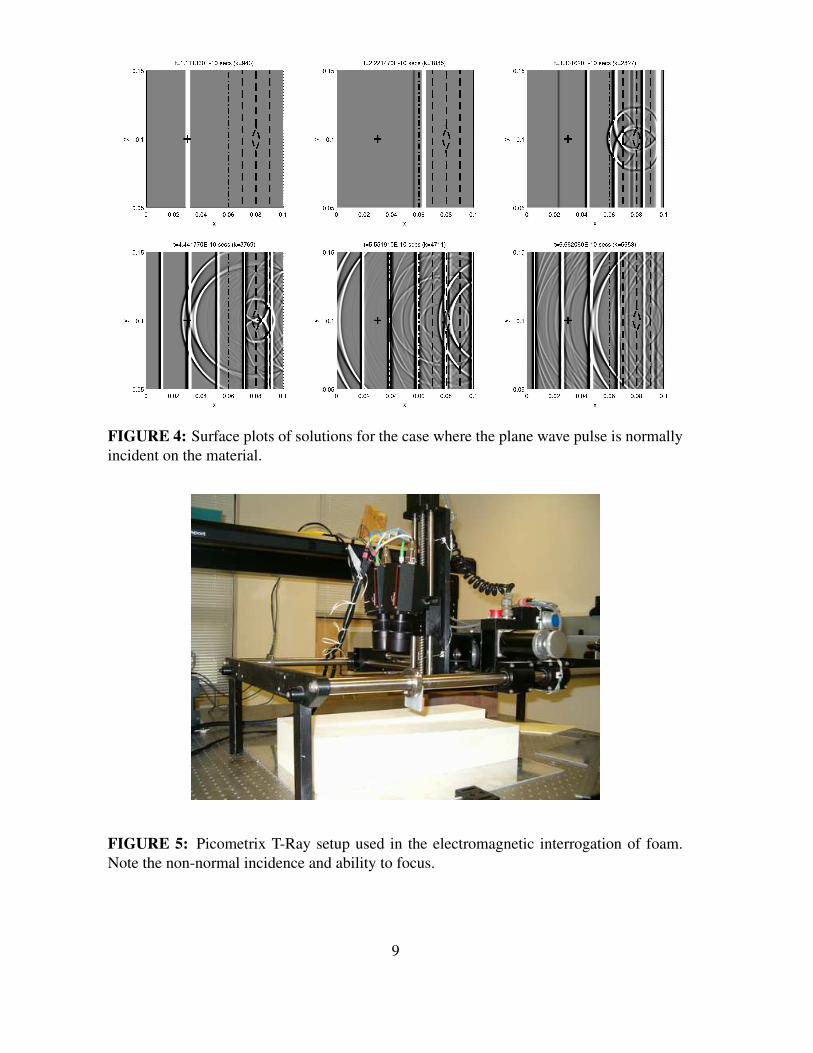
FIGURE 4: Surface plots of solutions for the case where the plane wave pulse is normallyincident on the material.
FIGURE 5: Picometrix T-Ray setup used in the electromagnetic interrogation of foam.Note the non-normal incidence and ability to focus.
9
the plane wave pulse is incident on the material at a non-normal angle aredisplayed in Figure 6. While the receiver still located at x = 0.03, it hasbeen raised in the y direction to collect the center of plane wave reflection.
FIGURE 6: Surface plots of solutions for the case where the plane wave pulse is non-normally incident on the material.
The plots in Figure 7 display the simulated data collected at the receiverfor normal and non-normal angles of incidence. In the plot the relative mag-nitude of the reflection versus the interrogating signal is apparent. The insetdisplays a plot of the magnification of the reflection from the void. There isa not a significant difference in the two reflections, only a slight timing dis-crepancy. Note that nearly all of original signal returns even with an obliqueangle of incidence.
Focused Wave
For a focused source we model the interrogating signal using scattered fieldformulation of point source reflected from elliptical mirror. Note that the topand bottom boundary conditions are now absorbing as we no longer have aplane wave propagating along these boundaries.
10

0.1 0.2 0.3 0.4 0.5 0.6−1
−0.5
0
0.5
1
t (ns)
E
Signal received at x=0.03
0.42 0.44 0.46 0.48
−0.1
0
0.1
0.1 0.2 0.3 0.4 0.5 0.6−1
−0.5
0
0.5
1
t (ns)
E
Signal received at x=0.03
0.42 0.44 0.46 0.48
−0.1
0
0.1
FIGURE 7: The left (right) plot displays the signal received at x = 0 on center line for thenormally (non-normally) incident plane wave case (the inset plot is a magnification of thereflection from the void).
Figure 8 displays snapshots in time of the simulated propagation of afocused wave incident on a void in the material. The reflection from thevoid is clearly seen in the second frame. This reflection expands out to forman oblong elliptical wave which eventually returns to the antenna where thesignal is recorded with a receiver.
The simulations of the scenario where the focused wave pulse is incidenton the material at a non-normal angle are displayed in Figure 9. The sourceis modeled using scattered field formulation of point source reflected fromelliptical mirror. The receiver is located at x = 0.03, but raised to collectcenter of the focused wave reflection.
The plots in Figure 10 give the simulated data collected at the receiverfor the focused wave incident at the two angles of incidence, respectively.The inset again displays a magnified plot of the reflection from the void.
There is a distinct difference in the structure of the two reflections. Inparticular, the front part of the void reflection is clearly more pronounced inthe normally incident case. This suggests that simulations which do not takethe proper angle of incidence into account may grossly over-exaggerate themagnitude of the reflection from the void. Note that the amplitude of thevoid reflections in both cases is larger than that of the plane wave scenario.Further, the difference between the reflection from the beginning of the voidis more distinct from the reflection off the back of the void for the focusedwave. As the energy from the interrogating wave is concentrated on the
11
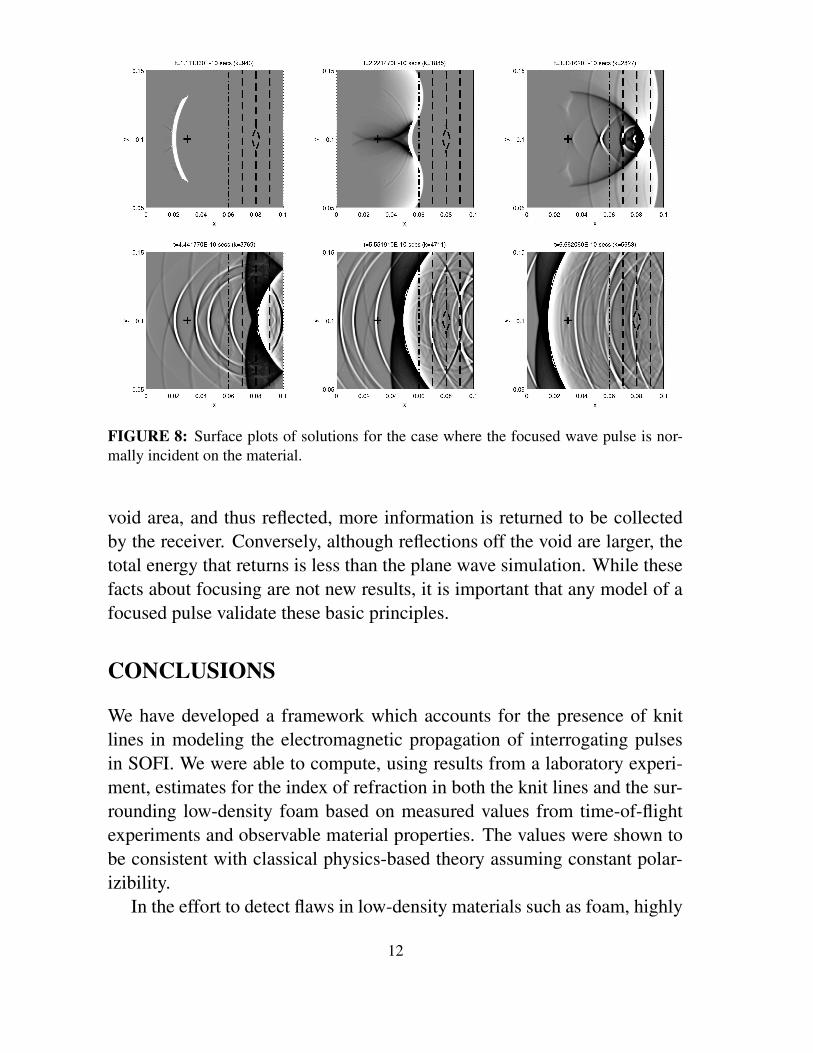
FIGURE 8: Surface plots of solutions for the case where the focused wave pulse is nor-mally incident on the material.
void area, and thus reflected, more information is returned to be collectedby the receiver. Conversely, although reflections off the void are larger, thetotal energy that returns is less than the plane wave simulation. While thesefacts about focusing are not new results, it is important that any model of afocused pulse validate these basic principles.
CONCLUSIONS
We have developed a framework which accounts for the presence of knitlines in modeling the electromagnetic propagation of interrogating pulsesin SOFI. We were able to compute, using results from a laboratory experi-ment, estimates for the index of refraction in both the knit lines and the sur-rounding low-density foam based on measured values from time-of-flightexperiments and observable material properties. The values were shown tobe consistent with classical physics-based theory assuming constant polar-izibility.
In the effort to detect flaws in low-density materials such as foam, highly
12
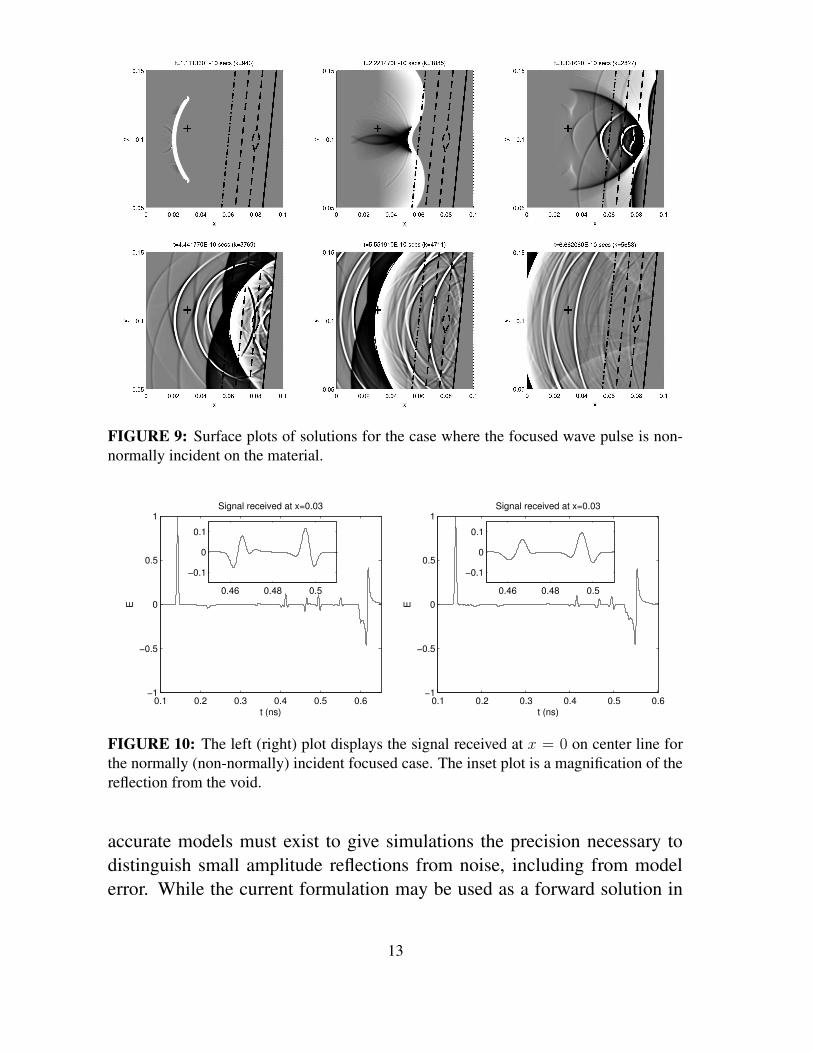
FIGURE 9: Surface plots of solutions for the case where the focused wave pulse is non-normally incident on the material.
0.1 0.2 0.3 0.4 0.5 0.6−1
−0.5
0
0.5
1
t (ns)
E
Signal received at x=0.03
0.46 0.48 0.5
−0.1
0
0.1
0.1 0.2 0.3 0.4 0.5 0.6−1
−0.5
0
0.5
1
t (ns)
E
Signal received at x=0.03
0.46 0.48 0.5
−0.1
0
0.1
FIGURE 10: The left (right) plot displays the signal received at x = 0 on center line forthe normally (non-normally) incident focused case. The inset plot is a magnification of thereflection from the void.
accurate models must exist to give simulations the precision necessary todistinguish small amplitude reflections from noise, including from modelerror. While the current formulation may be used as a forward solution in
13

an inverse problem context, it is likely that the highest value will lie in itsability to generate synthetic data with which to test faster signal processingapproaches to damage detection. Thus it can be used either to explore whichshapes of voids are the hardest to detect, or to generate data for scenariosthat are difficult or expensive to manufacture.
Our efforts here provide an approach to enhance the accuracy of a modelby making it more representative of the material in question and the sig-nal used to interrogate that material. The results themselves suggest thataccurate modeling of the angle of incidence is important to quantify theamplitude of the reflected signal, while modeling the focusing captures theclear distinction between the reflections from the front versus the back ofthe void.
Sufficient experimental results for comparison are difficult to obtain sincethe amplitude of reflections off of low density materials is very low to im-measurable using currently available power sources at the THz frequency.Therefore, the results of this paper should be considered as motivation forthe development of high power THz devices. For now, experimental infor-mation is collected from the aluminum reflection. More work needs to bedone to match simulations to this data, including adding attenuation, possi-bly via coupling Maxwell’s equations to a time domain model of a scatteringmechanism.
ACKNOWLEDGEMENTS
This research was supported in part by the U.S. Air Force Office of Sci-entific Research under grant AFOSR FA9550-04-1-0220 and in part by theNational Institute of Aerospace (NIA) and NASA under grant NIA/NCSU-03-01-2536-NC.
REFERENCES
[1] J. Xu, et. al., T-rays identify defects in insulating materials, Conferenceof Laser and Electro-Optics (CLEO) 2004, San Francisco, CA, May2004.
14
[2] G. Zhao, M. Mors, T. Wenckebach, and P. Planken, Terahertz dielectricproperties of polystyrene foam, J. Opt. Soc. Amer. B, vol. 19, pp. 1476-1476, 2002.
[3] H. T. Banks and N. L. Gibson, “Void detection in foam with knit linesusing THz pulse interrogation”, Tech. Rep. CRSC-TR06-05, Center forResearch in Scientific Computation, North Carolina State University,February 2006. To appear in Mathematical and Computer Modelling.
[4] H. Zhong, J. Xu, X. Xie, T. Yuan, R. Reightler, E. Madaras, and X.-C. Zhang, Nondestructive defect identification with terahertz time-of-flight tomography, IEEE Sensors Journal, vol. 5, 2, pp. 203-208, 2005.
[5] H. T. Banks, N. L. Gibson and W. P. Winfree, “Gap detection withelectromagnetic terahertz signals”, Nonlinear Analysis: Real WorldApplications 6, 381-416, 2005. Tech. Rep. CRSC-TR03-40, Center forResearch in Scientific Computation, North Carolina State University,September 2003.
[6] H. T. Banks and N. L. Gibson, “Inverse Problems InvolvingMaxwell’s Equations with a Distribution of Dielectric Parameters”,Tech. Rep. CRSC-TR05-29, Center for Research in Scientific Com-putation, North Carolina State University, July 2005. To appear in theQuarterly of Applied Mathematics.
[7] P. Wang, A. Beck, W. K orner, H. Scheller, and J. Fricke, “Densityand refractive index of silica aerogels after low- and high-temperaturesupercritical drying and thermal treatment”, J. Phys. D: Appl. Phys. 27,pp. 414-418, 1994.
[8] F. S. Solheim, J. Vivekanandan, R. H. Ware, and C. Rocken, “Pro-pogation delays induced in GPS signals by dry air, water vapor, hy-drometeors, and other particulates”, J. Geophys. Res., vol. 104, D8,pp. 9663-9670, 1999.
15